






Abstract
Purpose:
To gain insight into client experiences with shelter or community care services for homeless people, homeless youth, and abused women and identify priority improvement areas.
Methods:
Seven hundred and forty-four clients rated their experiences and 116 clients rated the services’ importance.
Results:
Clients had most positive experiences with the client–worker relationship and least positive experiences with the results of services. Abused women’s service providers scored higher than homeless adults and youth service providers. Day and night shelters scored lowest, followed by crisis shelters, supported housing, and outreaching teams. The results of care have the highest need for quality improvement for homeless adults and youth.
Discussion:
Clients’ experiences with shelter and community care services in the Netherlands are generally positive, with a strong client–worker relationship forming the basis of good quality care. Monitoring outcomes and increasing the focus on results are integrated in recent approaches aimed at improving the quality of shelter care.
Introduction
In the current economic climate, homelessness continues to pose an important societal challenge (Frazer & Marlier, 2009; Levy & Sidel, 2009). In the Netherlands, the number of clients making use of shelter or community care services (from here referred to as services) for the homeless rose from nearly 50,000 in 2009 to more than 60,000 in 2013 (Federatie Opvang, 2011, 2012, 2014). Around 6,000 of these clients were between the ages of 15 and 23 and are officially defined as “homeless youth” (Federatie Opvang, 2014; Ministerie van Volksgezondheid, Welzijn en Sport, 2011b, 2011c). Adult clients often become homeless due to relationship problems, divorce, and home evictions or end up homeless after leaving prison or a psychiatric hospital. Youth most often become homeless as a result of leaving their home due to conflicts with parents or guardians (Tuynman & Planije, 2013). Homeless persons commonly deal with a multitude of problems, such as substance abuse, addiction, debts, severe mental health problems, and physical problems (Tuynman & Planije, 2013). At the same time, each year over 10,000 women in the Netherlands flee from a violent home situation to women’s shelters, bringing with them more than 5,000 children (Federatie Opvang, 2011). These women often deal with psychosocial and relationship problems as well as physical problems, also as a result of physical, mental, and/or sexual violence (Wolf, Jonker, Meertens, & Te Pas, 2006).
In the past few years, many governments in developed countries focus on offering appropriate shelter services aimed at reintegrating homeless people in society, rather than merely offering short-term physical shelter (American Recovery and Reinvestment Act: Public Law 111-5, 2009; Ministerie van Volksgezondheid, Welzijn en Sport, 2011a). A similar focus is applied to shelter services for women fleeing domestic violence, where the goal is to make a start with building a new, violence-free life (Jonker, Sijbrandij, & Wolf, 2012; Ministerie van Veiligheid en Justitie, 2010; Tuynman & Planije, 2013). In the Netherlands, several types of shelter services are offered, ranging from more short-term and low-threshold crisis shelter services to longer term residential services and supported housing. Depending on the municipality, there can be comparable but separate shelter services for homeless youth (Ministerie van Volksgezondheid, Welzijn en Sport, 2011c). Some municipalities also make use of outreach teams targeting homeless youth (Tuynman & Planije, 2013).
Despite the societal and academic interest in dealing with the problem of homelessness (Lorber, 2009) and intimate partner violence (Waltermaurer, 2006), there are very few studies on how clients themselves experience the services they receive (Spiro, Dekel, & Peled, 2009; Wolf, Luijtelaar, Jansen, & Altena, 2007). The few studies on client satisfaction among homeless people and youth were mostly conducted in the United States, with instruments that were often not specifically designed for or tailored to the target population (Calsyn, Morse, Klinkenberg, Yonker, & Trusty, 2002; Kasprow, Frisman, & Rosenheck, 1999; Klinkenberg, Calsyn, & Morse, 1998). Studies among homeless youth found high levels of overall satisfaction in general, but there were differences between the types of services (Altena, Beijersbergen, & Wolf, 2014). Satisfaction was consistently found to be high for client–worker relationships, which has been significantly associated with overall satisfaction (Altena et al., 2014). Similarly, there is a lack of internationally published studies on the experiences of abused women in shelters (Attala & Warmington, 1996; Bennett, Riger, Schewe, Howard, & Wasco, 2004; Itzhaky & Porat, 2005).
In order for care services to become more client-oriented, it is important to include the client’s own perspective in quality assessments (Damman, Hendriks, & Sixma, 2009). Since 1996, service providers offering services for homeless people, homeless youth, and abused women in the Netherlands are obligated to measure their clients’ satisfaction with the care they receive to facilitate both external accountability and internal quality control (Wet maatschappelijke ondersteuning [Social Support Act], 351, 2006). However, due to the absence of valid, standardized measurement instruments specifically tailored to this particular group and setting, comparisons of outcomes between shelter services providers could not be made (Wolf et al., 2007). In 2010, a unique instrument called the Consumer Quality Index for Shelter and Community Care Services (CQI-SCCS; Beijersbergen, Asmoredjo, Christians, & Wolf, 2015; Beijersbergen, Christians, Asmoredjo, & Wolf, 2010) was developed to fill this gap.
Since 2006, CQI-SCCS questionnaires are developed and used in a standardized way to measure and compare client experiences with health-care and care services in the Netherlands (Damman et al., 2009), following the shift in focus in research on clients’ perspectives on care in the last decade (Davies & Cleary, 2005). Rather than looking at clients’ satisfaction, it focuses on specific experiences clients have with different aspects of (health) care, allowing for more objective information on service providers and more precise quality improvement information (Hopman, de Boer, & Rademakers, 2011). The CQI-SCCS was developed in close cooperation with clients, client advocacy groups, and shelter workers as well as with key stakeholders in shelter and community care management, academia, and local and national government. The instrument measures experiences clients have with the client–worker relationship, the quality of the services received, the results of these services, and the living conditions in the shelters.
The first objective of this study was to gain insight into the experiences of clients with services for homeless people, homeless youth, and abused women offered by service providers throughout the Netherlands. The second objective was to identify priority areas for quality improvement for each of the three target groups, by combining clients’ self-reported experiences with those aspects of care that clients themselves consider most important. This method gives a good impression of which aspects of quality of care are most eligible for quality improvement (Damman et al., 2009). The third aim was to determine whether there were quality differences between service providers and to what extent these differences could be explained by the targeted group and the type of services the service provider offered. The term “service provider” here refers to a specific location or facility providing a specific type of care aimed at one of the three target groups.
Method
Data Collection
Data were collected between March and August 2009. Approximately 20 service providers per target group were selected using a stratified sampling procedure, whereby a list of all registered service providers in the Netherlands was stratified by the type of service (e.g., crisis, residential, day or night, supported housing, and outreach) and region. Inclusion criteria for service providers were (1) capacity over 14 clients and (2) offers not only highly specialized care, such as services for drug abusers only. By excluding service providers with a capacity of less than 15 clients, results could not be traced back to individual clients. All clients were informed in advance about the research through workers, posters, information sheets, and flyers.
Clients were asked to complete a CQI-SCCS questionnaire during an organized group meeting at the location of their service provider. A trained interviewer was present during the meeting to inform clients about the study before filling out the questionnaire and for assistance. Questionnaires were available in Dutch, English, French, Turkish, and Arabic, and if necessary, an interpreter assisted. When organizing meetings proved problematic, workers were instructed to distribute the questionnaires among their clients. All respondents received a 10 euro gift certificate or cash as incentive. For those clients who did not want to fill out the questionnaire, some background data were gathered in order to perform nonresponse analyses. Clients up to the age of 25 receiving specialized services for homeless youth are characterized in this study as the homeless youth group.
In this study, we followed all the guidelines for experimental investigations with human subjects required by our institution. Due to the fact that we are bound to the code “Goed Gedrag/Goed Gebruik (Code Good Conduct/Good Use), we are obliged to fully protect the anonymity of the respondents who participated in this study. As this study is an observational (i.e., nonintrusive) study, we were not required to file an application with the institutional review board. Still, before we started this study, the different organizations gave us their oral permission to conduct this study within their organizations.
Instrument
Two versions of the CQI-SCCS were distributed, depending on whether clients received community care (e.g., supported housing and outreach teams) or residential shelter care (e.g., crisis shelters, residential services, and day or night services). The shelter care version had an additional 10 questions on the quality of the shelter facilities. The instrument therefore consists of 42 items for community care clients and 52 items for shelter care clients, of which, respectively, 26 and 36 items measure client experiences. Four scales measure client experiences on the following quality aspects: Client–worker relationship (4 items): For example, does the client feel like he or she is taken seriously? Services received (10 items): For example, are workers accessible when needed and are clients’ wishes taken into account? Results of services (5 items): Is the client able to deal better with people and situations as a result of the support? Living conditions (only for residential clients; 6 items): Do clients have enough privacy and do care workers act when unpleasant situations arise?
Most items have a 4-point rating scale (1 = never, 2 = sometimes, 3 = usually, 4 = always); 3 items have a dichotomous (“yes” or “no”) answer category. Respondents are also asked to give an overall grade from 0 to 10 rating to the services they receive. The CQI-SCCS scales have good internal consistency, with Cronbach’s αs ranging from 0.77 to 0.90 for the total sample. For the three subgroups, Cronbach’s α was also high for all scales, namely, 0.79–0.90 for the homeless adult group, 0.77–0.91 for the homeless youth group, and 0.72–0.89 for the abused women group. Furthermore, the CQI-SCCS has good test–retest reliability (0.67 for both the client–worker relationship and the services received scales, 0.62 for the living conditions scale, and 0.52 for the results of services scale) and construct validity (0.55–0.66 in all subgroups using the Mental Health Care Thermometer) and has been found to be useful for discerning priority areas for quality improvement and performing benchmark studies for homeless people and youth (for more details about the CQI-SCCS, see Beijersbergen et al., 2010, 2015).
Every sixth respondent received a CQI-SCCS importance questionnaire, instead of a regular experience questionnaire. The importance questionnaire consists of the same items as the experience questionnaire but asks how important respondents rate the aspects of services, instead of how they experienced the quality of these aspects. The importance questionnaire also uses a 4-point rating scale (1 = not important, 2 = fairly important, 3 = important, 4 = extremely important).
Participants
Of the 848 clients who were asked to complete the experience CQI instruments, 762 completed the questionnaire. After data cleaning according to the guidelines for CQI instruments (Sixma, Hendriks, de Boer, & Delnoij, 2008), 744 (88%) respondents were included in the analyses. Descriptive statistics for the background variables of the respondents are presented in Table 1. The 744 respondents received services from 18 service providers for homeless people (37%), 18 service providers for homeless youth (29%), and 24 service providers for abused women (34%). Types of service providers were crisis shelters (19%), residential services (38%), day or night shelters (10%), supported housing (22%), and outreach services for homeless youth (11%).
Descriptive Statistics Background Variables for Total Group and Subgroups.

aA person is considered roofless (“Feitelijk dakloos”) in the previous month if he or she mostly spent the night on the streets, night shelters, relatives, friends, or acquaintances, in the past 30 days.
Nonrespondents were 86 clients who did not want to fill in the questionnaire and an additional 18 who were taken out during data cleaning.
The importance questionnaire was completed by 116 respondents (37% homeless people, 28% homeless youth, and 35% abused women). This group was not significantly different from the 744 respondents who filled in the experience questionnaire when it comes to any of the background characteristics presented in Table 1.
Analyses
Average, unstandardized, experience scores were calculated per scale and target group as these scores give a good impression of the actual experiences of clients. Average importance scores were calculated per scale and per subgroup. Following the CQI guidelines (Sixma et al., 2008), quality improvement scores were calculated per scale and per subgroup by multiplying the proportion of respondents with negative experiences (answers 1 never or 2 sometimes) with the average importance score. The differences in average importance scores between subgroups were tested for each scale, using a one-way analysis of variance with Bonferroni post hoc tests. The difference in proportion of clients with a negative experience was tested using a Z test for proportions for independent groups.
In order to make meaningful comparisons in quality experiences between groups, multilevel analyses were performed, with individuals (Level 1) nested in service providers (Level 2). Dependent variables were the four scale scores and the overall grade. This method shows what part of the total variance in scores can be ascribed to differences between individuals and which part of the variance is due to the differences between service providers. In order to try to explain variance at the service provider level (Level 2), two characteristics of service providers were included as independent variables: which target group they catered for and what type of services they provided. Some individual background characteristics were also included as independent variables to control for their possible effect, namely, sex, age, education, immigrant parental background, and rooflessness in the previous month. The difference between this model and the empty model was tested using a likelihood ratio test.
Results
Client Experiences
Table 2 shows the average unstandardized scale scores and overall grade for all clients and each subgroup. A higher scale score reflects more positive experiences. The average overall grade (0–10) is 7.4. The client–worker relationship scale receives the highest score (3.32), followed by the services received scale (3.00) and living conditions scale (2.96). The scale scores for results of services are lowest (2.86). In all subgroups, the same pattern can be found when comparing average scale scores. It should be noted that the abused women group has significantly higher scale scores (M = 3.47, SD = .58; M = 3.13, SD = .61; M = 3.03, SD = .71; M = 3.12, SD = .55) than the homeless people group (M = 3.23, SD = .67; M = 2.90, SD = .66; M = 2.76, SD = .76; M = 2.87, SD = .62), t(523) = 4.28, p < .001, d = .38; t(523) = 4.13, p < .001, d = .36; t(517) = 4.12, p < .001, d = .36; t(429) = 4.45, p < .001, d = .43, and homeless youth group (M = 3.28, SD = .63; M = 2.96, SD = .66; M = 2.78, SD = .76; M = 2.87, SD = .57), t(466) = 3.41, p = .001, d = .32; t(466) = 2.90, p = .004, d = .27; t(460) = 3.64, p < .001, d = .34; t(325) = 3.93, p < .001, d = .45. The abused women group also gives a higher overall grade (M = 7.67, SD = 1.85) than the homeless people (M = 7.14, SD = 2.11), t(523) = 3.042, p = .002, d = .27, and homeless youth group (M = 7.27, SD = 1.91), t(466) = 2.309, p = .021, d = .21.
Average Unstandardized Scale Means and Overall Grade.

Quality Improvement Scores
Table 3 shows average importance scores (1–4), fraction of clients with a negative experience (i.e., who answered “never” or “sometimes”), and average quality improvement scores. In each subgroup, all scales received high average importance scores, ranging from 3.19 to 3.58 (where 3 is important and 4 is extremely important). The client–worker relationship scale receives the relatively highest importance scores, while the results of services scale receive the lowest. When comparing subgroups, the abused women group has significantly higher importance scores on the client–worker relationship (M = 3.58, SD = .49) and living conditions scale (M = 3.54, SD = .34) than the homeless people group (M = 3.32, SD = .52; M = 3.29, SD = .58), t(80) = 2.33, p = .02, d = .52; t(66) = 2.16, p = .03, d = .52. Furthermore, in the abused women group, there were significantly less clients who reported negative experiences on the results of services scale (27%), compared to the homeless people (38%) and homeless youth group (40%), z = 2.64, p = .008, r = .12; z = 2.94, p = .003, r = .14.
Fraction of Clients With Negative Experiences, Average Importance, and Quality Improvement Scores Per Scale and Subgroup.
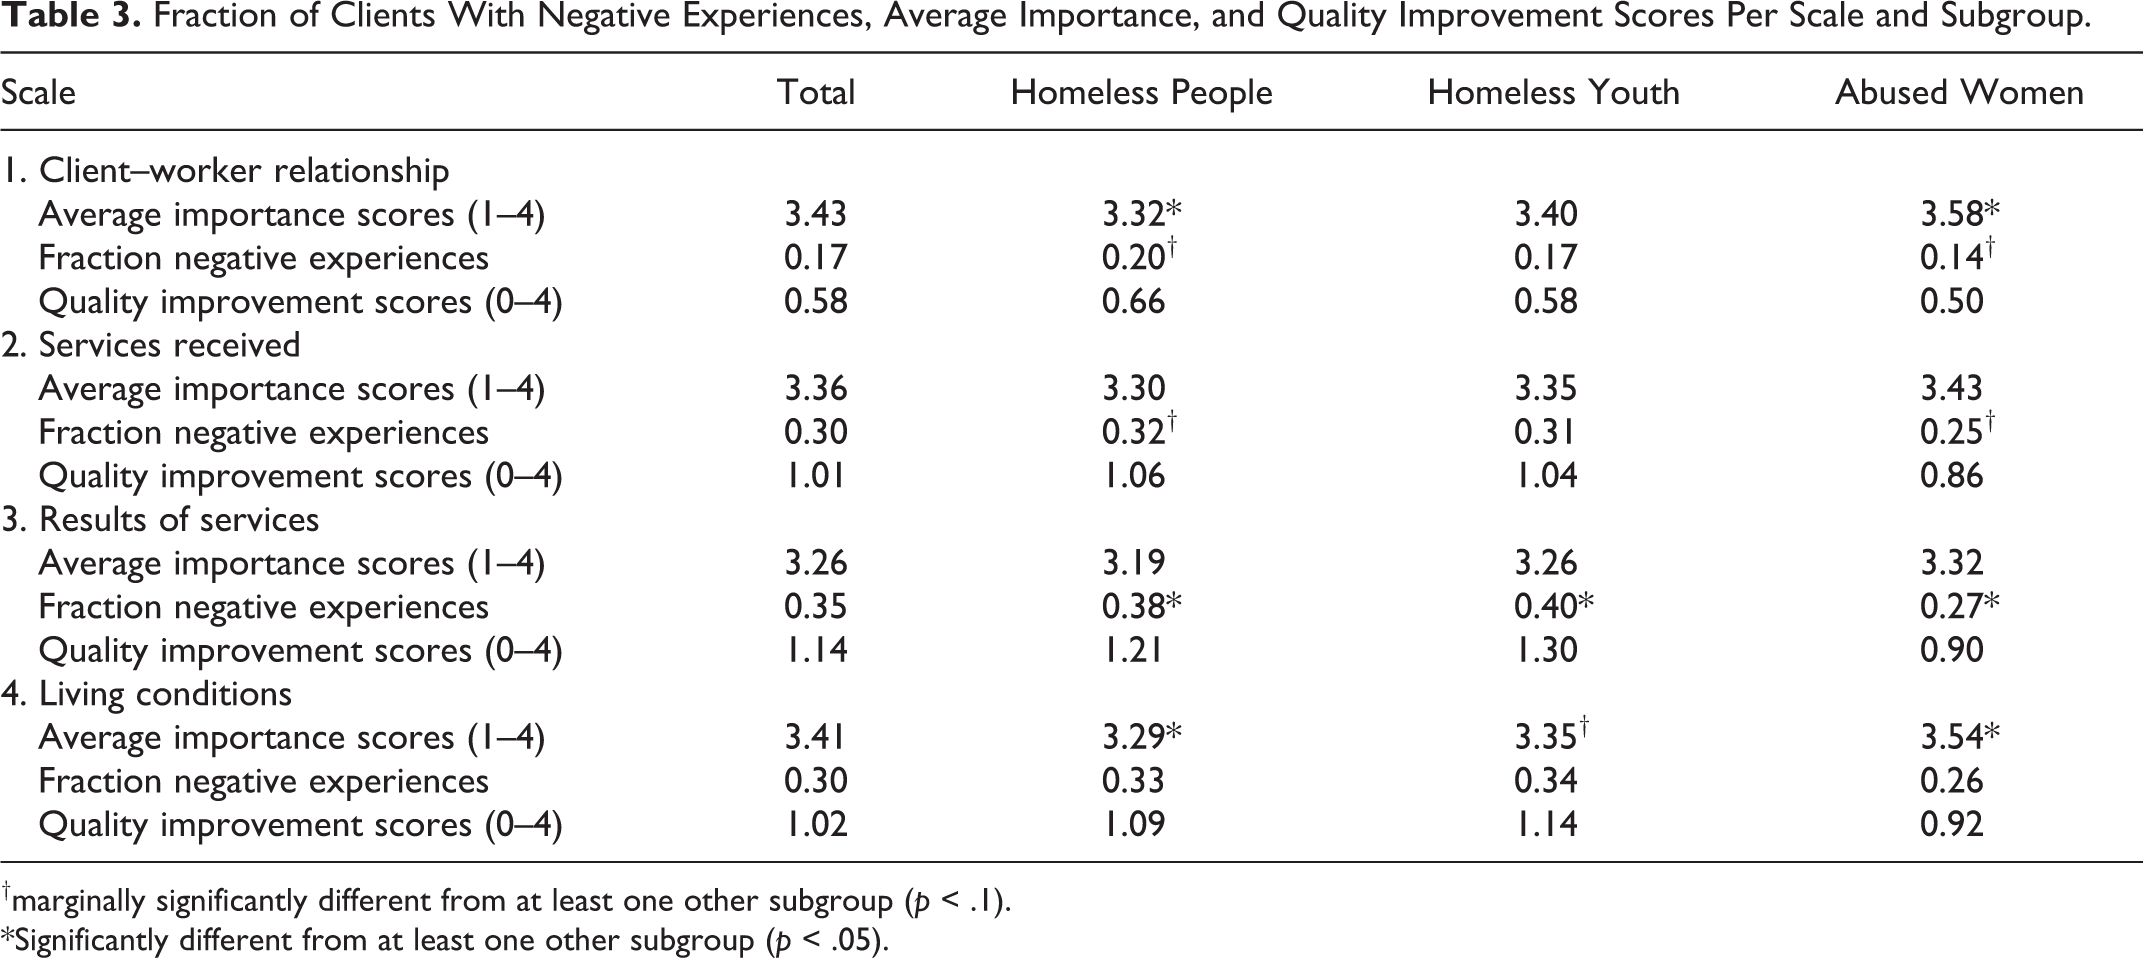
†marginally significantly different from at least one other subgroup (p < .1).
*Significantly different from at least one other subgroup (p < .05).
For all groups, the client–worker relationship clearly receives the lowest quality improvement score, due to the relatively small fraction of clients with negative experiences with this aspect of care. For the homeless people and homeless youth group, the highest quality improvement scores are found for the results of services scale, followed by the living conditions and the services received scales. For the abused women group, there were no clear differences in quality improvement scores between these three scales. Overall, the quality improvement scores for the abused women group were lower than for the homeless people and youth groups.
Quality Differences Between Service Providers
Table 4 shows the outcomes of the multilevel regression analyses. In the empty model, the variance between scale scores and overall grade is simply divided between the individual level (Level 1) and the service provider level (Level 2). The results of the empty model show that most of the variance (76–88%)—that is, the differences in individual scale scores and overall grades—can be attributed to differences between individuals (Level 1). This means that 12–24% of the variance can be attributed to differences between service providers.
Multilevel Regression Analyses Outcomes: Scale Scores and Overall Grade, With Individuals Nested in Service Providers.
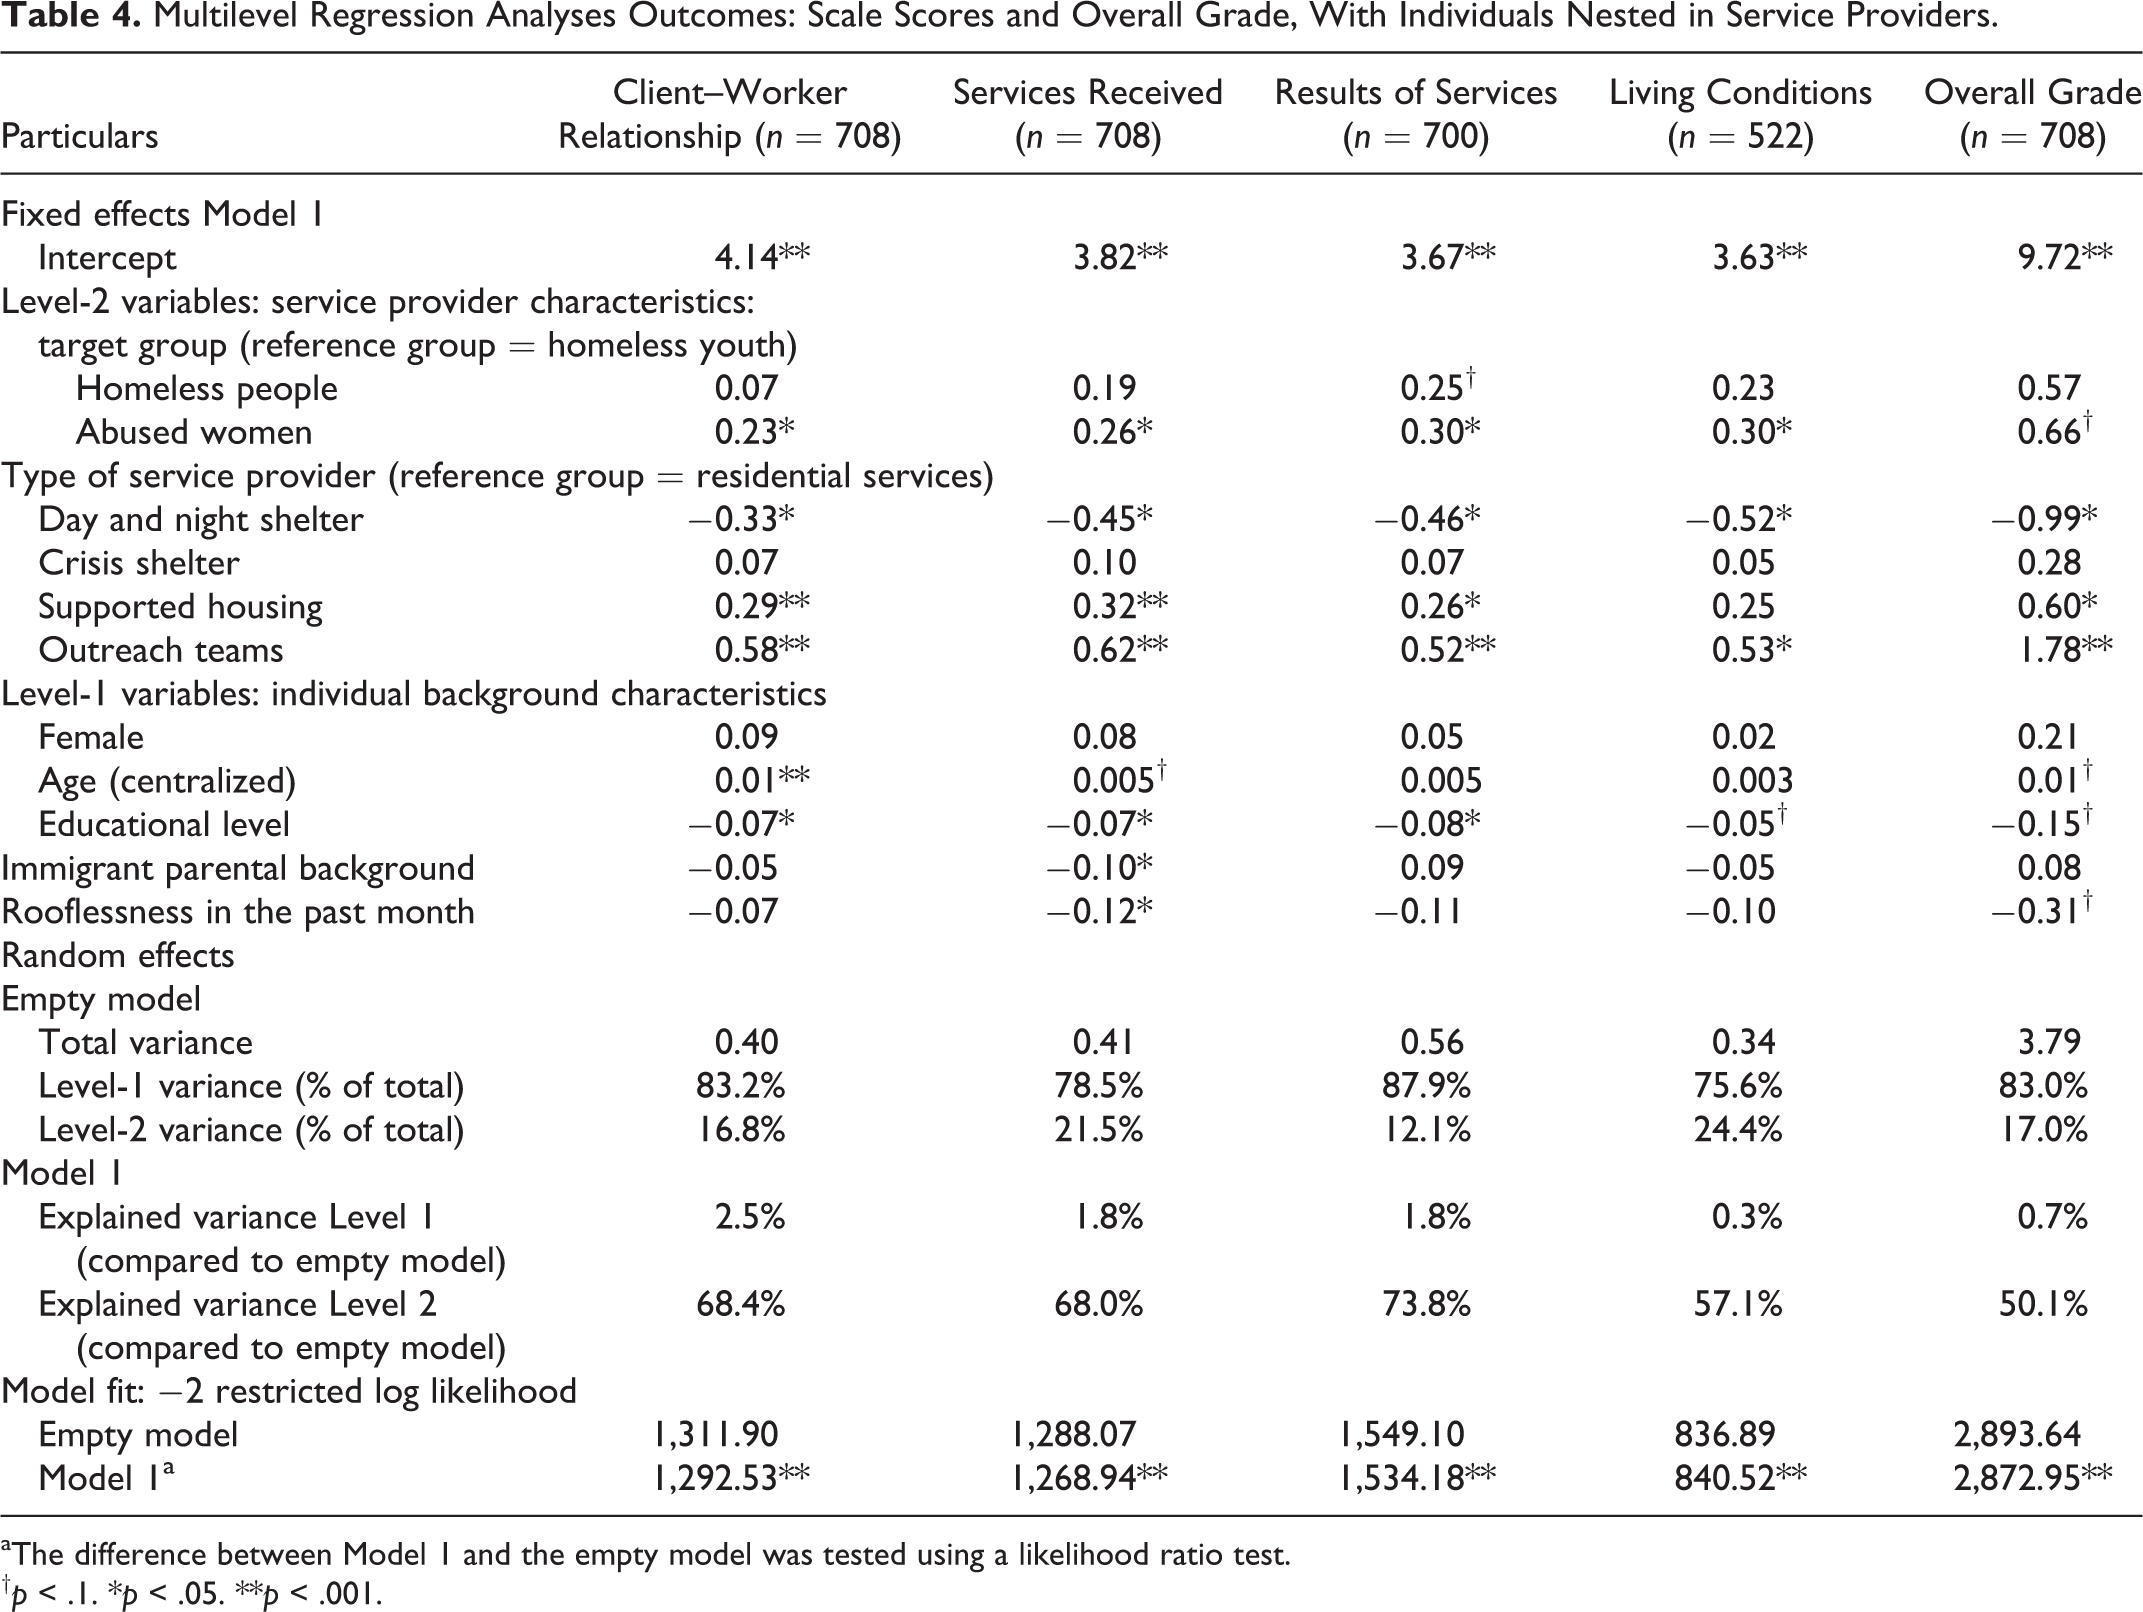
aThe difference between Model 1 and the empty model was tested using a likelihood ratio test.
† p < .1. *p < .05. **p < .001.
In order to try to explain the variance at the service provider level (Level 2), two characteristics of service providers were included as independent variables: which target group they catered for and what type of services they provided. Looking at the coefficients for the target group variables, the results show that service providers for homeless youth score consistently lower than service providers for both homeless people and abused women. However, only the difference between the homeless youth and abused women group is significant, with the exception of the overall grade. Looking at the coefficients for the type of service provider, another consistent pattern can be observed. Day or night shelter providers score consistently and significantly lower than all the other service providers, followed by residential shelter, crisis shelter, supported housing, and outreach teams. The substantial differences found between target groups and the type of service providers are also reflected in the high percentages of explained variance at the service provider level (Level 2): from as much as 50% for the overall grade to 74% for the results of services scale. This, in turn, also means that 26–50% of the Level-2 variance, that is, the differences between service providers, remains unexplained.
The individual background variables only explain a small part of the considerable variance at the individual level (Level 1): only 0.3–2.5%. Rooflessness in the previous month has a significant negative effect on the services received scores. Education has a slight negative effect (significant for client–worker relationship, services received, and results of services scale), while age has a minimal positive effect on scale scores (only significant for the client–worker relationship). Clients with an immigrant parental background score slightly, but significantly, lower on the services received scale.
Discussion and Applications to Practice
This study is unique as for the first time it gives an overall picture of the quality of services that are offered in the various types of shelters targeting different client groups throughout the Netherlands, from the viewpoint of the clients making use of these services. The results show that clients’ experiences are generally quite positive (mean overall grade 7.4 and average scale scores range from 2.8 to 3.5 on a 4-point scale).
Clients from all three target groups—homeless people, homeless youth, and abused women—report the most positive experiences with the client–worker relationship. This is very encouraging, considering that clients were also found to adhere most importance to this relationship, compared to the other aspects of shelter services. Since clients are already very positive about this area, this aspect of services has the least priority for improvement. The high importance clients adhere to the relationship with the professional is in accordance with findings from other CQI studies (Hopman et al., 2011) and other studies (Johansson, Oleni, & Fridlund, 2002; Kasprow et al., 1999; Roter, Hall, & Katz, 1987; Tamblyn et al., 1994; Wolf et al., 2007) on determinants of client and patient satisfaction, where trust and being treated with respect was one of the most important elements determining good quality of services. In the Netherlands, the client-professional relationship is the central element in the recently implemented strength-based methods in shelter and community care, called “Krachtwerk” (Strength Work; Wolf & Jansen, 2011).
The client–worker relationship and the living conditions in the shelter receive relatively high importance scores in the abused women group, compared to the homeless groups. This may reflect a greater need of abused women for a positive relationship in which they feel taken seriously, after fleeing an abusive situation in which the woman is also often socially isolated from other people (Wolf et al., 2006). The relatively high importance the abused women group attribute to living conditions in the shelter may partly be explained by the fact that many women have relatively higher standards in this area since they bring their children with them (Wolf et al., 2006).
For homeless people and homeless youth, the results of services should get the highest priority for quality improvement, as they have the most negative experiences with this aspect of services, while the importance adhered to this aspect is high. The need for prioritizing this aspect is in line with the shift in focus in the Netherlands toward reintegration and participation in society rather than merely accommodating homeless people (Ministerie van Volksgezondheid, Welzijn en Sport, 2011a). Moreover, a model for monitoring the outcomes of care trajectories for homeless people is currently being developed in the Netherlands (Impuls – Netherlands Center for Social Care Research, 2015). If this model is going to be implemented in the sector, we expect that the results of care will improve, as continuous reflection on outcomes will encourage quality improvement in care delivery. It should also be noted that the items in the results of care scale relate to, for example, having more hope for the future and being better able to handle difficult situations, which may not be expected to be the result of help from day and night shelters. This is also dependent on the responsiveness of communities and the opportunities society provides to these excluded individuals.
For the abused women group, the quality improvement scores do not show a clear priority area for improvement, which can be explained by the fact that there are less pronounced differences in negative experiences between scales. Abused women may not have the most negative experiences with the results of services because of the relatively longer tradition in the abused women service sector to also focus on the transitional phase from support to independent living, as part of the three functions (i.e., asylum, recovery, and transition) of the shelter and community care services (Wolf et al., 2006). The transition may also be easier for women with children, as having children has been found to be a positive factor for women receiving abused women services (Altena, Jonker, & Wolf, 2009; Zugazaga, 2004). For example, they have more contact with and receive more support from their family (Altena et al., 2009; Zugazaga, 2004). They also have a relative advantage when it comes to finding new independent housing, as they receive priority in social housing. For abused women, it may be more valuable to look at quality improvement scores for specific items, rather than the thematic scales, in order to find distinct points for improvement. For example, women’s relatively negative experiences with matters of privacy within the shelter facilities is a specific area where improvements can be made.
To our knowledge, this is the first time that the quality of shelter services could be compared across different shelter service providers targeting different client groups. Multilevel analyses show that 12–24% of the variance in scale scores and overall grade can be attributed to differences between service providers. These percentages are relatively high compared to those found in most other CQI studies (Hammink & Giesen, 2010; ITS, 2010; Koopman & Rademakers, 2008; Reitsma-van Rooijen, Damman, Sixma, Spreeuwenberg, & Rademakers, 2009; Stubbe, Spreeuwenberg, & Asbroek, 2007). Only the CQI for nursing and care homes for the elderly (Wiegers, Stubbe, & Triemstra, 2007) showed comparable large variances between locations (between 6% and 38%). Our study shows that a large part of the differences between service providers (50–74%) could be explained by the characteristics of the service provider. First, there are marked differences in scores between types of service providers. Day or night service providers score consistently and significantly lower than all the other service providers, followed by residential shelter, crisis shelter, supported housing, and outreach teams, who received highest scores. These differences may be due to the different purposes of the type of service providers (Altena et al., 2014). For example, outreach teams for homeless youth mainly focus on achieving a good relationship with the homeless young adults and engaging them in services and support, which has been found to be a successful method (Altena et al., 2014; Connolly & Joly, 2012). The differences may also be accountable to differences in clients’ circumstances. For example, those making use of supported housing services find themselves in a more stable situation than those making use of day or night services and could therefore be more positive in general.
Second, clients receiving services for abused women rated the quality of their services higher than the homeless youth group did, even when controlled for the type of service provider and individual background characteristics, including gender. It may well be that women fleeing domestic violence tend to be more positive about the services they receive, as their primary aim for seeking shelter—that is, the assurance of safety for themselves and their children from an abuser (Wolf et al., 2006)—is already met by making use of the abused women’s shelter services.
While the multilevel analyses show that much of the differences between service providers can be explained by the target group they aimed for and the type of services they offer, still 26–50% of the variance between service providers remains unexplained. This indicates that there are simply some service providers where clients report better experiences than others. It could be helpful to study such “best practice” cases more in depth or for other service providers to get otherwise acquainted with these higher rated facilities, in order to determine whether there are distinct success factors or methods that can account for the more positive client experiences.
The results of this study show that professionals involved in shelter care are already on the right path, with clients being generally positive about the services they receive and, especially, the way they are treated by professionals. The latter being the most important aspect according to the clients themselves and an essential starting point for future interventions. At the same time, areas for improvement such as an increased focus on results of care—for example, being better able to handle difficult situations for the homeless clients—are already acknowledged and integrated in recent approaches aimed at further improving the quality of shelter care. Continually monitoring clients’ experiences with care would give shelter services the opportunity to take the quality of shelter services to the next level.
Key Points
This article presents the outcomes of the first large-scale study on the quality of shelter and community care services for homeless persons, homeless youth, and abused women in the Netherlands, from the perspective of the clients themselves.
The results show that clients have quite positive experiences in general and have most positive experiences with their relationship with shelter and community care workers.
There are large differences in client experiences between the types of service providers: client experiences of day or night service providers are lowest, followed by residential shelter, crisis shelter, supported housing, and outreach team services. Clients receiving services for abused women rate their experiences consistently higher than clients receiving services for homeless persons and homeless youth.
When it comes to services for homeless persons and homeless youth, results show that the highest priority for quality improvement should be the results of services.
Footnotes
Acknowledgments
We thank the clients and organizations for participating in this study. Our thanks are also due to the stakeholders and representative groups. The work should be attributed to Impuls—Netherlands Research Center for Social Care, Department of Primary and Community Care, Radboud University Nijmegen Medical Center.
Declaration of Conflicting Interests
The authors declared no potential conflicts of interest with respect to the research, authorship, and/or publication of this article.
Funding
The authors disclosed receipt of the following financial support for the research, authorship, and/or publication of this article: This work was supported by the Dutch Ministry of Health, Welfare and Sport.