
Abstract
Purpose:
This study validates the ALONE Scale (Chinese) and examines its age association.
Method:
We analyzed 2,019 anonymous adult responses from a nationwide Wenjuanxing survey in China. Using locally weighted scatterplot smoothing (LOWESS) curves and logistic regression, we compared age differences in loneliness.
Results:
The scale demonstrated modest internal consistency (Cronbach's α = .600) and a moderate concurrent association (r = .606) with the 8-item UCLA Loneliness Scale. Receiver operating characteristic analysis identified a cutoff score of 10 (range = 5–15). Logistic regression indicated an inverse association between age and loneliness. The adjusted LOWESS curve revealed a nonlinear age pattern, with peaks at ages 25 and 50; descriptively, peak ages were approximately 10 years later among women than men.
Discussion:
While the findings support the practicality of the ALONE Scale, users should discuss cultural meanings of these five items, incorporate relational-skill training to address silent struggles, and assess age-related stigma toward loneliness.
Loneliness is an unpleasant, subjective feeling that arises from perceived discrepancies between one's expected and actual social relationships (Peplau & Perlman, 1979). A large body of research has shown that loneliness is associated with an increased risk of adverse physical outcomes, such as heart disease (Petitte et al., 2015), as well as mental and cognitive problems, such as depression and cognitive decline (Lara et al., 2019; Van Tilburg et al., 2021). The COVID-19 pandemic has further highlighted the detrimental effects of loneliness on health (Allen et al., 2022). In the digital era, the internet has become an integral part of daily life, driving a substantial increase in its use. The rapid expansion represents a double-edged sword, offering both benefits and risks to mental health (Arjanto & Senduk, 2024). A recent meta-analysis demonstrated that problematic internet use is associated with higher levels of loneliness (Cai et al., 2023). Taken together, these developments highlight a pressing need for practical strategies to screen for loneliness. Early identification of loneliness using validated screening tools is particularly critical, as it would enable timely prevention and targeted intervention. This study aims to investigate practical measures of loneliness, to validate a Chinese translation of the recently developed ALONE Scale (Deol et al., 2022), which includes a direct measure of loneliness, and to examine age-related vulnerability to determine whether aging is associated with loneliness among Chinese adults.
Loneliness Across the Life Span
Loneliness can affect people at any point in their life course (Lay-Yee et al., 2022; Wang, 2024). However, existing research has predominantly focused on older adults and adolescents, while evidence regarding loneliness among middle-aged adults remains limited (Surkalim et al., 2022; Wang et al., 2023). Perhaps this gap is linked to the widespread assumption that middle-aged adults are less susceptible to loneliness (Surkalim et al., 2022). To develop a more nuanced understanding of loneliness across the lifespan, further research is needed to examine age-related patterns of loneliness and the association between age and loneliness across a broader age range in the general population.
Why ask About “Loneliness” Directly
Over the past decades, researchers have developed and tested instruments to assess loneliness. The most widely used multi-item instrument is the UCLA Loneliness Scale and its shorter versions (Russell, 1996; Russell et al., 1980), followed by the De Jong Gierveld Loneliness Scale (De Jong-Gierveld & Kamphuls, 1985). These measures do not include the words “lonely” or “loneliness” to avoid explicitly asking respondents about loneliness, thereby reducing the impact of stigma and social desirability bias on responses (Deol et al., 2022; Maes et al., 2022). However, the COVID-19 pandemic may have heightened clinical attention to loneliness and destigmatized it (Ernst et al., 2022). Additionally, the stigma surrounding loneliness may have diminished due to the growing mental health awareness (Deol et al., 2022). Therefore, the general public may be more willing to share and discuss their feelings of loneliness.
Clinicians at Saint Louis University have recently developed the 5-item ALONE Scale to screen for loneliness among older adults, designed for busy clinical environments (Deol et al., 2022). It includes a direct measure of loneliness for clinicians connecting with patients, such as using the items to set the agenda for a clinic visit. In clinical settings, the ALONE Scale has demonstrated robust validity among older adults aged 65+ in the United States (Carvalho et al., 2023; Deol et al., 2022; Sayin Kasar & Karaman, 2021). However, little is known about its psychometric properties across age groups and diverse international populations.
Age and Loneliness
Age is included in most studies of loneliness, often as a control or moderator variable rather than as a focal factor of interest (Hawkley et al., 2022). Nevertheless, a growing body of research has examined age-related patterns of loneliness across the lifespan, yet evidence remains inconclusive. Generally, two broad patterns were tested.
A linear association was the first pattern. For example, Pagan (2020) observed an almost linear decrease in loneliness with advancing age among males with severe limiting disabilities in a sample of 19,763 males and 22,806 females (≥16 years) from the German Socio-Economic Panel. Conversely, a study consisting of 14,743 Norwegian adults aged 18 to 81 detected a linear increase in loneliness with age. Specifically, the oldest-old group reported the highest levels of loneliness, as measured by the De Jong Gierveld Scale (Nicolaisen & Thorsen, 2014).
Nonlinear relationships show the second pattern. For example, Hawkley et al. (2022) identified a nonlinear pattern in a representative U.S. sample of 2,477 individuals aged 18 to 89, with heightened loneliness levels in the oldest-old (70+ years), middle-aged (50–60 years), and young adults (under 30 years). Similarly, Luhmann and Hawkley (2016), using a representative German sample (n = 16,132), found a complex nonlinear trajectory with two peaks (around ages 30 and 60) and two dips (around ages 40 and 75). Furthermore, a meta-analysis of 75 longitudinal studies from Europe, North America, and Asia, involving 83,679 participants, suggested an inverted U-shaped relationship between age and loneliness (Mund et al., 2020). In a similar vein, a recent study in China, with 3,899 respondents aged 18 to 103, peaking at age 47, reported a reverse U-shaped pattern (Wang et al., 2023). In a UK study, data from 2,393 participants aged 15 to 97 also showed a U-shaped distribution, with the highest levels observed among those aged under 25 and over 65 (Victor & Yang, 2012).
Most loneliness studies on this association have been conducted in Western countries; in China, such studies are limited, especially those involving participants of diverse ages. China has experienced dramatic social, cultural, and economic shifts, including rapid urbanization, declining household size, and the proliferation of individualistic attitudes (Wang et al., 2023). In addition, China faced a severe economic downturn due to the COVID-19 pandemic. These changes may have increased public awareness of the impact of loneliness.
As one of the most populous countries in the world, China faces a substantial need for practical tools to identify loneliness. The availability of a brief and robust screening instrument is essential for social work practitioners to conduct timely assessments, identify individuals in need, and develop appropriate interventions. To date, the ALONE Scale has not been used or tested in China. Accordingly, this study aims to conduct an initial validation of the Chinese translation of the ALONE Scale among Chinese adults across different age groups and to determine the optimal cutoff value for identifying loneliness. In addition, this study examines the association between age and loneliness. This investigation is crucial for deepening our understanding of age-related vulnerability to loneliness throughout the lifespan in the Chinese context and for establishing a basis for developing age-specific interventions to reduce loneliness.
Methods
Study Design and Data Collection
This secondary data analysis is based on a survey conducted in China between 15 July 2022 and 31 August 2022, using the Wenjuanxing online survey platform (www.wjx.cn). The survey link was disseminated nationwide via two widely used social media platforms in China: WeChat and Douyin (Chinese TikTok). Convenience and snowball sampling strategies were used in the original survey to recruit participants. Participants read the electronic informed consent form regarding the study's purpose and procedures. After the opportunity to ask questions, they understood that starting the survey constituted consent to participate in this anonymous study, and that they could skip questions and exit the survey at any time.
ALONE Translation Procedure
This study employed back translation to develop the Chinese version of the ALONE Scale. Permission was first obtained from a member of the research team who created the original English version of the ALONE Scale for measuring loneliness (Deol et al., 2022). Then, two bilingual social workers independently translated the Scale, compared their translations, and produced a reconciled version. Next, an independent bilingual psychiatrist performed back translation without knowledge of the original version. Another bilingual researcher back-translated the instrument and compared it with the original version. The final Chinese version of the Scale underwent a pilot test with a small sample of respondents (n = 18) to assess its applicability. The Chinese version of the ALONE Scale is available in Table 1.
The ALONE Scale.
To Assess Your Feelings of Loneliness, Please Answer Each of the Following Questions.
为评估个体对孤独的感受,请回答以下每个问题.
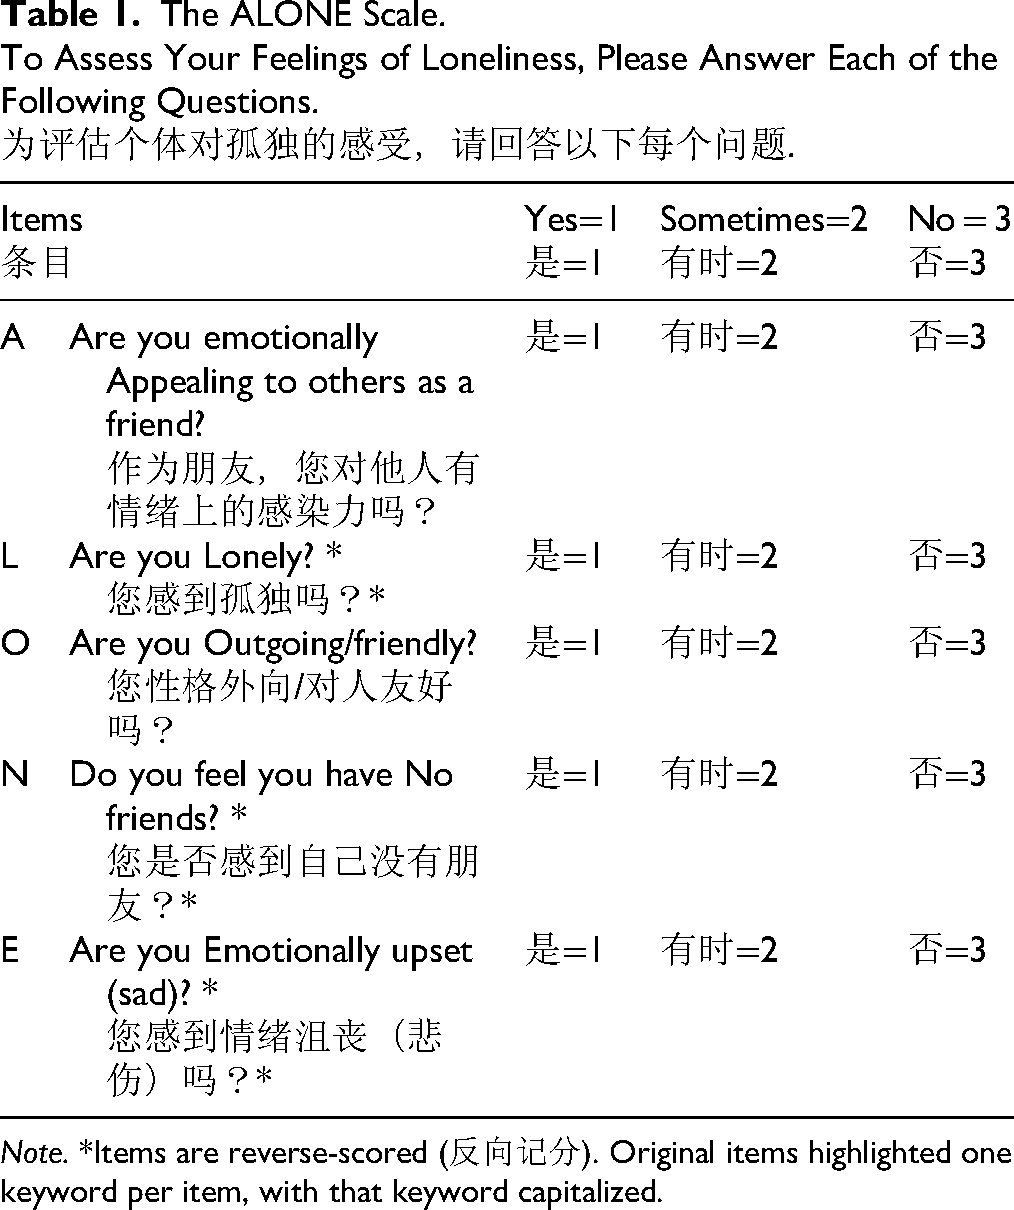
Note. *Items are reverse-scored (反向记分). Original items highlighted one keyword per item, with that keyword capitalized.
Human Subject Protection
The University of Houston Institutional Review Board granted this study exempt status because the team analyzed secondary data collected from anonymous participants who voluntarily participated and whose participation was not linked to any financial incentives or risks. When we examined the secondary dataset, we excluded three participants with missing data on the targeted Scale, leaving data from 2,019 participants for further analyses.
Measures
The ALONE Scale
As the target measure, the ALONE Scale is unidimensional and consists of five items (Deol et al., 2022): (1) The A-item (“Are you emotionally Appealing to others as a friend?”) inquires about an individual's self-perception; (2) The L-item (“Are you Lonely?”) directly asks about an individual's feelings of loneliness; (3) The O-item (“Are you Outgoing/friendly?”) asks about extraversion, a personality trait that has previously demonstrated a significant correlation with the experiences of loneliness; (4) The N-item (“Do you feel you have No friends?”) inquires about an individual's perception regarding the substantial and meaningful connections within their social network; (5) The E-item (“Are you Emotionally upset/sad?”) addresses emotional stability, a factor that exhibits an inverse association with increased feelings of loneliness. The L-, N-, and E-items were reversely scored. Each item is evaluated on a 3-point verbally labeled Scale, with responses of 1 (yes), 2 (sometimes), and 3 (no). Each participant responded to each item with reference to the past week. A total score was calculated by summing all items, each ranging from 5 to 15, with higher scores indicating greater loneliness.
The 8-Item UCLA Loneliness Scale (ULS-8)
As a concurrent measure, ULS-8 was used to validate the ALONE Scale. The ULS-8 is widely cited in Chinese and international literature for its brevity and applicability (Igbokwe et al., 2020; Maes et al., 2022; Xu et al., 2018). It includes eight items selected from the revised 20-item UCLA Loneliness Scale (Russell et al., 1980). Each item is rated on a four-point scale: 1 (never), 2 (rarely), 3 (sometimes), and 4 (always). Two items, “I am an outgoing person” and “I can find companionship when I want it,” are scored in reverse (Hays & DiMatteo, 1987). The sum of eight items, ranging from 8 to 32, measures the general level of loneliness, with higher scores indicating greater loneliness. Its internal consistency among Chinese is good (α = .815; Xu et al., 2018).
Other Variables
Sociodemographic variables were collected, including age (in years), gender (male/female), education, marital status, employment (employed/unemployed), religious affiliation (yes/no), living arrangement (living alone/living with others), and living areas (urban/rural). Education was coded into three groups: middle school and below, high school, and college/university and above. Marital status was dichotomized into married and unmarried. Given that the retirement age for women in China is 50, consistent with previous literature (Beutel et al., 2009; Lachman et al., 2015), the sample was further divided into four age groups: 18–39, 40–49, 50–59, and 60+.
Health-related variables included suicidal ideation and self-rated health (SRH). Suicidal ideation was assessed using a single question (“Have you ever considered suicide seriously in the past 12 months?”) with a dichotomous response (0 = no and 1 = yes). SRH was measured using a single question, “In general, how would you rate your health these days?” on a five-point scale from 1 (poor) to 5 (excellent).
Offline social capital was operationalized as offline trust and offline social support. Offline trust was measured using the item, “Generally, I trust most people I have met offline,” and offline social support was assessed with the statement, “There is someone offline I can turn to when I am in need.” Responses to the trust and support items were rated on a five-point Likert scale ranging from 1 (strongly disagree) to 5 (strongly agree). Attitudes toward post-retirement work were assessed on the same five-point scale using a single item: “Older adults can continue working after retirement.”
Data Analysis
Exploratory factor analysis (EFA) was conducted using principal axis factoring to test the construct validity of the ALONE Scale. Factors were extracted using eigenvalues >1.0 (Zwick & Velicer, 1986). A factor loading of at least 0.30 was generally considered acceptable (Yildiz & Duy, 2014). Communalities between 0.40 and 0.70 are considered low to moderate in the social sciences (Costello & Osborne, 2019). Given that a factor with fewer than three items is generally weak and unstable (Costello & Osborne, 2019), the analysis was constrained to the original single-factor structure. In addition, in this cross-cultural adaptation and validation study, cultural differences, conceptual relevance, and consistency with the original scale were also considered, rather than statistical performance alone (Gjersing et al., 2010).
Concurrent validity was assessed using Pearson's product–moment correlation coefficient between the ALONE Scale and the ULS-8. Bivariate correlation analyses were used to test convergent validity by examining the associations with conceptually related variables, including suicidal ideation, offline trust, offline social support, and SRH. Additionally, discriminant validity was examined by assessing the relationship with conceptually unrelated variables, specifically attitudes toward post-retirement work.
Internal reliability was assessed with Cronbach's alpha. In addition, item-level reliability was examined using corrected item–total correlations and Cronbach's alpha if each item was removed. Although a Cronbach's alpha of .70 is commonly used as a conventional standard for acceptable internal consistency (Nunnally, 1978), alpha is influenced by the number of items, and lower values may be expected for brief instruments. Values between .60 and .70 have been suggested as the lower limit of acceptability, particularly in exploratory research and for brief scales (Hair et al., 2019; Wang et al., 2022). Accordingly, given that the ALONE Scale consists of only five items and this study represents an early validation effort, a Cronbach's alpha of .60 or higher was considered as minimally acceptable when evaluated alongside other evidence of validity in the current study. Corrected item–total correlations below .30 were interpreted as indicating potentially weak item performance (Boateng et al., 2018), and alpha-if-deleted values were examined to assess whether removal of any item would substantially improve internal consistency.
We used the area under the curve (AUC) from the receiver operating characteristic (ROC) analysis to evaluate the accuracy of the ALONE Scale in screening for loneliness: AUC ≥ .90 = Excellent, ≥.80 = Good, ≥.70 = Fair, and <.70 = Poor (Youngstrom, 2014). The ULS-8 was employed as the standard for the ROC curve. Although there is no standard cutoff point for the ULS-8, we used a score of 24 to classify respondents as lonely or not lonely in our study, as in several previous studies (Igbokwe et al., 2020; Wang et al., 2020). The optimal cutoff score for the ALONE Scale, maximizing the Youden index (J = Sensitivity + Specificity − 1), was calculated from the ROC analysis (Matthews et al., 2022).
Given the skewed distribution of loneliness scores and the interpretability of age-related findings, the association between age and loneliness was examined using multiple analytic approaches, including locally weighted scatterplot smoothing (LOWESS) curves, chi-square tests, and multivariable logistic regression. Specifically, we used LOWESS curves to visualize age-related patterns of loneliness by fitting a locally weighted scatterplot smoothing curve to the bivariate distribution of age and loneliness (Luhmann & Hawkley, 2016). We also generated LOWESS lines using both observed and residual loneliness scores, adjusted for covariates. To compare how the age distribution changes after adjustment for these covariates, we regressed loneliness on them (excluding age) and computed the residuals. These curves were plotted with 95% confidence intervals. Loneliness was standardized on the mean and standard deviation of the total sample.
Notably, age was modeled as both a continuous and a categorical variable in the multivariable logistic regression analyses to better understand age-related trends in loneliness and identify specific age groups at higher risk. Based on previous findings (Hawkley et al., 2022; Luhmann & Hawkley, 2016), gender, education, religion, marital status, employment status, living arrangement, living area, offline social support, and SRH were included as covariates in the LOWESS and logistic regression analyses. We conducted data analyses in SPSS version 29.0 and used the LOWESS lines and their corresponding 95% confidence intervals in the standard R packages.
Results
Participant Characteristics
The participants’ average age was 49.66 ± 8.71 years (18–79 years). Among them, 215 (10.6%) were 18–39 years old, 606 (30.0%) were 40–49 years old, 993 (49.1%) were 50–59 years old, and 208 (10.3%) were 60+. Also, 88.7% were married; 71.0% were female. Most lived with others (91.4%), reported no religious affiliation (89.2%), lived in urban areas (87.6%), and were employed (86.7%). More than half (55.5%) held at least one college or university degree, 25.1% completed high school, and 19.4% had only a middle school education or less.
Validity and Reliability
Construct Validity
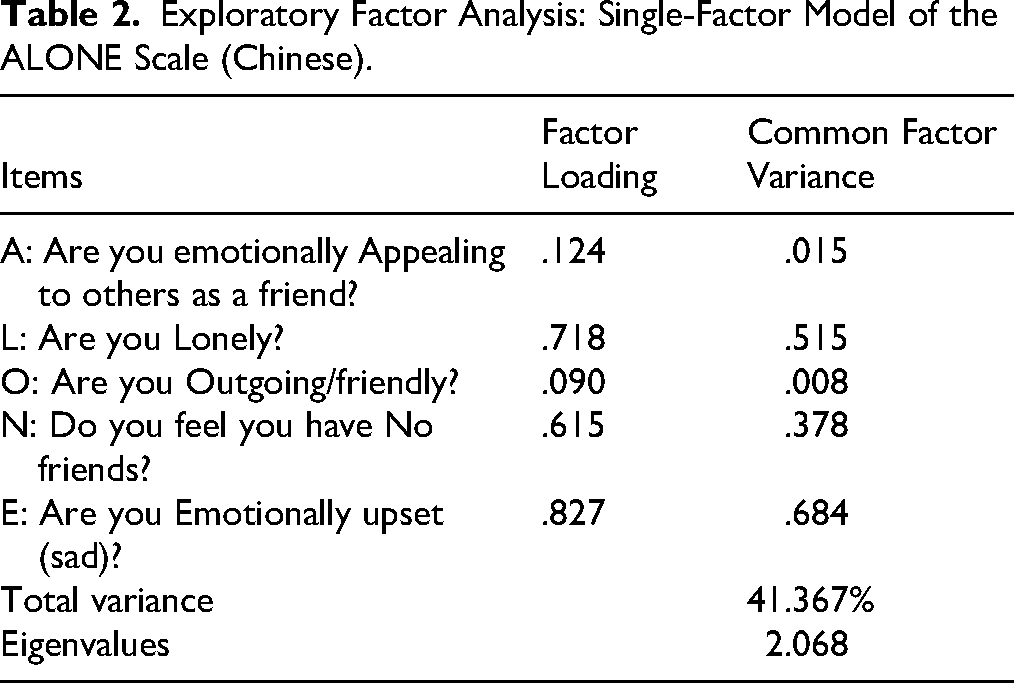
Given the original design of the ALONE Scale, the EFA was constrained to a single-factor structure. Table 2 shows that the one-factor structure explained 41.367% of the total variance (eigenvalue = 2.068), with the A-item and O-item having relatively low factor loadings (0.124 and 0.090, respectively; below 0.3). This means these two items must be reexamined or reworded to fit the Chinese cultural context.
Exploratory Factor Analysis: Single-Factor Model of the ALONE Scale (Chinese).
Concurrent Validity
Table 3 reports the total sample mean scores for the ALONE Scale and ULS-8 as 8.40 (SD = 2.05) and 16.25 (SD = 4.70), respectively. The ALONE Scale (Chinese) showed moderate associations with the ULS-8 in the total sample (r = .668) and across the four age groups (r = .569–.697). As shown in Table 4, loneliness in the total sample was significantly associated with suicidal ideation (r = .297), SRH (r = −.329), offline trust (r = −.131), and offline social support (r = −.212), with no significant association observed in attitudes toward post-retirement work (r = −.006). These findings support both the convergent and discriminant validity of the ALONE Scale.
Scores and Correlations for the ALONE Scale and ULS-8 by Age Group.
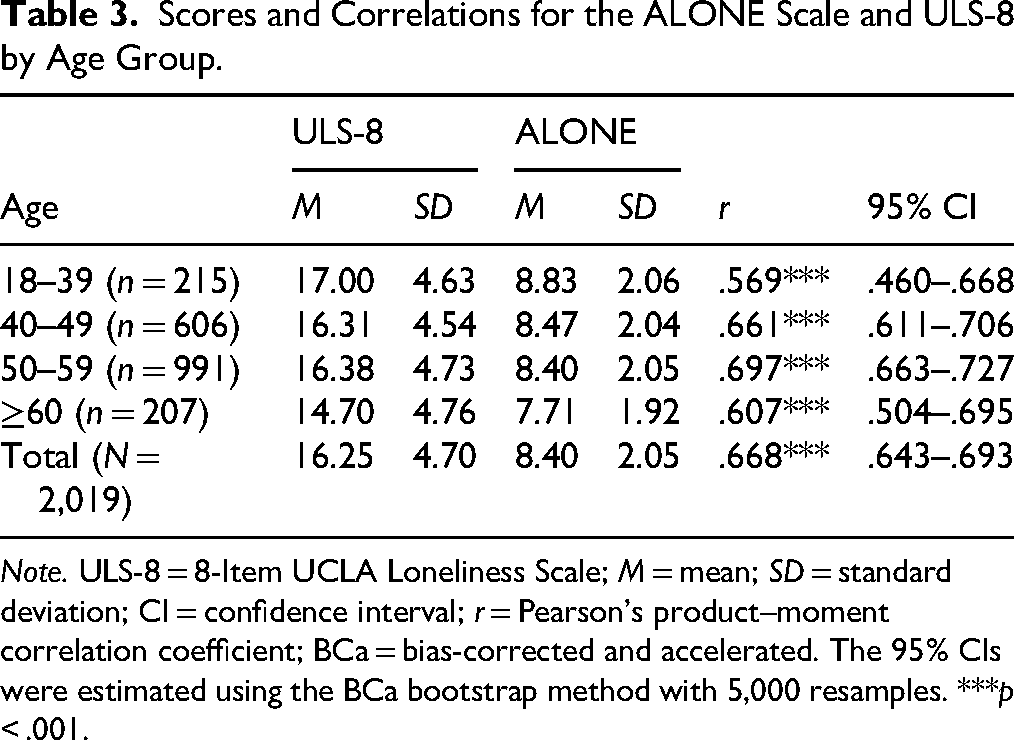
Note. ULS-8 = 8-Item UCLA Loneliness Scale; M = mean; SD = standard deviation; CI = confidence interval; r = Pearson's product–moment correlation coefficient; BCa = bias-corrected and accelerated. The 95% CIs were estimated using the BCa bootstrap method with 5,000 resamples. ***p < .001.
Correlations With 95% Confidence Intervals Between Loneliness and Related Variables by Age Group.
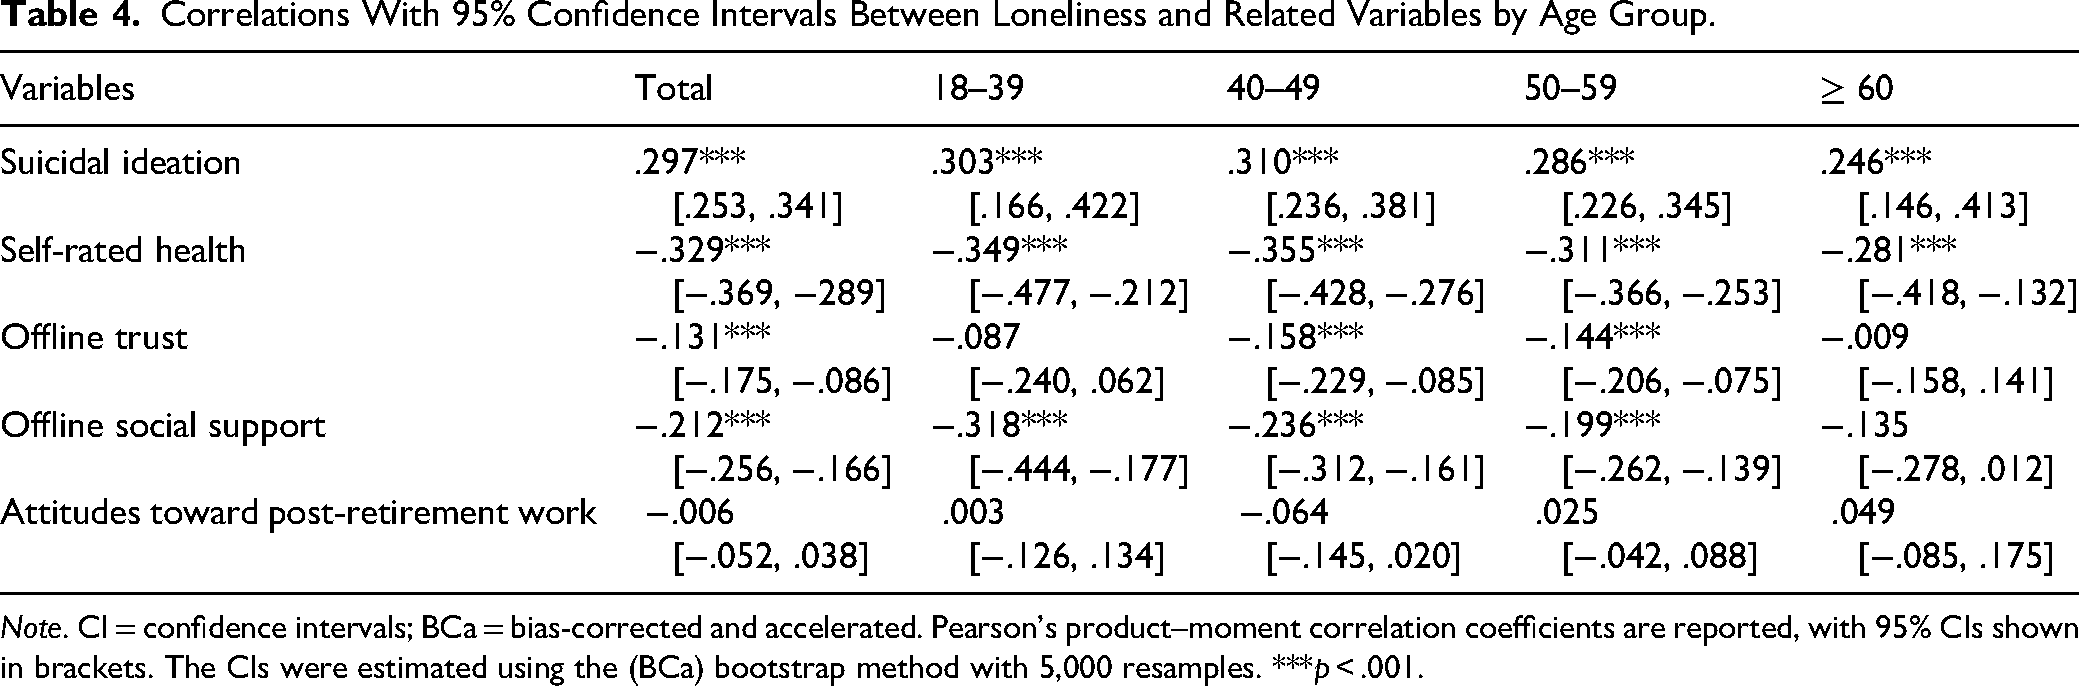
Note. CI = confidence intervals; BCa = bias-corrected and accelerated. Pearson's product–moment correlation coefficients are reported, with 95% CIs shown in brackets. The CIs were estimated using the (BCa) bootstrap method with 5,000 resamples. ***p < .001.
Reliability
The ALONE Scale has achieved minimally acceptable internal consistency in the total sample (Cronbach's α = .600), which is lower than that of the ULS-8 (α = .782). Item-level analyses showed that corrected item–total correlations ranged from .149 to .531. The two positively worded items, the A-item and O- item, had relatively low corrected item–total correlations (.186 and .149, respectively), whereas the reverse-scored items showed stronger item–total correlations. Cronbach's alpha, after an item was deleted, ranged from .447 to .642, with slightly higher values after removing either positively worded item. Therefore, the reliability findings should be interpreted with caution.
Loneliness Cutoff Point
The ROC curve analysis identified a score of 10 or higher as the optimal cutoff for screening for loneliness across the entire sample (Sensitivity = 0.88; Specificity = 0.74). The best cutoff point, 10 (range: 5 to 15), remained consistent across age groups, except for those aged 60+. For individuals aged 60+, the Youden index reached its maximum value at a cutoff score of 12. Notably, Sensitivity remained consistent across cutoffs of 10, 11, and 12, whereas Specificity increased at each. Table 5 summarizes additional information on cutoff-point performance. Moreover, Figure 1 shows that the AUC for the ALONE (Chinese) Scale was .899 across the entire sample and ranged from .875 to .937 across age groups, indicating robust performance in assessing loneliness.
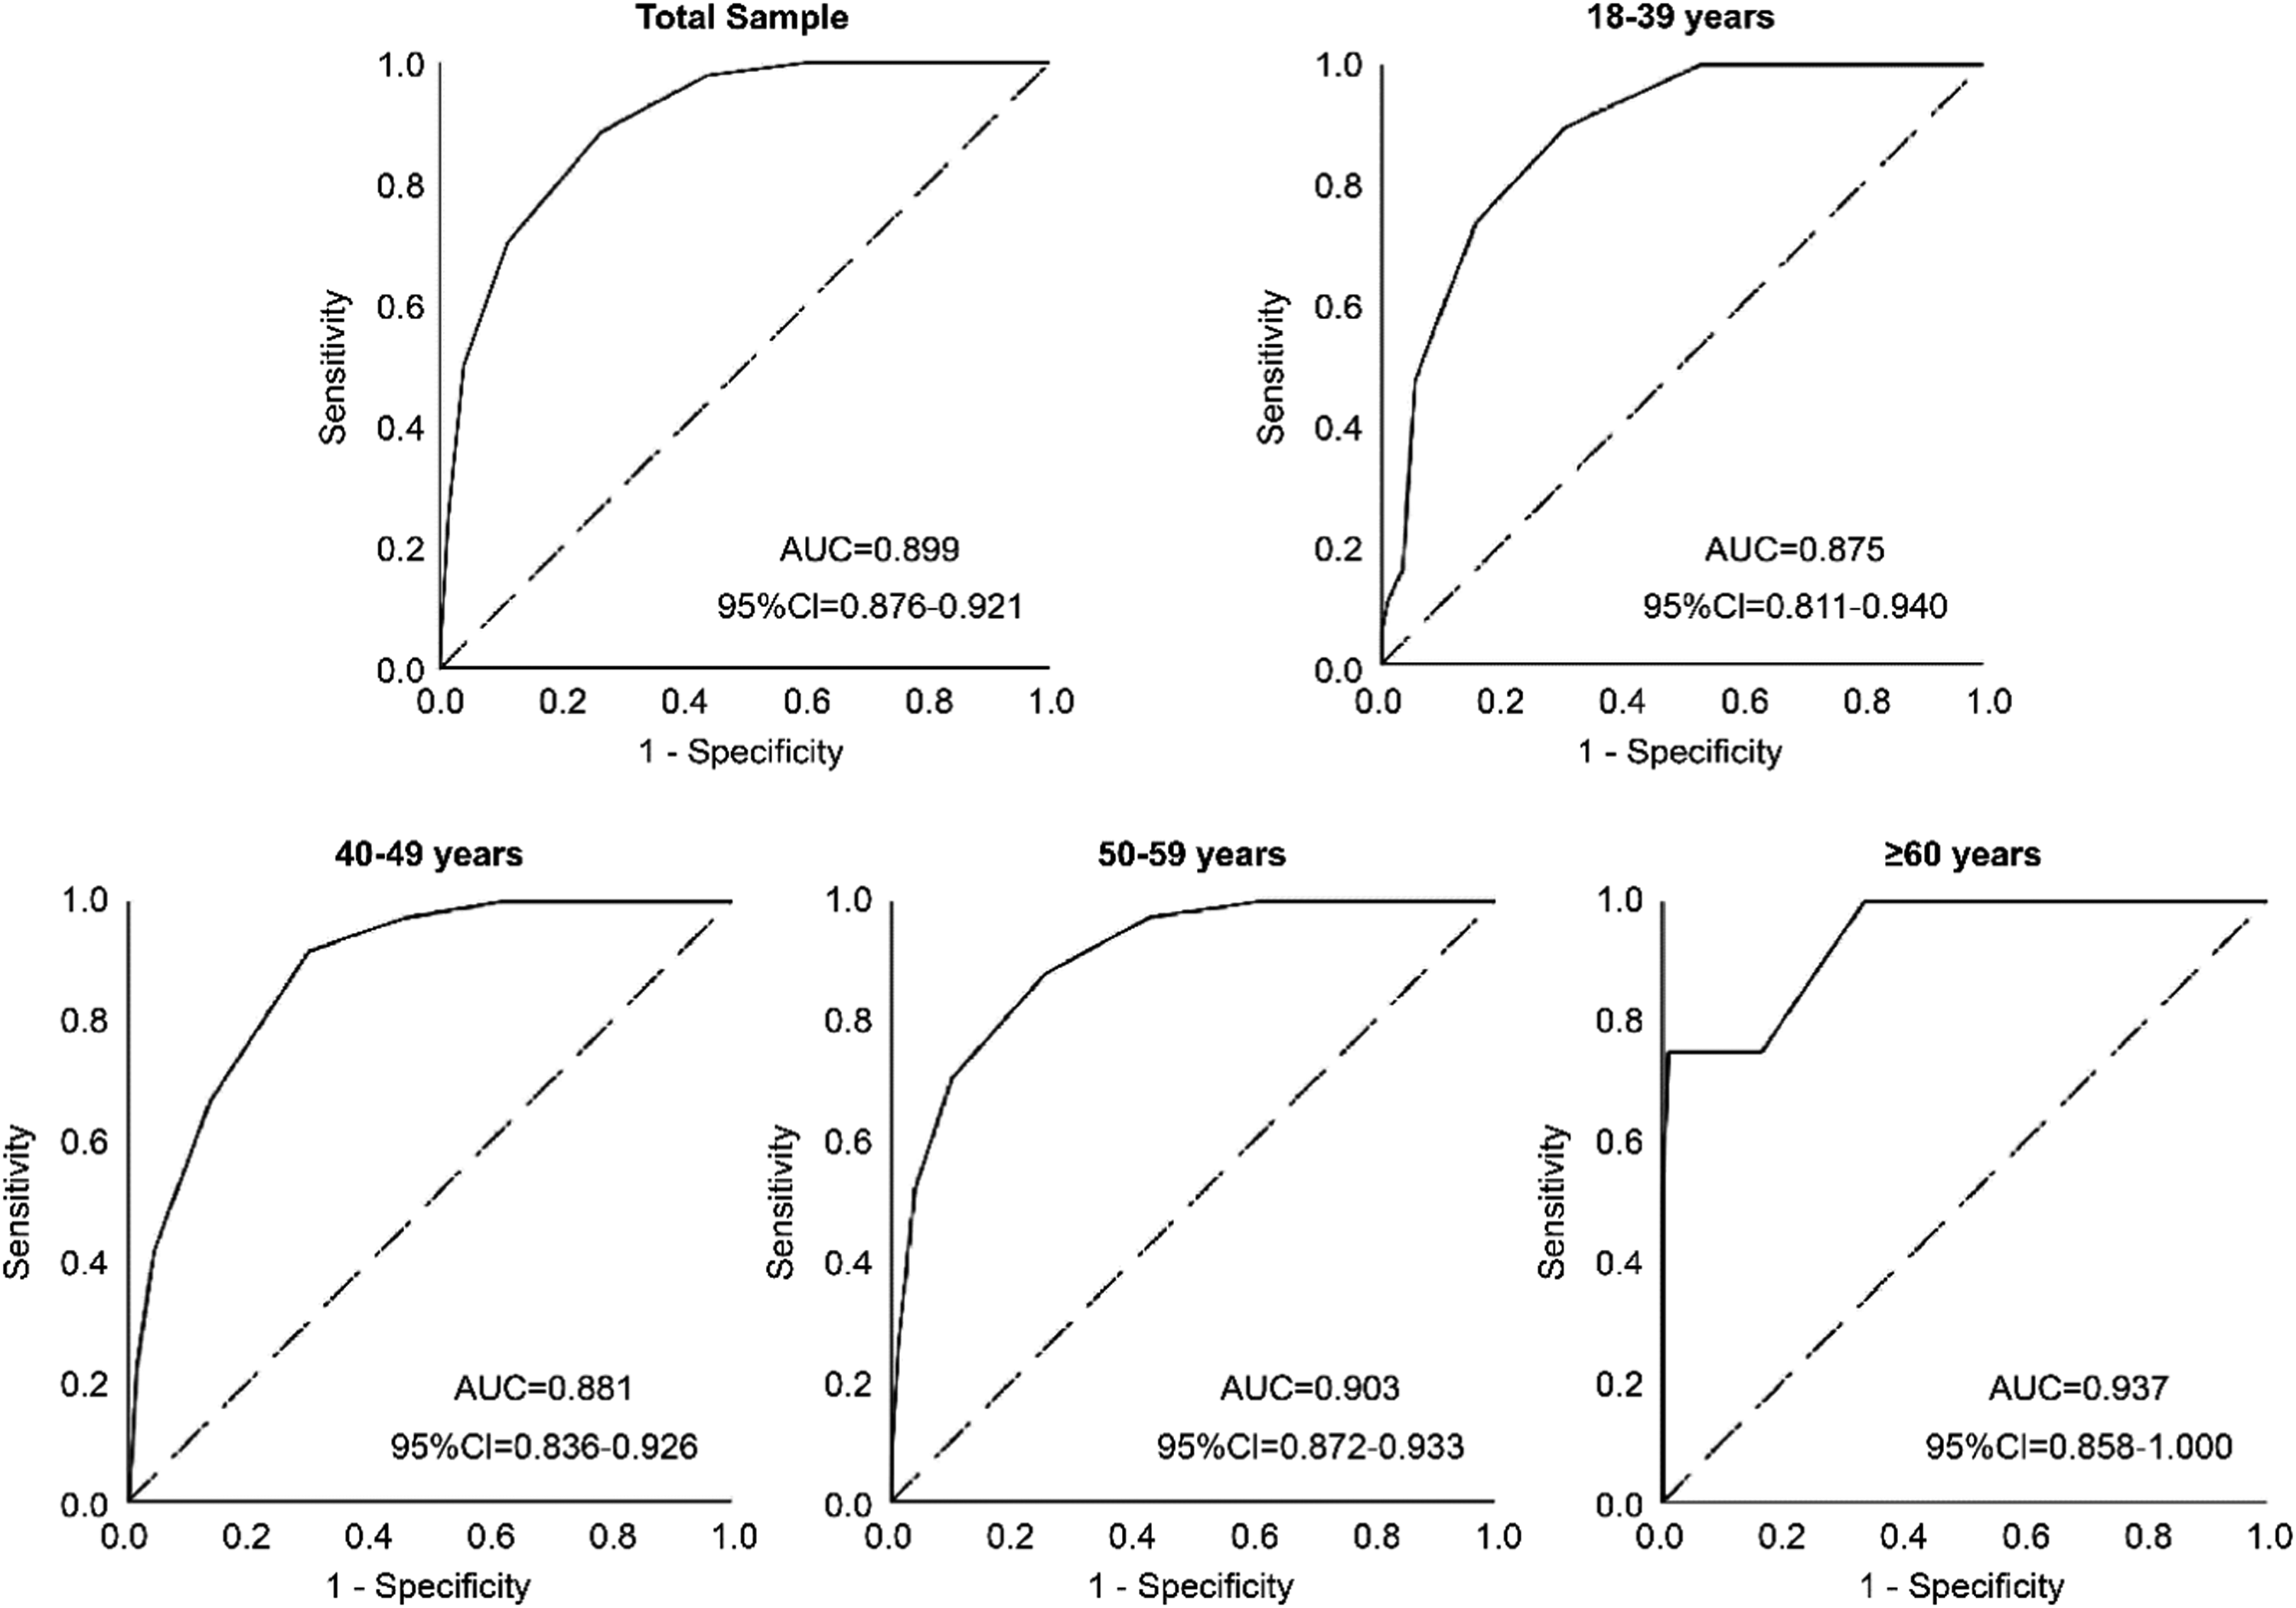
ROC curves for the ALONE Scale (Chinese) by age group.
Sensitivity, Specificity, and Youden Index for Scores for the ALONE Scale.
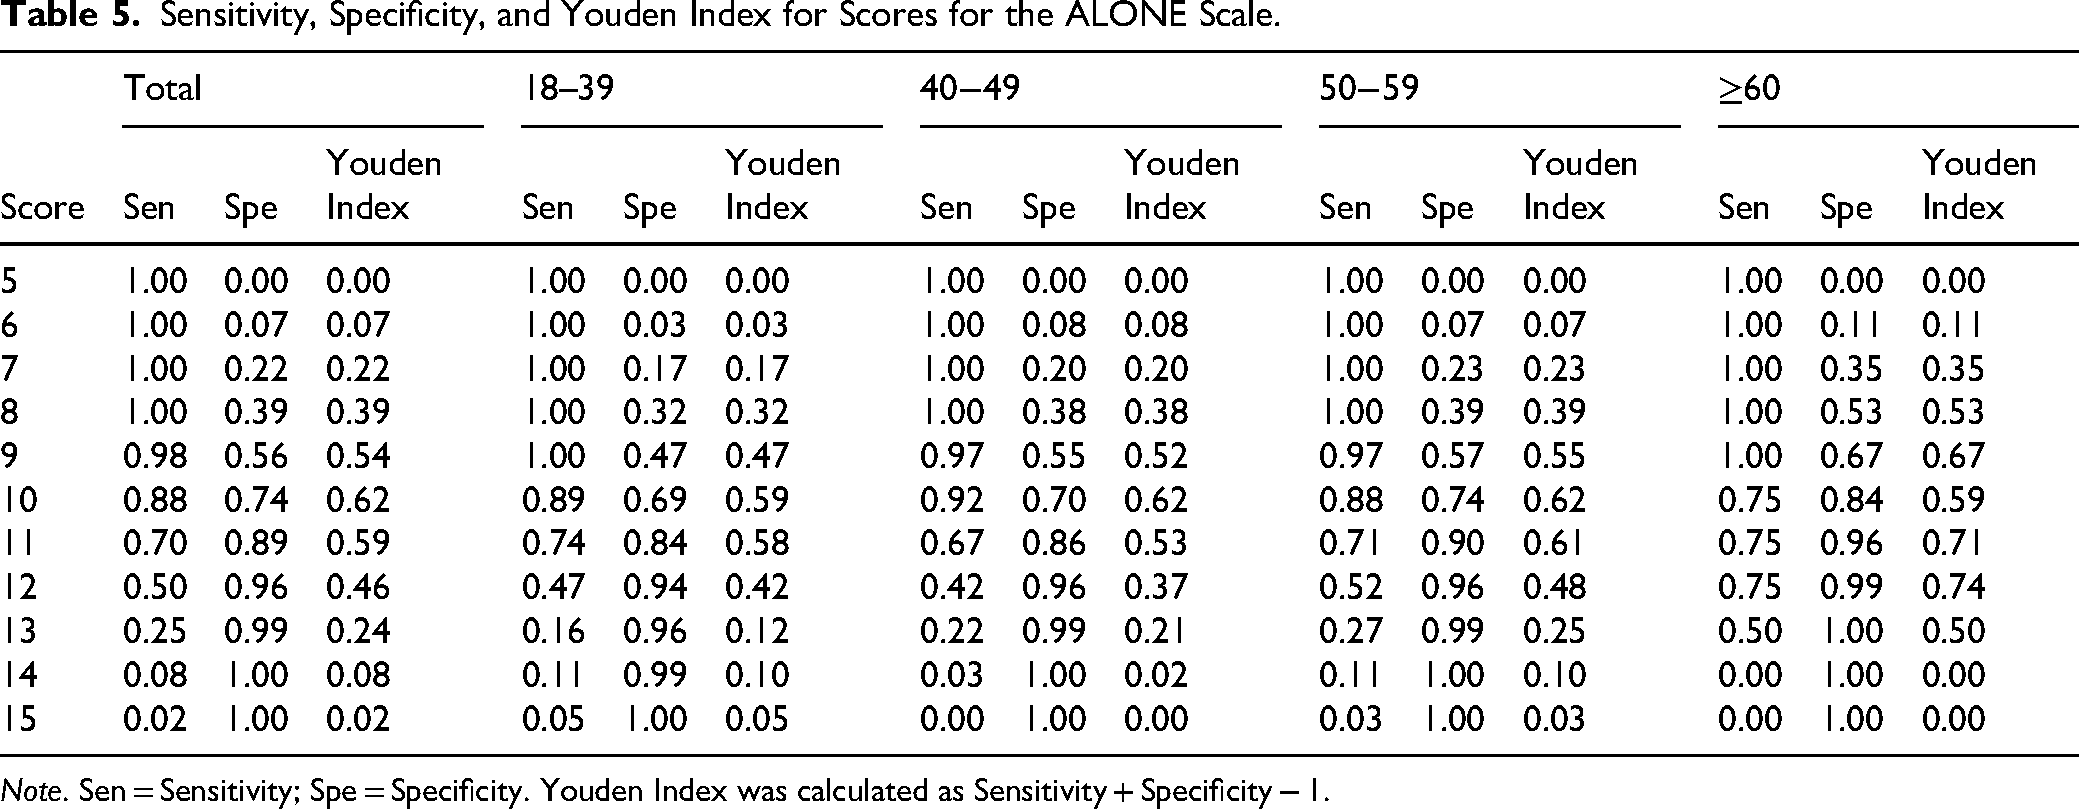
Note. Sen = Sensitivity; Spe = Specificity. Youden Index was calculated as Sensitivity + Specificity − 1.
Age Differences in Loneliness Prevalence Among Participants
Table 6 reports the prevalence of loneliness among participants by age group and gender. The prevalence in the total sample was 30.7%, with significantly higher prevalence observed in younger age groups (χ2 = 18.655, p < .001, Cohen's d = .193). Women showed a slightly higher prevalence of loneliness than men (31.9% vs. 27.7%), although this difference was not statistically significant (χ2 = 3.409, p = .065, Cohen's d = .082).
Prevalence of Loneliness Among Participants by Age Group and Gender.
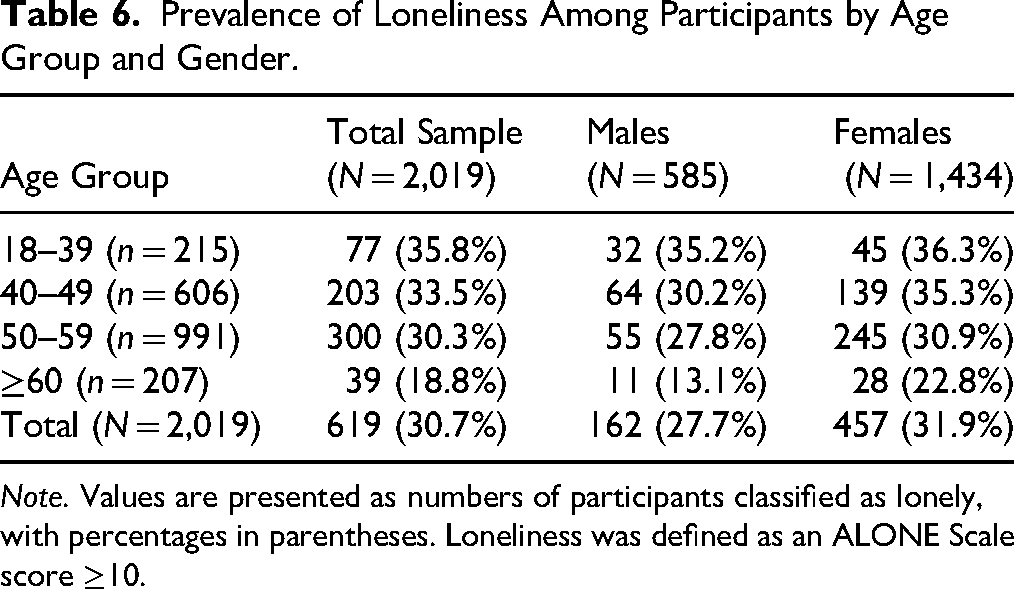
Note. Values are presented as numbers of participants classified as lonely, with percentages in parentheses. Loneliness was defined as an ALONE Scale score ≥10.
Figure 2A–C displays the observed (solid lines) and adjusted (dashed lines) age distributions of loneliness for the total sample, females, and males, respectively. For the observed distributions, the total sample showed a nonlinear age pattern, with two minor peaks at approximately ages 24 and 51, with an overall decrease in loneliness as age increased. Patterns by gender showed that loneliness peaked at approximately ages 19 and 43 among males and at approximately ages 29 and 53 among females. The adjusted distributions showed patterns similar to the observed distributions, with peak ages at approximately 25 and 50 in the total sample, 19 and 43 among males, and 28 and 53 among females. Descriptively, the peak ages appeared approximately 10 years later among females than among males. The confidence intervals in late life (age 75+) were broader than those in other age groups.
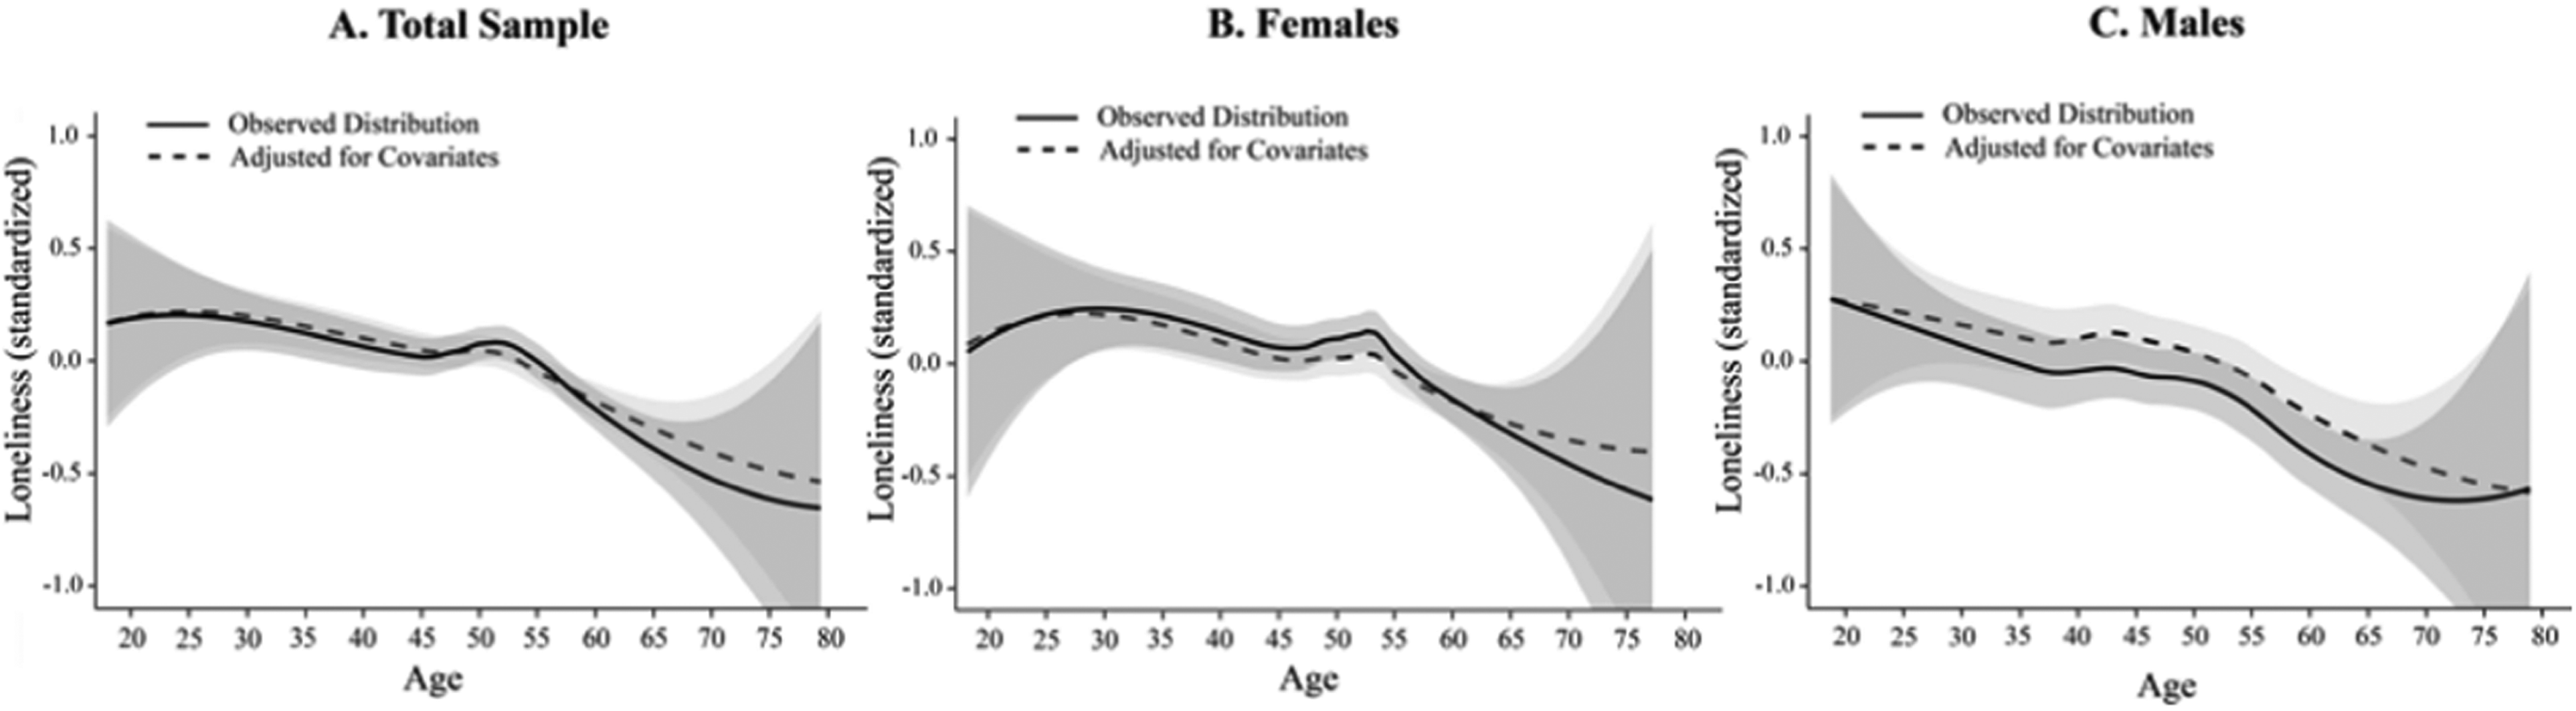
Age distribution of loneliness by gender.
Table 7 presents the multivariable logistic regression results for loneliness. In Model I, age was introduced as a continuous variable and was negatively associated with loneliness (OR = 0.977, p < .001). In Model II, age was entered as a categorical variable. Compared with young adults aged 18−39 years, participants aged 60 years and above were less likely to experience loneliness (OR = 0.468, p < .01). In addition, gender did not significantly predict variations in loneliness. Although several covariates were also significantly associated with loneliness, these findings are beyond the primary focus of the present analysis and are therefore not reported in detail.
Logistic Regression for Loneliness in the Total Sample (N = 2,019).
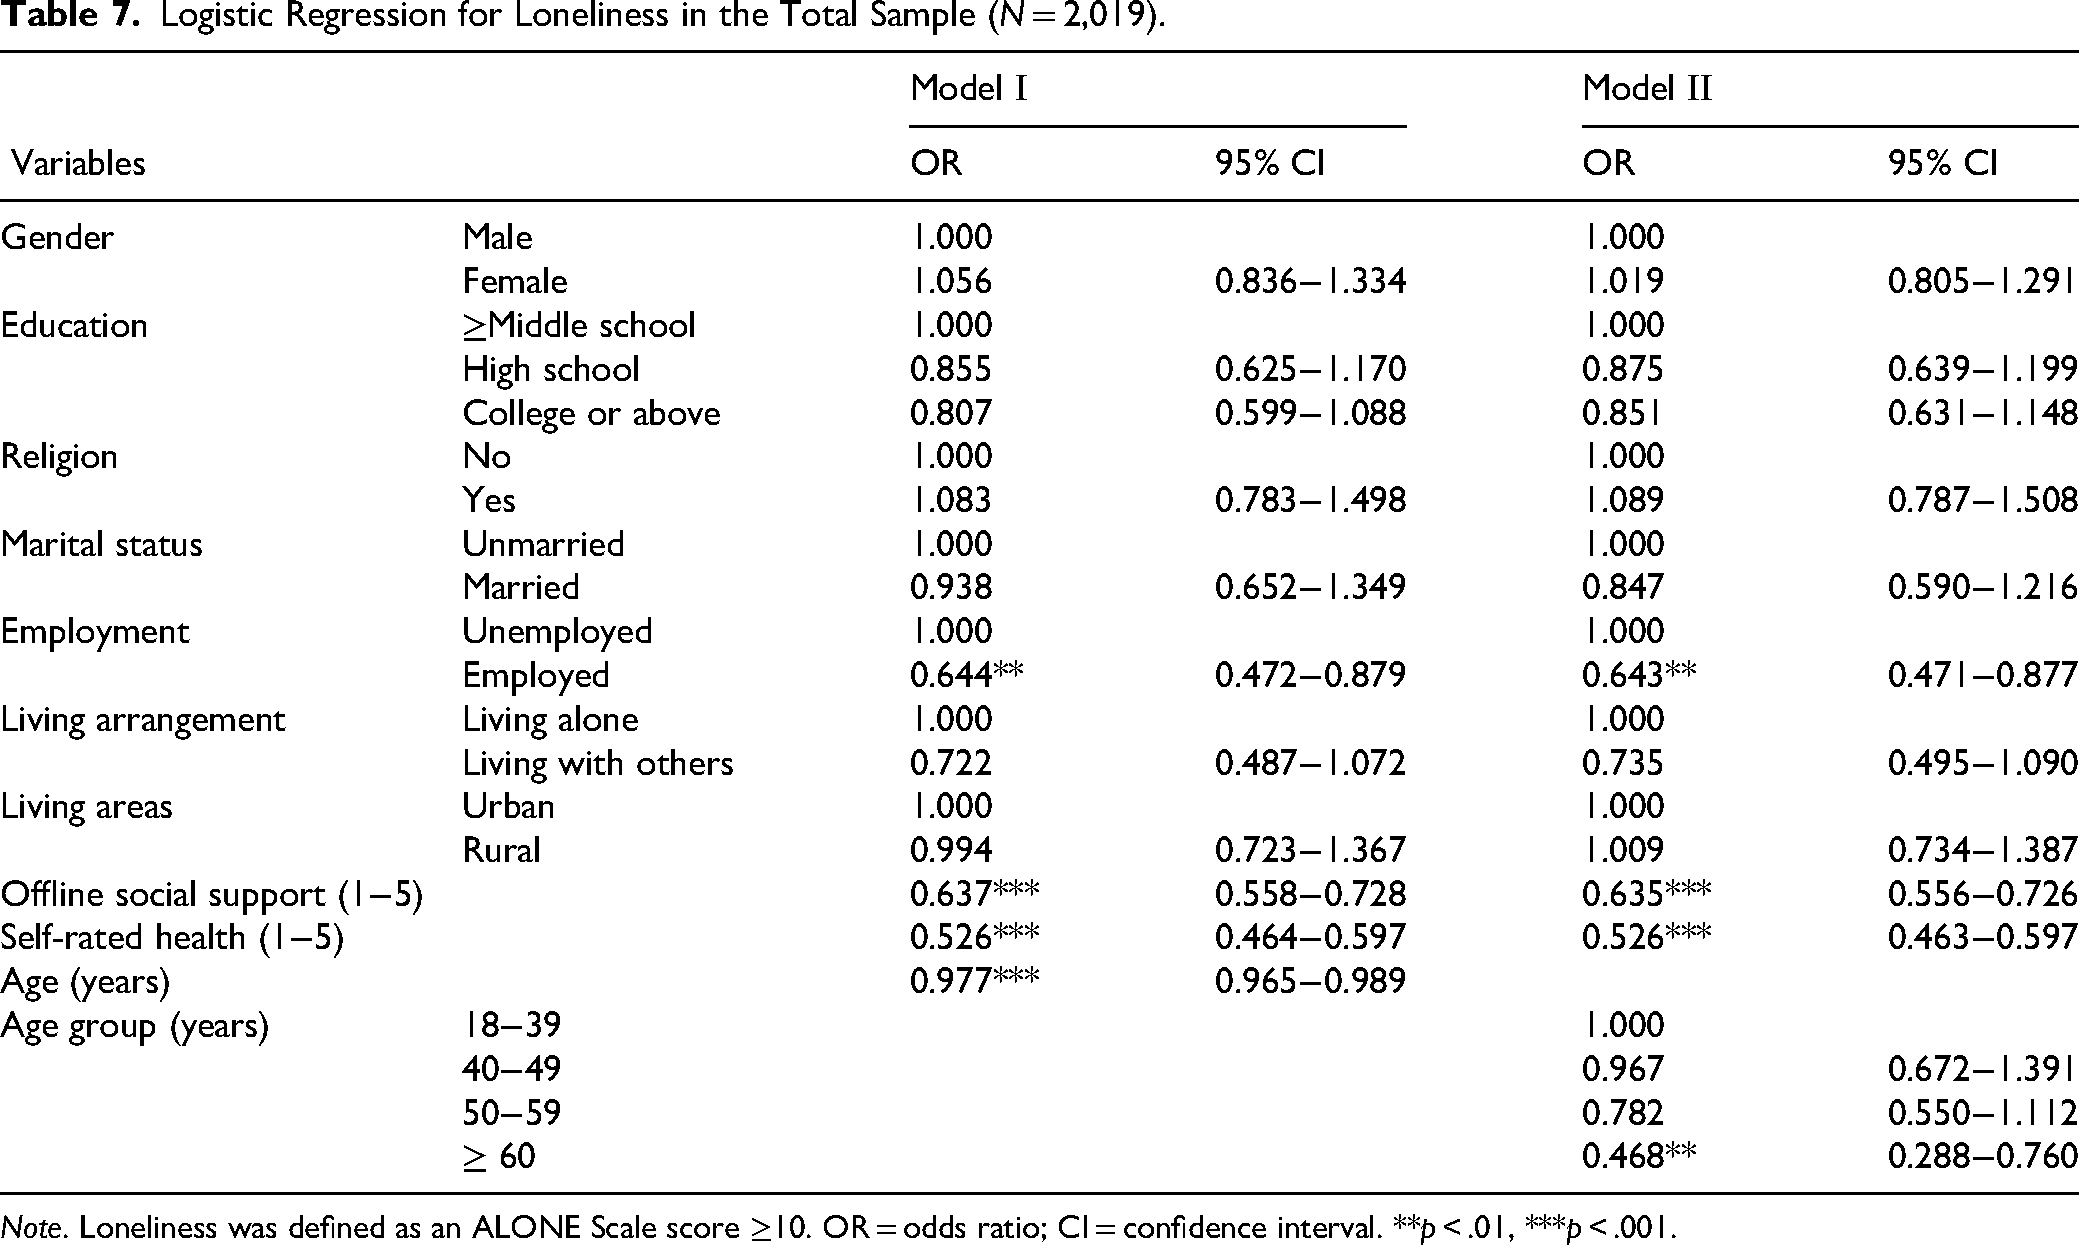
Note. Loneliness was defined as an ALONE Scale score ≥10. OR = odds ratio; CI = confidence interval. **p < .01, ***p < .001.
Discussion and Applications to Practice
This study is the first to validate the Chinese version of the ALONE Scale. It describes the psychometric properties with data from Chinese adults across a broad age range. It also highlights the association between age and loneliness in this population. Findings show that the Scale demonstrated minimally acceptable internal consistency (α = .600) and a moderate concurrent association with the ULS-8 (r = .606). ROC analysis identified a cutoff score of 10 (range: 5–15) for loneliness. Logistic regression indicated an inverse association between age and loneliness. The LOWESS analysis further suggested that loneliness may follow a nonlinear age-related pattern, with peak ages varying by gender.
Across the entire sample, the ALONE Scale demonstrated significant associations with conceptually relevant variables and no significant correlations with unrelated concepts such as post-retirement work attitudes, indicating satisfactory convergent and discriminant validity in measuring loneliness. The Scale showed a lower Cronbach's alpha than the ULS-8, consistent with a validation study conducted in clinical settings (Deol et al., 2022). The relatively low internal consistency suggests measurement error, which may increase the risk of false-negative or false-positive results in clinical practice. Even though the A-item and O-item showed relatively low corrected item–total correlations, deleting either item increased alpha only slightly. Thus, all five items were retained in this study to preserve the scale's original structure and content coverage.
Additionally, EFA found that two positively worded items (the A-item and the O-item) had relatively low factor loadings. One possible reason is the use of a mix of positively and negatively framed statements for a scale to reduce participants’ acquiescence bias. However, such a combination can compromise the Scale's reliability and validity, including undermining internal consistency and producing additional factors unrelated to the variables of interest (Chyung et al., 2018; Zeng et al., 2020). Another plausible explanation is cultural differences, particularly in Chinese society, where people value modesty and humility. Within this cultural context, individuals may be less inclined to agree with positively framed statements than with negatively framed ones. This tendency could contribute to a noticeable bias in response patterns (Zeng et al., 2020). We suggest using a follow-up study to include an additional variable to measure “belief in modesty” to confirm this explanation. If modesty correlates with low scores on the A-item and O-item, we would feel more confident to recommend changing the wording from a direct self-praise statement to an indirect observation: A-item—changing from “Are you emotionally Appealing to others as a friend?” to “Have others regarded you as emotionally Appealing as a friend?”; O-item—from “Are you Outgoing/friendly?” to “Have others perceived you as outgoing and friendly.”
To maximize the Youden index, the optimal cutoff score for detecting loneliness was 10, applicable to the entire sample and all age groups except older participants aged 60+. In the older age group, the Youden index reached its highest value at a cutoff score of 12; however, cutoff scores of 10, 11, and 12 yielded the same Sensitivity, suggesting that the higher cutoffs mainly improved Specificity rather than further increasing the identification of true-positive cases (Heinimaa et al., 2003). Although lower cutoff scores, such as 8 or 9, showed higher Sensitivity in the older age group, they also had substantially lower Specificity, thereby increasing the likelihood of false-positive cases. Therefore, a cutoff score of 10 could provide a reasonable balance between Sensitivity and Specificity while supporting a consistent screening threshold across age groups. Given the relatively small sample of older adults, these age-specific cutoff estimates should be interpreted with caution and confirmed in larger studies. It is important to note that the authors of the ALONE Scale used the UCLA-20 as the standard for ROC curve analysis, identifying an optimal cutoff score of 8 to identify severe loneliness among older adults aged 65+ (Deol et al., 2022). This discrepancy may primarily stem from differences in the scales of the standard ROC curves and in sample characteristics.
In this study, the overall ALONE score was 8.40 (SD = 2.05) for the entire sample and 7.71 (SD = 1.92) for the older sample (60+ years). These findings were higher than those reported for participants (65+ years) in Deol et al.'s (2022) study, where the ALONE score was 6.81 (SD = 1.84) for the community-dwelling group and 7.64 (SD = 2.24) for the nursing home group. Our results suggest that loneliness levels in the total sample and among Chinese older adults may be higher than those observed in Western countries. One possible explanation is that the survey data were collected during the COVID-19 pandemic lockdown, a period marked by restricted social interactions that may have increased loneliness. Further research is needed to confirm these findings in comparable samples.
We observed a nonlinear age distribution of loneliness, with elevated levels among young and middle-aged adults. In more detail, the adjusted distribution indicated that loneliness peaked at ages 25 and 50 in the total sample, at 19 and 43 in males, and at 28 and 53 in females. The peak in loneliness during middle adulthood contrasts with findings from some previous studies reporting higher loneliness among young and older adults than among middle-aged adults (Hawkley et al., 2022; Luhmann & Hawkley, 2016; Victor & Yang, 2012). However, this result aligns with another China-based study that identified an inverted U-shaped trajectory peaking at age 47 (Wang et al., 2023). Not surprisingly, adults in midlife can achieve the highest levels of accomplishment in many areas, including income and social status, throughout their lives. While they face multiple responsibilities and challenges across the workplace, family, and society (Kiesow et al., 2021; Wang et al., 2023), they also experience loneliness while facing continuous pressure from family and societal expectations. With family-oriented values, Chinese middle-aged adults are expected to take full responsibility for raising their children and supporting their parents. While filial piety is a central value within many Chinese families, particularly those that emphasize clan concepts, the social pension and parenting systems have yet to be expanded to include family caring for elders (Wang & Cao, 2023; Wang et al., 2023). In a fast-paced society, the majority of these individuals are in the workforce. With rapid economic development in China, middle-aged adults must strive for financial stability amid a highly competitive job market to meet the demands of parenting, caregiving, and their own retirement planning. These multiple roles and challenges can restrict opportunities and time for social interactions, which are crucial for maintaining social relationships, thereby increasing the risk of loneliness (Wang & Cao, 2023). Given that midlife is a complex and pivotal period in the life course and that empirical research on Chinese adults in midlife remains limited, additional evidence is needed to enhance our understanding of loneliness in this workforce demographic.
Beyond the primary scope of this study, gender was not significantly associated with loneliness, which is consistent with prior studies (Maes et al., 2019; Wang et al., 2023). Descriptively, however, peak loneliness appeared approximately 10 years later among women than among men. Gendered differences in social support may partly explain this pattern, as men tend to rely more heavily on their partners for emotional support, whereas women generally maintain broader social networks (Maes et al., 2019). Although this observed pattern was not tested statistically, it may have practical implications. Loneliness screening and intervention efforts may need to consider both life-course timing and gender. While Chinese men tend to be silent when they face personal issues, the brief ALONE Scale may therefore serve as a practical starting point for identifying loneliness-related experiences and facilitating conversations about social disconnection (Chan & Cheung, 2022).
Multivariable logistic regression also revealed a significant inverse association between age and loneliness. Compared with young adults aged 18–39 years, only older adults aged 60+ (not middle-aged adults) were less likely to report loneliness. This finding is consistent with several earlier web-based studies (Barreto et al., 2021; Shovestul et al., 2020). In contrast, some in-person studies found that, compared with middle-aged adults, younger and older adults reported higher levels of loneliness (Hawkley et al., 2022; Luhmann & Hawkley, 2016). Such discrepancies across studies may explain variations in loneliness measures, data collection methods, and sample characteristics.
Nevertheless, the confidence bands for the age distribution in later adulthood (75+) were wider than those for other age groups. This width may reflect increased heterogeneity in loneliness among older adults, consistent with findings from Luhmann and Hawkley's (2016) study. Given the relatively small sample size in this age group, the wider bands may also reflect reduced precision; therefore, data interpretations should acknowledge this. Future research is needed to replicate these findings with a larger sample of older adults, so that researchers can have sufficient data to compare across young–old, middle–old, and old–old groups.
This study has limitations. First, our participants were nonrandomly selected internet users, overrepresented by women, middle-aged adults, individuals with higher levels of education, and those living in urban areas, which may introduce sampling bias. It is essential for future research to verify these findings, especially using a representative sample. In addition, we caution against overgeneralizing our findings to non-Internet users. Another limitation is the reliance on self-reported data from online surveys. When conducting an interviewer-administered survey among the Chinese population, researchers must examine the Scale's psychometric properties. This study did not assess test–retest reliability because we could only compare age differences using cross-sectional data from a single cohort. It remains unclear whether the observed differences in loneliness are attributable to age effects or intergenerational variation. Future studies with multiple assessments could reaffirm its reliability across age groups. In addition, no gold standard is available for determining the optimal cutoff value. Using different standard scales would yield different optimal cutoff values, thereby limiting comparisons of loneliness levels. Given these limitations, the ALONE Scale needs further validation for use in Chinese society. We highly recommend a longitudinal study to disentangle age biases and cohort effects.
Conclusion
The ALONE Scale (Chinese) appears to be a practical tool for identifying loneliness among Chinese adults, with a recommended cutoff score of 10. The brevity and psychometric soundness of the translated Scale make it well-suited for large-scale surveys and routine screening. This study also revealed a nonlinear age distribution, with elevated loneliness among young and middle-aged adults, descriptively earlier peaks among men, and an inverse association between age and loneliness, highlighting that loneliness occurs before older adulthood. Social workers should apply clinical justice principles to this type of assessment to minimize age-related stigma. The first principle is to integrate age-sensitive loneliness screening into social work practice and to develop targeted interventions across the life course, including within the middle-aged, young–old, middle–old, and old–old groups, when comparing loneliness interventions.
Footnotes
Ethical Considerations
This study involved a secondary analysis of de-identified data and received an exempt status from the University of Houston Institutional Review Board. The data owners’ institutional ethics committee approved the original data collection, and the data were collected anonymously, with participants providing no further contact information.
Consent for Publication
Not applicable.
Author Contributions
Y.M., X.C., and G.M. designed this study and collected the data. Y.M. and X.C. analyzed the data and drafted the manuscript. Y.M., X.C., M.B.W., and T.K.M. validated the Scale. P.L., Y.M., and M.C. evaluated the data and edited the manuscript. All authors contributed to the development of the manuscript and approved the final draft.
Funding
The authors received no financial support for the research, authorship, and/or publication of this article.
Declaration of Conflicting Interests
The authors declared no potential conflicts of interest with respect to the research, authorship, and/or publication of this article.
Data Availability Statement
Data used in the current study are available from the principal investigator with permission.