
Abstract
Symptom management at the end of life relies heavily on medications. For this reason, pharmacists are an ideal addition to the interdisciplinary hospice team (IDT). The aim of this study is to characterize the utilization of pharmacists in hospices from the hospice administrator and pharmacist perspectives and to determine the impact utilization has on per diem medication requirement and costs. Surveys were sent to 2824 hospice administrators and 658 pharmacists to obtain their perceptions on what clinical, administrative, and dispensing services were being performed. Responses were returned by 9.4% of administrators and 12.6% of pharmacists. The majority of administrators and pharmacists reported a mix of clinical, administrative, and dispensing responsibilities. Medication requirements and costs were not significantly impacted as the administrator’s perception of pharmacist clinical, administrative, or dispensing time increased from 0% to 100%.
Background
Today there are over 5000 hospice organizations providing care to more than 1.5 million patients. 1 The management of patient symptoms at the end of life is heavily based on medication use, and for this reason, pharmacists are an ideal addition to the interdisciplinary hospice team (IDT). 2 Despite this fact, little is known as to what extent pharmacist services are currently being utilized by hospice organizations around the nation.
A previous survey by Berry et al conducted in 1981 established a baseline view of pharmacist activity within hospice organizations. 3 Out of 75 operational hospices, 48 responded and 77% confirmed that a pharmacist was affiliated with their organization. At that time, pharmacists predominantly acted in a consultant role and less than 50% were considered IDT members.
In 1993, Arter et al surveyed 577 pharmacists either working with a hospice or having an interest in hospice care. 4 Of the 52 respondents, most defined their role as consulting and 75% indicated being involved in the IDT. Notably, a large portion indicated they were providing “less traditional” services such as nursing home and hospital visits and being on call during normal business hours for consultation.
Over the past 25 years of hospice growth, the scope of pharmacist services in hospice care has been extensively characterized. 2 -16 Formally, the American Society of Health-System Pharmacists has defined the role of the hospice and palliative care pharmacist in a consensus statement. 17 The types of services provided by hospice pharmacists can be broadly generalized as distribution/dispensing, consultation/clinical, and administrative services. Dispensing duties include stocking, delivering, and compounding medications. Clinical responsibilities include participation in IDT meetings, medication monitoring and regimen review, symptom management consultation, drug information dissemination, protocol development, clinical research, and student mentoring. Administrative responsibilities include participating in Pharmacy and Therapeutics (P&T) and quality assurance committees, developing standing orders and medication use policies, and performing medication efficacy and cost analyses. The pharmacist’s role within each organization varies and can include responsibilities from one or more categories.
The Center for Medicare and Medicaid Hospice Conditions of Participation mandate a comprehensive medication review upon admission to a hospice program and at least every 14 days thereafter to receive reimbursement for services. 18 Interestingly, the medication reviews are not required to be conducted by a pharmacist and may be completed by or in conjunction with any individual that has “education and training” in medication management. This latter point is relevant because pharmacists have been shown to reduce costs and enhance patient outcomes in hospice organizations by ensuring appropriate medication use. 19 -22
Overall, the use of pharmacist services in the hospice setting has not been reviewed in over 15 years. Thus, it is not well understood what clinical, administrative, and dispensing services hospice administrators believe their pharmacists to be performing or what roles the pharmacists report to be performing. It was our intention to update the hospice community on these matters and provide the first data assessing the impact of various pharmacist service models on medication use and cost. Therefore, we conducted this study to (1) identify hospice administrator perspective on pharmacist utilization, (2) identify pharmacist perspective on their utilization, (3) assess concordance between administrator and pharmacist perspectives, (4) identify factors associated with pharmacists being utilized in clinical, administrative, or dispensing roles, and (5) determine whether increasing clinical, administrative, and/or dispensing roles are associated with reduced per diem medication burden and cost.
Methods
Survey Administration
In coordination with the National Hospice and Palliative Care Organization (NHPCO), a survey invitation was sent to 2824 administrators that were members of NHPCO. Administrators were asked to provide contact information for the pharmacists that provide services to their hospice. The pharmacist contact information obtained from the administrator survey was then cross-referenced with the NHPCO pharmacist membership directory and invitations sent out to 658 pharmacists. The protocol was approved by the University at Buffalo Social and Behavioral Sciences Institutional Review Board (Amherst, New York).
Administrator Survey
The administrators were first surveyed for the demographic characteristics of their hospice (geographic location, agency type, tax status, years in operation, location of care provided, geographic setting, population of area served, daily patient census, affiliations, types of pharmacist on staff, contractual status with prescription benefits manager (PBM), professionals conducting medication reviews, and Medicare certification status). Second, from a predetermined list of options, administrators were asked to provide a description of clinical (18), administrative (10), and dispensing activities (8) performed by their pharmacists. Third, administrators were directed to assign a 0 to 10 score for the clinical, administrative, and dispensing involvement of the pharmacist (0 = not at all involved and 10 = very involved). Lastly, from predetermined ranges, administrators were asked to provide an estimate of the average per diem number of medications and medication costs.
Pharmacist Survey
The pharmacists were first asked to provide information on their practice location and professional history (geographic location, position, years of experience with hospice, postgraduate year (PGY)-1 residency completion, PGY-2 residency completion, formal hospice training, degrees, and certifications). Second, from the same predetermined list of clinical, administrative, and dispensing options presented to the administrators, the pharmacists were asked to provide perspective on their services. Third, from a predetermined list of options, pharmacists were directed to cumulate the percentage of their time spent in each of the clinical, administrative, and dispensing roles (0%, <25%, 25%-50%, 51%-75%, >75%, and 100%).
Administrator Outcomes
Hospice demographic data and administrator perception of clinical, administrative, and dispensing services performed were aggregated and frequencies reported. From the scores assigned to clinical, administrative, and dispensing involvement by the administrator an “involvement percentage” was assigned to each function by dividing each score by the sum of all 3 scores. For example, if the administrator rated the clinical involvement of the pharmacist as a 6, administrative involvement as a 2, and dispensing involvement as a 5, the clinical involvement percentage was calculated as 6 ÷ (6 + 2 + 5) × 100% = 46%. This percentage was used to identify statistical associations between the hospice demographic data and the clinical, administrative, and dispensing involvement of the pharmacist. To determine the impact of increasing percentage clinical, administrative, and dispensing time on the number of per diem medications and medication cost the involvement percentages were grouped and assessed for statistical associations with the per diem medications and cost data obtained from the administrator survey. The type of pharmacist model used (PBM use, pharmacist on staff, or both) were assessed for statistical association with per diem medication costs and patient medication burden.
Pharmacist Outcomes
Pharmacist information about their practice location and professional history were aggregated and frequencies reported. The percentage time designations attributed to clinical, administrative, and dispensing functions by the pharmacist were assessed for statistical associations with the practice location and professional history.
Comparison of Administrative and Pharmacist Outcomes
Nine hospice administrator and pharmacists were successfully matched through information provided on the name and location of the hospice. From these 9 hospices, administrator responses on the clinical, administrative, and dispensing services provided by the pharmacist were assessed for concordance with pharmacist responses.
Statistical Analysis
Hospice demographic information, pharmacist professional information, and administrator and pharmacist perspective on clinical, administrative, and dispensing services were tabulated and presented as frequencies. Statistical assessment for associations between hospice characteristics and the percentage clinical, administrative, and dispensing involvement designated by the administrator were conducted via the student t test or analysis of variance, where appropriate. Statistical association between the pharmacist’s practice location and professional history and clinical, administrative, and dispensing time were conducted via the Kruskal-Wallis or Mann-Whitney tests, where appropriate. The impact of increasing percentage clinical, administrative, and dispensing time (administrator perspective, grouped) on per diem medications and costs (mean value of selected range) were assessed by analysis of variance. The impact of pharmacist model on per diem medications and costs were assessed by analysis of variance. Concordance between administrator and pharmacist perspectives on each clinical, administrative, and dispensing service performed reported as frequencies due to the small sample size.
Results
Survey Response
Following the distribution of the administrator and pharmacist surveys, 267 and 83 usable responses were returned for a response rate of 9.4% and 12.6%, respectively. Surveys that were returned with a significant amount of information unanswered were discarded.
Administrator Responses
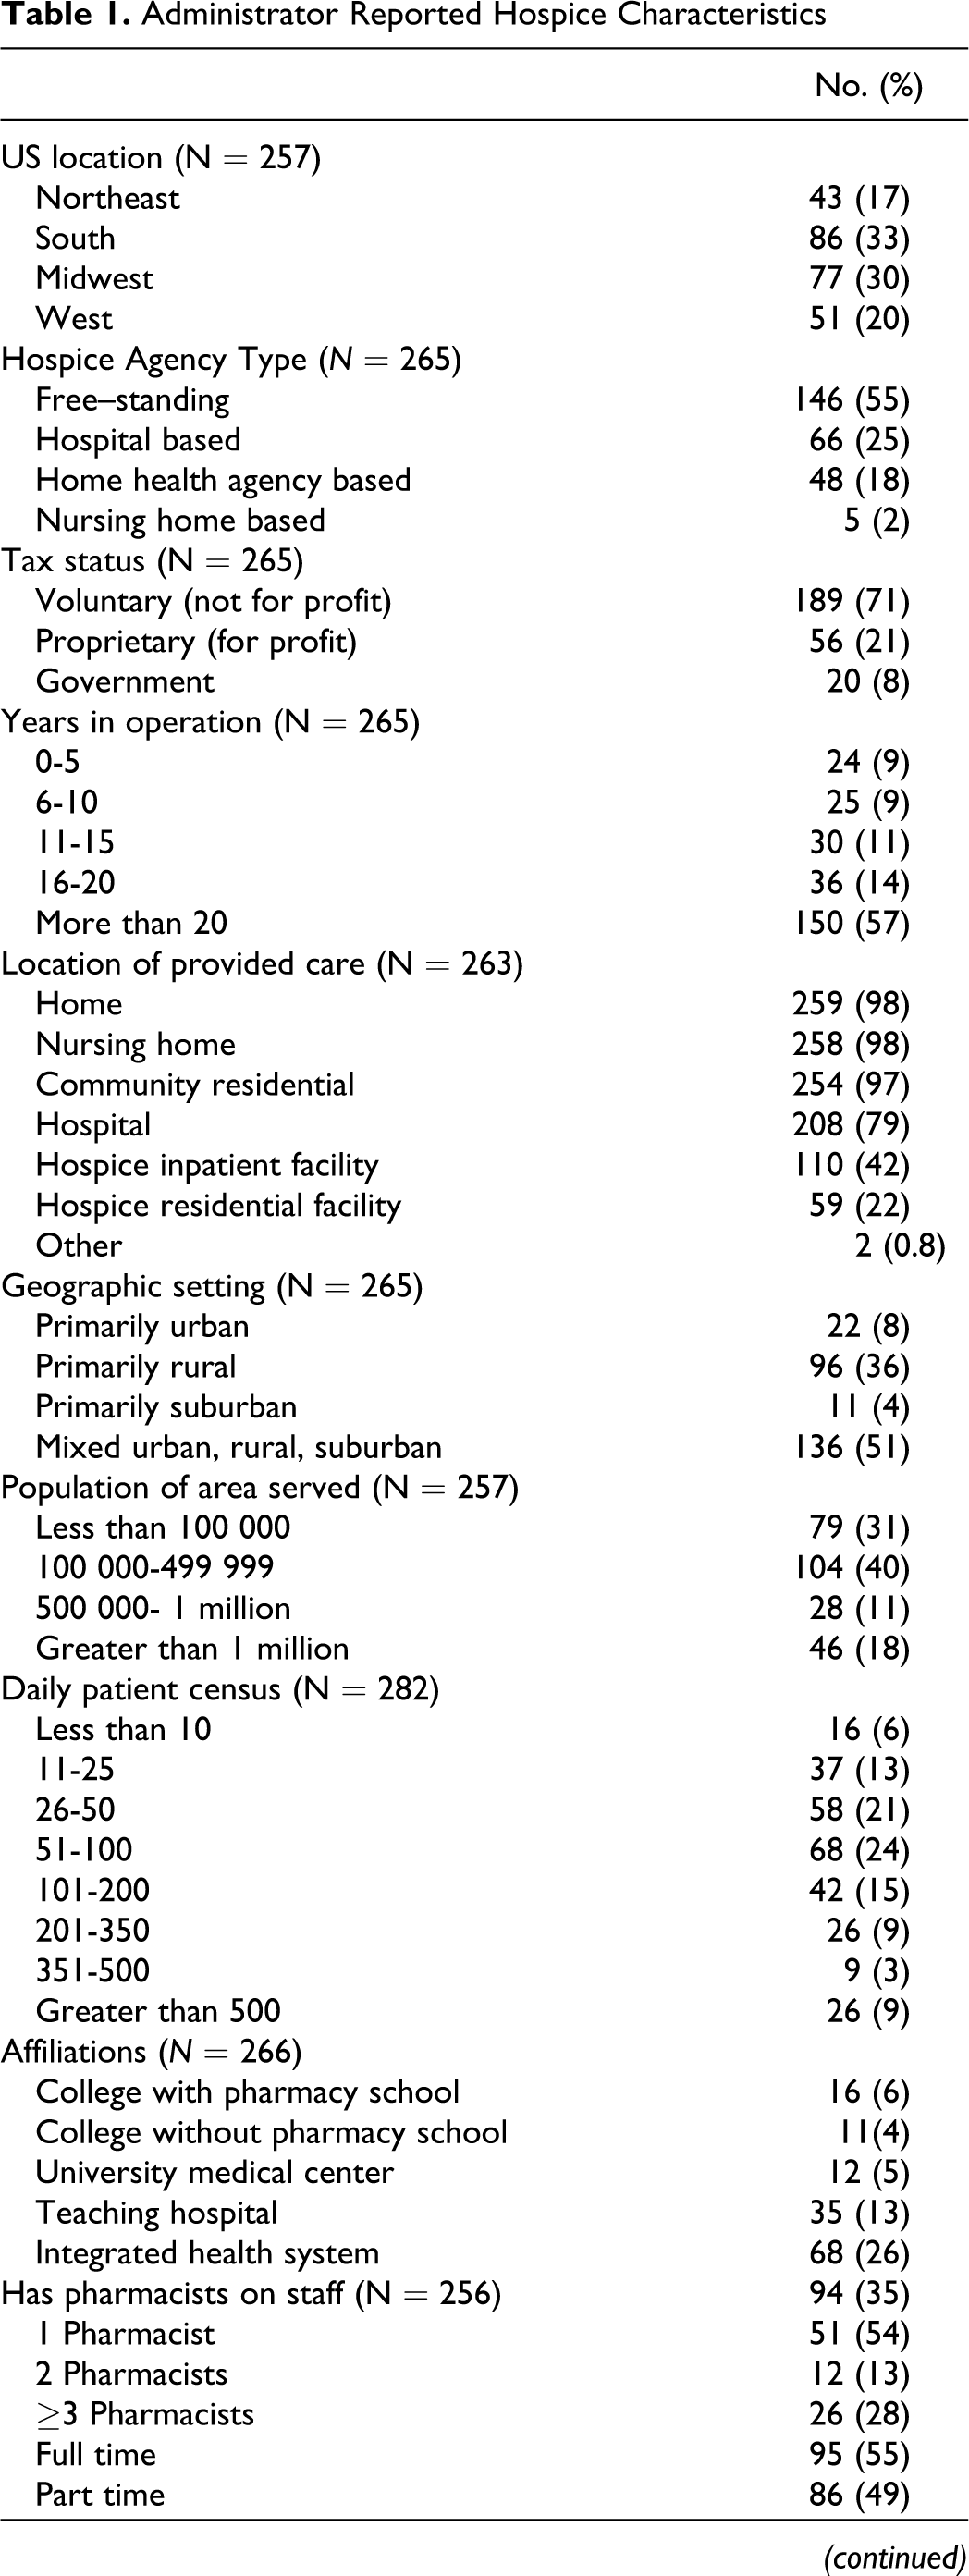
The hospice characteristics of the administrators responding to the survey are presented in Table 1. Response from around the United States was similar, with location defined by the US Census Bureau. The majority of hospices were nonprofit, freestanding organizations in operation for ≥20 years. All but 3 were Medicare certified. Notably, the majority of hospices confirmed the use of a PBM for pharmacist services, while only 35% reported a pharmacist on staff. Medication reviews were performed by a pharmacist in 80% of hospice organizations. The remaining 20% not conducting medication reviews with a pharmacist used physicians (75%) and nurse case managers (55%). The most commonly reported barrier to using a pharmacist was cost (28%), followed by lack of need due to another practitioner being capable of performing the review (24%), inadequate pharmacist experience (8%), and lack of awareness of services pharmacists can provide (3%).
Administrator Reported Hospice Characteristics
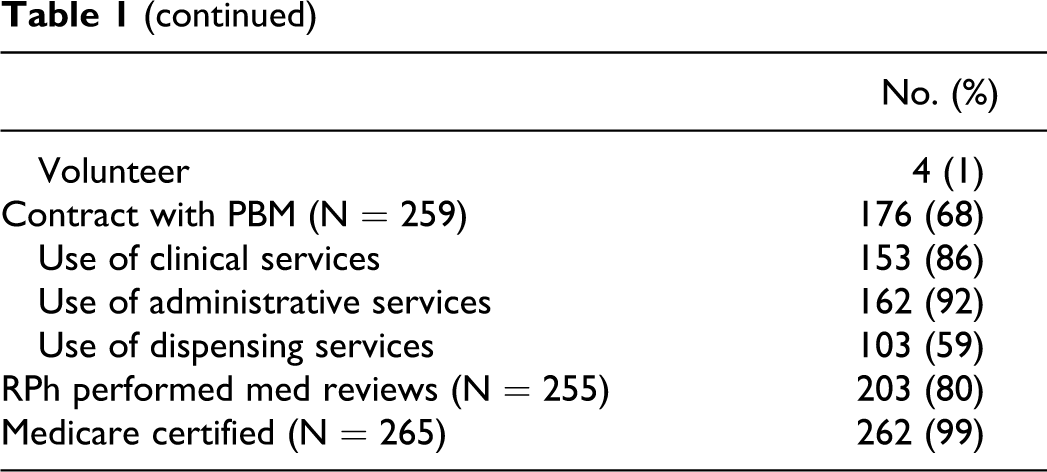
The administrator’s perception of clinical, administrative, and dispensing services are presented in Table 2. Clinical activities reported in ≥50% of administrator respondents were the development of medication use protocols, in-services, drug information dissemination, formal consultation for symptom management, over-the-counter recommendations, general recommendations on symptom management, and on call status. Administrative services most commonly reported were drug utilization, cost avoidance and cost-effectiveness evaluations (61%), formulary management (47%), and medication use policies and procedures (47%). Dispensing services including general recommendations on available drug products (69%), medication dispensing (64%), compounding (63%), and home delivery (59%), were commonly reported.
Administrator Description of Pharmacist Activitiesa
a N = 267.
The calculated mean clinical, administrative, and dispensing involvement from the administrator perspective were 6.6 ± 2.9, 4.5 ± 3.2, and 6.7 ± 3.9, respectively. Hospice characteristics significantly associated with clinical, administrative, and dispensing involvement of the pharmacist were the US location, hospice agency type, years of operation, geographic setting, daily patient census, affiliation with a pharmacy school or university medical center, and hospice inpatient and residential care units.
Pharmacist clinical involvement percentage tended to be higher in the Midwestern and Western states (33% [NE], 36% [S], 42% [MW], and 41% [W]; P = .031), while dispensing time tended to be lower in these states (46%, 38%, 32%, and 32%; P = .007). Hospices affiliated with a university medical center had increased pharmacist clinical involvement (50% vs 38%; P = .034) and less dispensing involvement (17% vs 38%; P = .005).
Administrative involvement percentage tended to be greater in freestanding hospices in comparison to hospital-based, home health agency–based, or nursing home-based hospices (26%, 21%, 19%, 22%, respectively; P = .027). Hospices operational for 6 to 10 years tended to demonstrate greater pharmacist clinical involvement than those operational less than 6 years or more than 10 years (22% [0-5], 30% [6-10], 18% [11-15], 22% [16-20], 24% [>20]; P = .021). Administrative involvement tended to increase (19% [<10], 18% [11-25], 19% [26-50], 26% [51-100], 24% [101-200], 26% [201-350], 26% [351-500], 33% [>500]; P = .019) and dispensing time decrease (46% [<10], 45% [11-25], 37% [26-50], 34% [51-100], 40% [101-200], 32% [201-350], 27% [351-500], 28% [>500]; P = .019) as the daily patient census increased. Hospices affiliated with a school of pharmacy also showed significantly increased administrative involvement (38% vs 23%; P < .001) and less dispensing involvement (17% vs 38%; P < .001) versus those without affiliation. Likewise, hospices that provide patient care at their own freestanding inpatient and residential facilities were significantly associated with increased administrative and decreased dispensing pharmacist involvement (29% vs 22%; P < .006 and 31% vs 39%; P < .02, respectively) versus hospices that do not.
Pharmacist Responses
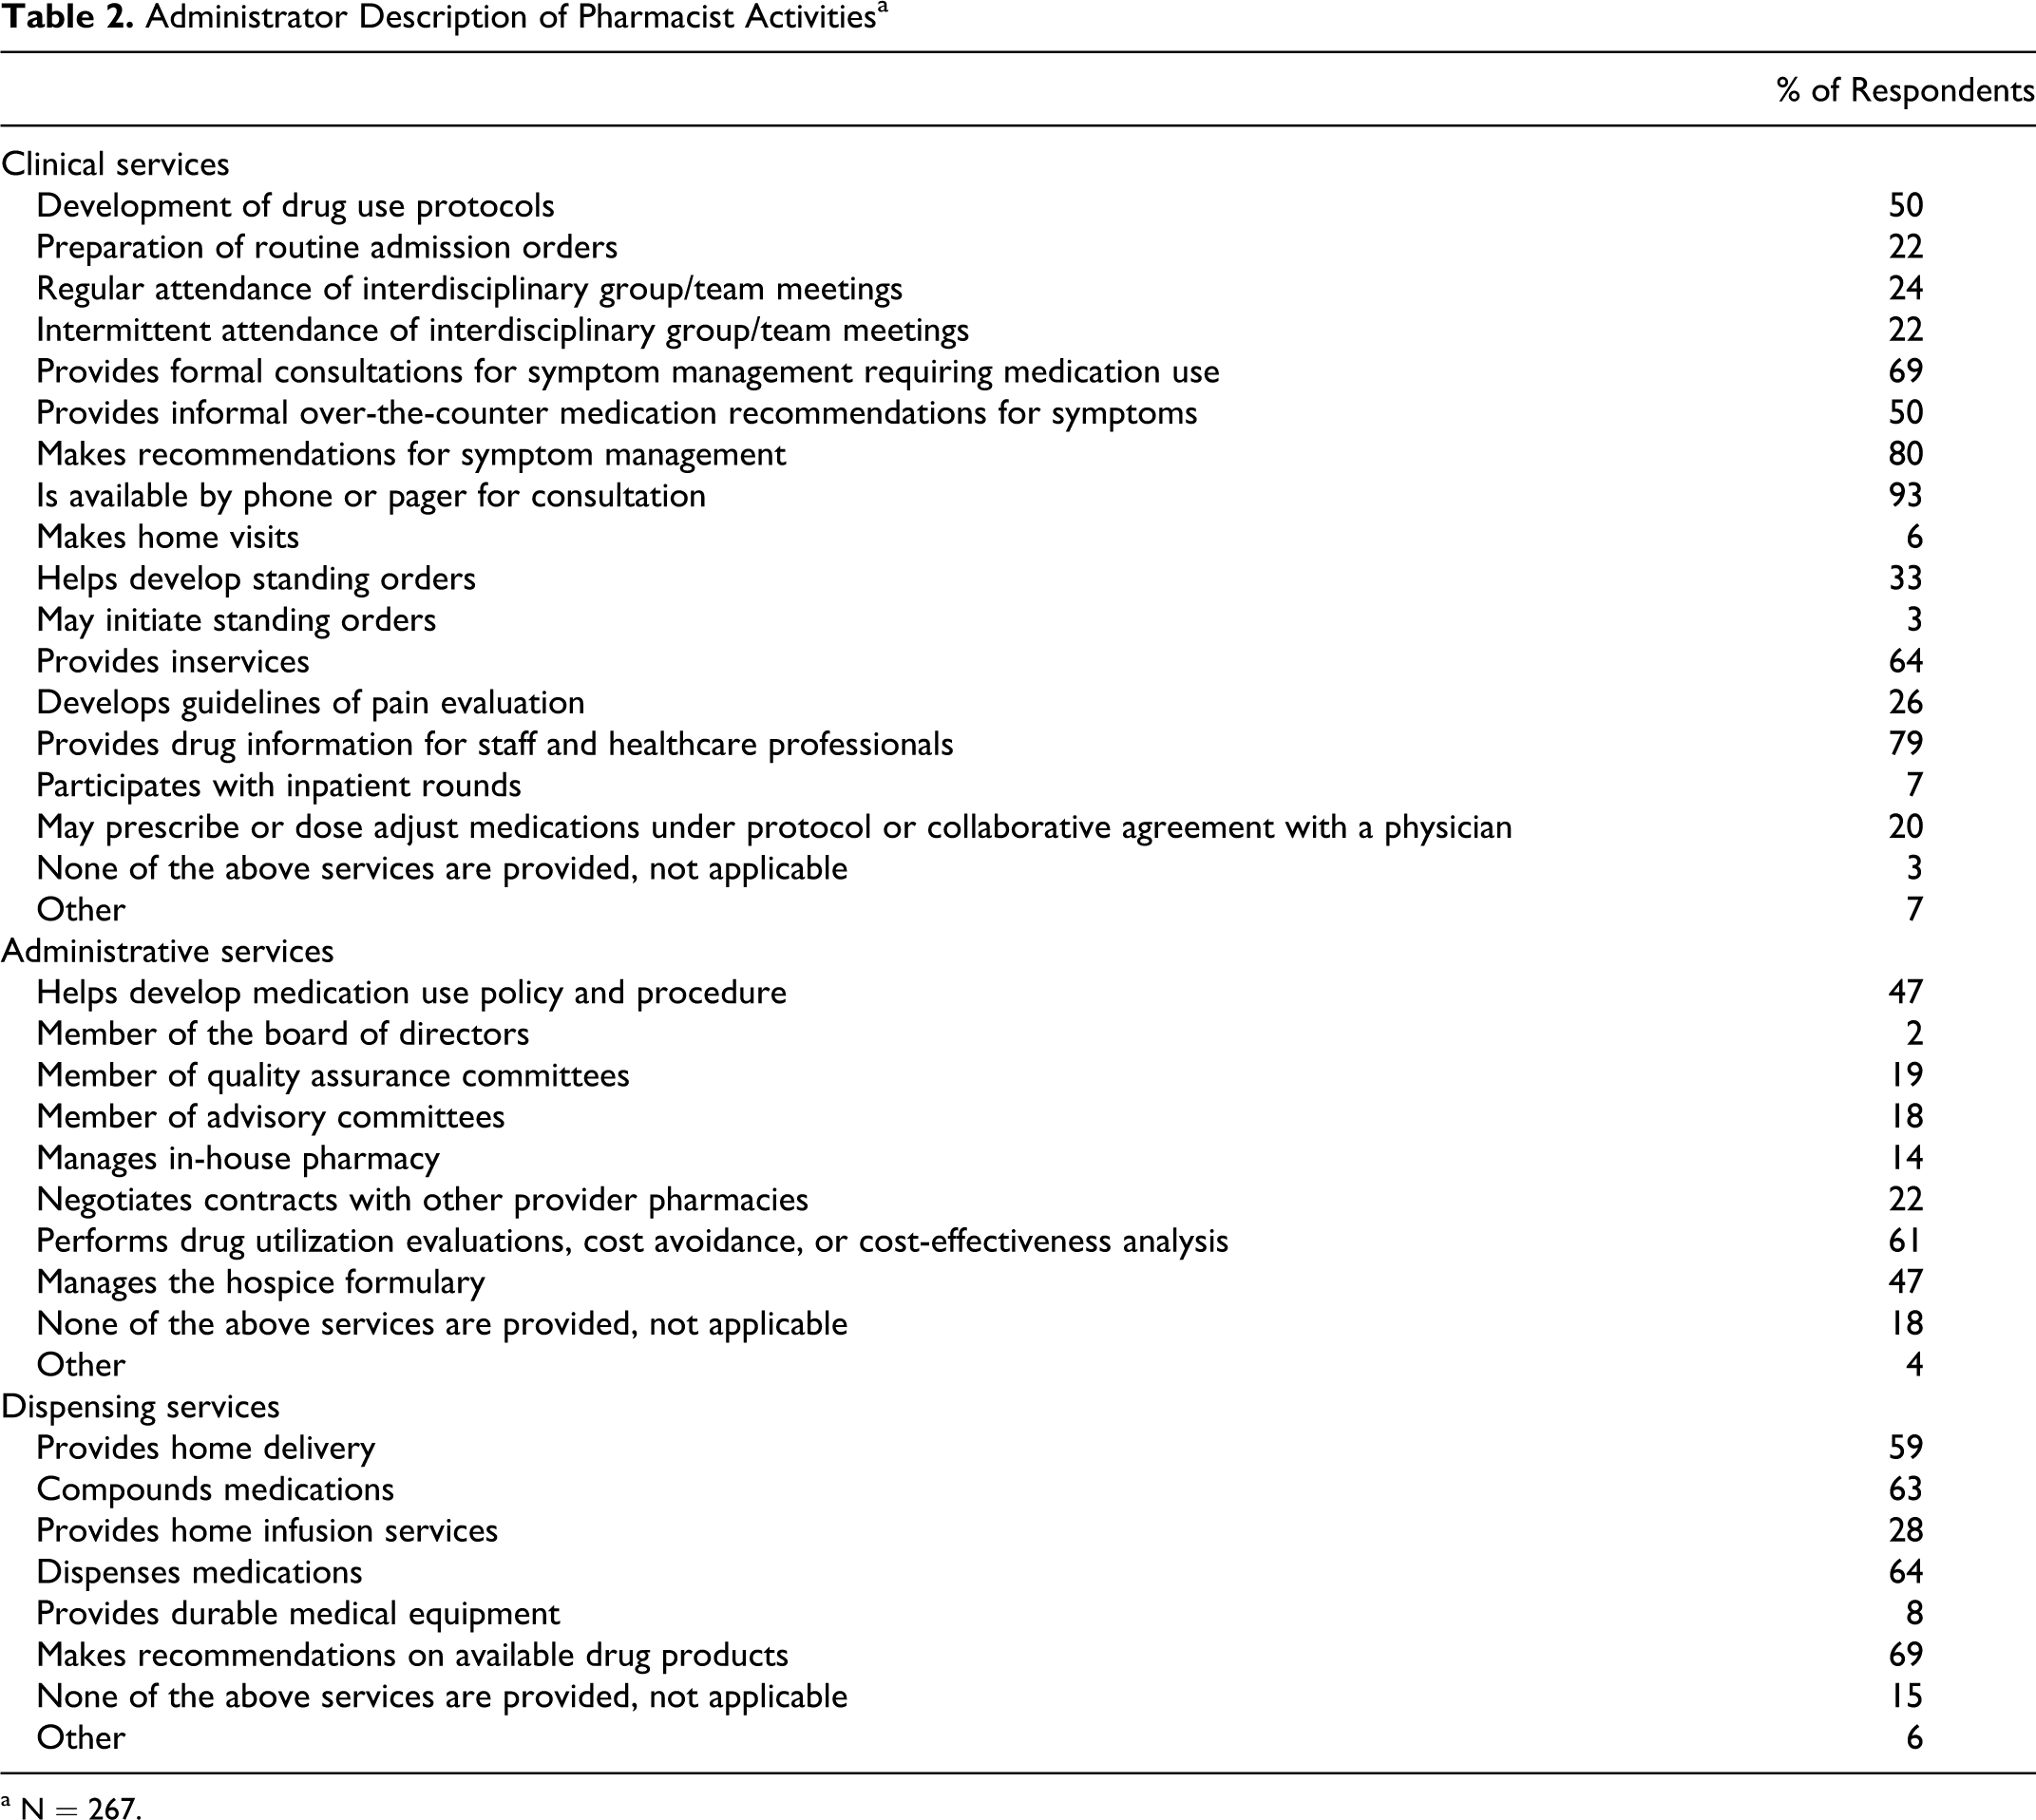
The practice location and professional history for pharmacist respondents are presented in Table 3. Respondents were well distributed from across the country. The majority of pharmacists were pharmacy provider employees (19%), academic/clinical pharmacists (30%), or part-time hospice employed pharmacists (19%) with ≤10 years of hospice experience. Few pharmacists completed PGY-1 residency training (23%) and even fewer completed PGY-2 training (5%). Only 12% were certified in geriatrics and 10% were board-certified pharmacotherapy specialists. Less than 20% of pharmacists providing services to hospice reported formal training in hospice care.
Pharmacist Reported Practice Location and Professional Characteristics
The pharmacist’s perception of clinical, administrative, and dispensing services are presented in Table 4. Clinical activities reported by >50% of respondents included development of drug use protocols, formal and over-the-counter recommendations for symptom management, development of the hospice’s standing orders, ability to initiate standing orders, on call for consultation, and provision of drug information. The most commonly reported administrative activities are development of medication use policy and procedure (61%), drug utilization evaluation, cost avoidance, and cost-effectiveness analyses (60%), and formulary management (45%). Of the dispensing activities, recommendations on availability of drug products and the physical act of dispensing medications (68% and 48%, respectively) were reported most often.
Pharmacist Perception of Services Performeda
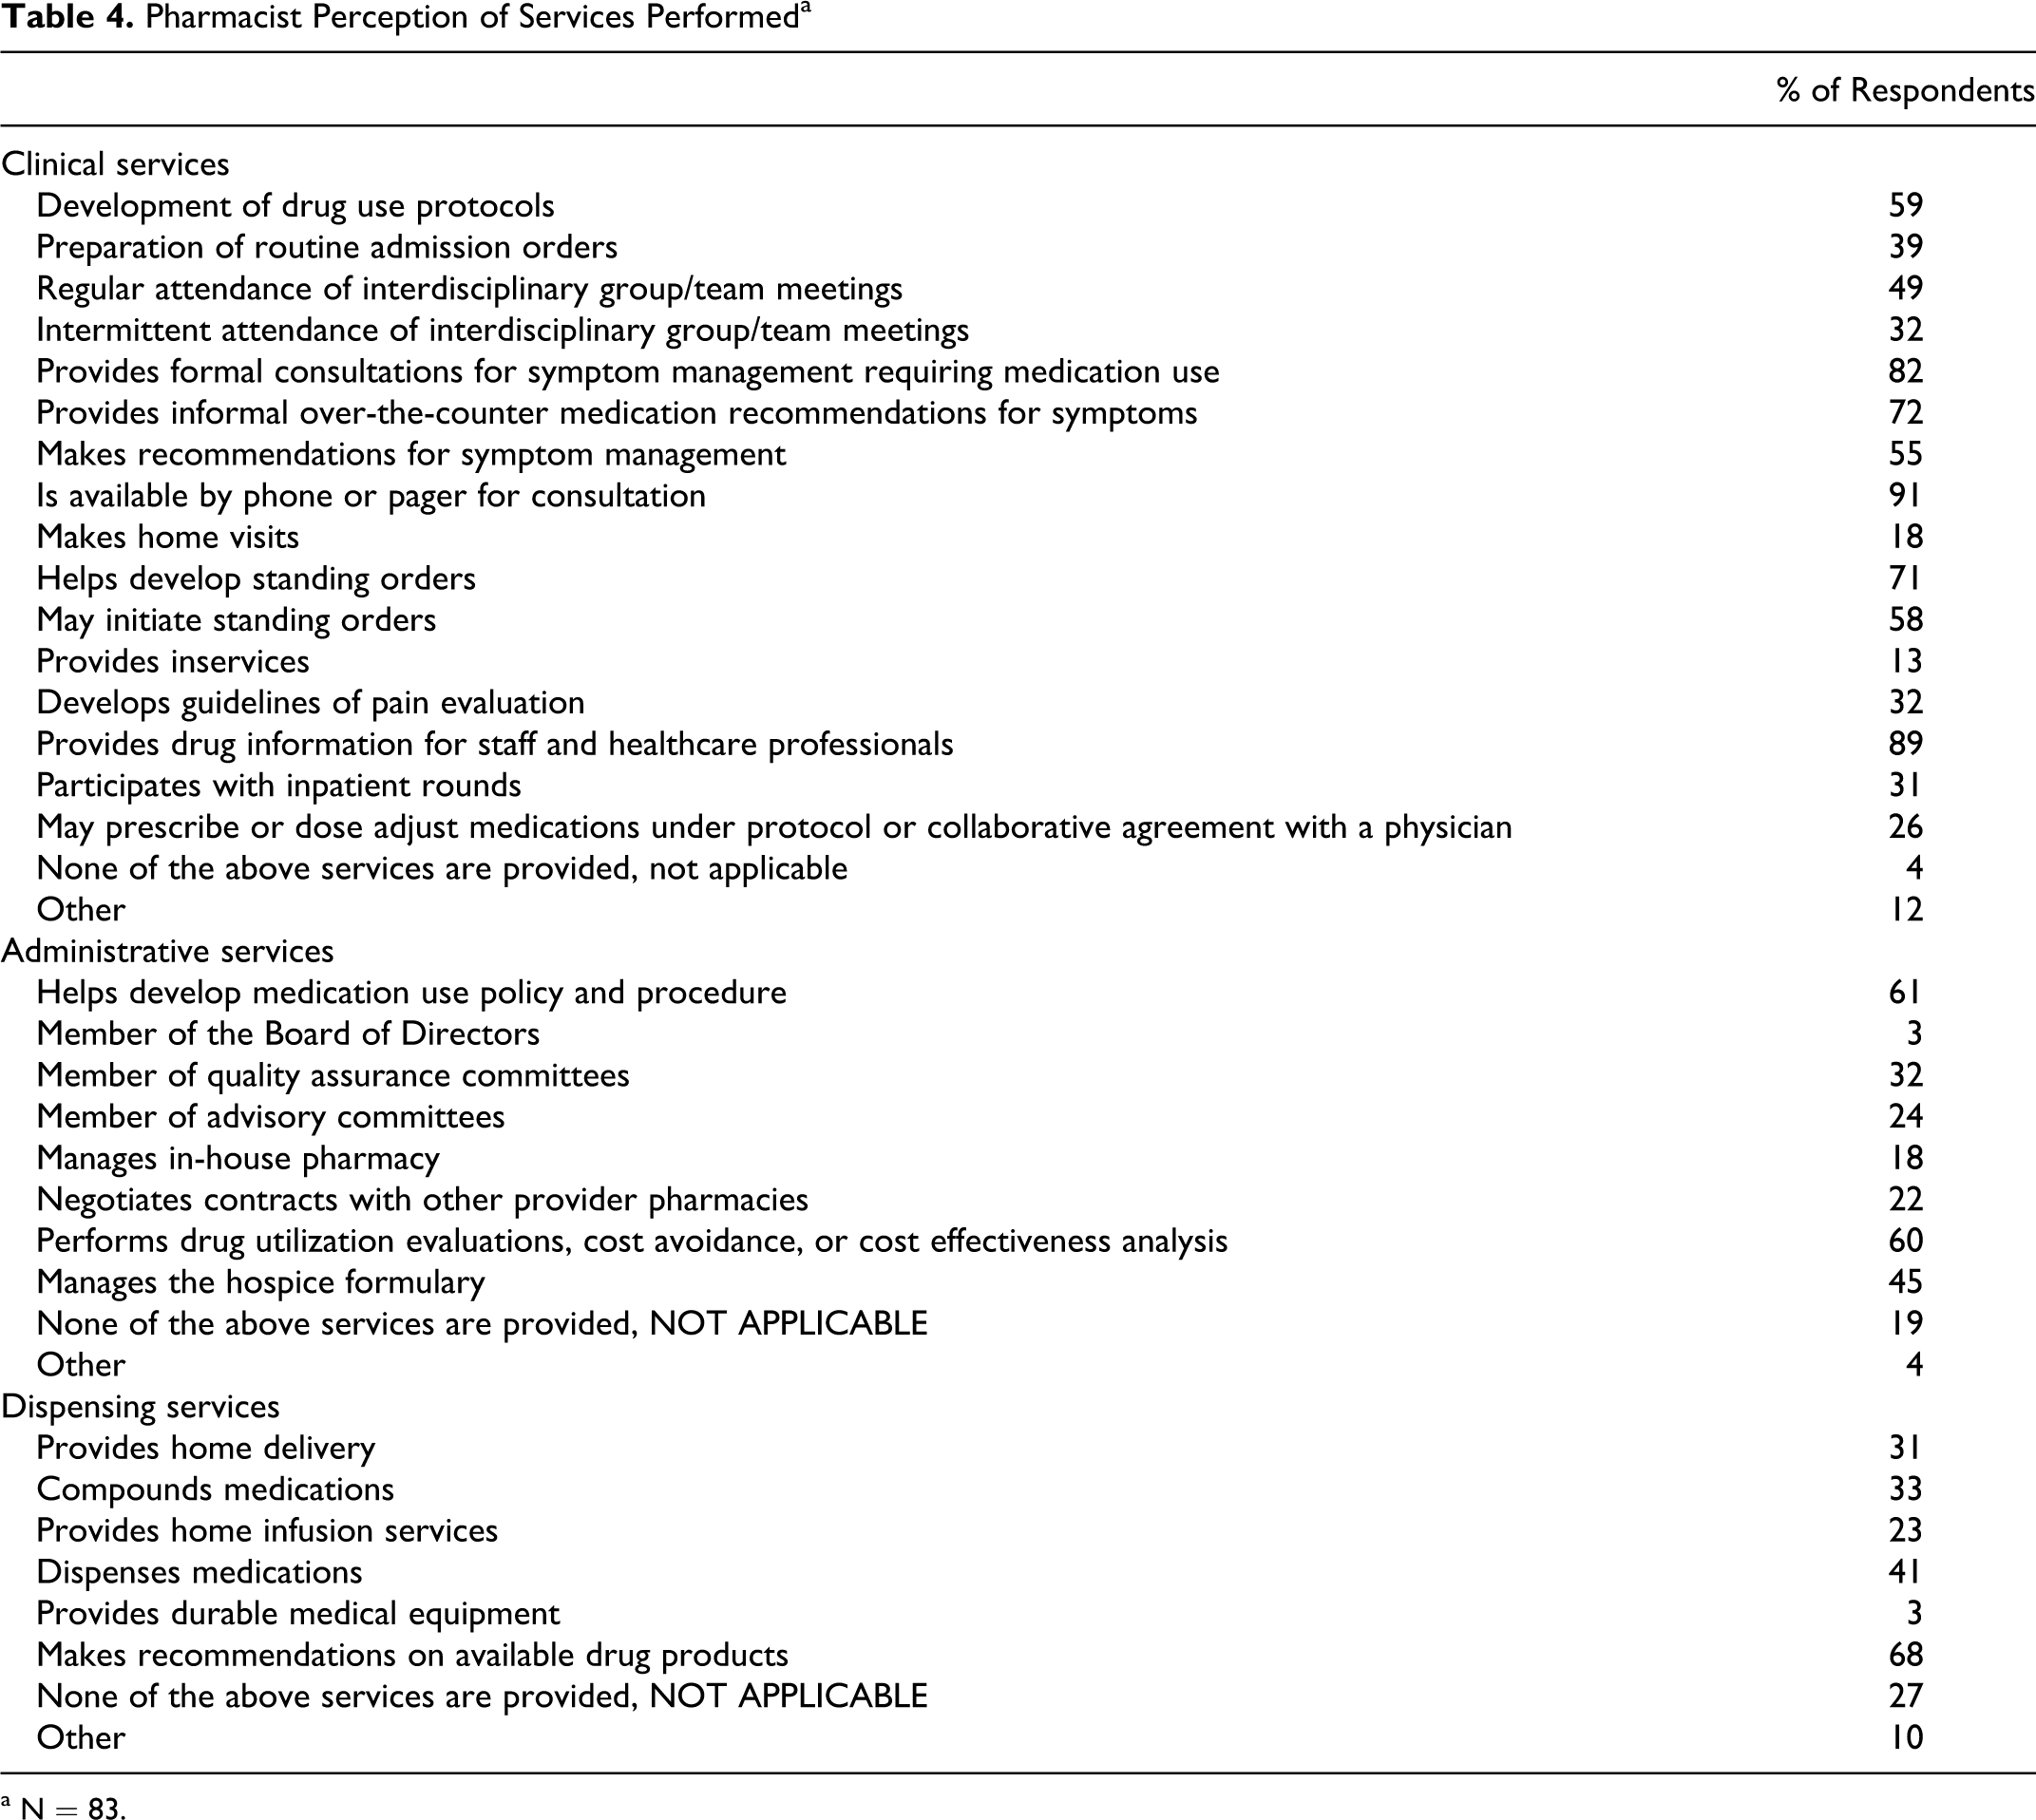
a N = 83.
The pharmacist’s perspective of their time spent performing clinical, administrative, and dispensing services are presented in Figure 1. With the exception of the 0% time category, the frequency of responses for all other time categories was evenly distributed (2% [0%], 19% [<25%], 17% [25%-50%], 23% [51%-75%], 23% [>75%], 16% [100%]). Greater than 70% of pharmacists reported spending less than 25% of their time performing dispensing functions. Similarly, greater than 65% reported spending less than 25% of their time performing administrative functions. Professional characteristics significantly associated with pharmacist time performing clinical, administrative, and dispensing functions were (1) residency training - less time performing dispensing services (<25% vs 25%-50%; P = .011) and (2) formal hospice training—more time-performing clinical activities (>75% vs 50%-75%; P = .020) and less time-performing dispensing activities (0% vs <25%; P = .026). Pharmacists located in the Midwest also tended to spend more time performing clinical services (50%-75% [NE], 25%-50% [S], >75% [MW], and 50%-75% [W]; P = .047).
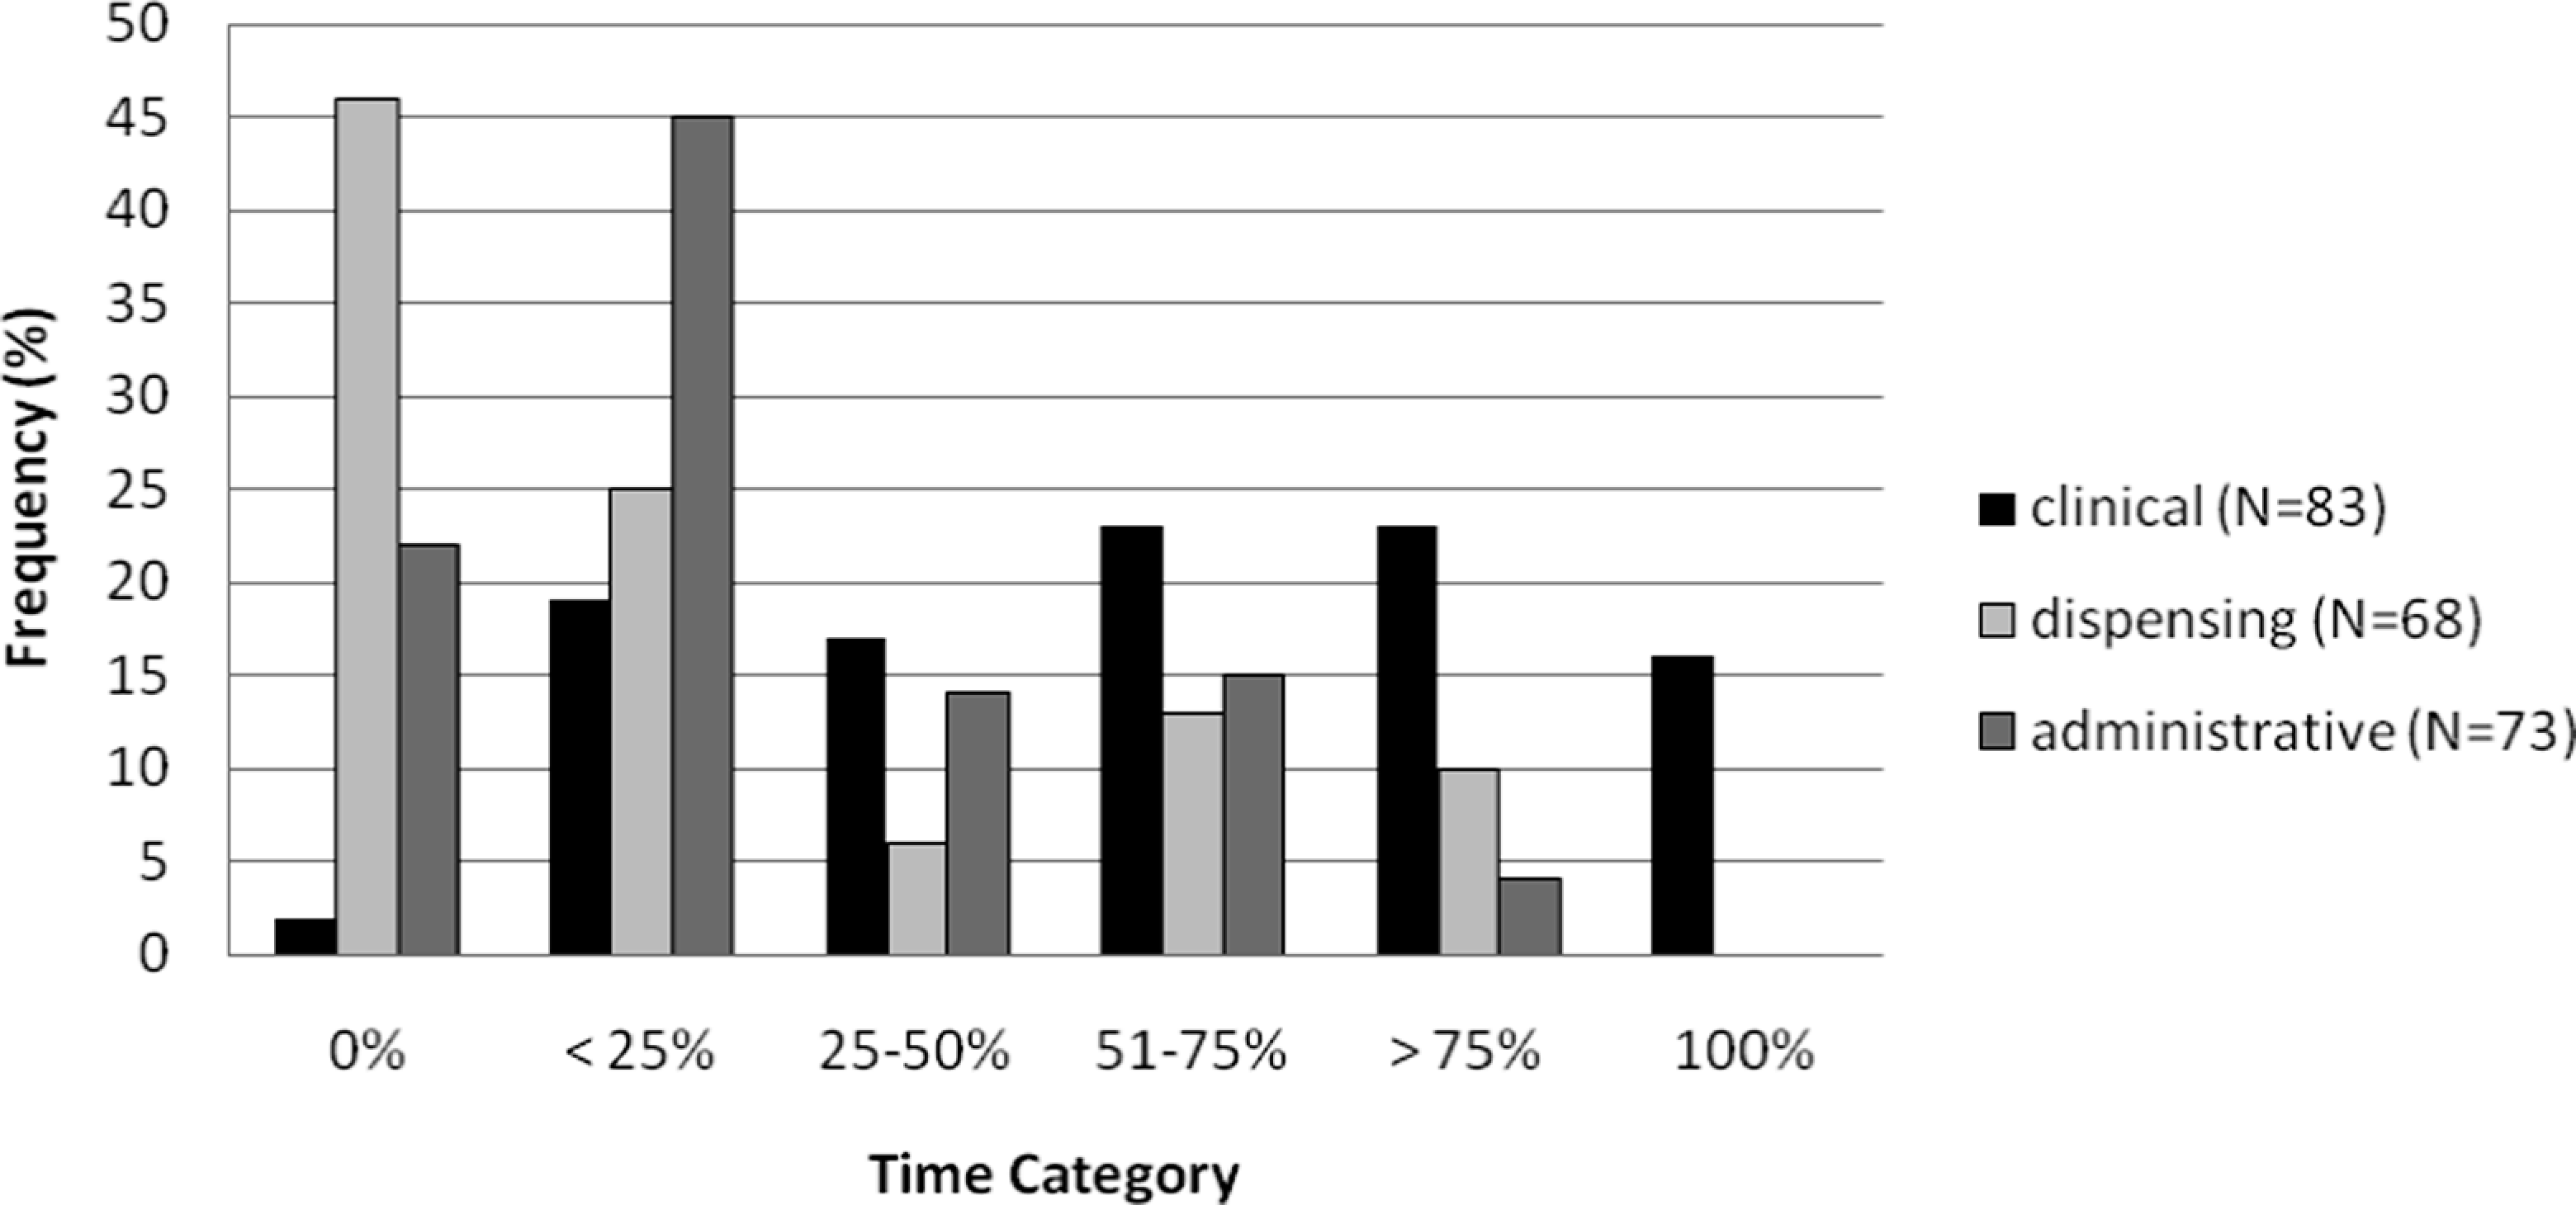
Pharmacist reported distribution of clinical, administrative, and dispensing time.
Pharmacist and Administrator Concordance
The comparison of administrator and pharmacist perspective on clinical, administrative, and dispensing services performed is presented in Table 5. Overall, there was good concordance between administrators and pharmacists. Regarding clinical services, there was greater than 20% difference between response frequencies of the administrators and the pharmacists for intermittent attendance of IDT meetings (80% vs 44%), pharmacist home visits (11% vs 33%), initiation of standing orders (11% vs 78%), and provision of inservices (78% vs 22%). With regard to administration services, there was a greater than 20% difference in administrator and pharmacist response frequency for membership in quality assurance committees (56% vs 33%). Similar frequencies were reported for all dispensing services.
Comparison of Administrator and Pharmacist Perspectivesa
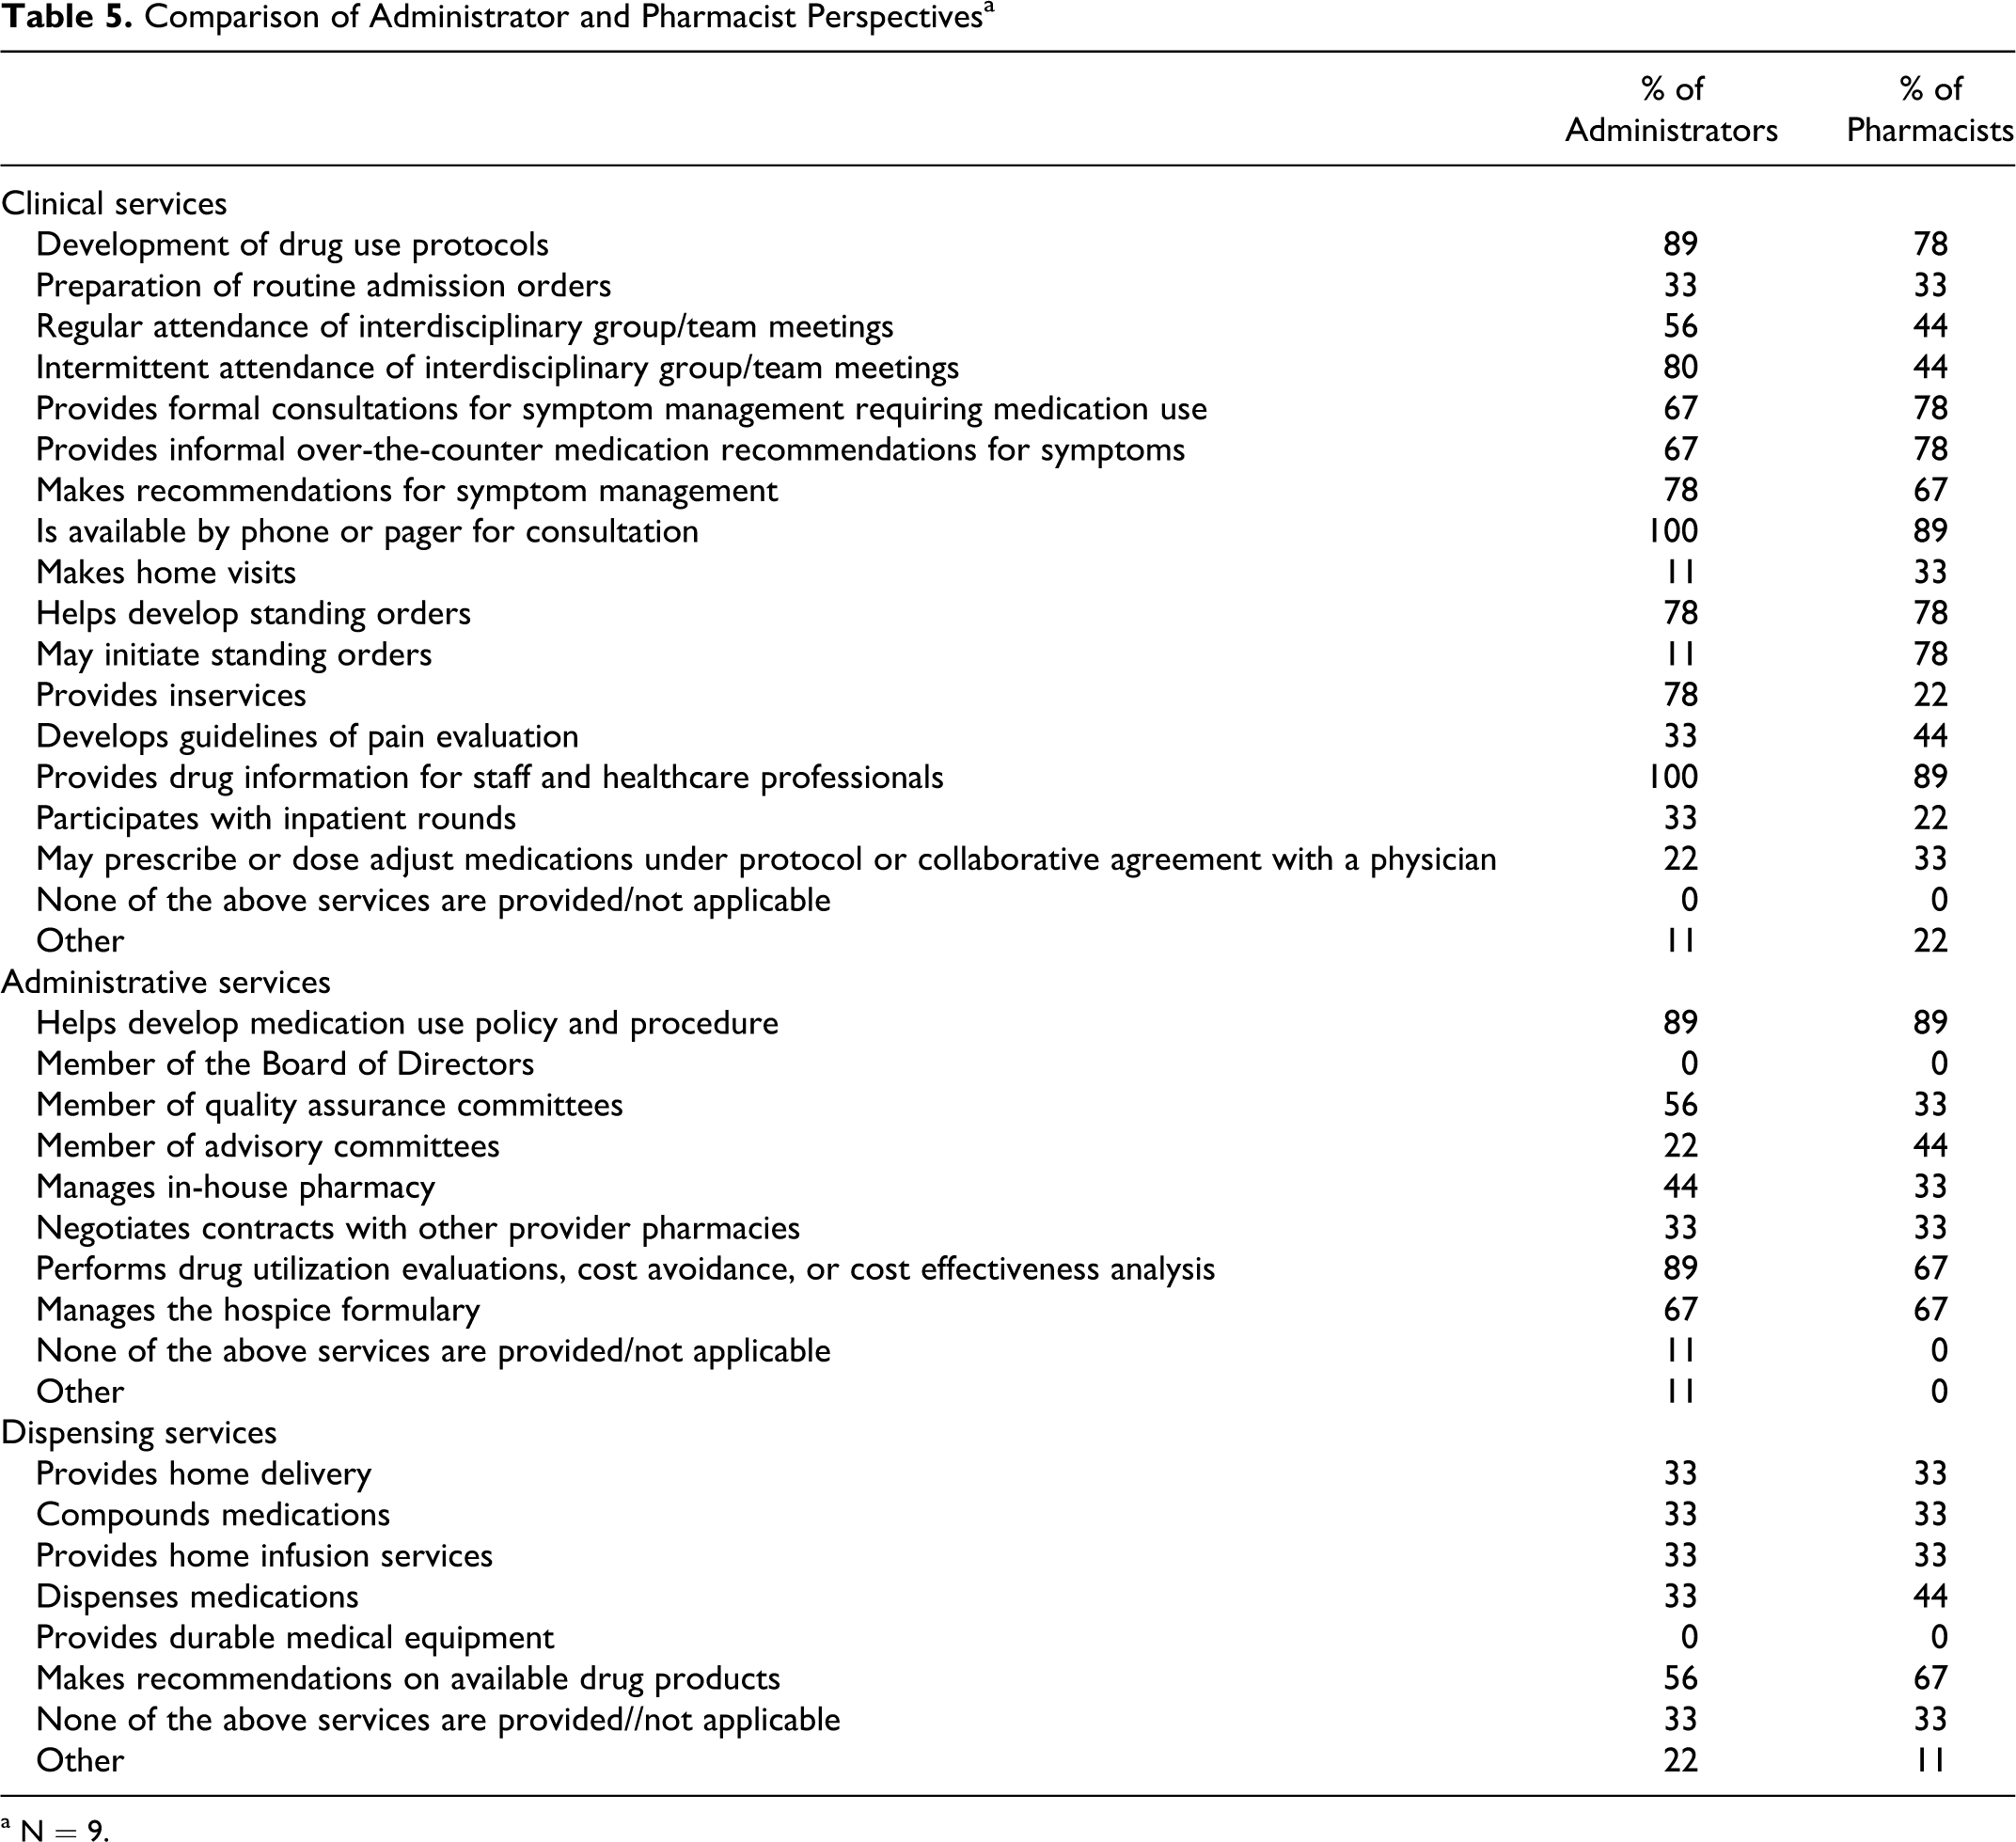
a N = 9.
Pharmacist Contribution to Per Diem Medication Requirements and Cost
There were no significant associations between time spent by the pharmacist performing clinical, administrative, or dispensing services and the number of per diem medications or cost. Similarly, there was no significant difference between hospices that only have a pharmacist on staff, only use a PBM, or those using a combination of a pharmacist and a PBM.
Discussion
It has been almost 20 years since national survey results pertaining to pharmacist involvement in hospice care have been published. Updating this information for the hospice community, our results show clearly that pharmacists are responsible for a wide range of clinical, administrative, and dispensing services in the hospice care setting. Further, there is excellent concordance between hospice administrators and pharmacists perspectives as to what services are being performed. Most notably, our data demonstrate that the services provided by the pharmacist are not compartmentalized as the majority of administrator and pharmacist respondents reported a mix of clinical, administrative, and dispensing responsibilities within the same hospice (70% and 47%, respectively).
We were able to identify several factors that contributed to the pharmacist having an increased clinical or administrative role within the hospice organization. With respect to the hospice organization itself, greater clinical involvement was observed in hospices located in the Midwestern and Western states and when affiliated with a university medical center. Pharmacist involvement in administrative activities was greatest in freestanding hospices, those in operation for 6 to 10 years, those affiliated with a school of pharmacy, and those with a greater patient census. With respect to the pharmacist, working in the Midwest and having formal hospice training was associated with greater time spent performing clinical services.
Daily medication requirements and costs were not associated with increasing pharmacist time performing clinical, administrative, or dispensing services. Similarly, hospices choosing to use the pharmacist on staff only, PBM only, or combination pharmacist-PBM model to provide pharmaceutical services did not demonstrate a difference in medication requirements or costs. Because it is known that pharmacists tend to reduce costs in hospice organizations, 19,20 these findings may highlight the importance of the hospice pharmacist to function in a hybrid capacity irrespective of time commitment, or alternatively, may reflect an inadequate survey methodology wherein acquisition of daily medication requirement and cost data were obtained from estimated ranges. Additional study will be required to more accurately assess medication requirements and costs with increasing clinical, administration, and dispensing time on one hand, and in differing pharmacist versus PBM models on the other.
We found that 17%, 23%, 5%, and 10% of pharmacists reported formal hospice training, completion of a PGY-1 residency, completion of a PGY-2 residency, and board certification in pharmacotherapy, respectively, despite a larger percentage (62%) reporting spending more than 50% of their time performing clinical functions. It is unclear from this survey whether this discrepancy is the result of inaccessibility of advanced training programs in hospice care versus pharmacist preference. In addition, almost 10% of administrators responded that lack of pharmacist training was a barrier to their use. These figures may change if the Board of Pharmacy Specialties approves certification in pain management and palliative care. 23
Pharmacists in the hospice setting are responsible for a wide range of clinical, administrative, and dispensing services. These services are not compartmentalized and there is excellent concordance between what services hospice administrators believe are being performed and what services pharmacists report performing. Several factors are associated with the pharmacists having expanded clinical (geographic location, affiliation with a university medical center, formal hospice training) and administrative roles (freestanding hospice, operations for 6-10 years, pharmacy school affiliation, daily census). Medication requirements and per diem medication costs were not impacted by the amount of time a pharmacist spent performing clinical, administrative, or dispensing services or by the model chosen to provide pharmaceutical services.
Footnotes
Declaration of Conflicting Interests
The authors declared no potential conflicts of interest with respect to the research, authorship, and/or publication of this article.
Funding
The authors received no financial support for the research, authorship, and/or publication of this article.