
Abstract
Hospice has become an important component of End-of-life care in the United States. The use of hospice, however, remains subject to many forces, including the patient, providers, families and cultural beliefs. One consequence of these forces is significant variability of survival of patients in hospice. In a recent study, the authors reported a median survival of approximately 24 days after enrollment. However, a significant minority of patients survive for more than 180 days (the target set by CMS for the Medicare hospice benefit). We examine the factors contributing to the variability of hospice patient survival, including demographics, diagnoses, care setting, and patient drug prescriptions. We apply Cox proportional hazards models to assess the effect of covariates on time-to-event (in this case death in hospice). A high hazard ratio is associated with a shorter life expectancy. In addition to these factors we evaluated medication exposure variables. Medications are strongly associated with the mortality hazard: analgesic use is associated with a nearly three-fold higher hazard (HR = 2.977), and anxiolytic use with a roughly two-fold higher hazard (HR = 1.910) when compared with the group without any anxiolytic use. We provide a detailed understanding of medication use near the end of life that serve as an indicator that medication trajectories can serve as an additional indicator of symptom burden and individualized care planning.
Keywords
Introduction
Hospice in the United States delivers comfort-focused, goal-concordant care to individuals with a physician-certified prognosis of 6 months or less under the Medicare Hospice Benefit.1,2 Utilization has expanded over the past two decades, yet late referral remains common and lengths of stay are often short: national reports show a median hospice stay of only a few weeks, with substantial heterogeneity across settings and diagnoses.3-5 In a recent study, the authors reported a median survival of approximately 24 days after enrollment, highlighting how little time many patients spend in hospice before death. 6 Because end-of-life care accounts for a sizable share of Medicare expenditures, these patterns make prognosis and timely referral important policy and clinical issues.7-9
Medication management is a core component of hospice practice. CMS guidance emphasizes four key palliative drug classes—analgesics, antiemetics, laxatives/anticholinergics, and anxiolytics—as essential for symptom control,10,11 and observational work confirms that these agents dominate hospice prescribing. 12 The current authors have also studied de-prescribing patterns of non-essential drugs among end-of-life patients. 13 To summarize clinical complexity and comorbidity, diagnoses are frequently mapped to the CMS Hierarchical Condition Categories (HCC) model, which aggregates ICD codes into clinically coherent, risk-relevant groups. 14
Building on this framework, this study uses a large patient cohort from Enclara Pharmacia Inc, a national hospice pharmacy benefit manager (PBM), linking survival outcomes to longitudinal prescribing across the four core drug classes. In our prior study 6 we characterized U.S. national hospice length-of-stay patterns across admission settings and patient subgroups using Kaplan–Meier methods and logistic regression for 6-month survival. In the current study we apply Cox proportional hazards models to determine whether measurable covariates—demographics, level of care, clinical severity, and medication exposure—can jointly explain the survival heterogeneity observed in the prior descriptive analysis. We formally test the proportional hazards assumption by extending the model to allow time-dependent effects.
Literature Review
The growth of hospice and palliative care in the United States has been well documented, with rising enrollment, increasing non-cancer representation, and shifting patterns of site of death and care transitions.3-5,15,16 Classic work by Christakis and Escarce showed that Medicare hospice patients have relatively short post-enrollment survival and that age and sex are associated with differences in length of stay.17,18 More recent analyses, including Crowley’s nine-category HQC framework 19 and national studies of specialist palliative care in the UK, have reinforced substantial variation in survival by diagnosis and setting, with particularly long trajectories for dementia patients and shorter stays for acute or renal conditions. However, these studies are typically confined to single systems or countries and use differing disease groupings, limiting comparability.
End-of-life care also imposes considerable financial burden on Medicare, with a sizable fraction of spending concentrated in beneficiaries’ last year of life.7-9,20,21 While hospice enrollment has been shown to reduce costs and improve care quality across a range of lengths of stay, 22 accurately identifying which patients are likely to benefit from earlier enrollment remains challenging. Prognostic studies and validation of tools such as performance scales and disease-specific models show only modest accuracy, and multiple investigations have found that physicians and nurses tend to overestimate survival, particularly for patients with non-cancer diagnoses or frailty.23-26 Parallel work has examined survival prediction in specific disease cohorts (for example, advanced cancer or organ failure), often finding associations with sex, age, and quality-of-life measures, but these models are rarely integrated into routine hospice decision-making.27,28
Medication use at the end of life has been described primarily in terms of static prevalence of drug classes. Sera, McPherson, and Holmes 12 reported that opioids, anxiolytics, anticholinergics, antiemetics, and laxatives are among the most commonly prescribed medications in hospice populations, and CMS guidance delineates expected coverage of four palliative drug classes and all other medications related to the patient’s terminal condition.10,11 However, few studies link standardized diagnostic groupings to detailed, longitudinal pharmacy data to examine how trajectories of palliative medication use—particularly analgesic intensity—relate to survival in large, heterogeneous hospice cohorts.
The Cox proportional hazards model, introduced by Cox (1972), 29 provides a semi-parametric framework for analyzing time-to-event data while adjusting for multiple covariates. Unlike fully parametric survival models, the Cox model does not require specification of the baseline hazard function, making it particularly suitable for medical research settings where the underlying hazard distribution is unknown. A critical assumption of the Cox model is proportional hazards, which states that hazard ratios remain constant over time. Grambsch and Therneau (1994)30,31 proposed diagnostic methods based on Schoenfeld (1984) 32 residuals to test this assumption; violations suggest that time-dependent extensions may be needed.
In summary the existing literature documents short and highly variable hospice survival, growing non-cancer representation, substantial Medicare costs, and limited accuracy of clinician prognostication. Prior studies are often single-system, employ heterogeneous disease categorizations, seldom combine national-scale survival analysis with high-resolution medication trajectories, and rarely incorporate time-varying medication covariates into multivariable hazard models. This study addresses these gaps by applying a reproducible HCC-to-10- category mapping in a large national cohort, integrating descriptive survival analysis with Cox proportional hazards modeling, and incorporating time-varying analgesic effects to improve the understanding of survival heterogeneity in hospice care.
Data
This study used de-identified administrative records between 2014 and 2017 from Enclara Pharmacia Inc, a large national hospice pharmacy benefit manager (PBM). 33 The dataset includes patient-level information on demographics (age, sex), hospice enrollment and discharge/death dates, level of care (eg, home, long-term care, inpatient unit, assisted living), diagnoses, and longitudinal medication dispensing during hospice for four core palliative drug classes: analgesics, anti-nauseants, anti-cholinergics (including laxatives), and anxiolytics. Because the dataset pre-dated the migration to ICD-10 diagnoses our diagnoses are in ICD-9 format. ICD-9 diagnoses were mapped to the Centers for Medicare & Medicaid Services (CMS) Hierarchical Condition Categories (HCC) model, which aggregates individual codes into clinically coherent, risk-relevant groups. 14
The analytic cohort comprised 472 196 hospice patients with complete information on enrollment, death, and diagnostic coding. Baseline characteristics are summarized in Table 2. An important point to note is that medication data are dispensed, not administered. We lack information about drugs administered PRN (as-needed).
Morphine Equivalence
Morphine Conversion Example
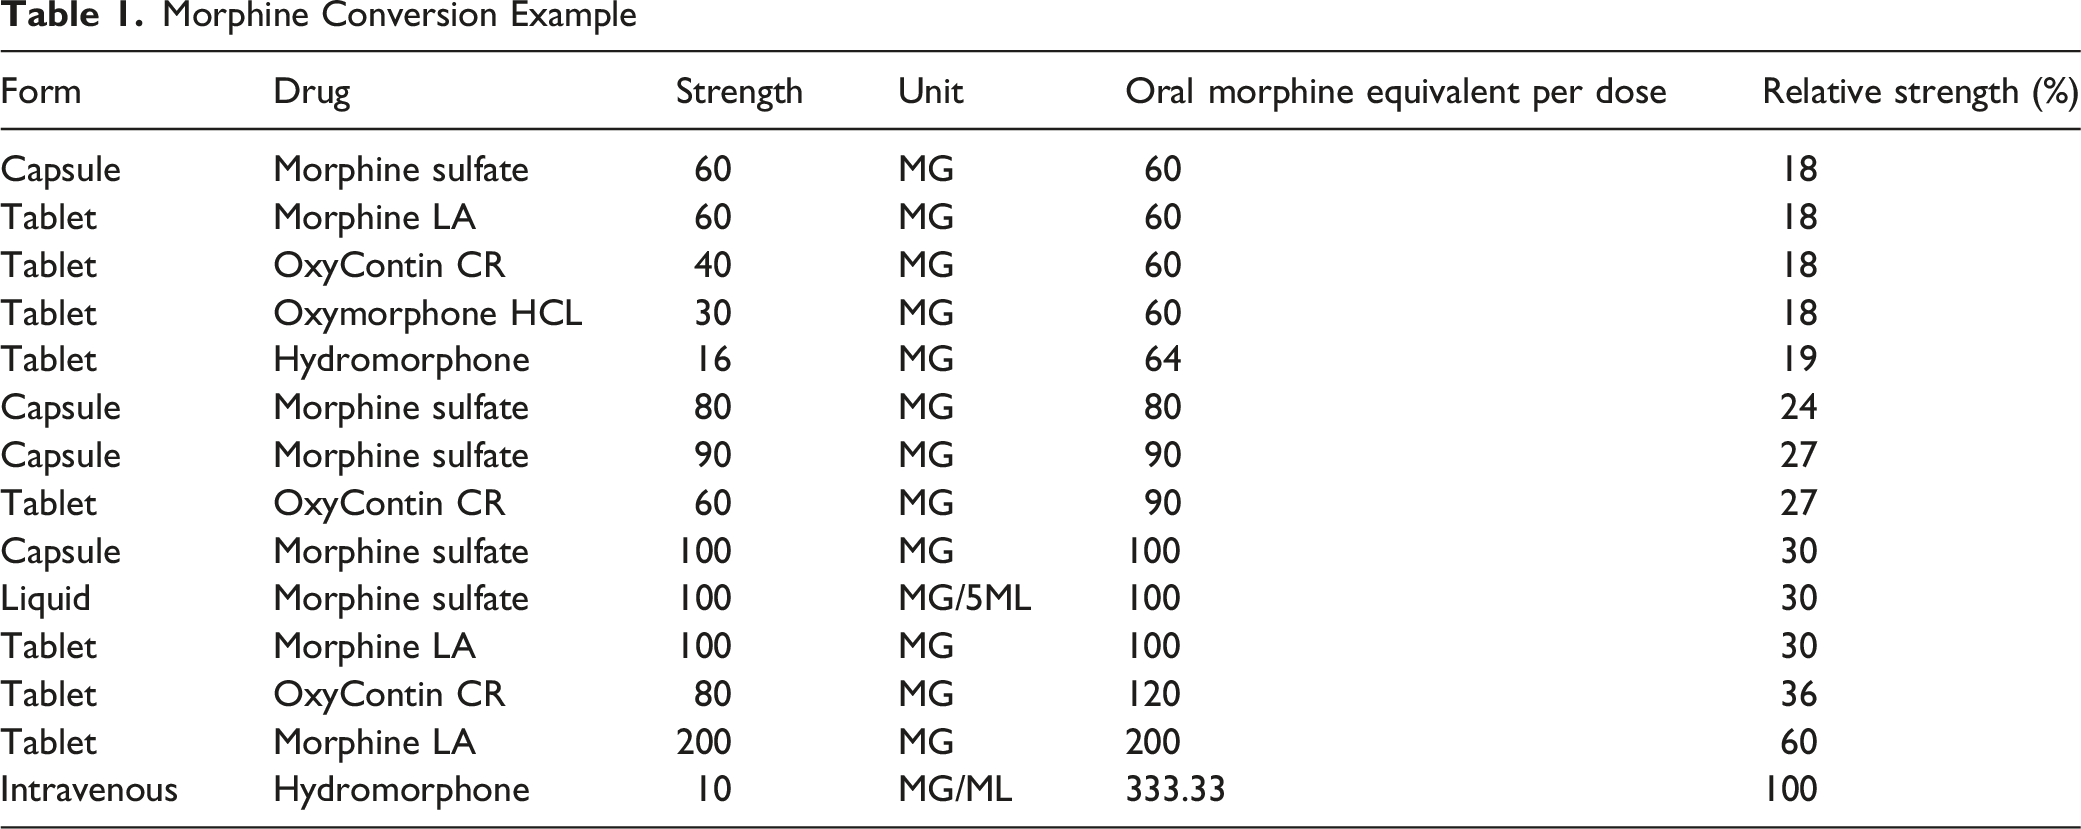
It is possible for a patient to have a drug dosage that exceeds 100%, or more than one prescription at a time (non-analgesic drugs). This phenomenon occurs when a patient has overlapping prescriptions within the same drug class. The U.S. Centers for Disease Control and Prevention (CDC) recommends a daily dosage of no more than 90 milligrams of morphine equivalent (MME). Patients in hospice regularly exceed this dosage, often by multiples. Analysis of a sample of 152 094 deceased patients from our database indicates that 98 204 had at least one prescription day in excess of 90 mg; 60% of deceased patients had a prescription in excess of two times the CDC’s recommended daily dose (slightly fewer than 40% of all deceased patients).
Methods
We conducted a retrospective cohort analysis using multivariable Cox proportional hazards modeling with time-dependent extensions. All analyses were performed in R.
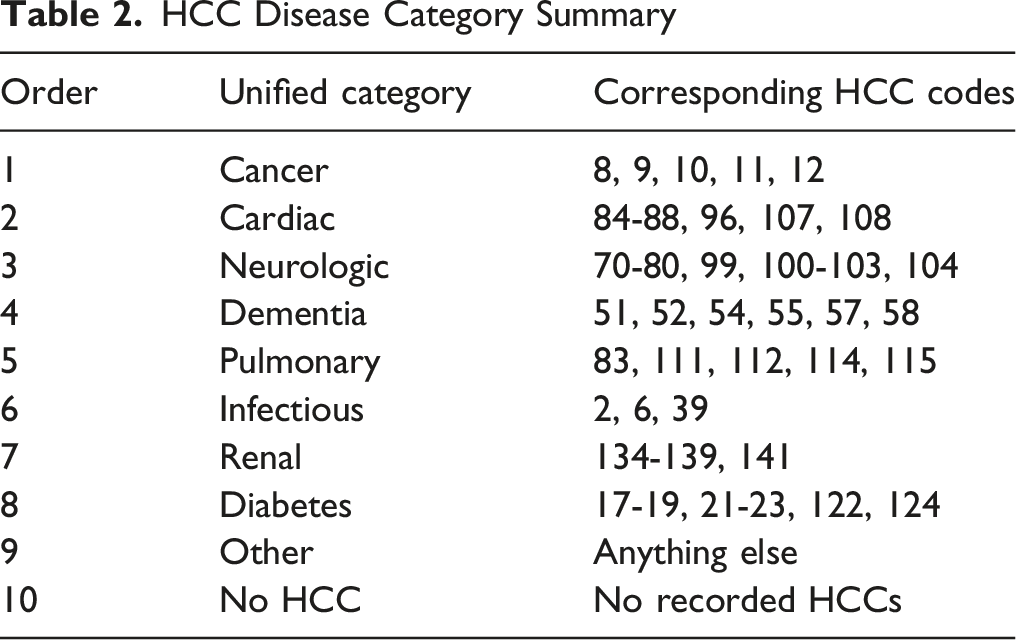
Disease Classification
Building on the HCC mapping framework, we consolidated HCCs into 10 mutually exclusive disease classes to facilitate comparisons across clinically coherent groups. When patients triggered multiple categories, a prespecified priority hierarchy assigned a single primary class. Without imposing a hierarchy we are faced with a multitude of potential combinations of conditions, so this approach is a practical convenience that has long been used in studies of multi-morbid chronic disease. We used the relative costs of patients with these diagnoses as an assignment and stratification of conditions.
HCC Disease Category Summary
Cox Proportional Hazards Model
The primary outcome variable is duration in hospice, defined as the number of days from hospice enrollment to the recorded date of death. Patients without a death date and those discharged alive were excluded from survival calculations.
The survival function is defined as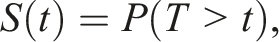
The hazard function is defined as: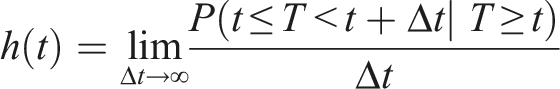
The hazard describes the instantaneous risk of experiencing the event at time t, conditional on surviving up to that time.
To assess the relationship between covariates and time-to-event while adjusting for multiple factors simultaneously, we use the Cox proportional hazards model. For an individual with covariate vector X, the hazard is specified as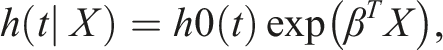
A key property of the model is that hazard ratios are time-invariant. For two individuals with covariates X1 and X2.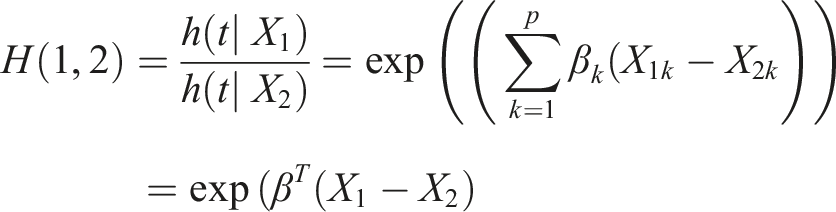
Which does not depend on t. This is known as the proportional hazards assumption. We define the hazard ratio (
Time-dependent Covariates
The Cox proportional hazards model can accommodate time-dependent covariates through a counting-process formulation, in which each subject’s follow-up time is partitioned into intervals defined by a start time, a stop time, and an event indicator. In this setting, the hazard function is given by ℎ(t) = ℎ0(t) exp(β T X(t)) X(t) is a time-dependent covariate that may vary across observation intervals. This formulation enables covariates—such as medication dosage—to dynamically influence the instantaneous hazard. In our analysis, we structure the data in start–stop format to appropriately incorporate longitudinal medication dispensing records, as required by the Cox proportional hazards model functions in the survival package in R.
Results
Baseline Summary
Survival Baseline Summary
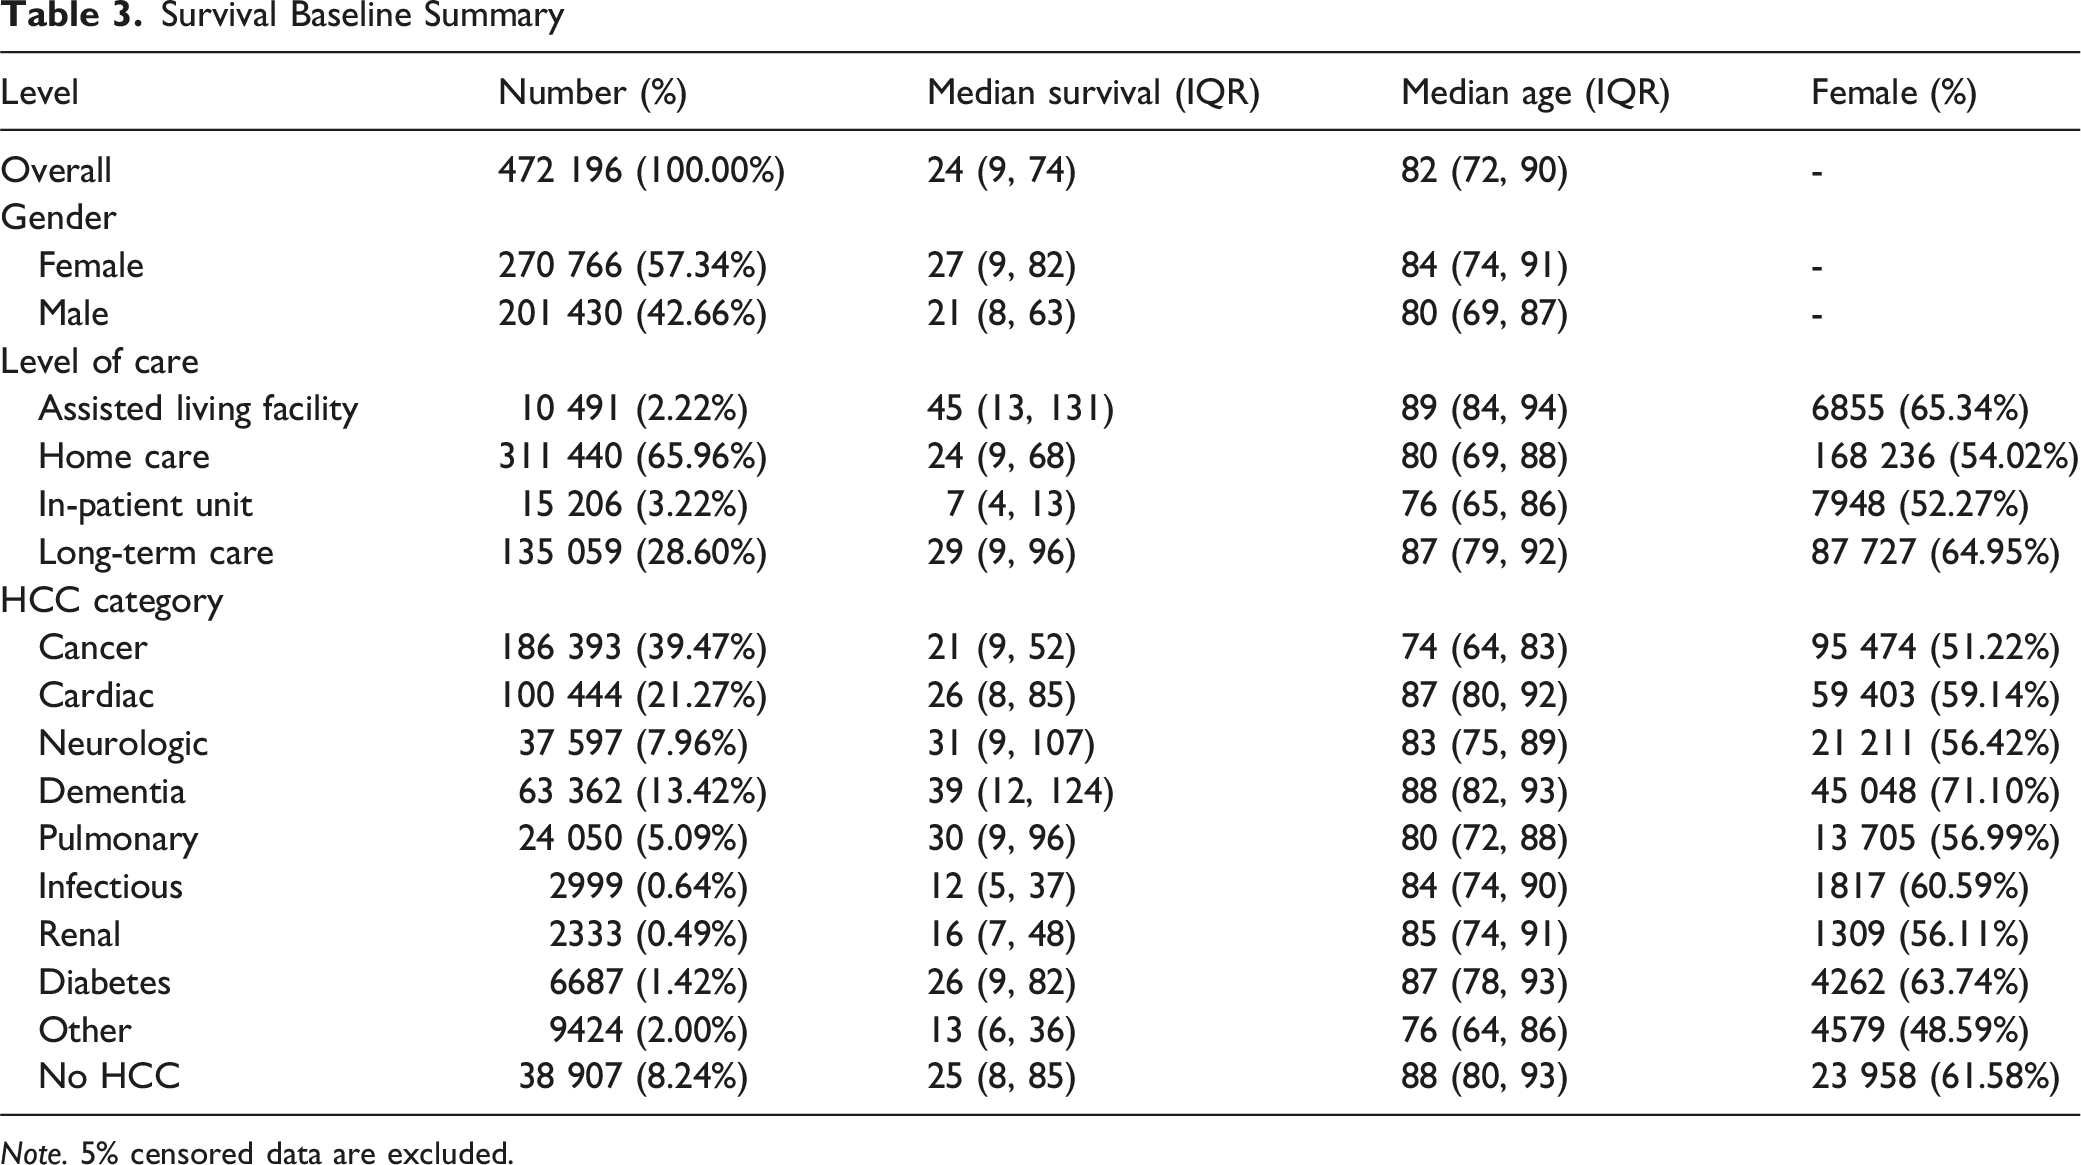
Note. 5% censored data are excluded.
Six-Month Survival Outcomes
Overall, 9.6% of enrollees were alive 180 days after admission. Women were more likely than men to reach this threshold (11.0% vs 7.7%; aOR 0.79 [0.77-0.80] for men). Patients older than 83 years showed higher 6-month survival than younger counterparts (12.4% vs 6.9%; aOR 1.35 [1.33-1.38]). Using cancer (4.68%) as the reference, dementia showed the greatest likelihood of surviving ≥180 days (17.01%; aOR 3.48 [3.37-3.59]), followed by neurologic disease (14.55%; aOR 3.18 [3.07-3.30]). Pulmonary (12.43%; aOR 2.73 [2.61-2.85]), cardiac. (11.36%; aOR 2.27 [2.20-2.34]), diabetes (10.17%; aOR 1.99 [1.83-2.16]), and patients Without coded HCCs (11.70%; aOR 2.33 [2.24-2.42]) also exceeded cancer. Infectious (4.77%; aOR 0.91 [0.77-1.08]), “Other” (4.44%; aOR 0.93 [0.84-1.02]), and renal (5.7%; aOR 1.11. [0.93-1.32]) categories did not differ significantly from cancer after adjustment.
Prescribed Drugs at End of Life
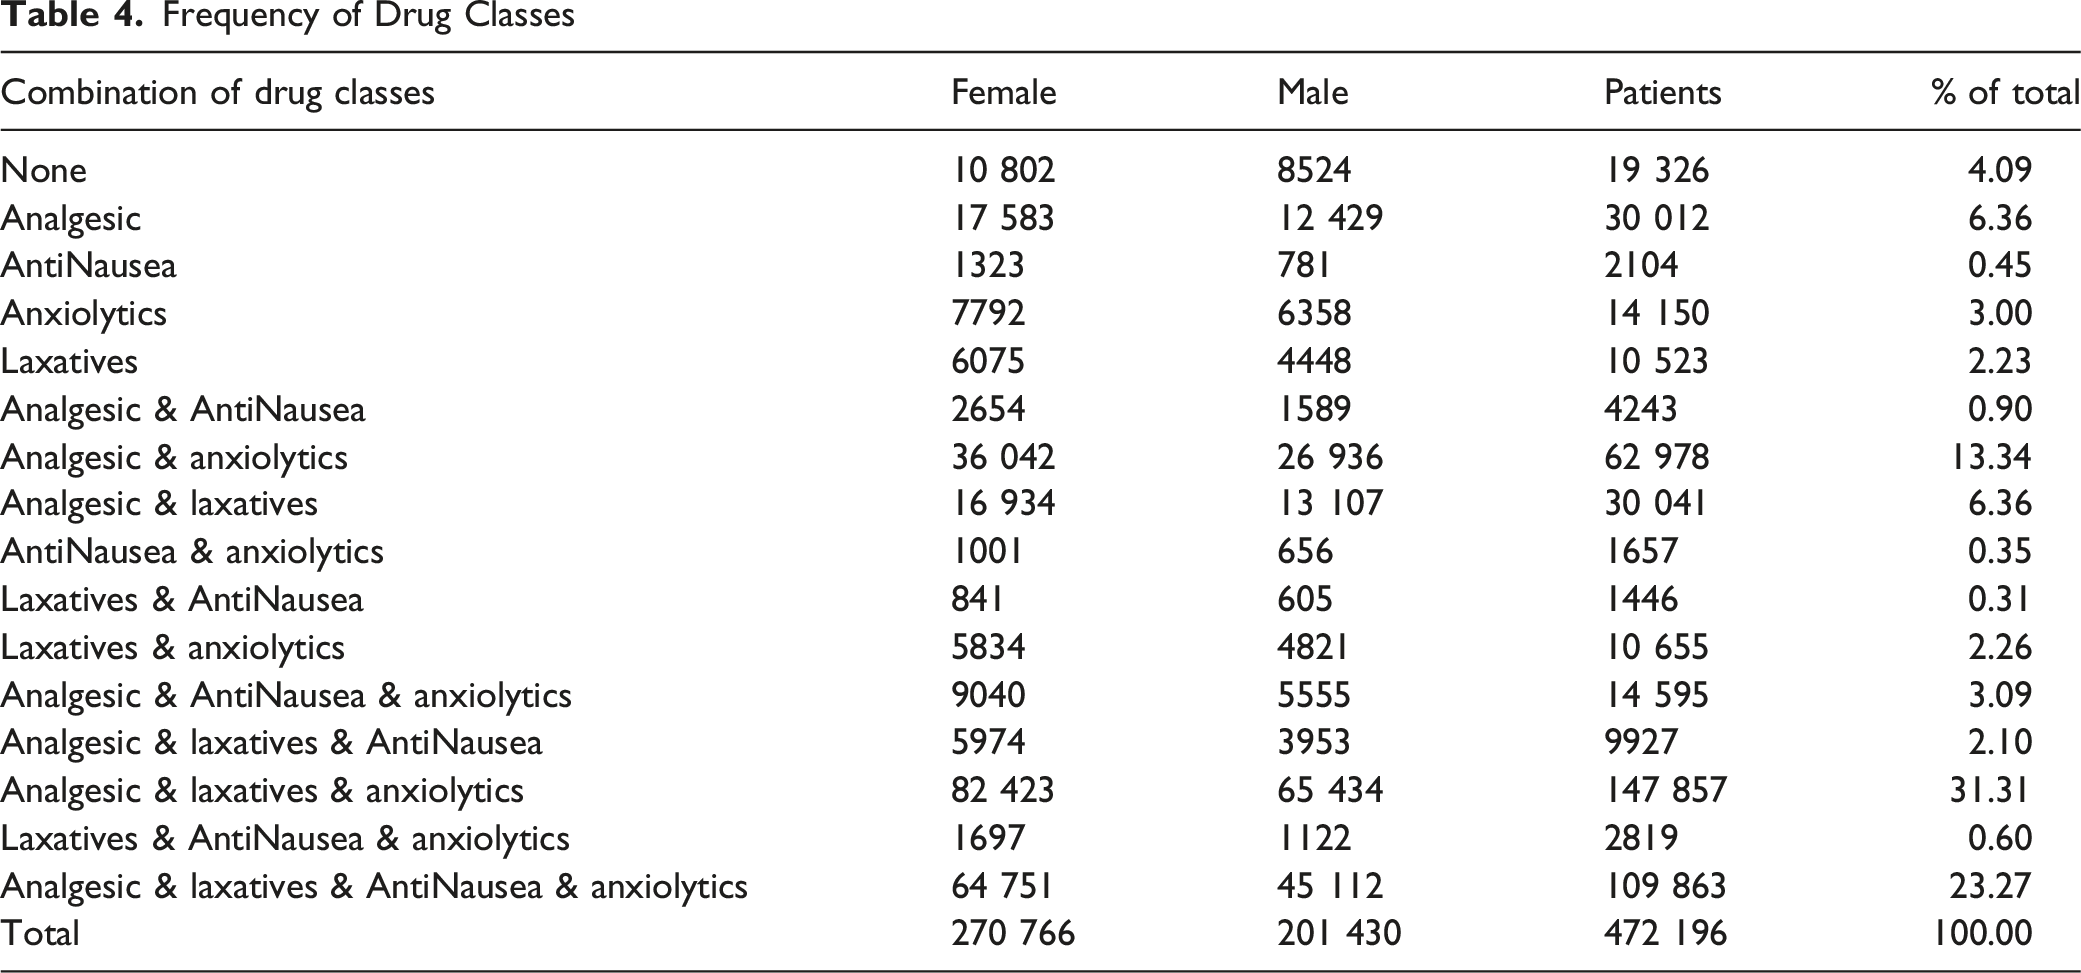
Frequency of Drug Classes
Analgesic use rose steadily across the hospice episode and surged near death. Averaged across the cohort, daily analgesic dose increased gradually through the prior year and then accelerated after D–30, with the mean nearly quadrupling by the final 3-day window; medians were consistently lower than means but showed the same late inflection, indicating a right-skew driven by a growing high-dose tail (Figure 1A). Stratifying by diagnosis, cancer patients had the highest median dose at every window and the steepest end-of-life escalation; infectious and pulmonary groups followed with intermediate-to-high late dosing; dementia remained lowest throughout, with only a modest rise in the final week (Figure 1B). Prescribed drug dosage at EOL. A: Cumulative daily analgesic dose at end of life; B: Daily analgesic dose at end of life by HCC categories (three highest and the lowest condition categories are highlighted)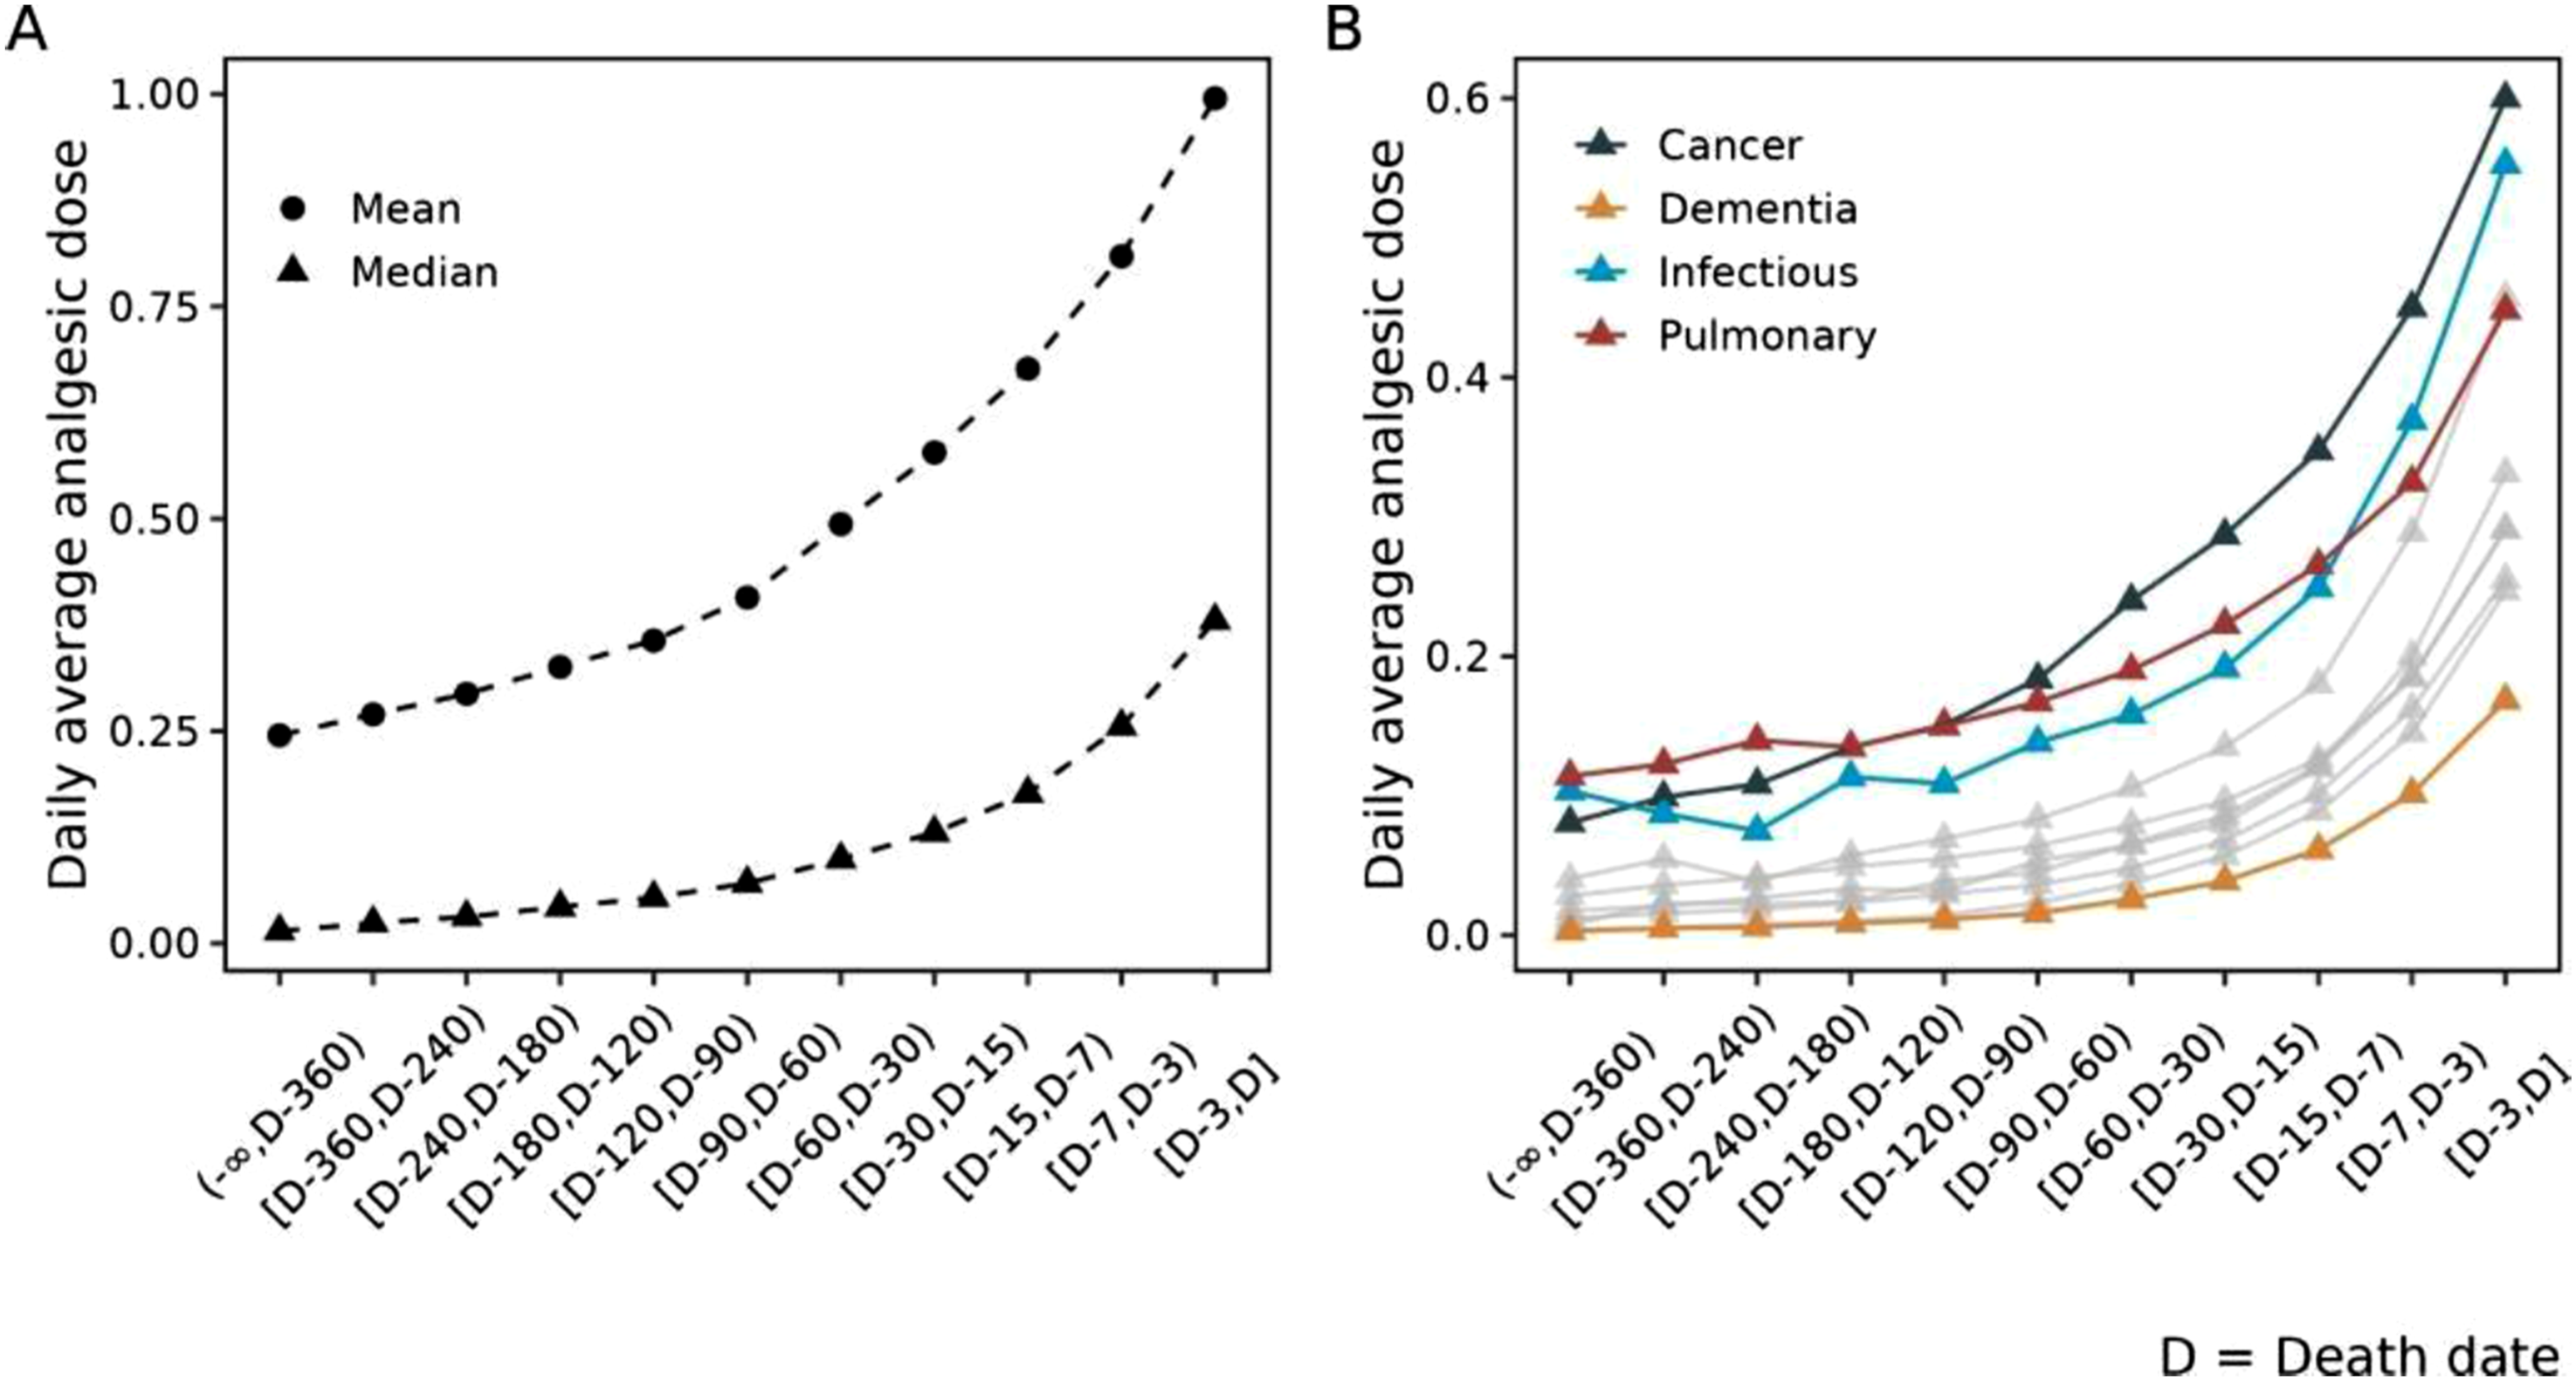
Cox Proportional Hazards Model
Cox Proportional Hazards Model (Baseline)
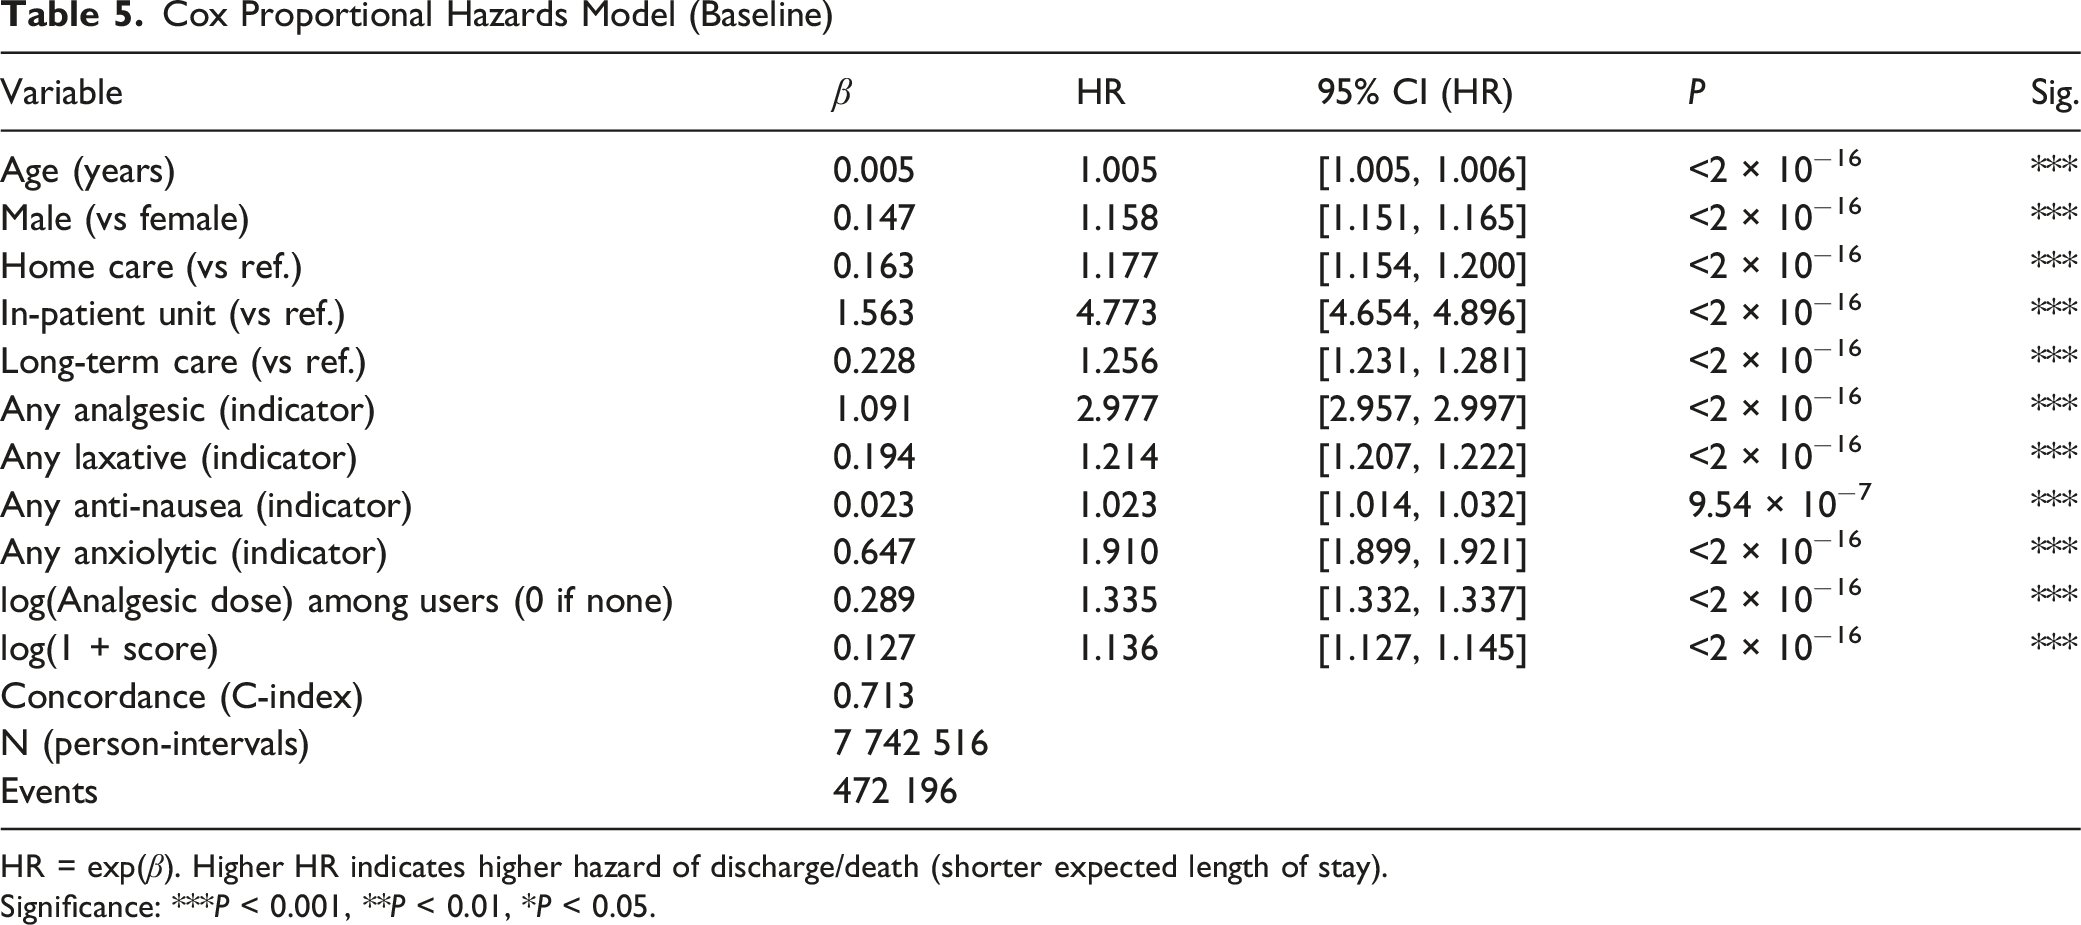
HR = exp(β). Higher HR indicates higher hazard of discharge/death (shorter expected length of stay).
Significance: ***P < 0.001, **P < 0.01, *P < 0.05.
Extended Cox Model With Time-Varying Analgesic Effect
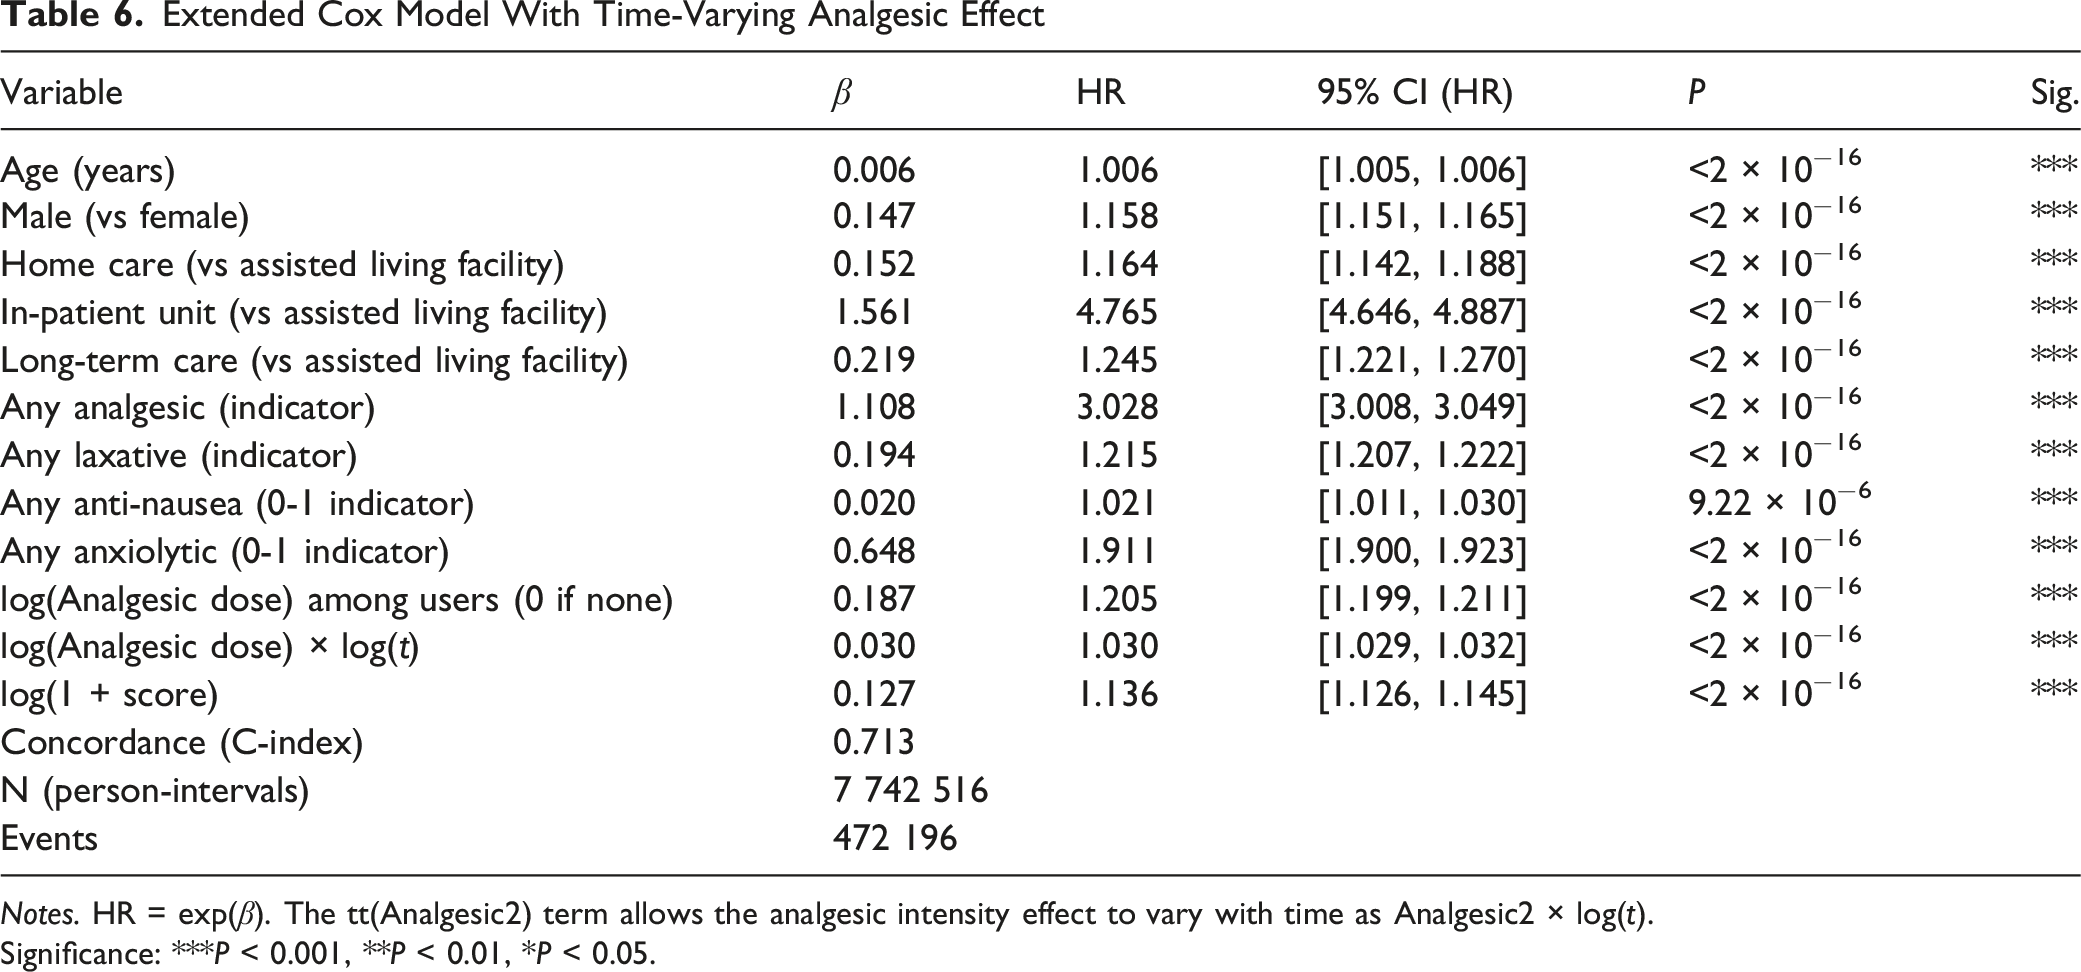
Notes. HR = exp(β). The tt(Analgesic2) term allows the analgesic intensity effect to vary with time as Analgesic2 × log(t).
Significance: ***P < 0.001, **P < 0.01, *P < 0.05.
Discussion
This study examined survival heterogeneity among 472 196 U.S. hospice patients in two phases: descriptive survival analysis using multivariable Cox proportional hazards models with time-dependent extensions. Together, these analyses provide a comprehensive picture of which factors drive variation in hospice length of stay and how they operate jointly.
Medication Patterns and Analgesic Trajectories
Consistent with Sera, McPherson, and Holmes, 12 nearly all patients received at least one core palliative drug class, with high rates of co-prescribing. We extend this work by quantifying class combinations and, more importantly, describing end-of-life analgesic trajectories. Analgesic dose rose gradually over the hospice episode but increased sharply in the last 30 days and surged in the final three days across all diagnoses, with cancer showing the steepest escalation. Dementia maintained low dosing throughout. These findings suggest analgesic intensity may serve as a time-varying marker of symptom burden and proximity to death—an insight not captured in prior hospice survival studies or static prescribing summaries. 8
Cox Model Findings
The Cox proportional hazards model confirmed and extended the descriptive results by quantifying the independent contribution of each covariate to the hazard of death or discharge. Both the baseline model and the extended model in Table 5 and Table 6 achieved a concordance index of 0.713, indicating good discriminative ability-for a randomly selected pair of comparable patients, the model assigns higher predicted risk to the patient who experiences the event earlier about 71.3% of the time.
Table 5 shows that each predictor we used is significantly related to the increase of hazards of discharge of death. The predictors with the most substantial influence are In-Patient Unit, analgesic usage, anxiolytic usage, and laxative usage. The most striking finding was the effect of level of care: patients in the In-Patient Unit had a nearly five-fold higher hazard (HR = 4.773) compared to the Assisted Living Facility reference group. This large effect reflects the clinical reality that inpatient hospice is typically reserved for patients with acute symptom crises or imminent death, making it a strong proxy for end-of-life acuity rather than a causal driver of shorter survival. Medication exposure variables were also strongly associated with the hazard. Any analgesic use was associated with a nearly three-fold higher hazard when compared with the group without any analgesic use (HR = 2.977), and anxiolytic use with a roughly two-fold higher hazard (HR = 1.910) when compared with the group without any anxiolytic use. These associations should be interpreted as reflecting symptom burden rather than direct pharmacological effects: patients receiving more intensive palliative medication are likely those with more severe symptoms and closer proximity to death.
Being male and using home care show moderate association with an increased HR. Their HR values are 1.158 when compared with being female and 1.177 when compared with using assisted living facility. Using anti-nausea medications shows small association with an increased HR.
For the continuous predictor age, the HR is not far from 1: 1.005. However, this HR value is the effect of a 1-year increase in age. When age changes from 70 to 80, while other factors are fixed, then the HR will be 1.005^10, ie, 1.051, which means a 5.1% higher hazard of discharge or death. Similarly, when age changes from 70 to 90, while other factors are fixed, then the HR will be 1.005^20, ie, 1.105, which means a 10.5% higher hazard of discharge or death. For the log-transformed analgesic term, because of the log transformation, the effect is now multiplicative instead of additive. We can interpret this term as: among all patients taking analgesic drugs, if the drug dosage is multiplied by 2, then the HR will be 2^0.289 = 1.222, ie, there will be a 22.2% increase in the hazard. Interpretation for log(1+score) is similar: when 1+score is multiplied by 2, the HR will be 2^0.127, ie, the hazard is expected to increase by about 9%.
Time-Varying Analgesic Effect
Proportional hazards diagnostics indicated that the analgesic intensity effect was not constant over time. We include an interaction term to account for the time-varying effect for analgesic use, and the term for time t is modeled as the logarithm of time, in our data, the passing days. This implies that the time-varying effect will become stable as more and more days pass by. log(Analgesic) × log(t). As shown in Table 6, this term is significant. We also notice that with this new term, other terms coefficients are slightly different. However, the magnitude of other coefficients is very close to what we got in Table 5, which is the table for the baseline model. This is consistent with the descriptive finding that analgesic doses accelerate near death: as patients approach the end of life, higher dosing becomes increasingly predictive of reduction in survival. In Table 6, the coefficient for the main effect log(Analgesic) is 0.187. This is the effect of log(Analgesic) at t = 1 day, since log(1) = 0. It means that at the beginning of this study, for patients who use analgesic drugs, if the drug dosage is doubled, then the HR will be 2^0.187 = 1.138, ie, there will be a 13.8% increase in the hazard of discharge of death. The interaction term implies that the effect of log(analgesic) depends on t: the total effect of log(analgesic) is 0.187 + 0.03* log(t). It means that for the same analgesic dose, when t = 30 (day), 0.187 + 0.03* log(30) = 0.289, and this gives the new HR as exp(0.289) = 1.335. Note that the HR at t = 1 is 1.205. Therefore, we can interpret this as when analgesic dose remains the same, the HR increases by 13% when t = 30 (days) compared with t = 1 (day), holding other factors constant. However, the time-varying term did not improve overall concordance (remaining at 0.713), suggesting that while non-proportionality is statistically detectable in a sample of this size, its practical impact on prediction is limited.
Limitations
Several limitations should be noted. First, the dataset does not include data prior to admission to hospice. As noted our medication data are limited to dispensed drugs and we do not have information about administration, particularly drugs administered as-needed. Second we did not know the cause of death, preventing distinction between deaths from the qualifying hospice condition and deaths from other causes. Third, medication exposure is used as a marker of symptom burden rather than a causal variable; the observed associations between medication use and higher hazard should not be interpreted as medication causing shorter survival. Fourth, the Cox model did not include diagnosis-specific terms due to the complexity of handling 10 HCC categories alongside other covariates; future work could fit stratified or diagnosis-specific models. Fifth, the data come from a single pharmacy benefit manager, which, while national in scope, may not capture patients whose hospices use different PBMs. Finally, the concordance of 0.713 indicates that substantial heterogeneity in survival remains unexplained by the covariates in the model, suggesting that unmeasured factors—such as functional status, caregiver support, or specific disease stage—play important roles.
Future Directions
Several extensions would strengthen this work. The ability to include pre-admission data would allow more powerful and accurate modeling of life expectancy. Competing risks models could separate deaths from discharges to provide more nuanced event-specific hazard estimates. Diagnosis-stratified Cox models would allow covariate effects to differ across disease categories, potentially improving prediction for specific patient populations. Incorporating full medication trajectories as time-varying covariates—rather than binary indicators—could capture the dynamic relationship between changing symptom management and survival. Finally, integrating additional clinical measures such as functional status scores or laboratory values, where available, could improve model discrimination beyond the current concordance of 0.713.
Conclusion
This national retrospective cohort study of 472 196 hospice patients demonstrates that survival heterogeneity in hospice can be characterized through both descriptive and multivariable approaches. The Cox proportional hazards model quantified survival patterns within a unified framework, showing that level of care, medication exposure, sex, age, and clinical severity are all independently associated with the hazard of death or discharge. The In-Patient Unit carries the strongest association (HR = 4.773), while medication indicators—particularly analgesics and anxiolytics—serve as proxies for symptom burden and disease progression. Time-varying analysis confirmed that the analgesic–hazard relationship intensifies over follow-up, consistent with dose escalation near death, though this refinement did not improve overall predictive discrimination.
We provide a more detailed understanding of medication use patterns near the end of life. Analgesic use in particular changes dynamically throughout the hospice experience with a notable increase in the final 3 days of life. This suggests that medication trajectories can serve as an additional indicator of increased symptom burden and proximity to death, which could contribute to more individualized care planning. Finally, these results may inform future prognostic models based on changing medication needs over time. Differences observed across diagnoses suggest that symptom management patterns vary and warrant further investigation, particularly among patients with dementia.
These findings highlight the need for diagnosis-aware, data-driven prognostic tools that incorporate both static patient characteristics and dynamic medication trajectories to support more timely and individualized hospice referral and care planning.
Footnotes
Acknowledgments
The authors thank our research class students Janice Jiang BS, Jiajia Liu BS and Tashi Schaffner MS for contributions to this paper.
Ethical Considerations
No ethics approval was required for this study which was completed on de-identified administrative data.
Funding
The authors received no financial support for the research, authorship, and/or publication of this article.
Declaration of Conflicting Interests
The authors declared no potential conflicts of interest with respect to the research, authorship, and/or publication of this article.