
Abstract
In this article, the author theorizes the process that a World Health Organization work group used to update yellow fever risk maps published in the Yellow Book, a handbook created by the Centers for Disease Control and Prevention for international travelers, from a “wicked problems” perspective. She argues that using this model highlights the complexity of nonexperts’ risk assessment practices in this context and that the work group's decision to create vaccination maps demonstrates an increased awareness of the embodied decision-making practices that nonexperts perform, aligning with and contributing to the growing emphasis on creating user-centered risk information that can be seen in some risk communication.
Yellow fever is no longer a major public health threat in many parts of the world today. During the first half of the 20th century, this mosquito-borne virus was eliminated through rigorous vector (i.e., mosquito) control and vaccination efforts in areas that had been repeatedly stricken by outbreaks. But the virus remains endemic in tropical and subtropical regions of Africa and South America, where it continues to pose a serious health risk to people who live and travel in these locations (World Health Organization, 2021).
Yellow fever's “silent endemic areas” were first identified in maps published in the 1930s when researchers recognized that defining at-risk areas involved determining not just if mosquitos were present but also whether these insects could inhabit certain areas and the extent to which the disease might spread as a result (see Sawyer, 1934, p. 70). Risk maps—“models of disease transmission based on spatial and temporal data” (Kitron, 2000, p. 324)—of the disease were created soon thereafter. These maps provided the foundation for the geographic distribution of yellow fever risk until the early 21st century (Rogers et al., 2006), when a World Health Organization (WHO) work group convened to reassess at-risk areas (Jentes et al., 2011) and update the maps, which had routinely been published in the Yellow Book. This handbook is published by the Centers for Disease Prevention and Control (CDC) every 2 years, and travel medicine clinicians use this information to advise patients who plan to travel internationally about a wide range of health-related risks, including possible exposure to yellow fever (see CDC, 2019a). Equally significant, when updating the visual risk information about yellow fever, the work group also reenvisioned the content of these risk maps by replacing them with vaccination maps, which highlight areas where vaccination is recommended. These vaccination maps have been included in subsequent editions of the Yellow Book.
In this article, I theorize the work group's process of moving from risk to vaccination through a “wicked problems” perspective—a concept originally developed by social planning and policy scholars Rittel and Webber (1973) to describe complex, multifaceted issues with numerous and often conflicting possible solutions. I apply this framework to the risk assessment practices that travel medicine clinicians and their patients engage in to make decisions about how to mitigate the patient's risk of contracting yellow fever when traveling to areas where the virus is endemic. I argue that using Rittel and Webber's model in this context highlights the complexity of nonexperts’ risk-assessment practices, which historically have not always been accounted for in risk communication information. Further, the work group's decision to replace the risk maps with vaccination maps in subsequent versions of the Yellow Book demonstrates an increased awareness of the embodied decision-making practices that nonexperts perform, aligning with and contributing to the growing emphasis on creating user-centered risk information that can be seen in some risk communication.
After reviewing relevant literature on risk perception, I make this argument by first tracing the visual evolution of the mapping practices related to documenting yellow fever risk. Through this discussion, I outline the complexity of the disease and demonstrate the ways that being at-risk for exposure to the virus was historically situated within particular geographic spaces and connected to a quantitative understanding of risk. Drawing from publications that describe the work group's process as well as several in-depth interviews with people knowledgeable about this work, 1 I then detail the specific risk-assessment challenges that prompted the creation of the vaccination maps, followed by an analysis of these considerations using Rittel and Webber's (1973) framework. I propose that assessing yellow fever risk constitutes a wicked problem in risk assessment because the decision-making processes of nonexpert users—travel medicine clinicians and their patients—align with the characteristics of this model. I then propose that the vaccination maps were created in response to the complexity of assessing yellow fever risk because these visuals prioritize the most important decision about embodied risk mitigation that travel medicine clinicians and patients need to make—whether a patient should receive the yellow fever vaccine. At the same time, I argue that the vaccination maps do not resolve the wicked problem of assessing yellow fever risk because receiving the vaccine introduces new health-related risks that patients (i.e., travelers) also need to consider. Indeed, as Rittel and Webber (1973) put it, wicked problems “are never solved”; rather, “[a]t best they are only re-solved—over and over again” (p. 160).
In his article applying a wicked problems framework to pedagogical practice in technical and professional communication (TPC), Wickman (2014) stated that “many of the issues that demand our collective attention…require us to expand our thinking beyond a linear, definition/solution model” (p. 24). I extend Wickman's perspective to risk assessment in TPC by analyzing the unique risk assessment scenario posed by yellow fever and by highlighting the role that vaccination maps play in enabling nonexperts to make embodied decisions related to managing this risk. As such, this discussion responds to calls that increased attention be directed toward risk and embodiment in TPC (Frost, 2018) while contributing to TPC research on visual risk communication (particularly maps) targeted to nonexperts (see Richards & Jacobson, 2021; Stephens & Richards, 2020).
Literature Review: Risk Perception, Embodiment, and Nonexpert Audiences
Risk communication researchers Leiss and Powell (2004) defined risk as “the probability of harm in any given situation” (p. 33). The notion that nonexperts perceive risk differently than experts do has been well established in this field. More specifically, the psychometric paradigm identified several factors, such as controllability and familiarity, that influence how nonexperts perceive risks (e.g., Fischhoff et al., 1978; Slovic, 1987). To illustrate, many people do not perceive driving a car to be risky because they believe they have control over the vehicle and because driving is something they do every day. Air travel, on the other hand, often seems riskier to many people even though the actual statistical likelihood of serious injury or death is far lower, in part, because they do not have control over the plane and because flying may not be a routine mode of transportation. Indeed, for nonexperts, risk is often assessed in terms of the extent to which a particular hazard or adverse event might personally affect them and their loved ones.
For experts, conversely, risk is usually seen as a mathematical calculation—that is, as “a statistical construct, a product of analyzing aggregate data in a particular way,” as Luxford (2003, p. 148), a clinical researcher, characterized it. Epidemiologists, for example, as medical anthropologist Gifford (1986) explained in her article on breast cancer risk and ambiguity, understand risk as “an objective, technical and scientific process…a measured property of a group of people.” Yet for nonexperts, she continued, “risk is a subjective, lived experience” (p. 215). As such, risk assessment is embodied, “defined by perceptual experience and the mode of presence and engagement in the world,” as Csordas (1993, p. 135), also an anthropologist, defined the concept of embodiment.
Scholarship both outside and within the field of TPC has lent insight into risk as an embodied experience with several studies investigating how women assess the risk of developing breast cancer. In the field of public health, for instance, Robertson (2001, 2010), who studied Australian women, found that participants internalized their perceived risk of getting this disease. More specifically, they focused on their personal health-related behaviors as a strategy to mitigate that risk. As Robertson (2010) put it, “[women] manage their anxiety about being ‘at-risk’…by managing their bodies, that is by adhering to particular lifestyle behaviors” (p. 230). Aligning with these findings, Luxford (1999) argued that if women contract the disease, they usually blame themselves for failing to engage in preventative behaviors, such as conducting self-breast exams (cited in Luxford, 2003). Yet they may also not account for factors beyond their control that may have played a role in their developing the disease, such as having a family history of breast cancer or testing positive for the BRCA gene. As research in the field of TPC and the rhetoric of health and medicine has demonstrated, risk assessment can become even more complex for women who do experience these factors, as Pender (2018) argued. Applying Mol's (2008) “logic of care” to the experience of being at genetic risk for certain reproductive cancers, Pender asserted that women in this situation are often encouraged to curb their increased risk by making choices they would make if they had already been diagnosed with the disease, such as having a prophylactic mastectomy.
Similar themes of personal responsibility related to controlling health-related risks can also be seen in a study in the field of public health that investigated postmenopausal women's interpretation of bone scans, which were used to assess their risk for developing osteoporosis (Reventlow et al., 2006), in research investigating people's decision to get tested for HIV (e.g., Lupton et al., 1995; Scott, 2003), and in several studies in TPC on risk communication. For instance, in her work on miner safety, Sauer (1996) noted efforts to shift the responsibility of preventing mining accidents from managers and engineers to workers, “who,” as she put it, “have little control over the equipment, procedures, and environment in a hazardous workplace” (p. 307). Itchuqiyaq et al. (2022), too, focused on navigating dangerous working conditions by analyzing risk guides created by sex workers. These “hyper marginalized” professionals, they explained, constructed risk information for other sex workers as well as clients and allies that was informed by “insider knowledge” (p. 9) that they acquired to keep themselves safe while performing this work.
A study conducted in the field of sociology also focused on the overall risk of bodily harm by investigating the threat of becoming seriously injured or killed when riding a motorcycle. The author found that experienced riders dismissed the potential hazards associated with riding because they perceived that they had control over the risks through their “lived experience” operating these vehicles (Natalier, 2001, p. 65). In other words, riders believed that their embodied knowledge about the practices involved in riding allowed them to make decisions that would enable them to effectively eliminate these risks.
In some risk assessment situations, nonexperts draw on multiple sources to make decisions about risk, as epidemiologist and biostatistician Lippman (1999) found in her study of pregnant women over the age of 35 who were offered amniocentesis. This procedure is often used to manage the risk of giving birth to a child with genetic abnormalities. More specifically, Lippman (1999) found that study participants used the formal health-related information they received, their existing knowledge about the topic, their experiences with their own bodies, and personal information they solicited from other nonexperts (see also Browner & Press, 1996) to construct embodied knowledge that guided their decisions about whether to get the test. TPC scholar Kirkscey (2017), too, focused on prenatal genetic testing and patient decision making, finding that rather than accounting for the complexity of women's risk assessment practices in this context, patient educational materials tended to emphasize numeric risk information.
At the intersection of these two perspectives toward risk—that is, risk as an embodied experience or risk as a quantitative assessment—Gifford (1986) argued, are health care providers. More specifically, in their interactions with patients, providers “transform [risk] from a statistical concept to a physical entity” (p. 222). In other words, they “translate the abstract risk of populations into the application of risk for particular individuals,” as Luxford (2003, p. 148) characterized it. To illustrate, when a primary care physician counsels a 39-year-old woman about mammography, the provider must weigh relevant quantitative risk assessments, such as breast cancer screening guidelines, with information about the patient's current health status, including any symptoms she may be experiencing as well as her family history of the disease.
Mapping Yellow Fever Risk: A Brief History
In the fields of public health and epidemiology, mapmaking has long been used as a visual problem-solving strategy. Throughout the 19th century, for example, thematic maps were routinely included in reports seeking to identify the causes of infectious and communicable diseases (see Koch, 2005, 2011; Stevenson, 1965). While most of these reports incorrectly pointed to miasma (i.e., polluted air), the maps included therein nonetheless served to establish “cause and effect relationship[s]” based on “simple proximity,” as medical geographer Koch (2005, p. 37) put it, connecting suspected cases of the disease to specific geographic locations. Early yellow fever maps illustrate the ways that mapping established a division between “diseased and not diseased space,” visually situating illness within particular geographic areas and reinforcing the separation between the disease and the bodily experience of illness that characterizes Western medicine (Welhausen, 2015, p. 271).
Today disease maps are created to serve a different purpose—to display the spatial and temporal distribution of cases within a defined geographic area, allowing public health experts to make decisions about controlling the spread of epidemics, such as by promoting vaccination. Yet contemporary yellow fever risk maps (see Jentes et al., 2011) use the same visual conventions their predecessors used to enact power and control over geographic space (Welhausen, 2015). Indeed, risk maps, as Monmonier (1997) put it, “afford control, either real or imagined, over fate and nature” (p. 295), highlighting specific threats while downplaying ambiguities.
After mosquitoes were identified as yellow fever's mode of transmission in 1900, mapping practices shifted from documenting specific outbreaks to identifying the geographic range of mosquitoes (e.g., Boyce, 1906, 1911; Kumm, 1931), aligning with the growing emphasis on vector control in the Western hemisphere (Gubler, 2004). But researchers also discovered during the early 20th century that the transmission cycle of the virus was far more complex than previously thought (Barrett & Higgs, 2007); thus, controlling the disease involved identifying areas not just where the vector was currently present but also where it could be or had been present (Sawyer, 1934). As Mahaffy et al. (1942) would later put it in their investigation of yellow fever in western Uganda: “The possibility of the virus being able to maintain itself indefinitely in sparsely populated or even uninhabited areas cannot be excluded” (p. 20). In fact, to this day, yellow fever cannot be eradicated because it can survive in nonhuman primates, which continually provide a path for transmission in humans (Barrett & Higgs, 2007).
The first global risk maps of the disease would not be created until the late 1940s by the Expert Commission on Quarantine (Jentes et al., 2011; Rogers et al., 2006); however, about 10 years earlier, Sawyer (1934) constructed area maps that visually situated risk of the disease in geographic space by documenting the location of cases and the presence of persons with immunity 2 on several continents. Some of these immune persons were located in places where no cases had been reported, demonstrating, he proposed, that the vector had been present at some point in the past and the virus had circulated there. One of his maps, entitled “Yellow Fever Immunity in Africa” (see Figure 1), documents these areas on the African continent.
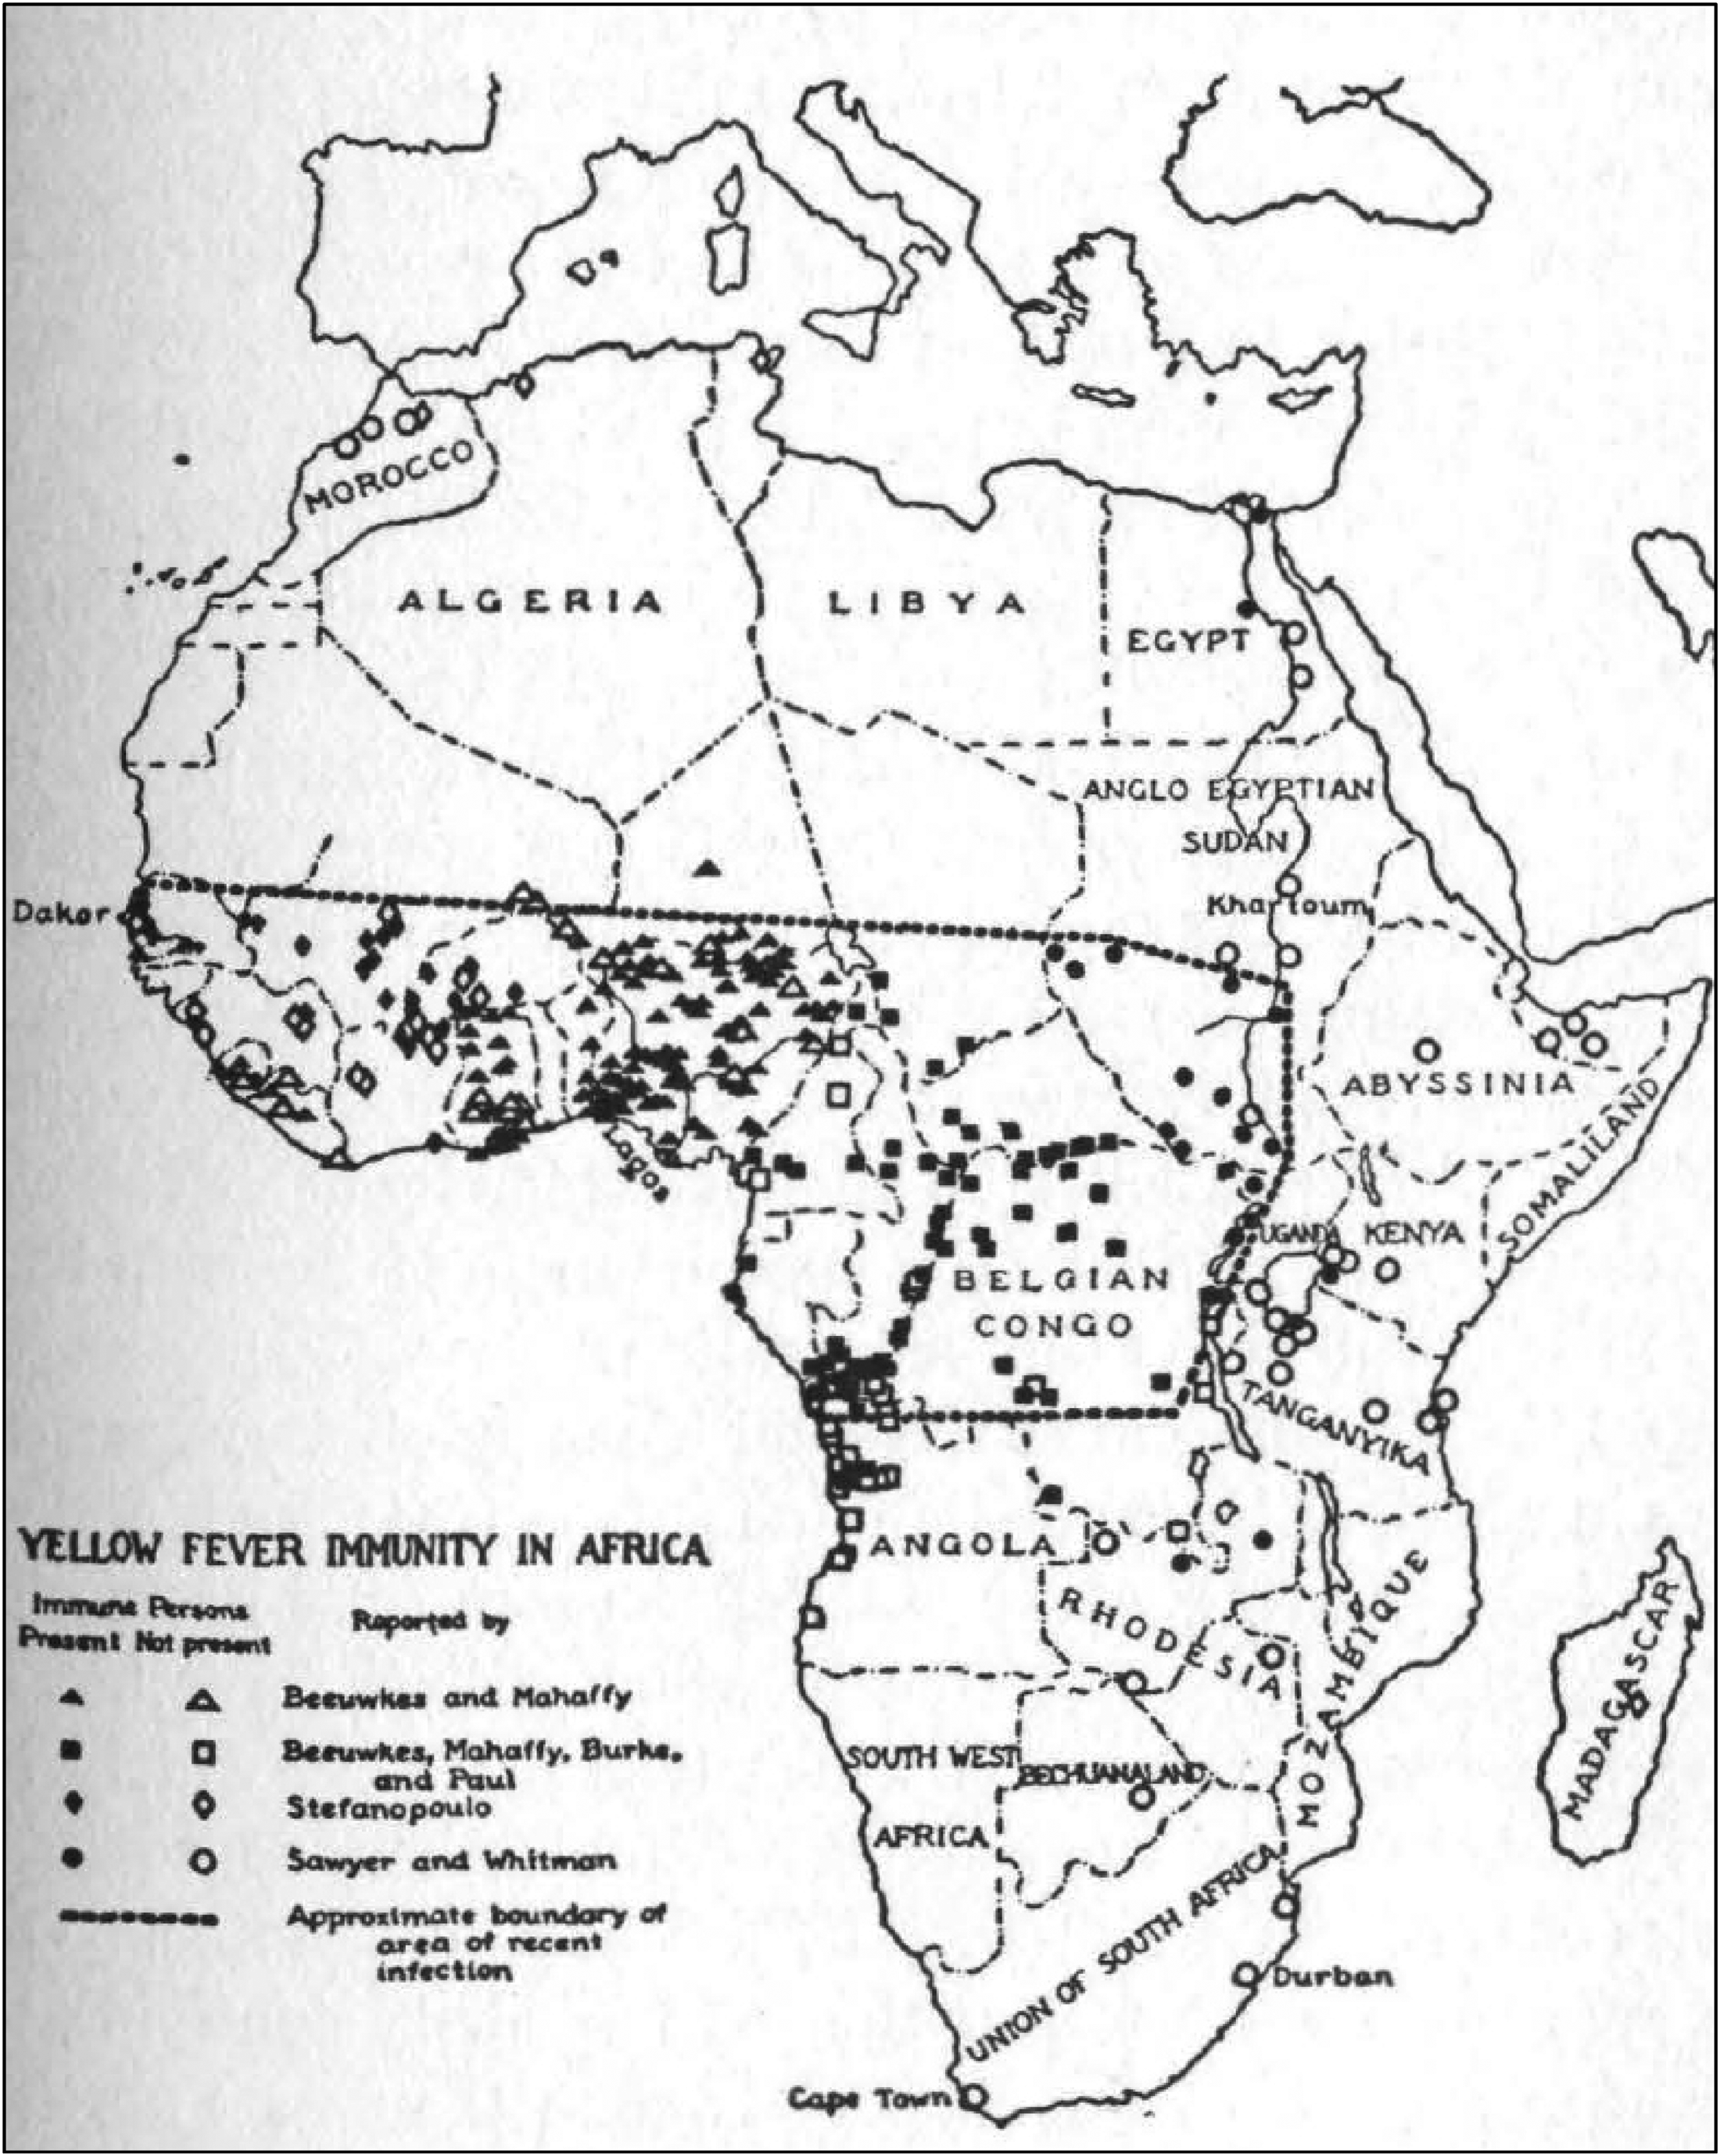
Sawyer's (1934) map of Africa showing yellow fever immunity. Reproduced with permission from NYU Press. Source: Sawyer, 1934.
When Sawyer published this map, our modern-day understanding of risk and its inherent uncertainty (Sandman & Lanard, 2011) had not yet been conceptualized. Yet Sawyer (1934) arguably accounted for uncertainty in yellow fever risk through design choices such as his bold, dashed line, which enclosed the “approximate…area of recent infection” (p. 79) and delineated the geographic area—West and most of Central Africa—where the virus posed the greatest threat (see Figure 1). Further, by using symbols (rather than shading) to show the presence of immune persons, Sawyer established this area as high risk, conveying that immune persons had been identified both inside and outside of this area and emphasizing the number of people affected.
The Expert Commission on Quarantine eliminated this visual nuance in their maps (see van Rooyen & Rhodes, 1948), which they created over a decade later by using bold latitude lines and some geopolitical boundaries to block off wide swaths of “yellow fever areas.” More specifically, the commission's map of Africa visually separated the continent into the binary categories of at-risk and not at-risk areas “for the purpose of quarantine control” (van Rooyen & Rhodes, 1948, p. 462). Yellow fever outbreaks (regardless of where they occur) can quickly spread. Thus, the commission may have wanted to eliminate the visual uncertainty in Sawyer's (1934) map by more clearly demarcating all geographic areas where the virus could potentially pose a public health threat. While some changes would later be made, the commission's maps would provide the foundation for the geographic distribution of yellow fever risk until the early 21st century (see Rogers et al., 2006), when the WHO work group convened in 2008 to reassess at-risk areas (see Jentes et al., 2011).
In conducting “the first systemic review in decades of the risk of yellow fever (YF) virus transmission” (Hill, 2012, p. 246), the work group aimed “to discuss factors important for transmission of the virus, to establish criteria for the addition or removal of countries and geographical regions,” and “to revise the yellow fever risk maps and recommendations for vaccination,” according to a review article documenting the work group's process (Jentes et al., 2011, p. 624). More specifically, work group members created the following risk categories: endemic (high risk), transitional (moderate to high risk), low potential for exposure (low risk), and no risk (Jentes et al., 2011). Here “endemic” and “no risk” align with the “at risk” and “no risk” designations used in the maps published in the 2010 Yellow Book (see, e.g., Figure 2A). But the new category of “low potential for exposure” was used to delineate geographic areas with some risk of transmission because these spaces border on “endemic” areas, a usage reminiscent of Sawyer's (1934) visual efforts to show the “silent endemic areas” he identified (p. 70). The work group then adapted the visual risk information in its updated risk maps (see Figure 2B) into vaccination maps published in the 2012 Yellow Book (see Figure 2C). As Figure 2B and 2C illustrate, “low potential for exposure” areas became vaccination “generally not recommended” whereas “transitional” areas in South America (not shown) became vaccination “recommended.” Figure 2A–C shows the changes made in the maps that were published by the work group in 2010, 2011, and 2012.
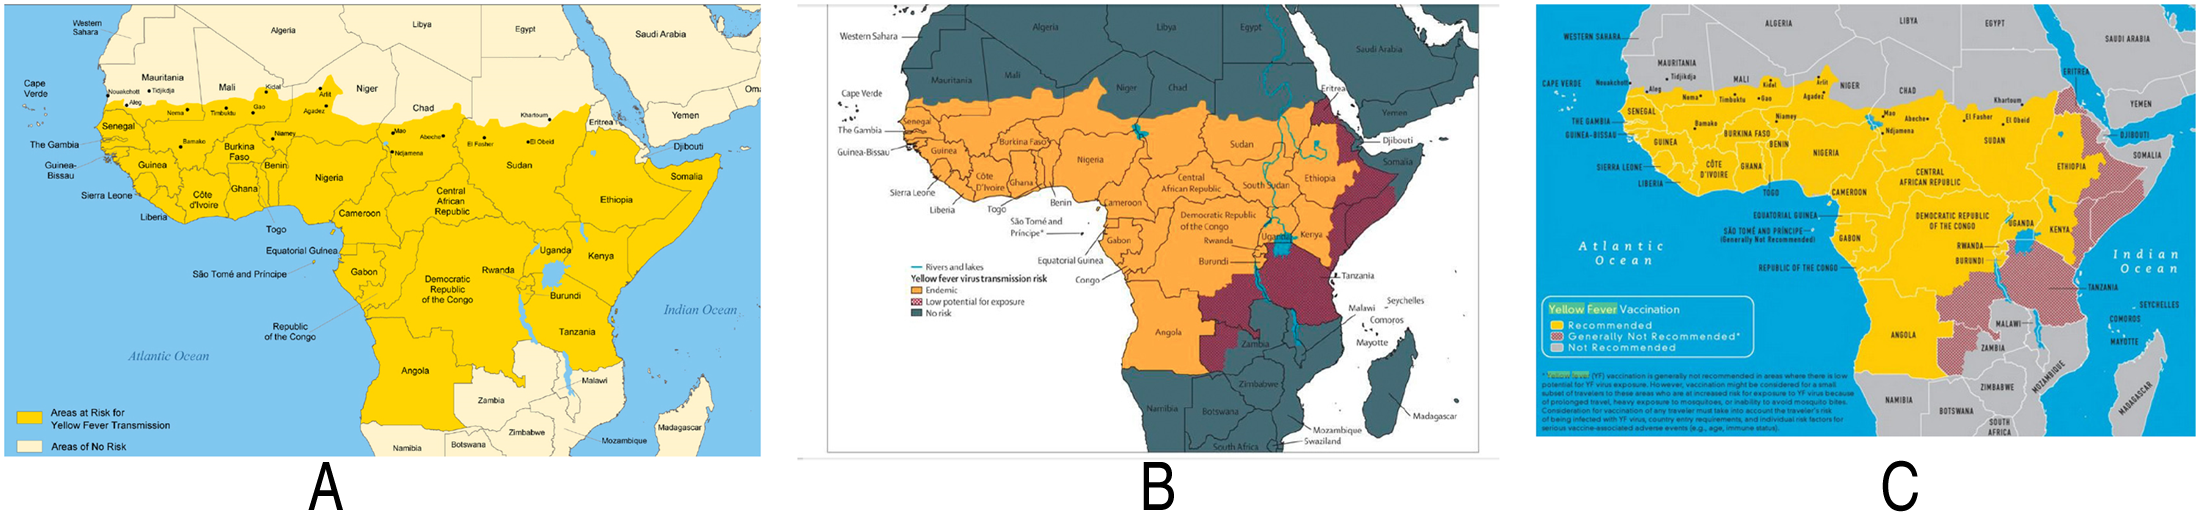
Changes in the yellow fever risk maps published by the work group in 2010, 2011, and 2012. (A) Risk map of Africa published in the 2010 Yellow Book. Source: Centers for Disease Control and Prevention. CDC Health Information for International Travel 2010. Atlanta: U.S. Department of Health and Human Services, Public Health Service, 2009. (Brunette et al., 2009). (B) Risk map showing revised risk categories created by the WHO work group. Source: (Jentes et al., 2011). Used with permission of Elsevier/The Lancet Publishing Group from “The Revised Global Yellow Fever Risk Map and Recommendations for Vaccination, 2010: Consensus of the Informal WHO Working Group on Geographic Risk for Yellow Fever,” Jentes, E. S., Poumerol, G., Gershman, M. D., Hill, D. R., Lemarchand, J., Lewis, R. F., Staples, J. E., Tomori, O., Wilder-Smith, A., & Monath, T. P., for the informal WHO Working Group on Geographic Risk for Yellow Fever; 11, 622–32, 2011; permission conveyed through Copyright Clearance Center, Inc. (C) Vaccination map of Africa published in the 2012 Yellow Book. Source: Centers for Disease Control and Prevention. CDC Health Information for International Travel 2012. New York: Oxford University Press; 2012. (Brunette, 2011).
As this discussion has demonstrated, public health efforts to first understand and then control yellow fever have historically been linked to geography, guiding early epidemiologists to better understand how the disease was spreading and might spread in particular locations. Given the virus's etiology, the WHO work group aimed to address these considerations. More specifically, the members of this group convened, in part, because different versions of the risk maps had begun to circulate, and the methodology used to designate at-risk areas had not always been well documented. They also met because serious (albeit rare) adverse outcomes had been reported with the vaccine (see Jentes et al., 2011). Although the yellow fever vaccine is considered safe (CDC, 2021b), when counseling patients who plan to travel to areas where the virus is (or may be) a concern, travel medicine clinicians had been advised to carefully consider whether the patient planned to travel to countries that require vaccination (see CDC, 2021a), whether the patient was at risk of exposure to the virus, and whether the vaccine could be safely administered to that individual patient (see Hill, 2012; Staples et al., 2010).
As such, these guidelines foreground the multiplicity of factors that travel medicine clinicians need to consider, including how the bodies of individual patients are likely to respond to the vaccine, in order to provide advice about mitigating the risk of contracting the virus. To begin, these clinicians need to account for the risk classification of every location the patient plans to visit and their length of stay in that location. Such considerations are deeply geographically situated because the vector is more likely to occupy some locations over others. Further, the length of time the traveler remains in areas where the vector is (or can be present)—even locations that are considered transitional—increases the risk of exposure to the virus. When patients (i.e., travelers) are in areas where there is any risk of exposure, they can engage in embodied practices to lessen the risk, such as using insecticide, staying indoors in the morning and evening when mosquitoes are most active, and getting vaccinated.
While vaccination might seem to be the straightforward solution to fully mitigating the risk of contracting yellow fever, because serious adverse outcomes are possible, travel medicine clinicians need to assess whether a patient can safely receive the vaccine—that is, whether the patient might experience a severe allergic reaction (see CDC, 2019b). Thus, getting the vaccine introduces new health-related risks into this risk assessment scenario. More to the point, clinicians need to weigh the risk of a patient having a serious adverse outcome from the vaccine, further complicating the risk assessment process. Next, I theorize these complexities using Rittel and Webber's (1973) wicked problems framework. I argue that the considerations surrounding assessing yellow fever risk align with the characteristics of their model; thus, assessing yellow fever risk meets the criteria of wicked problems.
Wicked Problems and Assessing Yellow Fever Risk
Fifty years ago, Rittel and Webber (1973) developed the concept of wicked problems to draw a distinction between what they characterized as “tame” or “benign” problems and those they described as wicked (p. 160). The former, which, they argued, we tend to encounter in science and engineering have “definable solutions,” as Wickman (2014, p. 26) characterized it in applying Rittel and Webber's model to pedagogical practice in TPC. In contrast, the latter are “ill-defined” (Rittel & Webber, 1973, p. 160), “complex in their causes and effects,” as Wickman (p. 24) put it, and “fundamental[ly] indetermina[nt],” as design theorist Buchanan (1992, p. 15) stated in his frequently cited article applying the concept to design thinking. A wicked problems perspective has been employed in a wide range of scholarly contexts, including in other TPC research (e.g., Tham, 2020, 2021).
Rittel and Webber (1973) proposed that wicked problems have 10 characteristics, and these characteristics, Wickman (2014) argued, provide a framework for “characterizing and engaging with complex issues” (p. 27). Table 1 lists each characteristic and applies it to a yellow fever risk assessment. More specifically, Table 1 contains and an in-depth analysis that connects Rittel and Webber's characteristics to the embodied considerations that travel medicine clinicians need to attend to when advising patients about the actions they need to take to mitigate their risk of exposure to yellow fever.
Characteristics of Wicked Problems Applied to Yellow Fever Risk Assessment.
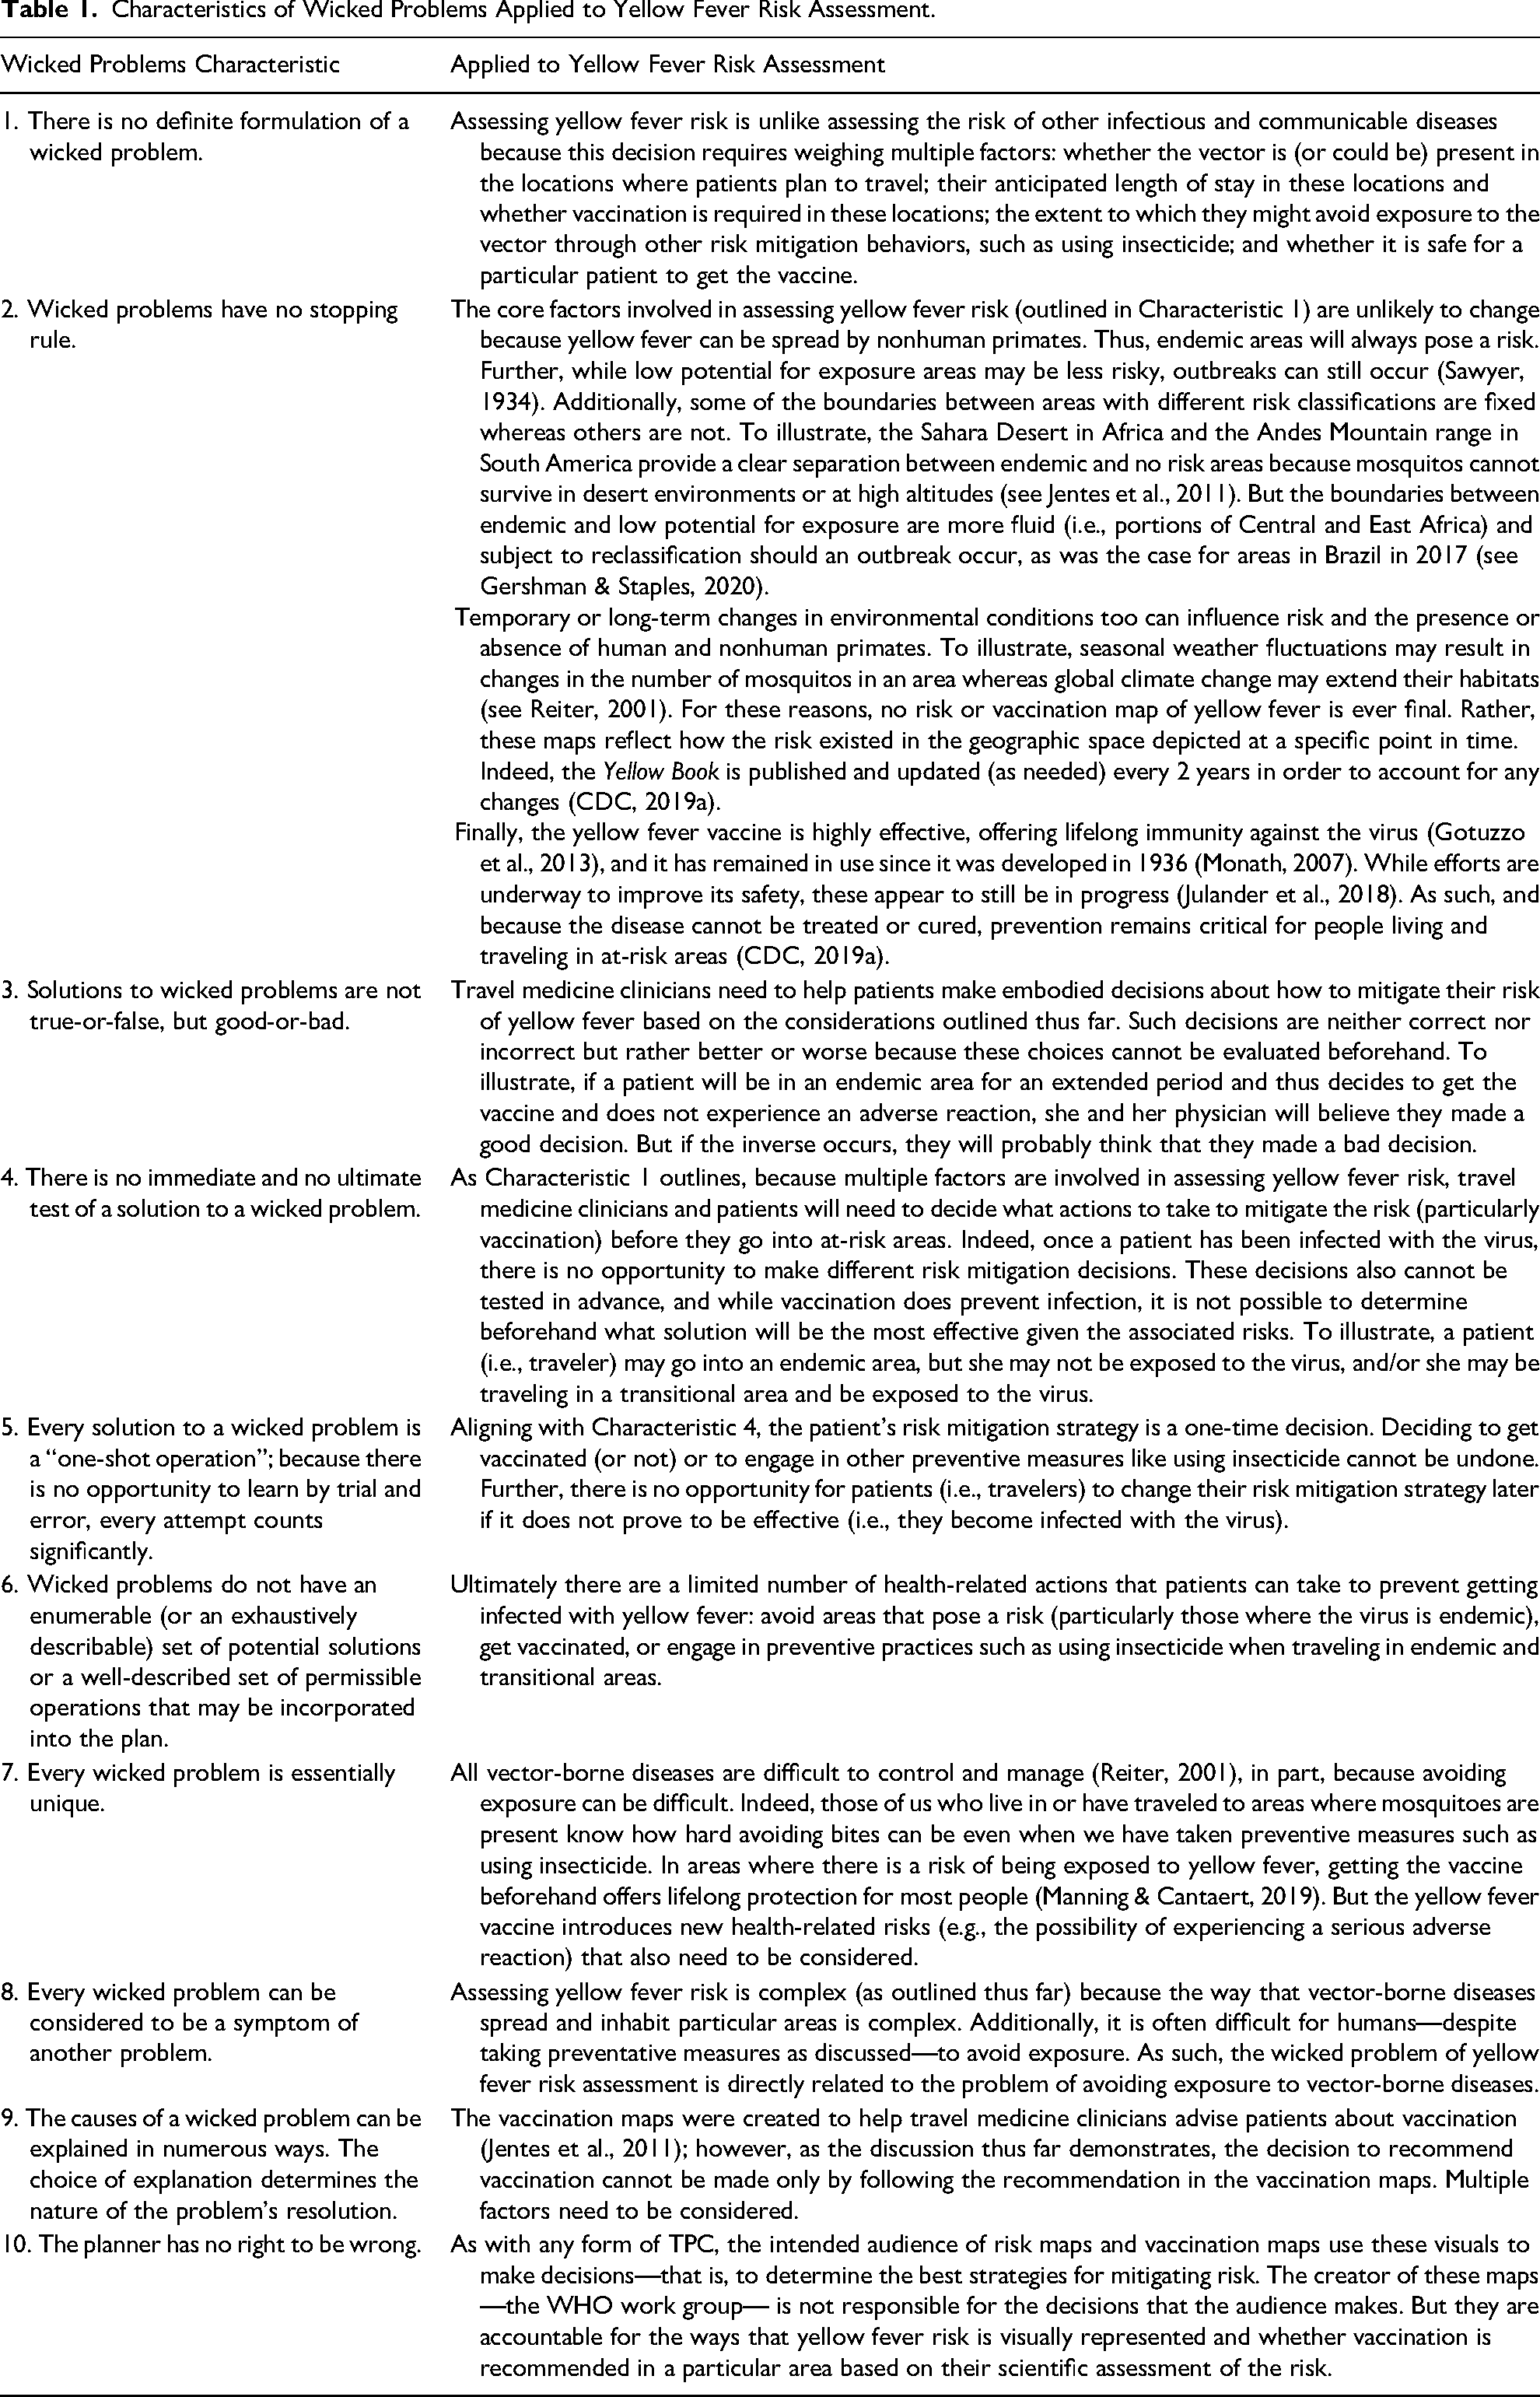
To flesh out the major points in Table 1, I must first point out that the vector is not static; thus, the risk of exposure to yellow fever is also not static. Indeed, the extent to which mosquitos occupy (and might occupy) particular geographic spaces can fluctuate. In some locations (i.e., those classified as endemic) the risk of yellow fever is definitive and constant. But in other areas (i.e., those classified as transitional and low potential for exposure), the risk can shift in response to both temporary and long-term environmental changes, such as seasonal weather fluctuations and global climate change. Indeed, as discussed in Table 1, Characteristic 2, yellow fever risk maps, like other kinds of disease maps, capture a specific moment in time. They construct a particular version of reality by including and excluding select elements (Barton & Barton, 1993), privileging “certain interests while delegitimating and marginalizing other[s],” as Propen (2007, p. 236) characterized Barton and Barton's (1993) position.
Yellow fever transmission is clearly bound to geographic spaces with particular environmental characteristics that are hospitable to the vector, and to contract the virus, humans have to be exposed to the vector. Thus, the work group's vaccination maps continue to highlight this geographic relationship. Further, the longer that travelers remain in endemic areas, the greater their risk of exposure. Travelers may also move between endemic, transitional, and no-risk areas, which changes their risk. Regardless, they can mitigate their risk by consistently engaging in embodied preventative practices (e.g., using insecticides or staying indoors when mosquitos are most active). 3 Travelers can also eliminate their risk entirely by getting vaccinated. But because vaccination introduces the possibility of experiencing a severe adverse reaction, travel medicine clinicians must weigh this additional risk when considering the extent and length of the patient's potential exposure to mosquitos. Indeed, any risk mitigation decisions need to be made before the patient is exposed to yellow fever. Further, the decision to get (or not get) vaccinated and the consequences (positive or negative) of this decision then shape the embodied actions that the patient may need to take to respond to the risk.
Here is an example of the complex decision-making processes that travel medicine clinicians and their patients need to engage in. The clinician determines that the likelihood of the patient experiencing a serious adverse reaction to the vaccine is low. The patient plans to go to areas where the virus is endemic and stay in these areas for a prolonged period. Thus, the clinician recommends vaccination. The patient receives the vaccine and experiences no adverse bodily effects and can then travel in these areas indefinitely. Although the patient will probably still want to engage in other embodied risk mitigation practices to avoid mosquito bites, such as using insecticides, 4 doing so is not necessary to prevent becoming infected with yellow fever.
That example illustrates a best-case scenario for mitigating yellow fever risk. Yet it is impossible to know if the decision to be vaccinated is correct or incorrect beforehand because it cannot be tested out in advance. Indeed, patients and their physicians can only retrospectively evaluate whether getting vaccinated or engaging in other embodied risk mitigation practices was a “good” or “bad” decision (see Table 1, Characteristic 3) depending on whether they avoid becoming infected with the virus and do not experience an adverse reaction from the vaccine. As such, yellow fever risk needs to be assessed on an individualized, case-by-case basis, and different patients (i.e., travelers) will likely need to make different embodied risk mitigation decisions.
Conclusion: Moving From Risk to Vaccination
Historically, risk communication was often seen as a “transfer” of information from experts to nonexperts (Grabill & Simmons, 1998, p. 418; see also Plough & Krimsky, 1987), with nonexperts usually seen as passive recipients (Grabill & Simmons, 1998). Further, when nonexperts’ understanding of a risk failed to align with that of experts—despite being given risk information—the discrepancy was often attributed to a “knowledge-deficit” (Snel et al., 2019, p. 555; 5 see also Wynne, 1991; Ziman, 1991). More specifically, such risk information was presumed to be ineffective because nonexperts did not fully understand the risk scenario due to a lack of numeric or visual literacy (see, e.g., Garcia-Retamero & Cokely, 2017; Lipkus, 2007).
This perspective is problematic not only because it does not account for risk as an embodied experience but because it assumes that nonexperts prioritize quantitative risk information in making their risk mitigation decisions. Indeed, quantitative risk information alone is not always actionable for nonexperts because it cannot account for differences between individuals that could influence how they need to assess and respond to a particular risk. To illustrate, epidemiological research demonstrates that the statistical risk of developing breast cancer increases with age. Women can reduce this risk by getting regular screenings when they reach age 40. Thus, routine mammograms are often recommended for this population. Yet statistical models cannot determine an individual woman's likelihood of being diagnosed with the disease (Luxford, 2003). Further, women with other risk factors, such as a family history of the disease or certain physical attributes (e.g., dense breasts), may need to get more frequent or different kinds of screening (e.g., magnetic resonance imaging [MRI] or ultrasound in addition to a mammogram). These women may also need to engage more regularly in other embodied risk mitigation behaviors such as performing self-breast exams.
Regardless of a woman's specific risk mitigation behaviors, some or all of these practices can be anxiety producing, which often characterizes how women experience this particular risk. For instance, getting a mammogram is physically uncomfortable for some women, and any woman can experience emotional stress while waiting to learn the results of this screening procedure—regardless of how routine it is. For women who are at a higher risk of this disease due to a family history or genetic markers, have had a previous breast cancer diagnosis, or have had to have a breast biopsy, the emotional stress associated with breast cancer screening can be further pronounced. As such, all of these considerations can describe a woman's full embodied experience of managing her breast cancer risk—not just the decisions she needs to make about when, how, and whether to be screened for the disease based on the statistical likelihood of receiving a breast cancer diagnosis.
The notion that risk communication targeted to nonexperts should attend to this level of complexity is not novel in TPC (see, e.g., Ding, 2009, 2014; Frost, 2012; Grabill & Simmons, 1998; Sauer, 2002; Smith & Kain, 2010). Neither is the idea that nonexperts—such as travel medicine clinicians and their patients, as I have discussed in this article—are active users of visual risk information. Indeed, users of technical communication artifacts, as TPC scholars have argued, often have needs, interests, and objectives that the creators of these artifacts may not have fully taken into account (Simmons & Zoetewey, 2012). While Simmons and Zoetewey focused on citizens and the usability of civic websites rather than risk communication, their emphasis on attending to the “productive usability” needs of users can also be applied, I suggest, to risk assessment. More to the point, nonexpert users of risk communication often have their own embodied knowledge, needs, interests, and objectives related to assessing risk, as my discussion has demonstrated.
That said, I also suggest that the WHO work group's decision to replace the risk maps with vaccination maps specifically responds to this more usercentric, embodied risk assessment perspective. As the work group members put it in their review article describing their process, they moved from risk to vaccine to “provide more clarity and ease of use for clinicians” (Jentes et al., 2011, p. 625) and, presumably, also for patients. Indeed, risk maps are generally not targeted to nonexpert viewers (Mills & Curtis, 2008)—such as travel medicine clinicians and patients—and the vaccination maps alone cannot tell these users what decisions to make. But by creating these revised maps, the work group recognized the complexity of yellow fever risk assessment and redesigned the content in order to assist users in their decision-making practices.
This emphasis on non-expert users has recently begun to gain traction in some areas of risk communication outside of TPC. More specifically, scholarship focusing on several health-related risks—osteoporosis (Beaudart et al., 2021), prostate cancer (Hakone et al., 2017), and allergies (Shaker et al., 2020)—has advocated developing more patient-centered risk information, aligning with the overall shift in the provision of health care toward participatory medicine (Institute of Medicine, 2001). Further, research in other subject matter areas, such as Snel et al.’s (2019) work on flood risk, also reflects this trend. Assessing yellow fever risk is, of course, different from assessing risks related to health conditions and floods. But Snel et al.'s study is particularly relevant in illustrating the growing emphasis on user-centered risk information. More specifically, in their research on people living in the Netherlands, they sought “to understand…what information residents themselves need in order to make informed decisions” (p. 555). In other words, rather than focusing on the information about flood risk that they (as experts) found important, they flipped their perspective to consider what information residents needed to know to make decisions.
For risk communication created by experts to continue to evolve beyond the “technocratic” model that Grabill and Simmons (1998, p. 421) described, the change in perspective reflected in Snel et al.’s (2019) work is needed at a widespread level along with an increased awareness of the full range of embodied risk assessment practices that nonexperts perform in specific risk assessment contexts. The wicked problems framework I have used here along with my analysis provide a model that technical and professional communicators can use and share with subject-matter experts to tease out the intricacies of assessing risks in contexts in which risks may be “ill-defined” (Rittel & Webber, 1973, p. 160) and “complex in their causes and effects” (Wickman, 2014, p. 24). Further, although using this framework does not necessarily solve wicked problems in risk assessment, we can use it to develop strategies that address challenges such as creating vaccination maps or other visual risk information. As such, this framework can be used to facilitate a more nuanced and rhetorically aware understanding of risk that accounts for the embodied decision-making tasks that nonexperts perform.
Footnotes
Declaration of Conflicting Interests
The author declared no potential conflicts of interest with respect to the research, authorship, and/or publication of this article.
Funding
The author received no financial support for the research, authorship, and/or publication of this article.