
Abstract
Objectives:
The current American Joint Committee on Cancer medullary thyroid cancer (MTC) staging system qualitatively stratifies lymph node (LN) status based on involved LN compartments; however, American Thyroid Association guidelines note that quantitative assessment of LN metastases “should be incorporated.” Several studies have proposed LN ratio (LNR) and number of positive LNs as prognostic parameters. We (1) assess whether there are prognostically significant LN thresholds, (2) estimate their association with MTC-specific mortality, and (3) appraise the identified thresholds using an institutional database.
Methods:
In this retrospective cohort analysis, MTC patients were abstracted from the Surveillance, Epidemiology, and End Results database (2004–20). Cox models with restricted cubic splines assessed the functional relationship of LNR and positive LN count with MTC-specific mortality. Thresholds were estimated using Markov Chain Monte Carlo and bootstrapping. Multivariable models estimated the association of the thresholds with mortality. The testing cohort comprised 149 patients with MTC at a single institution (1996–2025).
Results:
There were 2709 patients in the derivation cohort; 2098 (77.4%) had LNs examined. Mean patient age was 54.1 years, 59.1% were female, and 69.6% were non-Hispanic White. Mean tumor size was 23.5 mm; 52.7% of patients with LNs examined had ≥1 positive LN. The 5-year MTC-specific survival was 93.3%. Threshold values of 7.8 positive LNs and a LNR of 13.8% were identified (nonlinearity p < 0.001 for both). Adjusted analyses revealed that ≥8 positive LNs were associated with a significantly increased hazard of MTC-specific mortality (hazard ratio [HR] 1.54, confidence interval [CI]: 1.09–2.17, p = 0.014, model area under the curve [AUC] 86.7%); a LNR ≥14% was associated with a significantly increased mortality hazard (HR: 3.308, CI: 2.096–5.222, p < 0.001, model AUC: 87.9%). The thresholds were significantly associated with recurrence-free survival in the testing cohort: 5-year recurrence-free survival was 56.5% (CI: 39.5 − 70.4) for patients with ≥8 positive LNs and 90.5% (CI: 82.5 − 94.9) for <8 (log-rank p < 0.001); it was 67.9% (CI: 55 − 77.9) for patients with LNR ≥14% and 92.8% (CI: 83.6 − 97) for LNR <14 (log-rank p < 0.001).
Conclusions:
Using population-level data, we identified robust LN thresholds associated with MTC-specific mortality. Compared with a threshold of 8 positive LNs, a LNR threshold ≥14% was associated with a greater increase in hazard of MTC-specific mortality.
Introduction
Medullary thyroid cancer (MTC) is a rare thyroid neoplasm, accounting for 1–2% of identified thyroid malignancies.1,2 Despite its rarity, MTC is associated with higher mortality than papillary and follicular thyroid cancer and is responsible for 13.4% of thyroid cancer deaths. 1 MTC has a 10-year overall survival (OS) rate of less than 80%; notably, patients with cervical lymph node (LN) metastases have an estimated survival of ≤70%.3–8 As such, LN involvement has been identified as an important prognostic factor in MTC survival. However, unlike the American Joint Committee on Cancer (AJCC) TNM classification system N category for several cancers—such as small bowel, gastric, colorectal, and breast—which include quantitative nodal data and specific nodal thresholds in cancer staging,9,10 the current AJCC staging system for MTC utilizes a qualitative approach. It categorizes nodal metastases based on cervical region involvement: N0 indicates no known nodal metastases, N1a indicates metastases to level VI and VII, and N1b indicates metastases to lateral cervical or retropharyngeal LN compartments.9,11 This lack of quantitative assessment of involved LNs could compromise precise MTC staging and risk stratification.
A number of studies have attempted to assess quantitative thresholds for LN metastases that may improve MTC staging. Some have proposed stratifying positive LN counts into arbitrary intervals of 5 or 10.12,13 In addition, a few studies that have examined LN ratio (LNR) as a prognostic factor in MTC survival 3 have reported a LNR of 10–50% as associated with compromised survival.14–16 A common limitation of published studies is the use of arbitrary LN thresholds. Conversely, Rozenblat and colleagues used receiver operating characteristic analysis and Youden index to identify a LNR of 15% as a cutoff threshold for disease-specific survival within a cohort of 107 patients. This threshold was not validated, and further analysis within the study utilized an arbitrary LNR of 10%, given its common use in head and neck malignancies. 15 However, the identified cutoff was then used by another group 17 to model 5-, 10-, and 20-year mortality in a retrospective registry analysis using the SEER database.
Other studies used X-tile software to derive thresholds for LN metastases.1,18,19 Interestingly, even though these studies have used the same software and the same database, they have identified three different thresholds of ≥9, 18 ≥10, 19 and ≥11 1 positive LNs as associated with worse prognosis. The X-Tile software is a downloadable online program and may offer a reasonable and simplified method for identifying cut points for some study data. 20 It is not commonly used within the statistical realm and, given the variable results obtained from this software in published studies, it was not considered for our study.
Given that potential modifications to cancer staging criteria are critical decisions that must be based on rigorous and reproducible science, we determined that the most appropriate approach was to use Restricted Cubic Spline modeling. This method remains the “gold standard” for cut-point estimation 21 and has been widely applied in cancer prognostic research across various malignancies.22–26 As such, we aimed to objectively identify LN metastases and LNR thresholds associated with mortality in patients with MTC. We also examine and compare the prognostic impact of LN metastases and LNR thresholds on MTC-specific mortality and appraise the derived thresholds using recurrence-free survival within an institutional cohort. Our overall hypothesis is that objective LN thresholds associated with prognostic implications on MTC-specific outcomes exist.
Methods
Data source for LN threshold derivation
This study is a registry-based retrospective cohort analysis. We utilized the Surveillance, Epidemiology, and End Results (SEER; 2004–2020) database to identify the MTC study sample. The SEER data files are de-identified; this study was granted an exemption by the Duke University Health System’s Institutional Review Board (IRB: Pro00045337). The SEER registry contains information on approximately 47.9% of cancer patients in the United States, including patients from all regions.27,28 Available data include patient demographics, tumor information, including primary tumor site and morphology, initial treatment course, and outcomes. This study utilized data from the SEER-17 registry released in November 2022.
Patient population
The study sample included patients diagnosed with MTC from 2004 to 2020 captured in the SEER database. Patients with MTC were abstracted using International Classification of Diseases for Oncology-3 codes 8345 and 8510. Patients with information on index surgery (including total thyroidectomy, subtotal thyroidectomy, lobectomy, isthmusectomy, and no surgery) were included. Patients with MTC diagnosed on autopsy or death certificate only were excluded. In addition, excluded were patients who did not have MTC biological or microscopic confirmation and those missing histological subtype or staging information.
Outcomes/data collection and variables
Demographic variables, including age, sex, and race/ethnicity (Hispanic, Non-Hispanic Asian or Pacific Islander, Non-Hispanic Black, Non-Hispanic White), and year of diagnosis, were abstracted. Tumor and disease variables, including tumor size, tumor extension (no extension, minimal, and high risk), and metastases, were obtained from SEER and analyzed. Surgery, chemotherapy, and radiation information were extracted. Surgical management included lobectomy, subtotal thyroidectomy, and total thyroidectomy. LN data, including the total number of LNs examined by a pathologist and the number of positive LNs, were collected. The LNR was calculated as the proportion of positive LNs to the total LNs examined. Outcomes included OS and MTC-specific survival/mortality (primary outcomes of interest).
Statistical analyses
Categorical data are reported as absolute numbers (N) with percentages. Continuous variables are reported as median (interquartile range, IQR). Restricted cubic spline-derived models detect nonlinear relationships to characterize dose–response, offering insights into the effect continuous predictors have on outcomes. 21 Similar to our previous work on thyroidectomy volumes, 29 we used restricted cubic splines analysis in the context of Cox Proportional hazards models with knot nodes at the 25th, 50th, and 75th percentiles to identify threshold values. The Markov Chain Monte Carlo procedure, an algorithm that approximates the probability distribution of potential thresholds by creating several simulated datasets and estimating threshold values from those simulations, 30 was used to identify thresholds within our models. Bootstrapping, a resampling technique that starts by drawing a sample with replacement from the original patient sample and performing the threshold analysis on this bootstrap sample, and then repeating this process for a prespecified number of iterations 31 (1000 in this case), was applied to ensure that estimated thresholds are representative of the larger patient population. After bootstrapping, we have 1000 estimated thresholds, creating the distribution of the threshold values. The mean of this distribution was selected as the final threshold to use in this study, and the confidence intervals (CIs) around each threshold were also estimated from the bootstrap analysis as the 2.5th and 97.5th quartile of the said distribution.
Multivariable survival analysis was done to estimate the association of the identified thresholds with MTC-specific mortality. Using Cox Proportional Hazards models, multivariable analysis was performed adjusting for several factors, including sex, race/ethnicity, type of surgery, tumor extension, metastasis, chemotherapy, radiation therapy, and year of diagnosis. Hazard ratios (HRs) and CIs are reported. To assess potential immortal time bias introduced by including adjuvant therapies in adjusted survival models, sensitivity analyses were conducted excluding patients who received chemotherapy or radiation therapy. All statistical analyses were performed using SAS, version 9.4 (SAS Institute, Cary NC). Statistical significance was set to a p value of <0.05 for all analyses.
Testing set
Data from patients diagnosed with MTC were abstracted from two Duke University Medical Center institutional databases: the Private Diagnostic Clinic Outcome Research Team (PORT-Thyroid database) 32 and MTC/MEN database. 33 Overall, this testing sample included patients seen for a diagnosis of MTC from January 1996 with follow-up time through April 2025 who met inclusion criteria for the primary analysis of the SEER database (i.e., diagnosis of MTC and at least one LN examined). Demographic data, including age at diagnosis and sex, were abstracted. Tumor and disease variables, including tumor size, RET mutation status, and preoperative calcitonin and carcinoembryonic antigen (CEA), were collected. Due to the limited number of deaths, recurrence-free survival, defined as the time from diagnosis to recurrence or death, whichever came first, was used as the outcome of interest. Recurrence was defined as specific documentation of recurrence by a patient’s endocrinologist, worsening persistent disease, elevated calcitonin above the limit of normal with a doubling time <1 year, or clinical or radiographical evidence of structural recurrent disease on follow-up. 33
Patients who did not recur or die were censored at date of last follow-up. Follow-up time was estimated using the reverse Kaplan–Meier method. Unadjusted survival was estimated using the Kaplan–Meier method, and log-rank tests were used to compare survival between groups. Cox proportional hazards models were used to estimate the association of group with survival. HRs and CIs are reported. No adjustments were made for multiple comparisons. All statistical analyses were conducted using SAS, version 9.4 (SAS Institute, Cary NC).
Results
Baseline characteristics of the LN threshold derivation (SEER) sample
A total of 2709 patients were identified with histology-confirmed MTC from 2004 to 2020 in the SEER database (Fig. 1). The median patient age was 56.0 years (IQR: 44.0, 67.0 years) (Table 1). Most patients (59.1%) were female and identified as non-Hispanic White (69.6%). The median tumor size was 2.0 cm (IQR 1.0–3.2 cm). Most patients underwent total thyroidectomy (92.0%). Overall, 5-year MTC-specific survival was 93.3% (CI: 92.1–94.5).
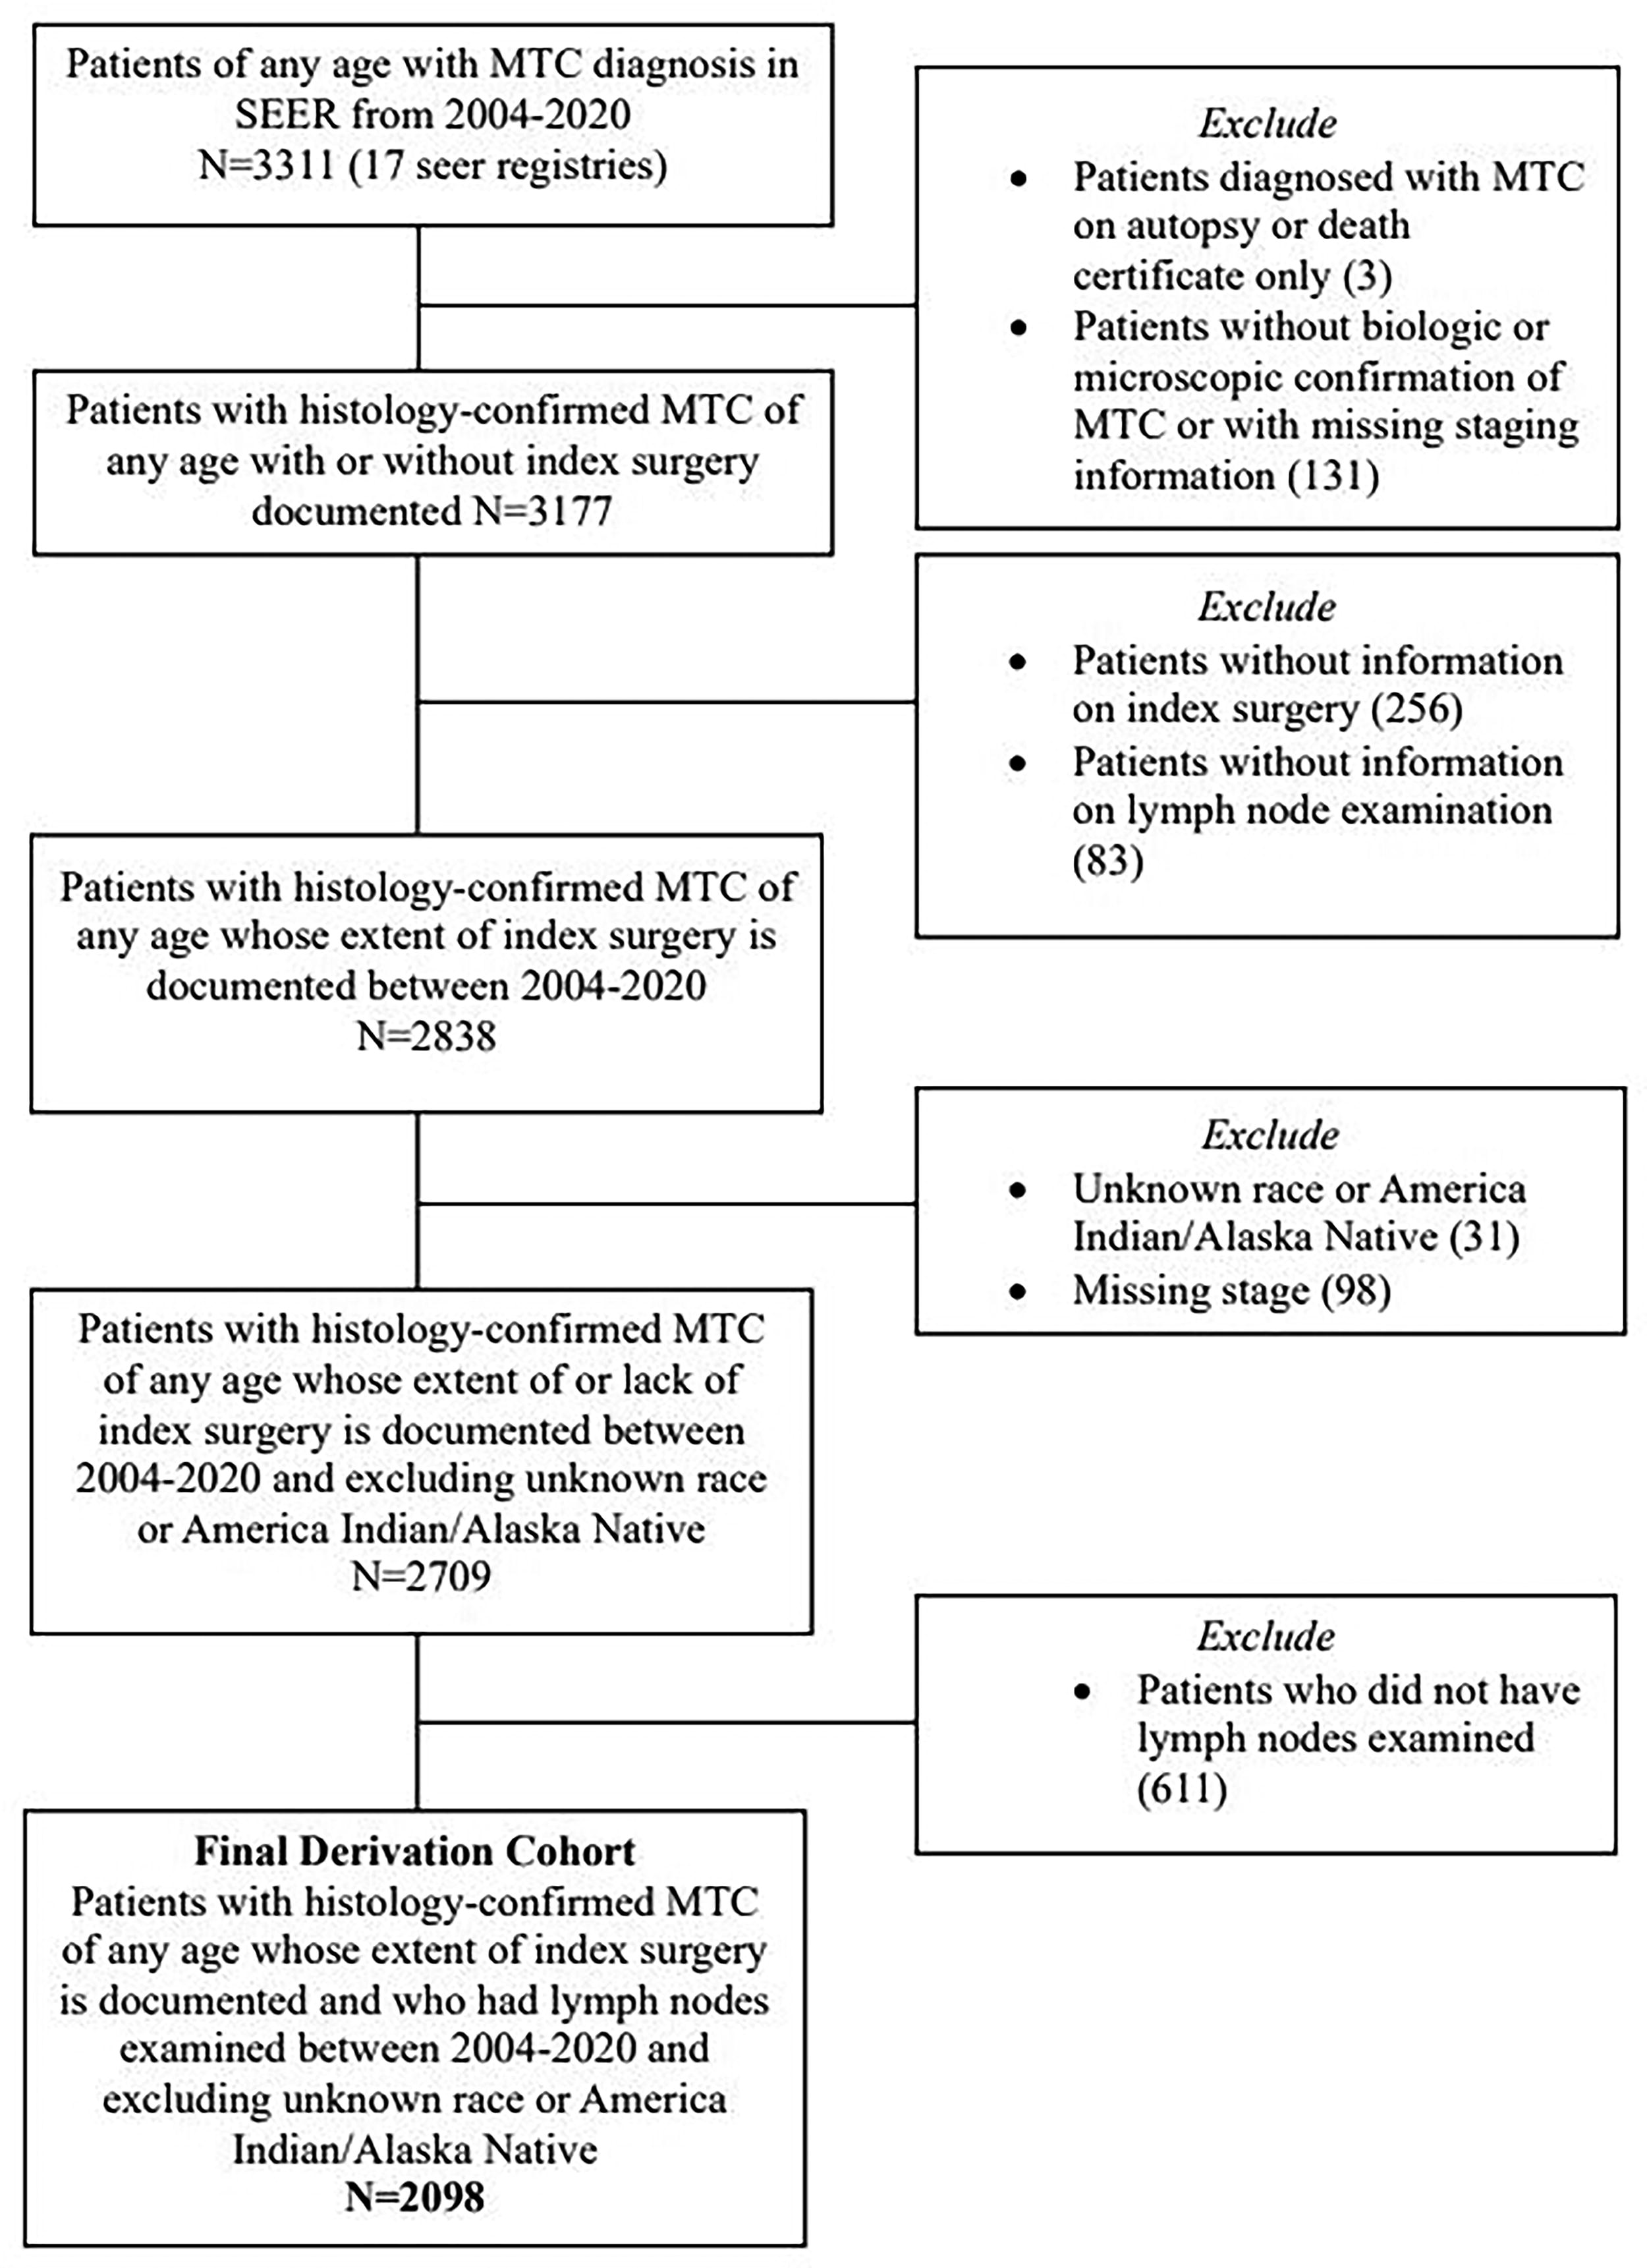
Flow of patient abstraction from the SEER database to create the study cohort. SEER, Surveillance, Epidemiology, and End Results.
Demographic, Clinical, and Pathological Characteristics of Patients with Medullary Thyroid Cancer: Surveillance, Epidemiology, and End Results Program (2004–2020) Stratified by Lymph Node Status
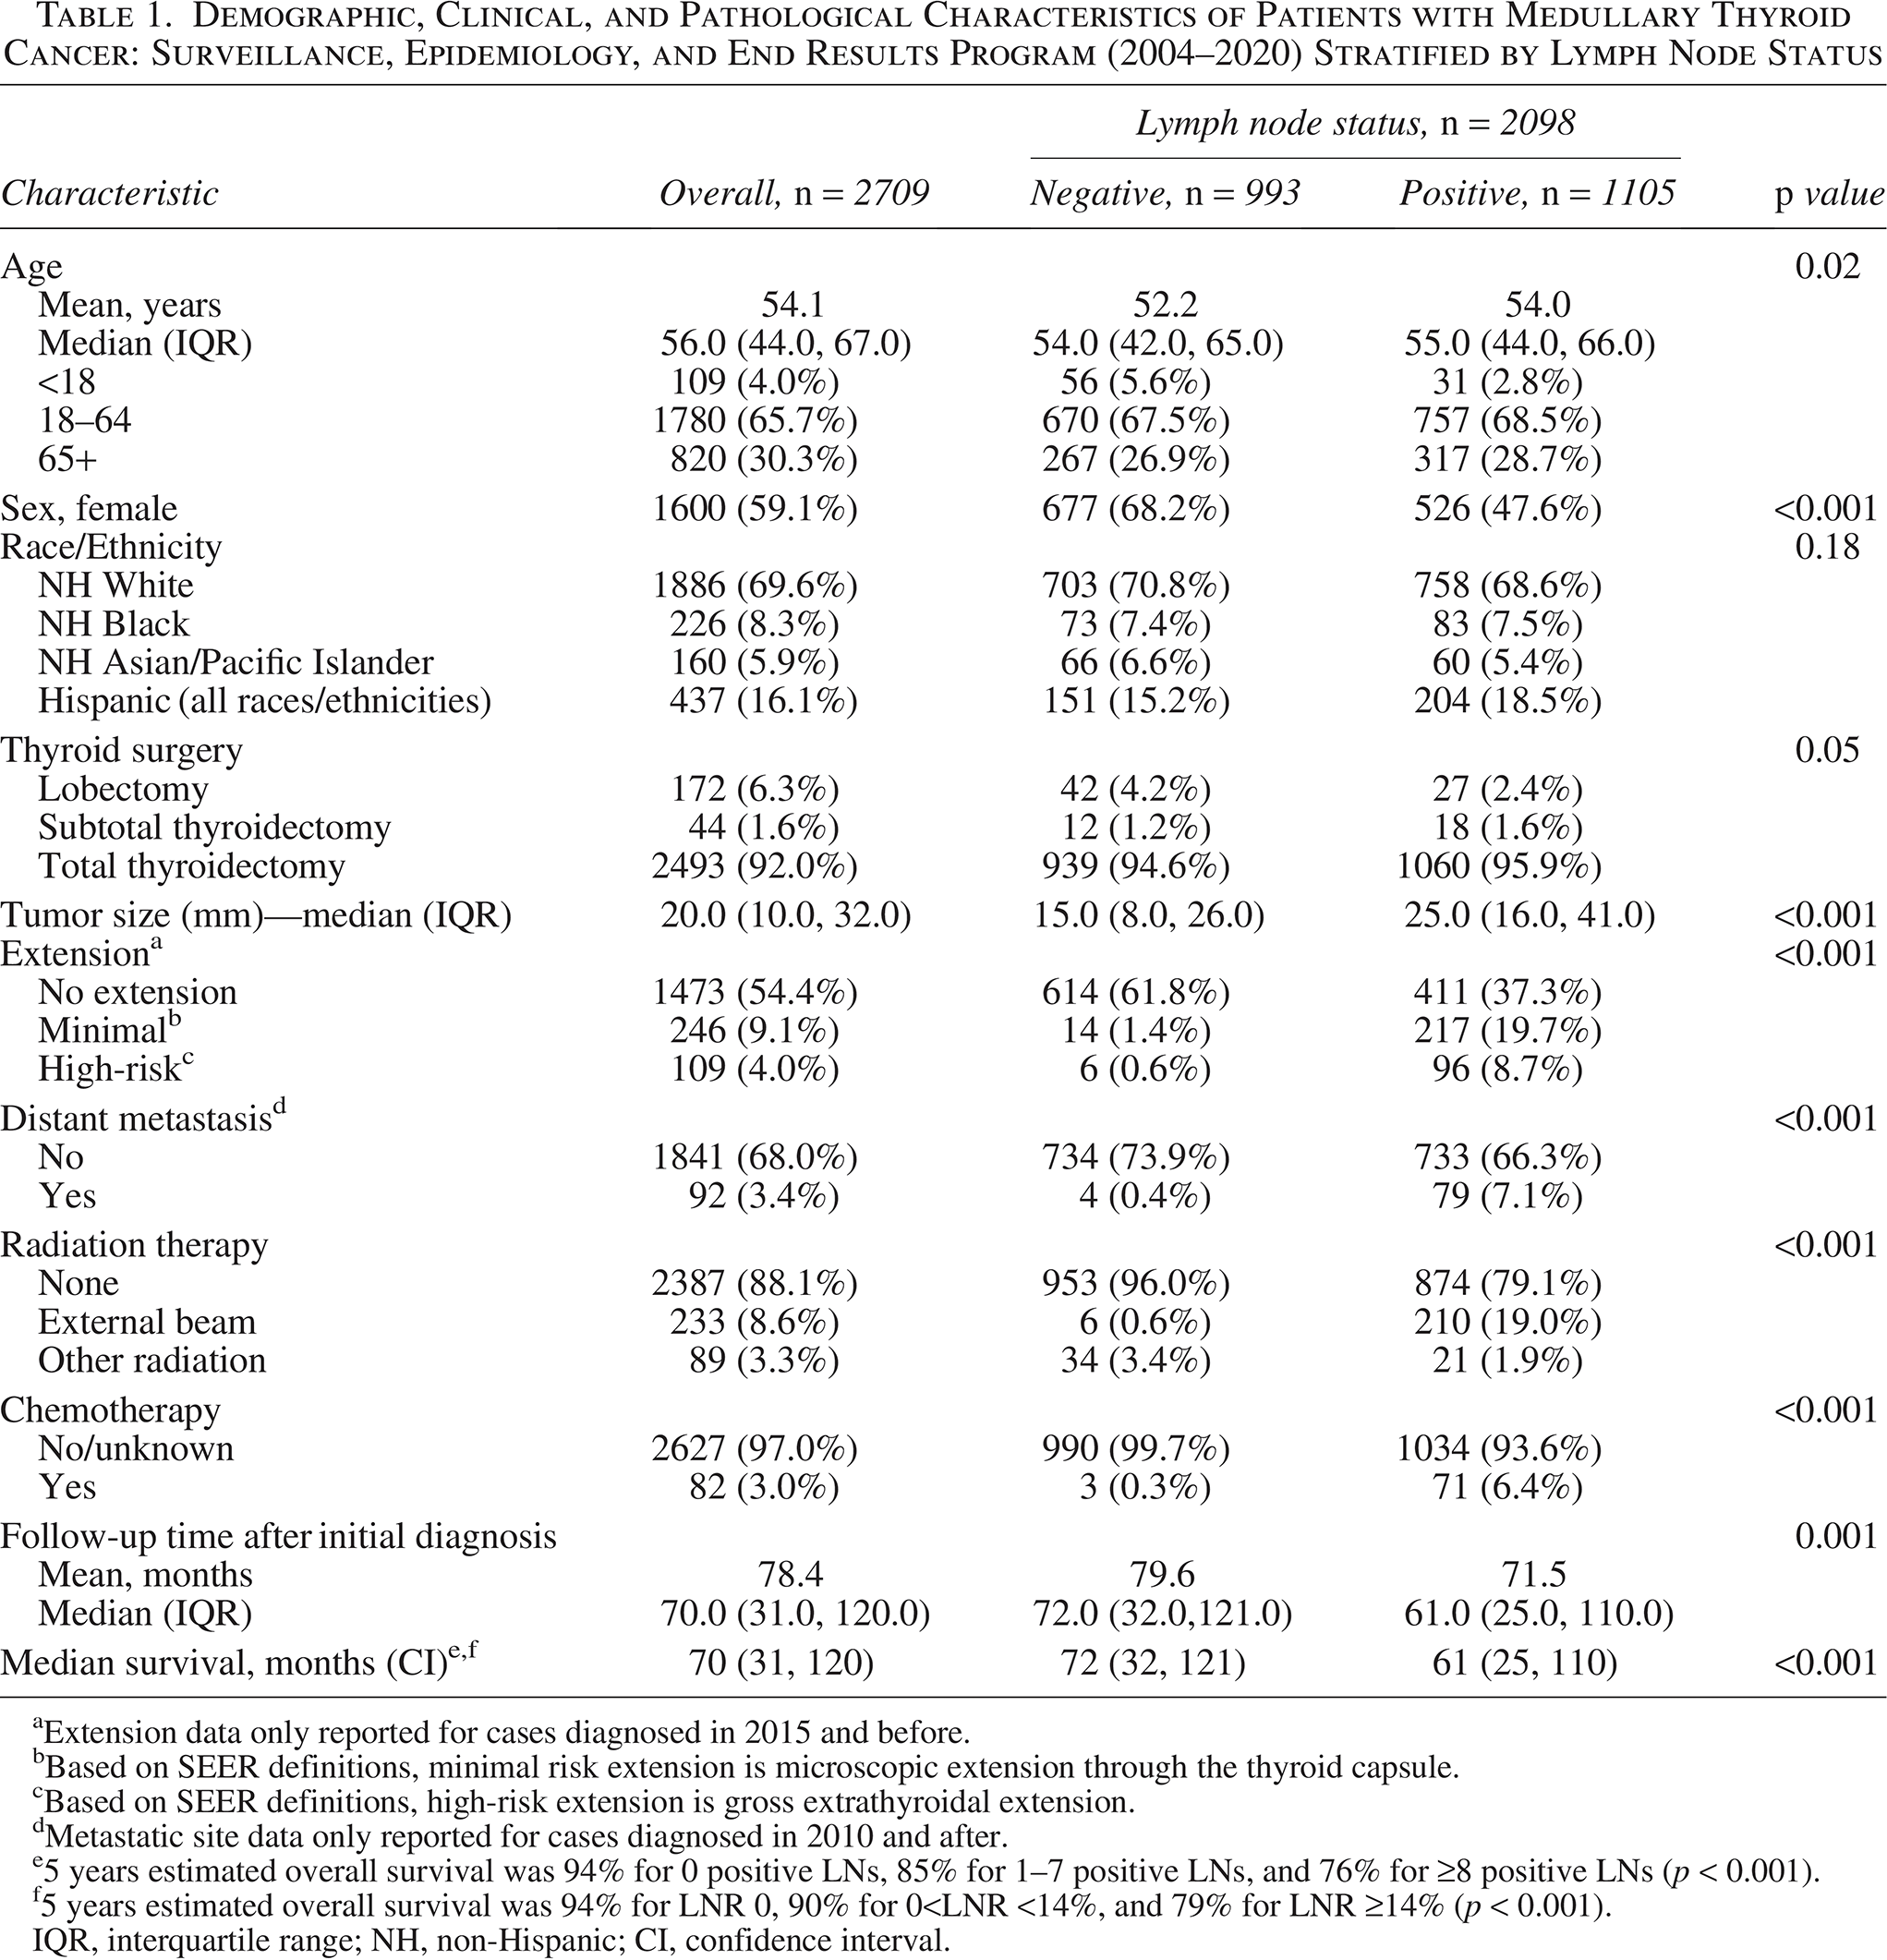
Extension data only reported for cases diagnosed in 2015 and before.
Based on SEER definitions, minimal risk extension is microscopic extension through the thyroid capsule.
Based on SEER definitions, high-risk extension is gross extrathyroidal extension.
Metastatic site data only reported for cases diagnosed in 2010 and after.
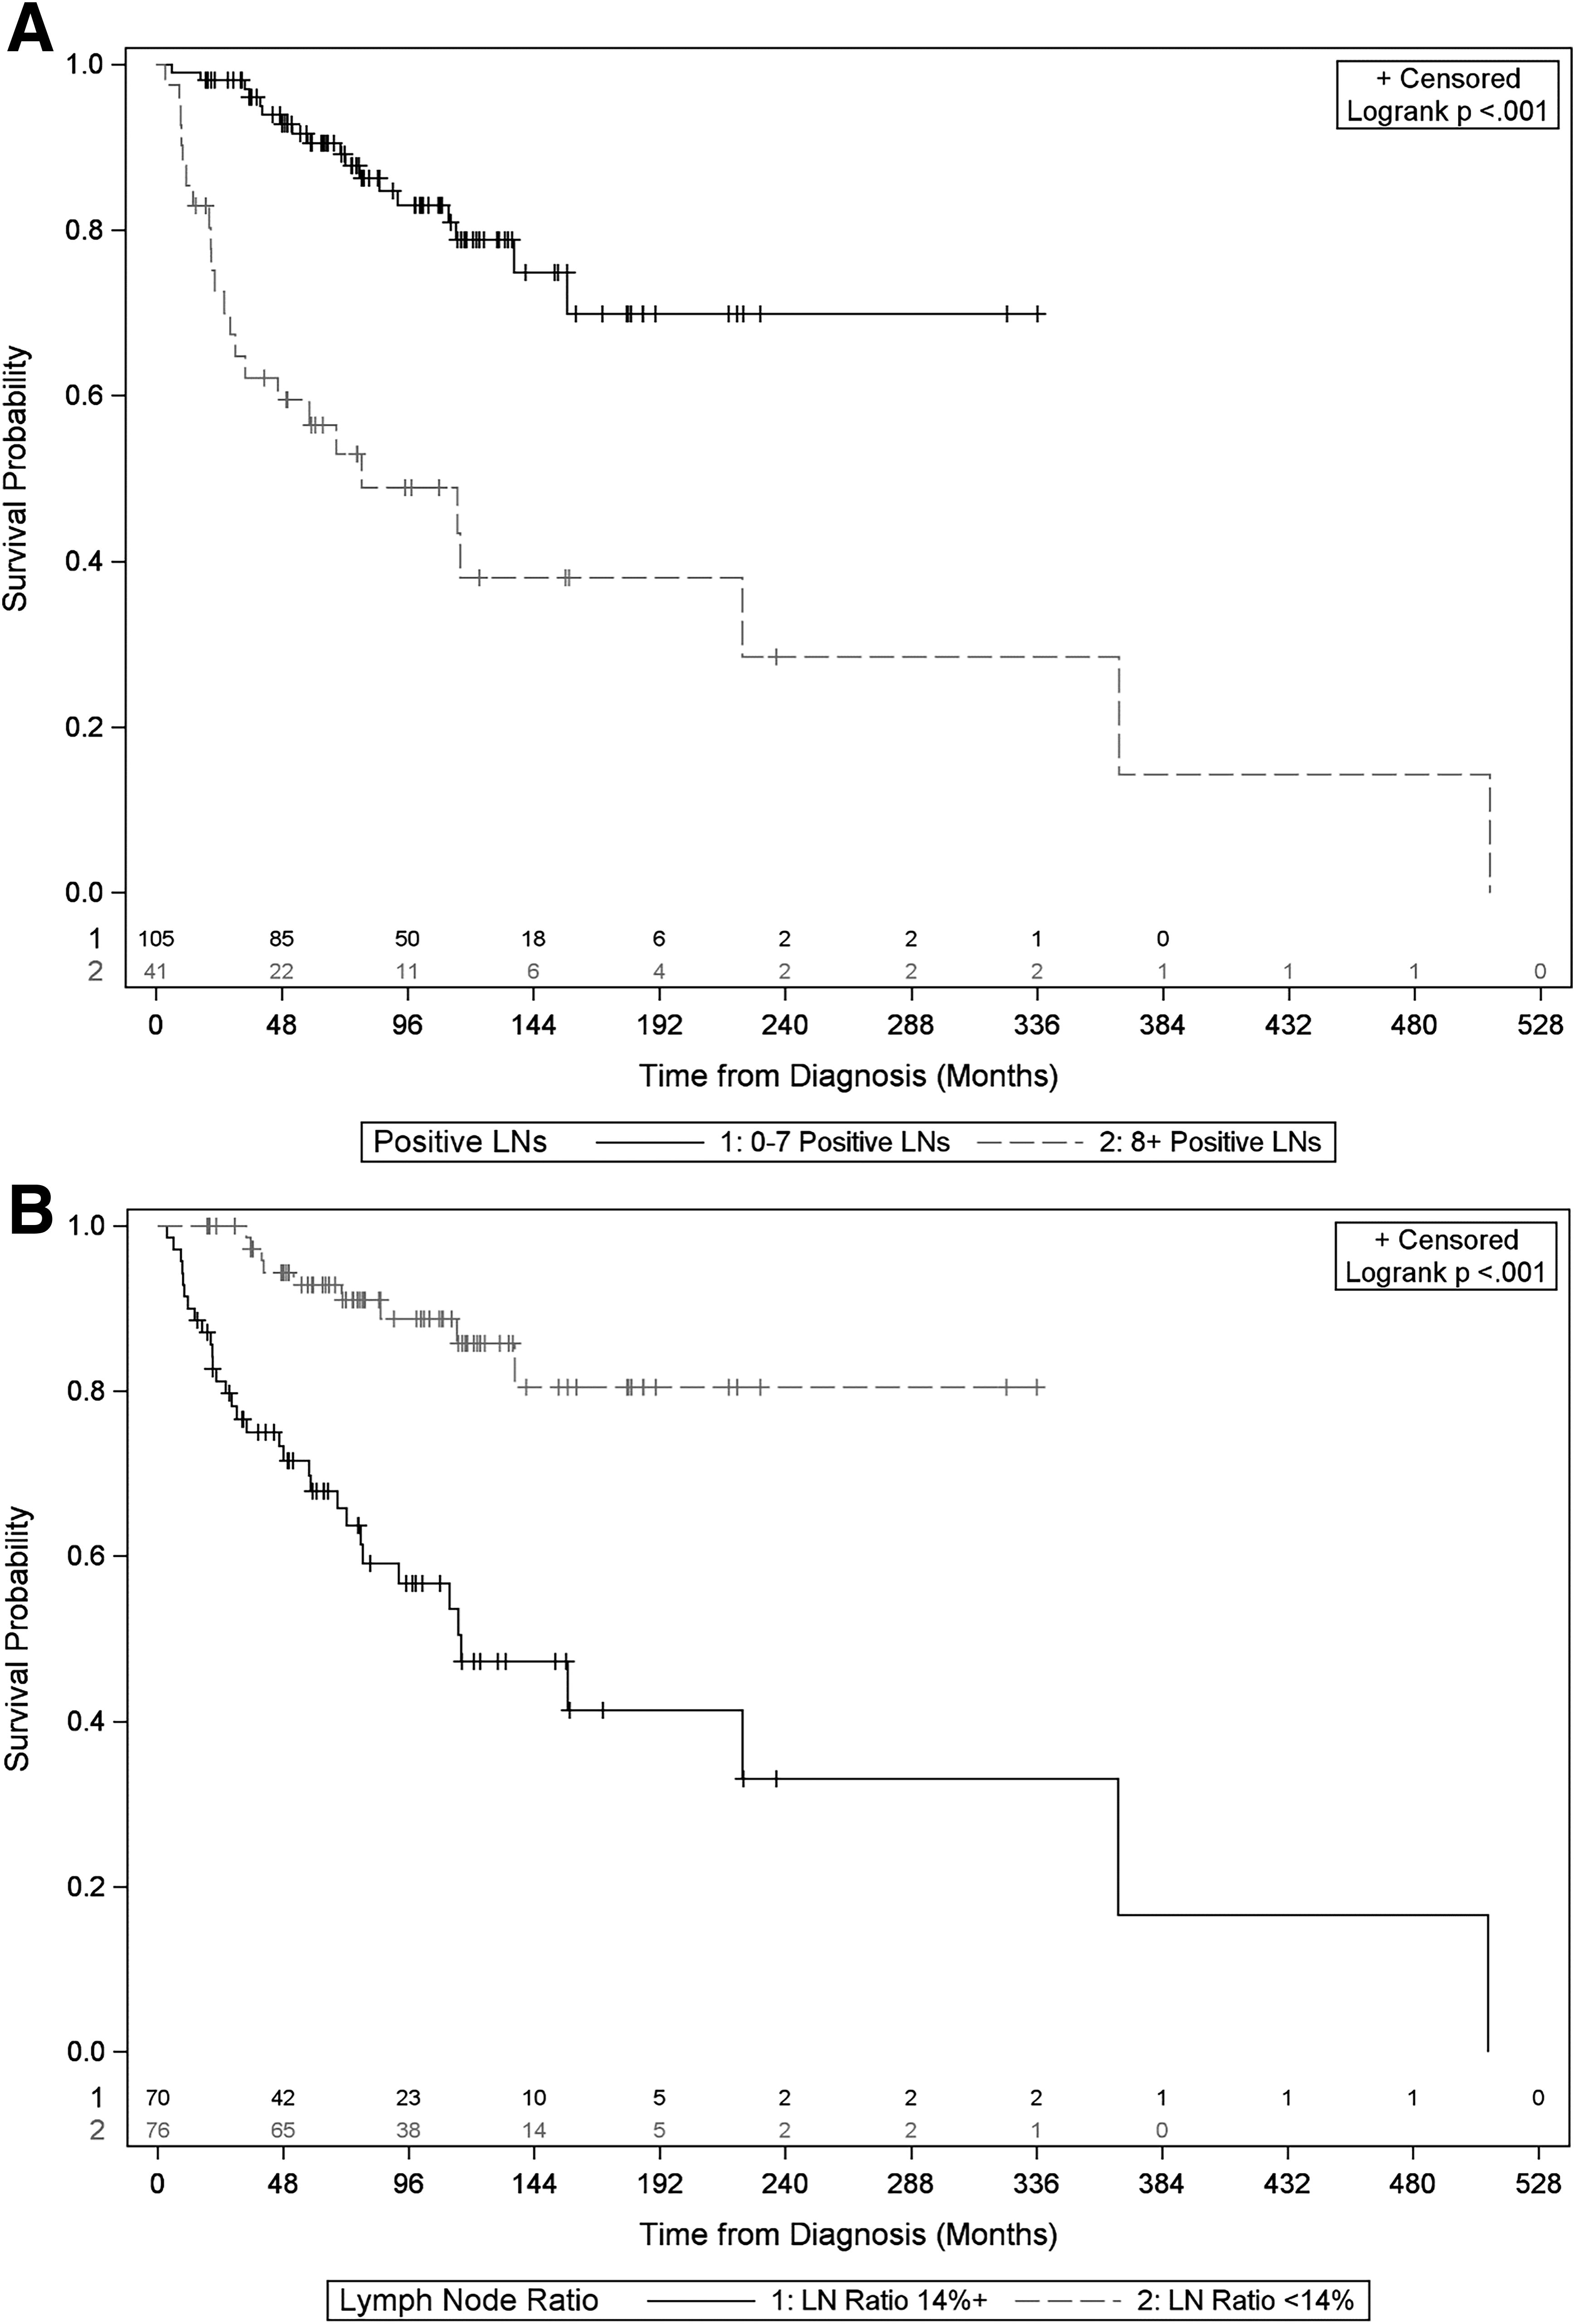
5 years estimated overall survival was 94% for 0 positive LNs, 85% for 1–7 positive LNs, and 76% for ≥8 positive LNs (p < 0.001).
5 years estimated overall survival was 94% for LNR 0, 90% for 0<LNR <14%, and 79% for LNR ≥14% (p < 0.001).
IQR, interquartile range; NH, non-Hispanic; CI, confidence interval.
Of the 2098 patients that had LNs examined, 52.7% had positive LNs (Table 1). The median patient age was 54.0 years among patients with a negative LN status and 55.0 years among patients with a positive LN status (p = 0.02). Most patients with negative LN status were female (68.2%); in contrast, most patients with positive LN status were more likely to be male (52.4%). Patients with positive LN status had a significantly larger median tumor size (2.5 cm) than patients with negative LN status (1.5 cm) (p < 0.001) (Table 1). In addition, patients with positive LN status were significantly more likely to present with extrathyroidal extension than patients with negative LN status. Furthermore, patients with positive LN status were more likely to present with distant metastasis than patients with negative LN status (Table 1).
Determination of optimal LN metastases and LNR threshold values
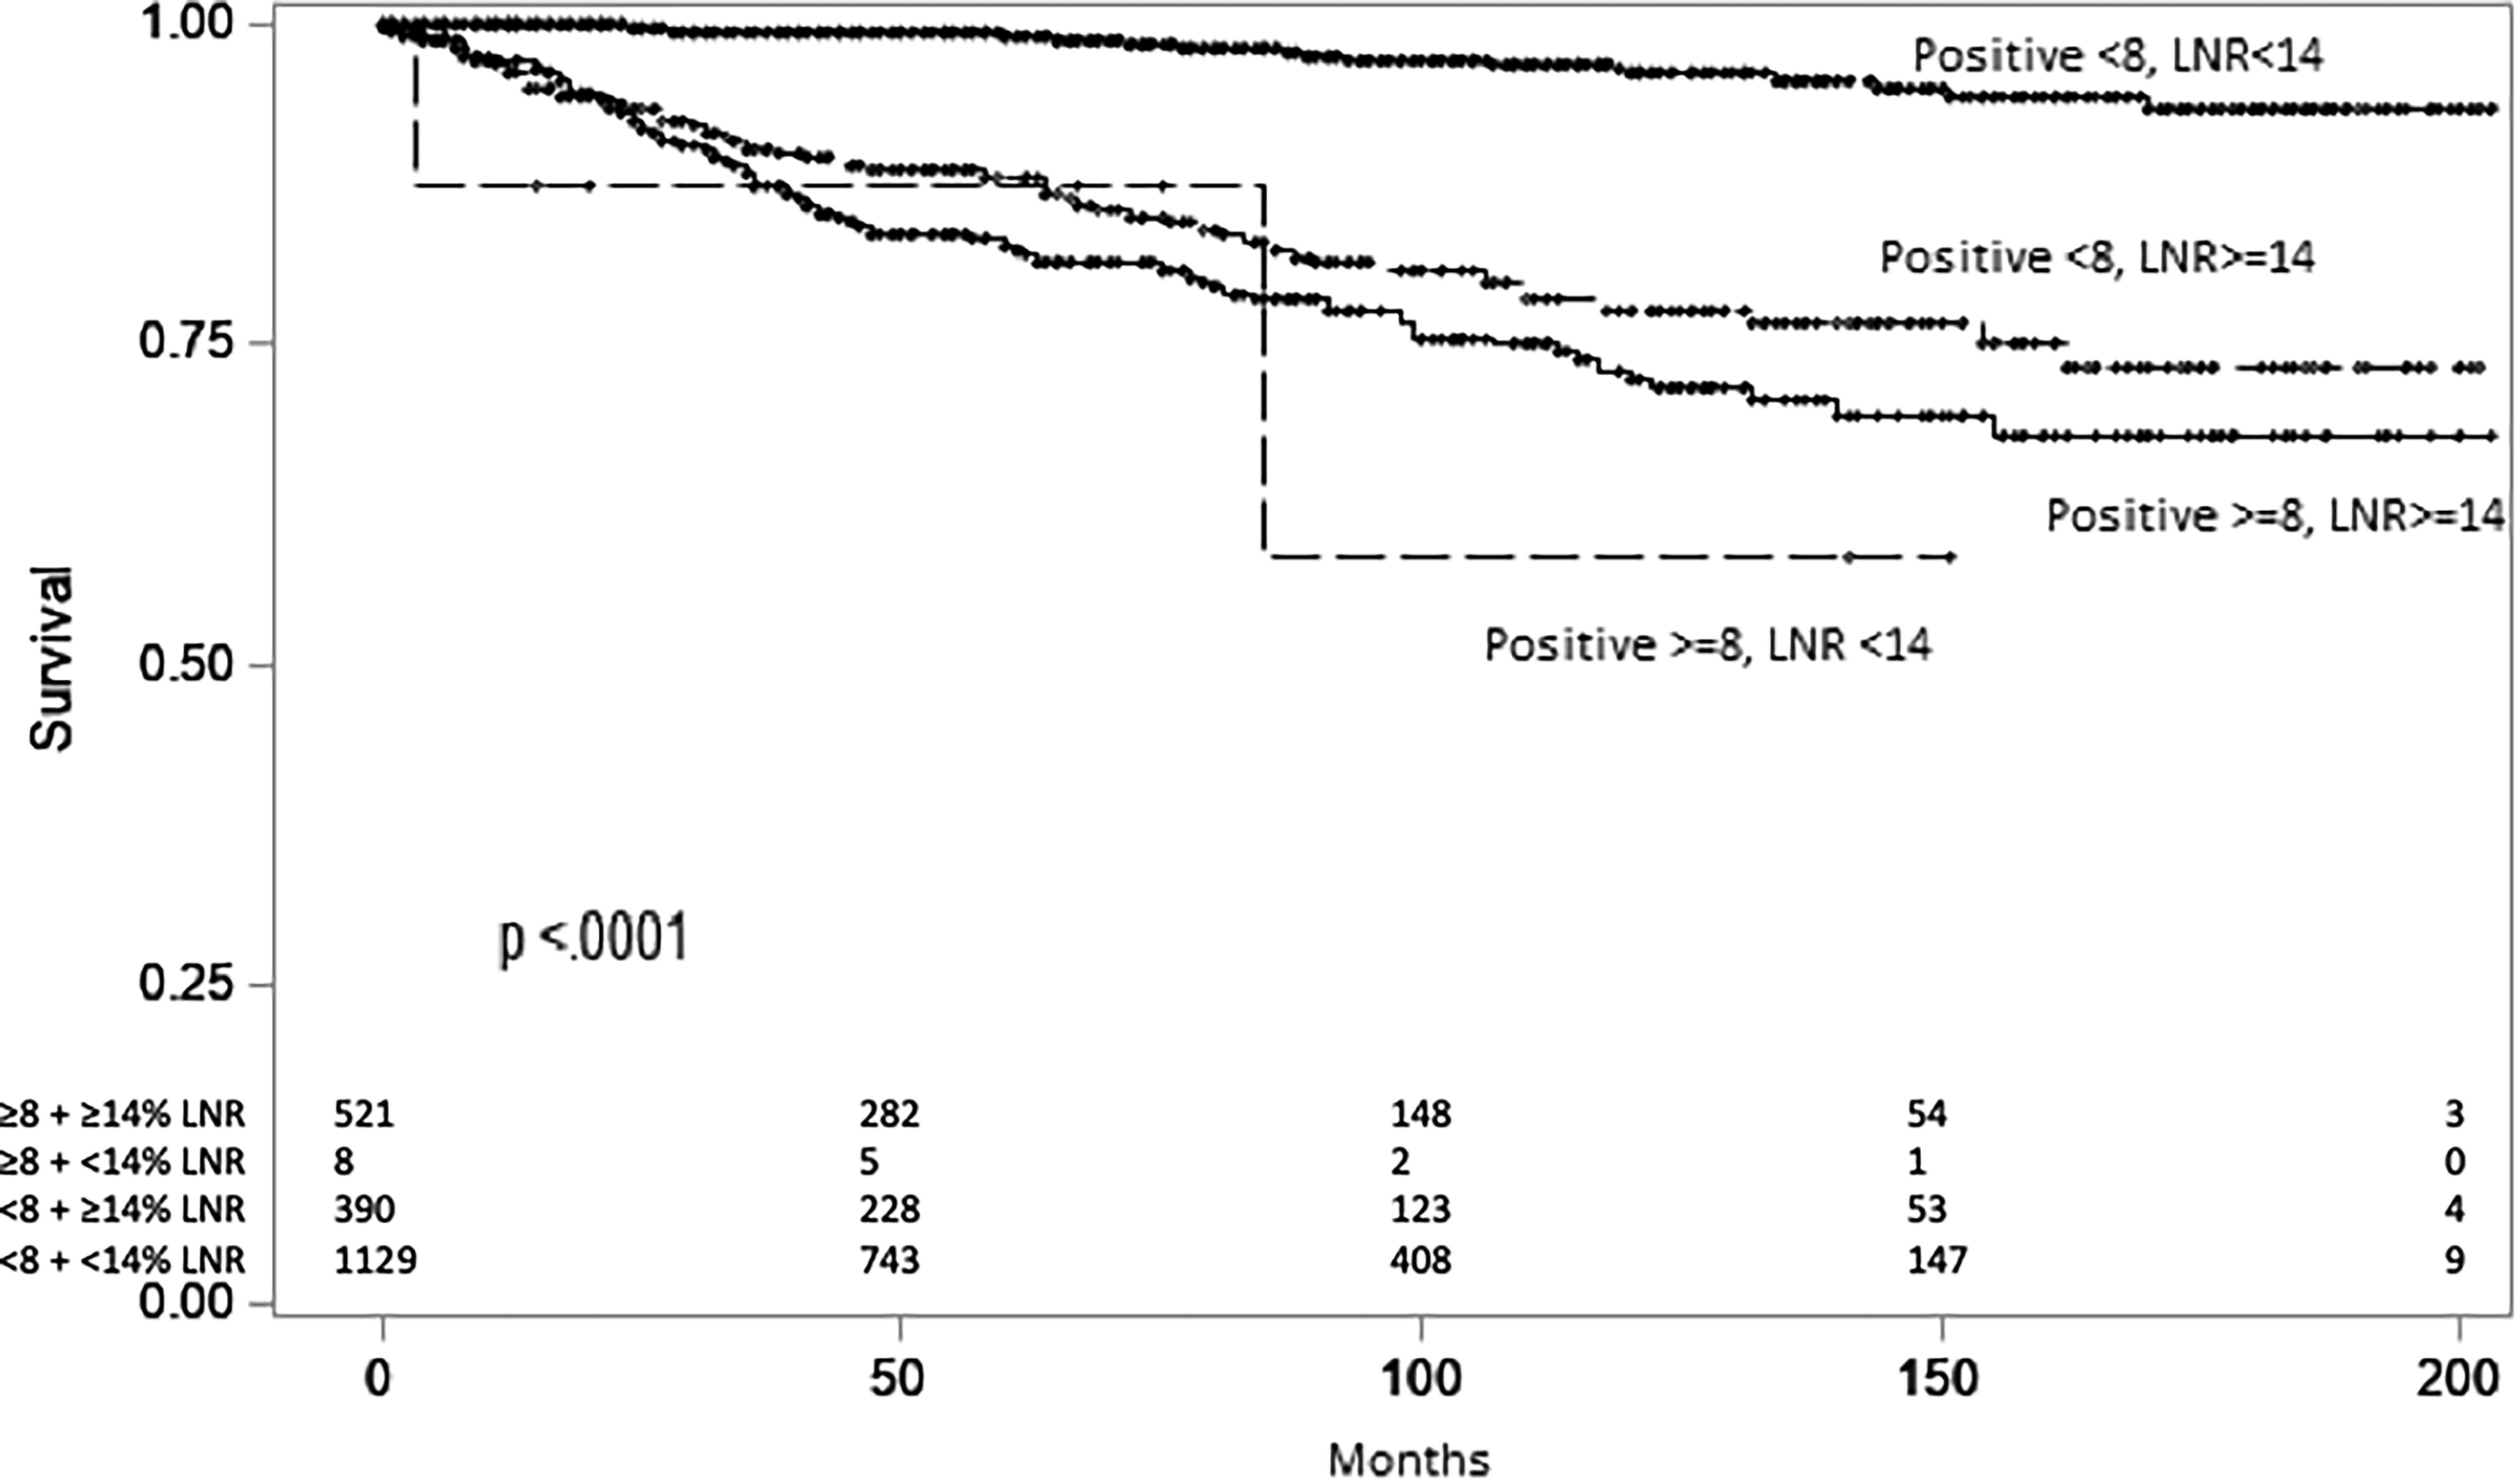
A restricted cubic spline model was applied to model the relationship between positive LNs and LNR and MTC-specific mortality. Both were found to have nonlinear relationships, indicating the existence of thresholds. Bootstrapping techniques identified optimal cutoff, “threshold” values of 7.8 (CI: 7.6–8.0) positive LNs (Fig. 2) and a LNR of 13.8% (CI: 13.5–14.0) (Fig. 3), (p < 0.001 for both). Kaplan–Meier analysis revealed significant trends in MTC-specific survival based on nodal status and the identified thresholds (p < 0.001): Patients with ≥8 positive LNs had worse MTC-specific survival than patients with 1–7 positive LNs, who in turn had worse survival than patients with negative nodal status (Fig. 4A). At 5 years, estimated MTC-specific survival was 98.4% for 0 positive LNs, 88.0% for 1–7 positive LNs, and 78.8% for ≥8 positive LNs (p < 0.001). Patients with a LNR ≥14% had worse survival than patients with a LNR >0 and <14%, who in turn had worse survival than patients with negative nodal status (Fig. 4B). Similarly, at 5 years, estimated MTC-specific survival was 98.4% for LNR of 0%, 92.2% for 0<LNR <14%, and 82.2% for LNR ≥14% (p < 0.001). When both thresholds were combined, estimated 5-year MTC-specific survival was 83% for patients with ≥8 positive LNs and LNR ≥14%, 88% for patients with <8 positive LNs and LNR ≥14%, and 99% for patients with <8 positive LN and LNR <14% (p < 0.001) (Fig. 5).

Restricted cubic spline (RCS) model for positive lymph nodes and MTC-specific mortality (N = 2098). The RCS model demonstrates the effect of a continuous predictor, the number of positive lymph nodes, on an outcome, MTC-specific mortality. The identified threshold (7.8 LNs) is represented as a vertical dashed line. MTC, medullary thyroid cancer; LNs, lymph nodes.
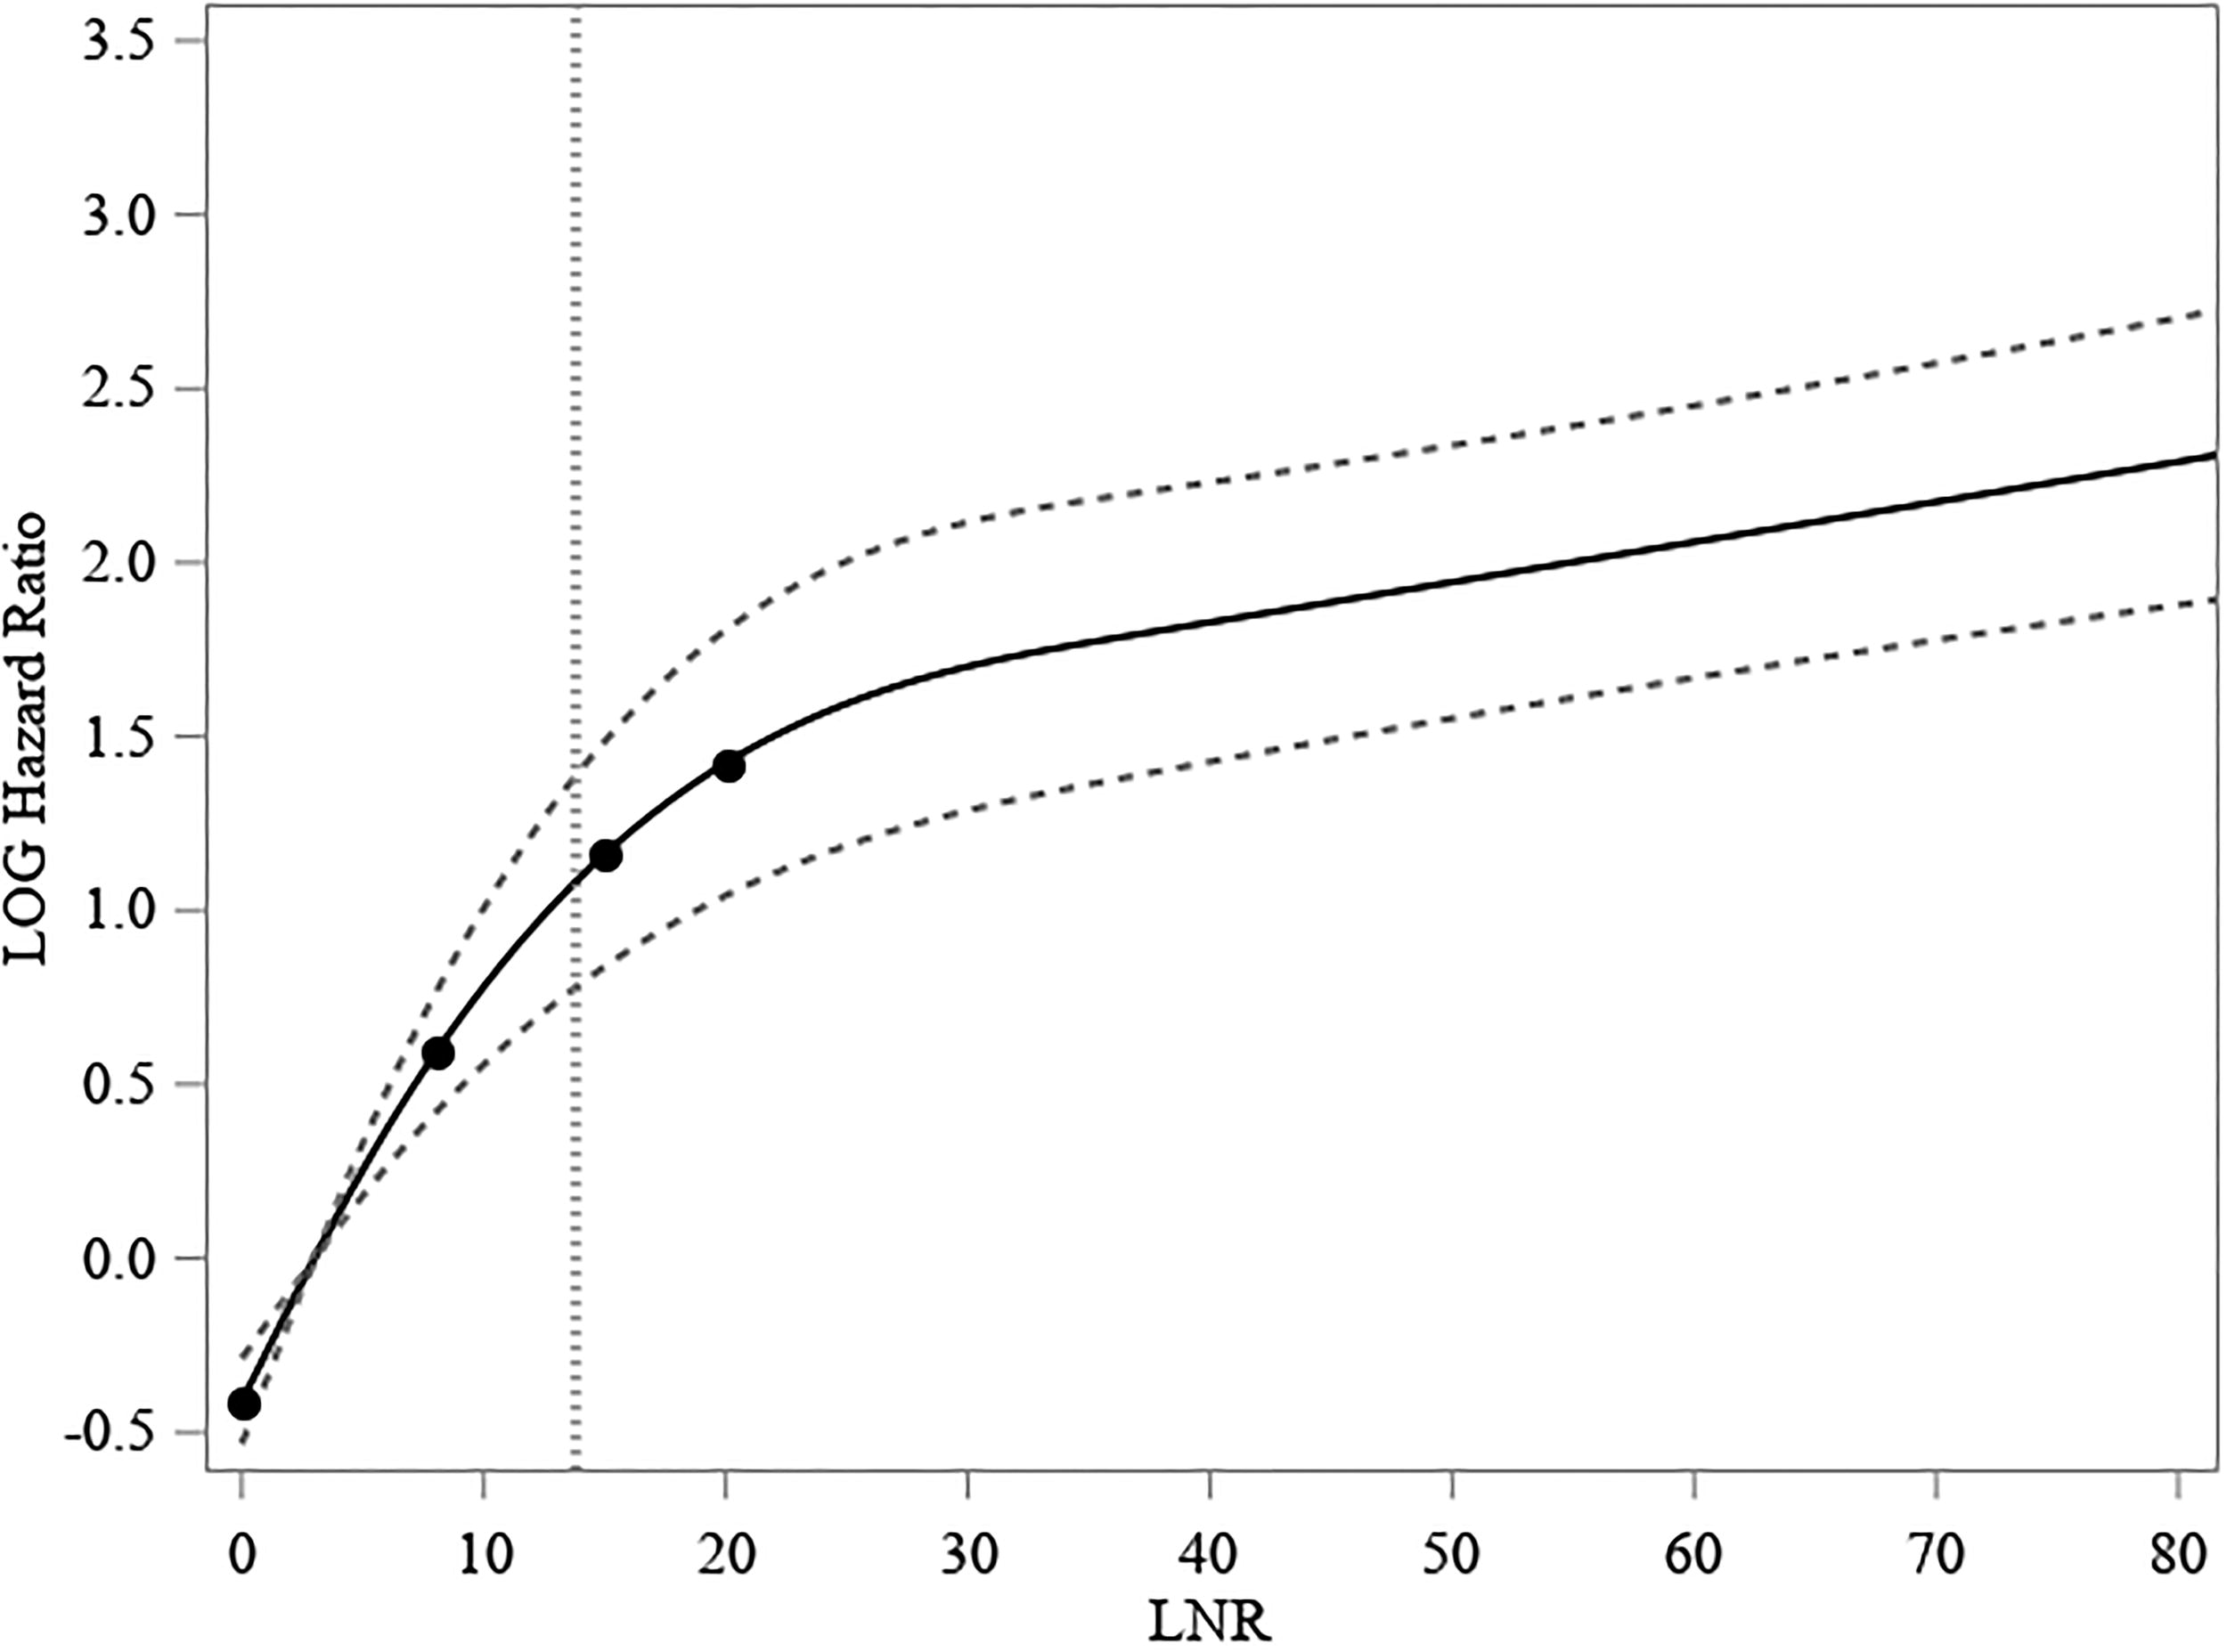
Restricted cubic spline model for lymph node ratio and MTC-specific mortality (N = 2098). The RCS model demonstrates the effect of a continuous predictor, the lymph node ratio, on an outcome, MTC-specific mortality. The identified threshold (13.8%) is represented as a vertical dashed line. RCS, restricted cubic spline.
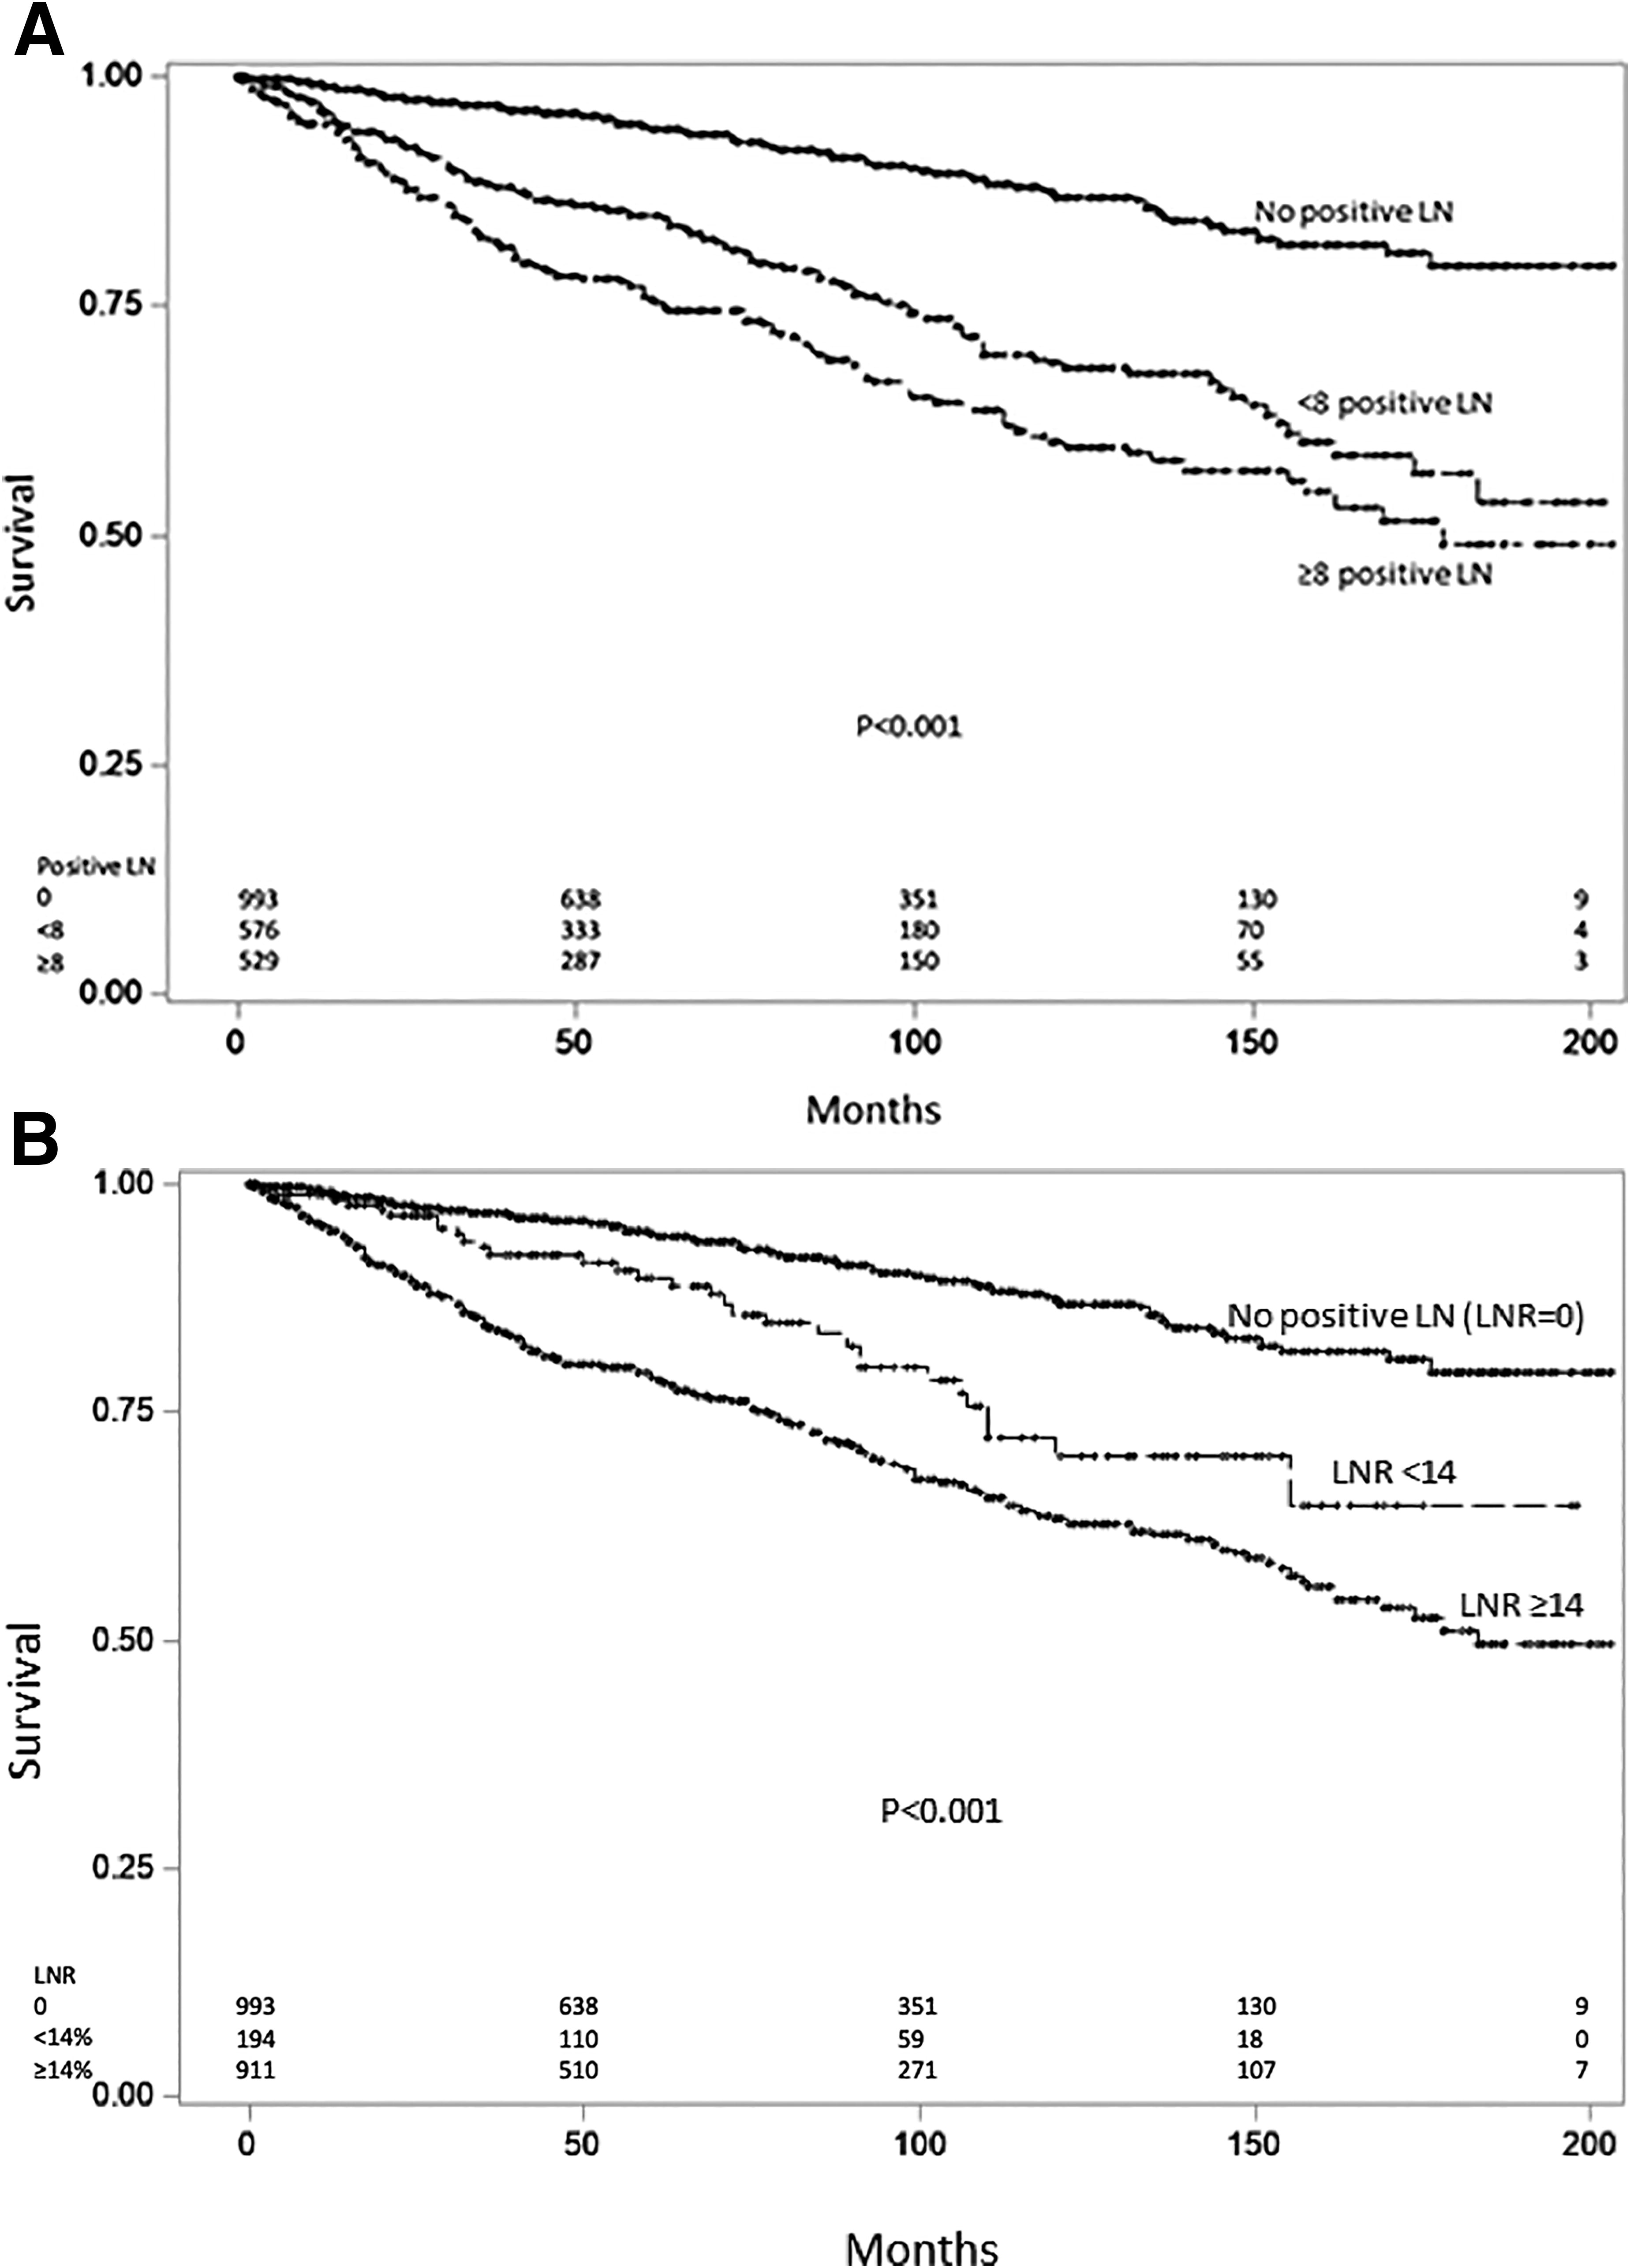
Kaplan–Meier survival curves for patients with lymph nodes examined in Surveillance, Epidemiology, and End Results Program, 2004–2020. Survival curves are stratified by:
Kaplan–Meier of combined lymph node thresholds for patients with lymph nodes examined in Surveillance, Epidemiology, and End Results Program, 2004–2020.
Adjusted analyses
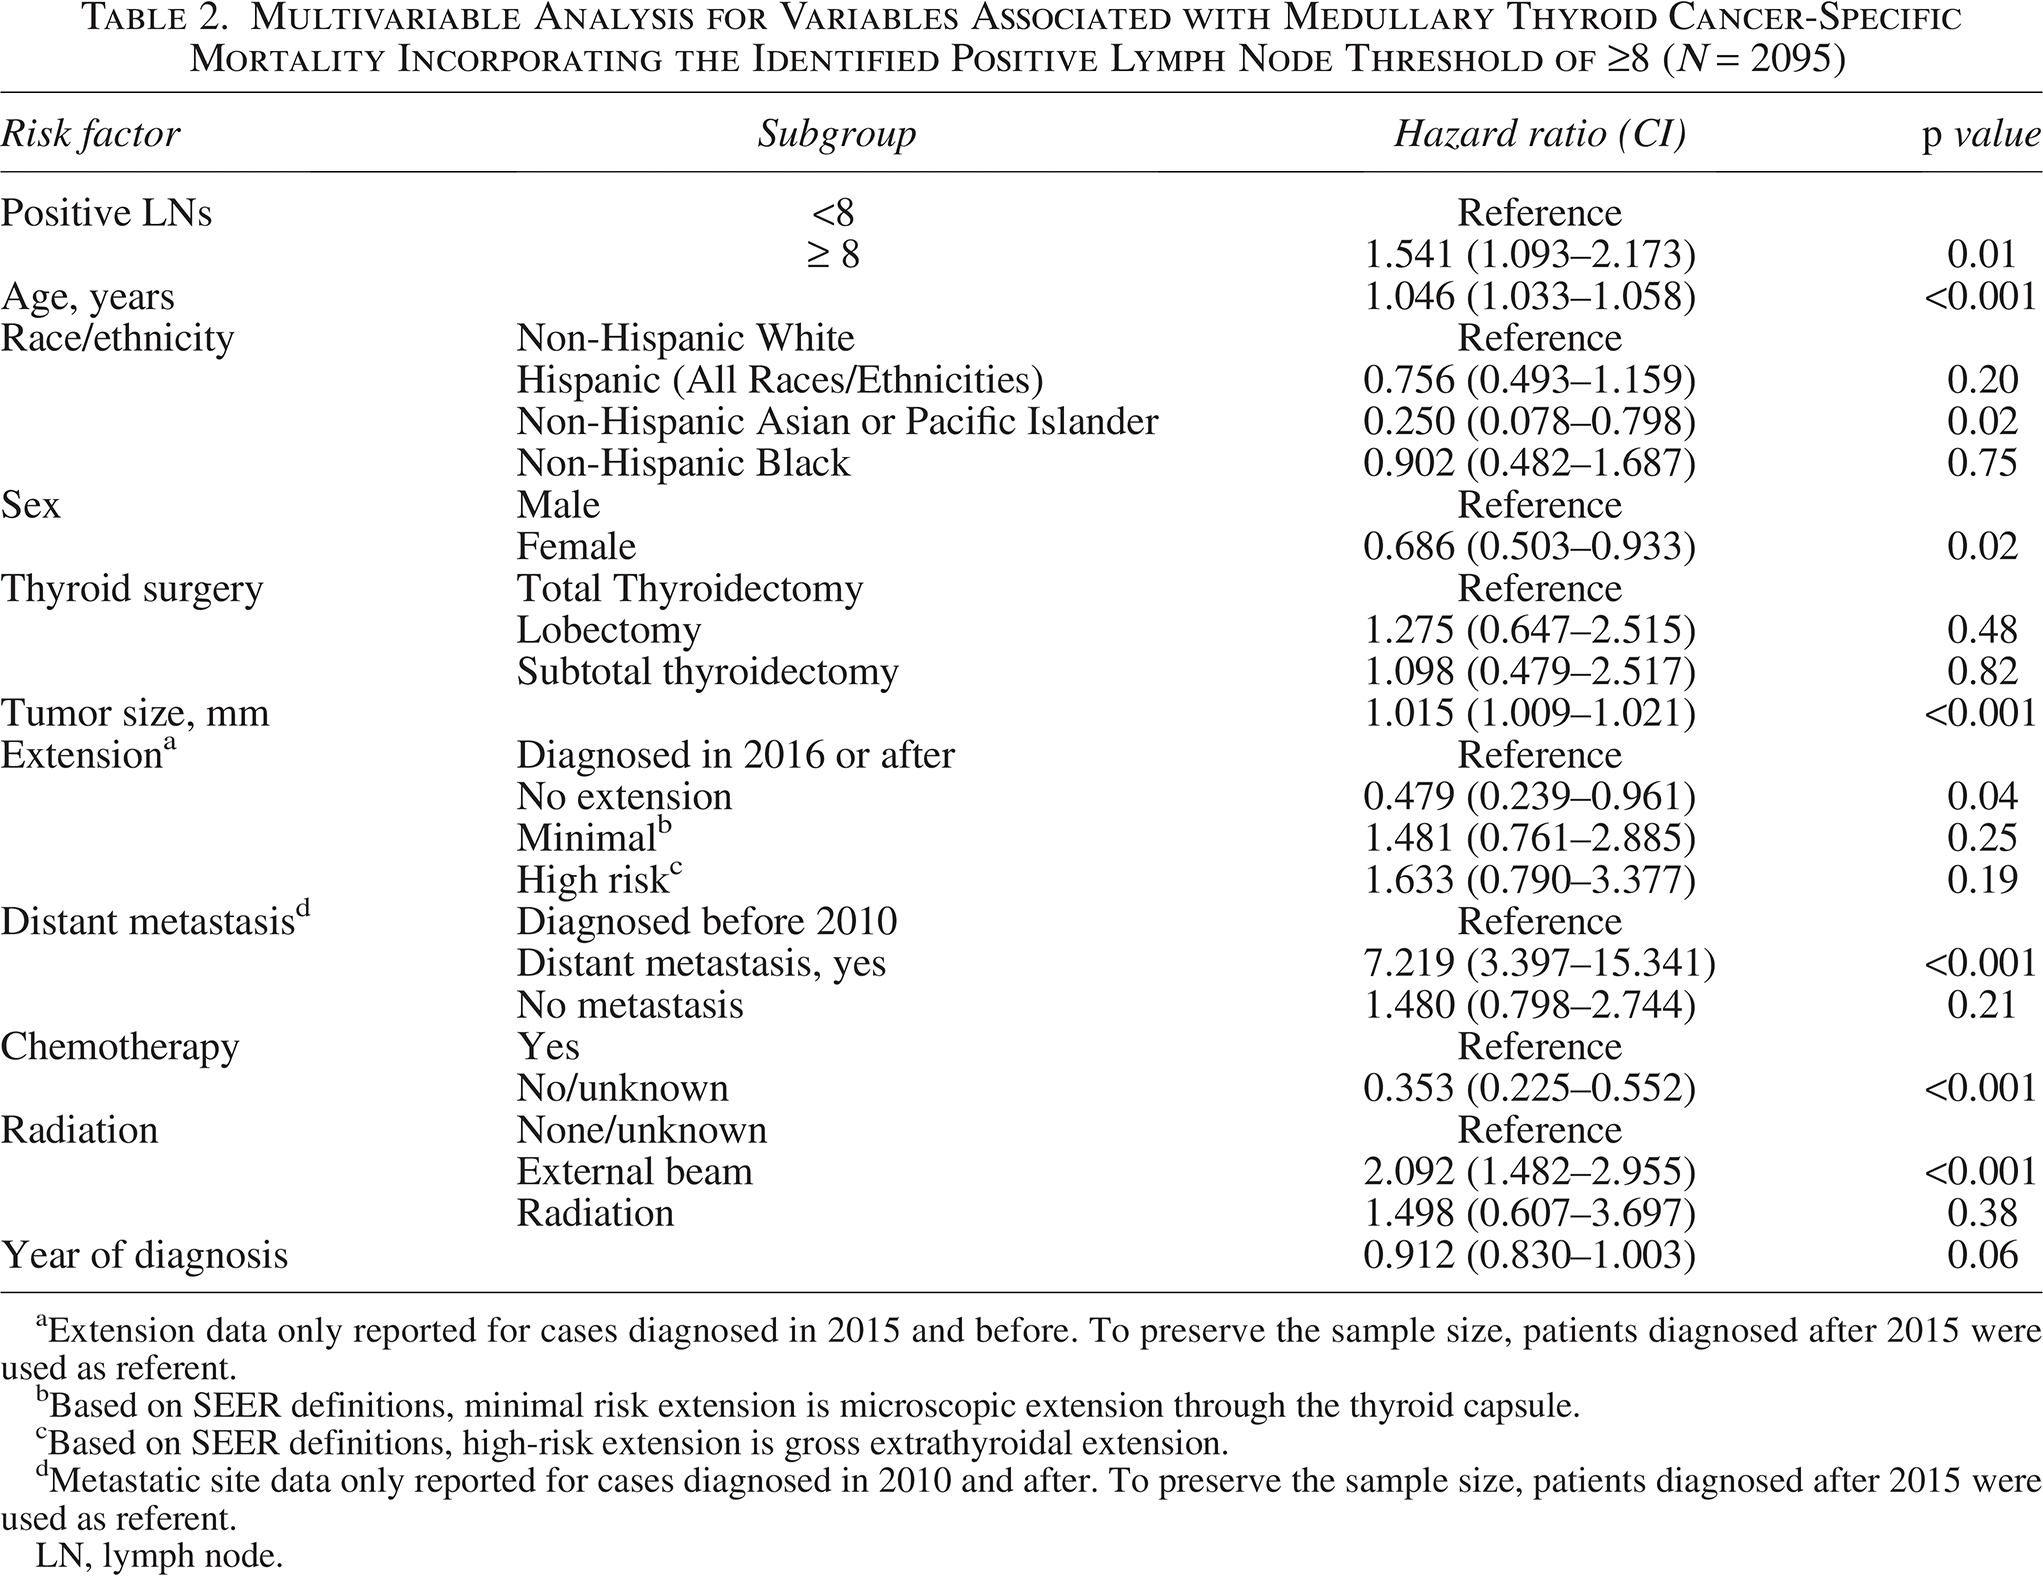
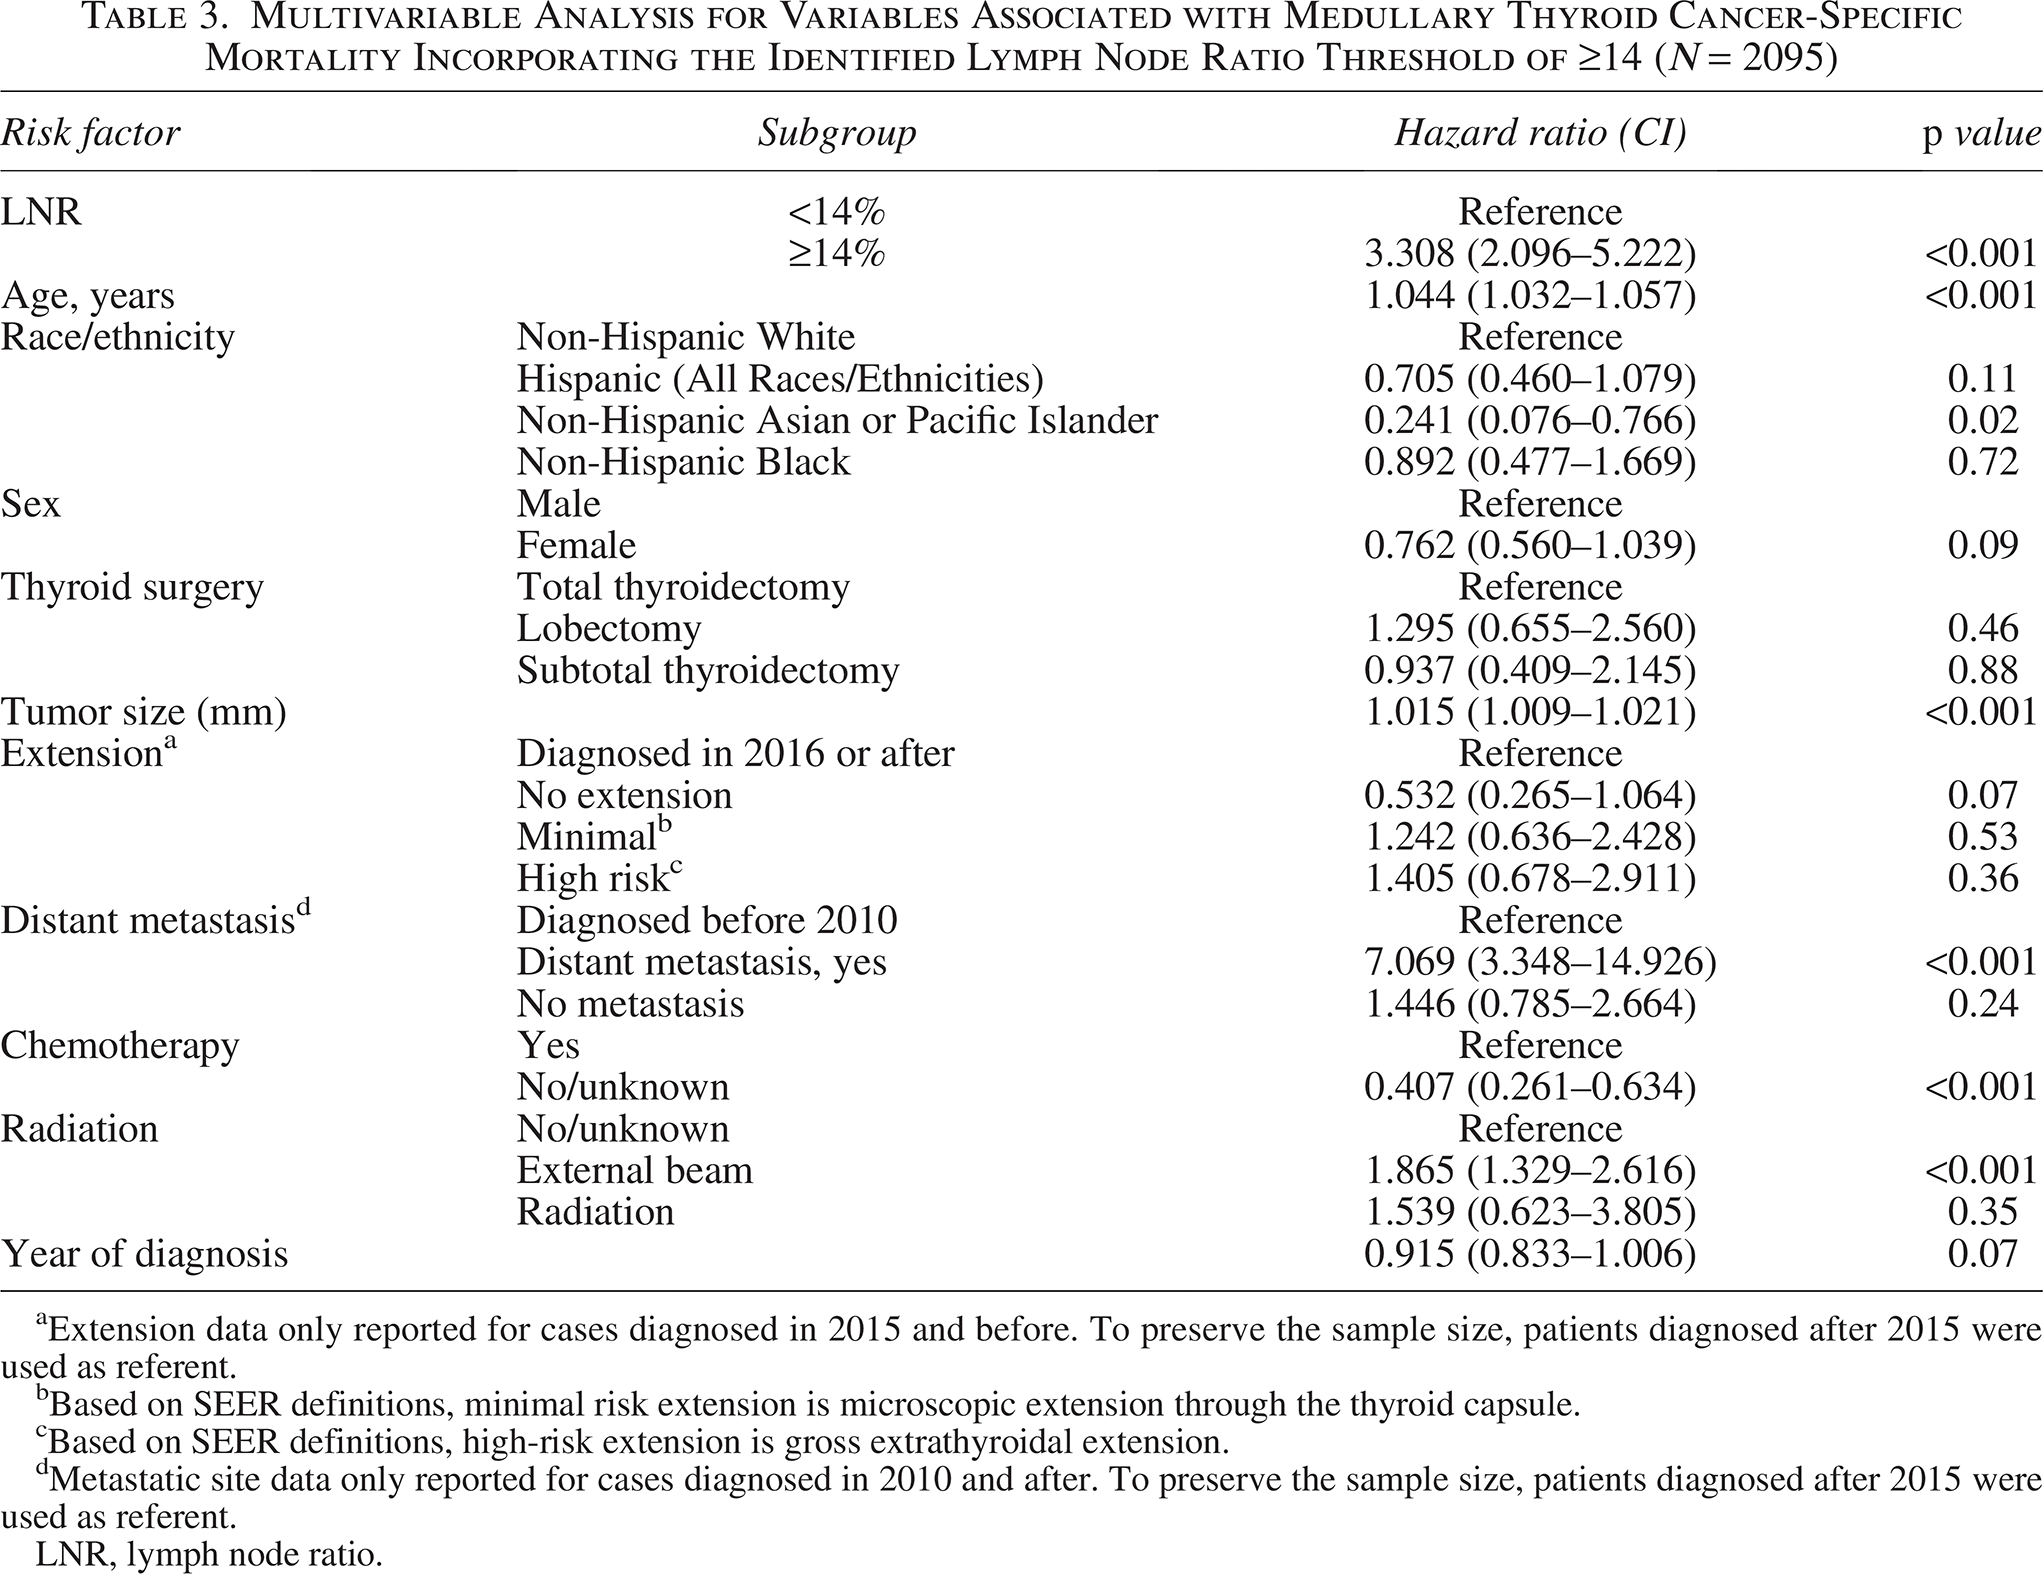
After adjusting for several pertinent risk factors in Cox regression, patients who had ≥8 LNs had a higher MTC-specific mortality hazard than patients that had <8 positive LNs (HR: 1.54, CI: 1.09–2.17, p = 0.01, mortality, model area under the curve [AUC] 86.7%) (Table 2). Furthermore, patients with a LNR ≥14% had a significantly increased mortality hazard compared with patients that had a LNR <14% (HR: 3.308, CI: 2.096–5.222, p < 0.001, model AUC: 87.9%) (Table 3) (see also Supplementary Tables S1 and S2). Of note, presence of distant metastasis was associated with a large increase in hazard of death in both models. This is an expected result; however, the large effect size may be due, in part, to the small number of patients with distant metastasis in our cohort. In sensitivity analyses excluding patients who received chemotherapy or radiation, the direction and significance of positive LN and LNR thresholds remained consistent (HR: 1.865 [1.338, 2.599] for positive LNs and HR: 1.644 [1.221, 2.214] for LNR) (Supplementary Tables S3 and S4).
Multivariable Analysis for Variables Associated with Medullary Thyroid Cancer-Specific Mortality Incorporating the Identified Positive Lymph Node Threshold of ≥8 (N = 2095)
Extension data only reported for cases diagnosed in 2015 and before. To preserve the sample size, patients diagnosed after 2015 were used as referent.
Based on SEER definitions, minimal risk extension is microscopic extension through the thyroid capsule.
Based on SEER definitions, high-risk extension is gross extrathyroidal extension.
Metastatic site data only reported for cases diagnosed in 2010 and after. To preserve the sample size, patients diagnosed after 2015 were used as referent.
LN, lymph node.
Multivariable Analysis for Variables Associated with Medullary Thyroid Cancer-Specific Mortality Incorporating the Identified Lymph Node Ratio Threshold of ≥14 (N = 2095)
Extension data only reported for cases diagnosed in 2015 and before. To preserve the sample size, patients diagnosed after 2015 were used as referent.
Based on SEER definitions, minimal risk extension is microscopic extension through the thyroid capsule.
Based on SEER definitions, high-risk extension is gross extrathyroidal extension.
Metastatic site data only reported for cases diagnosed in 2010 and after. To preserve the sample size, patients diagnosed after 2015 were used as referent.
LNR, lymph node ratio.
LN threshold appraisal
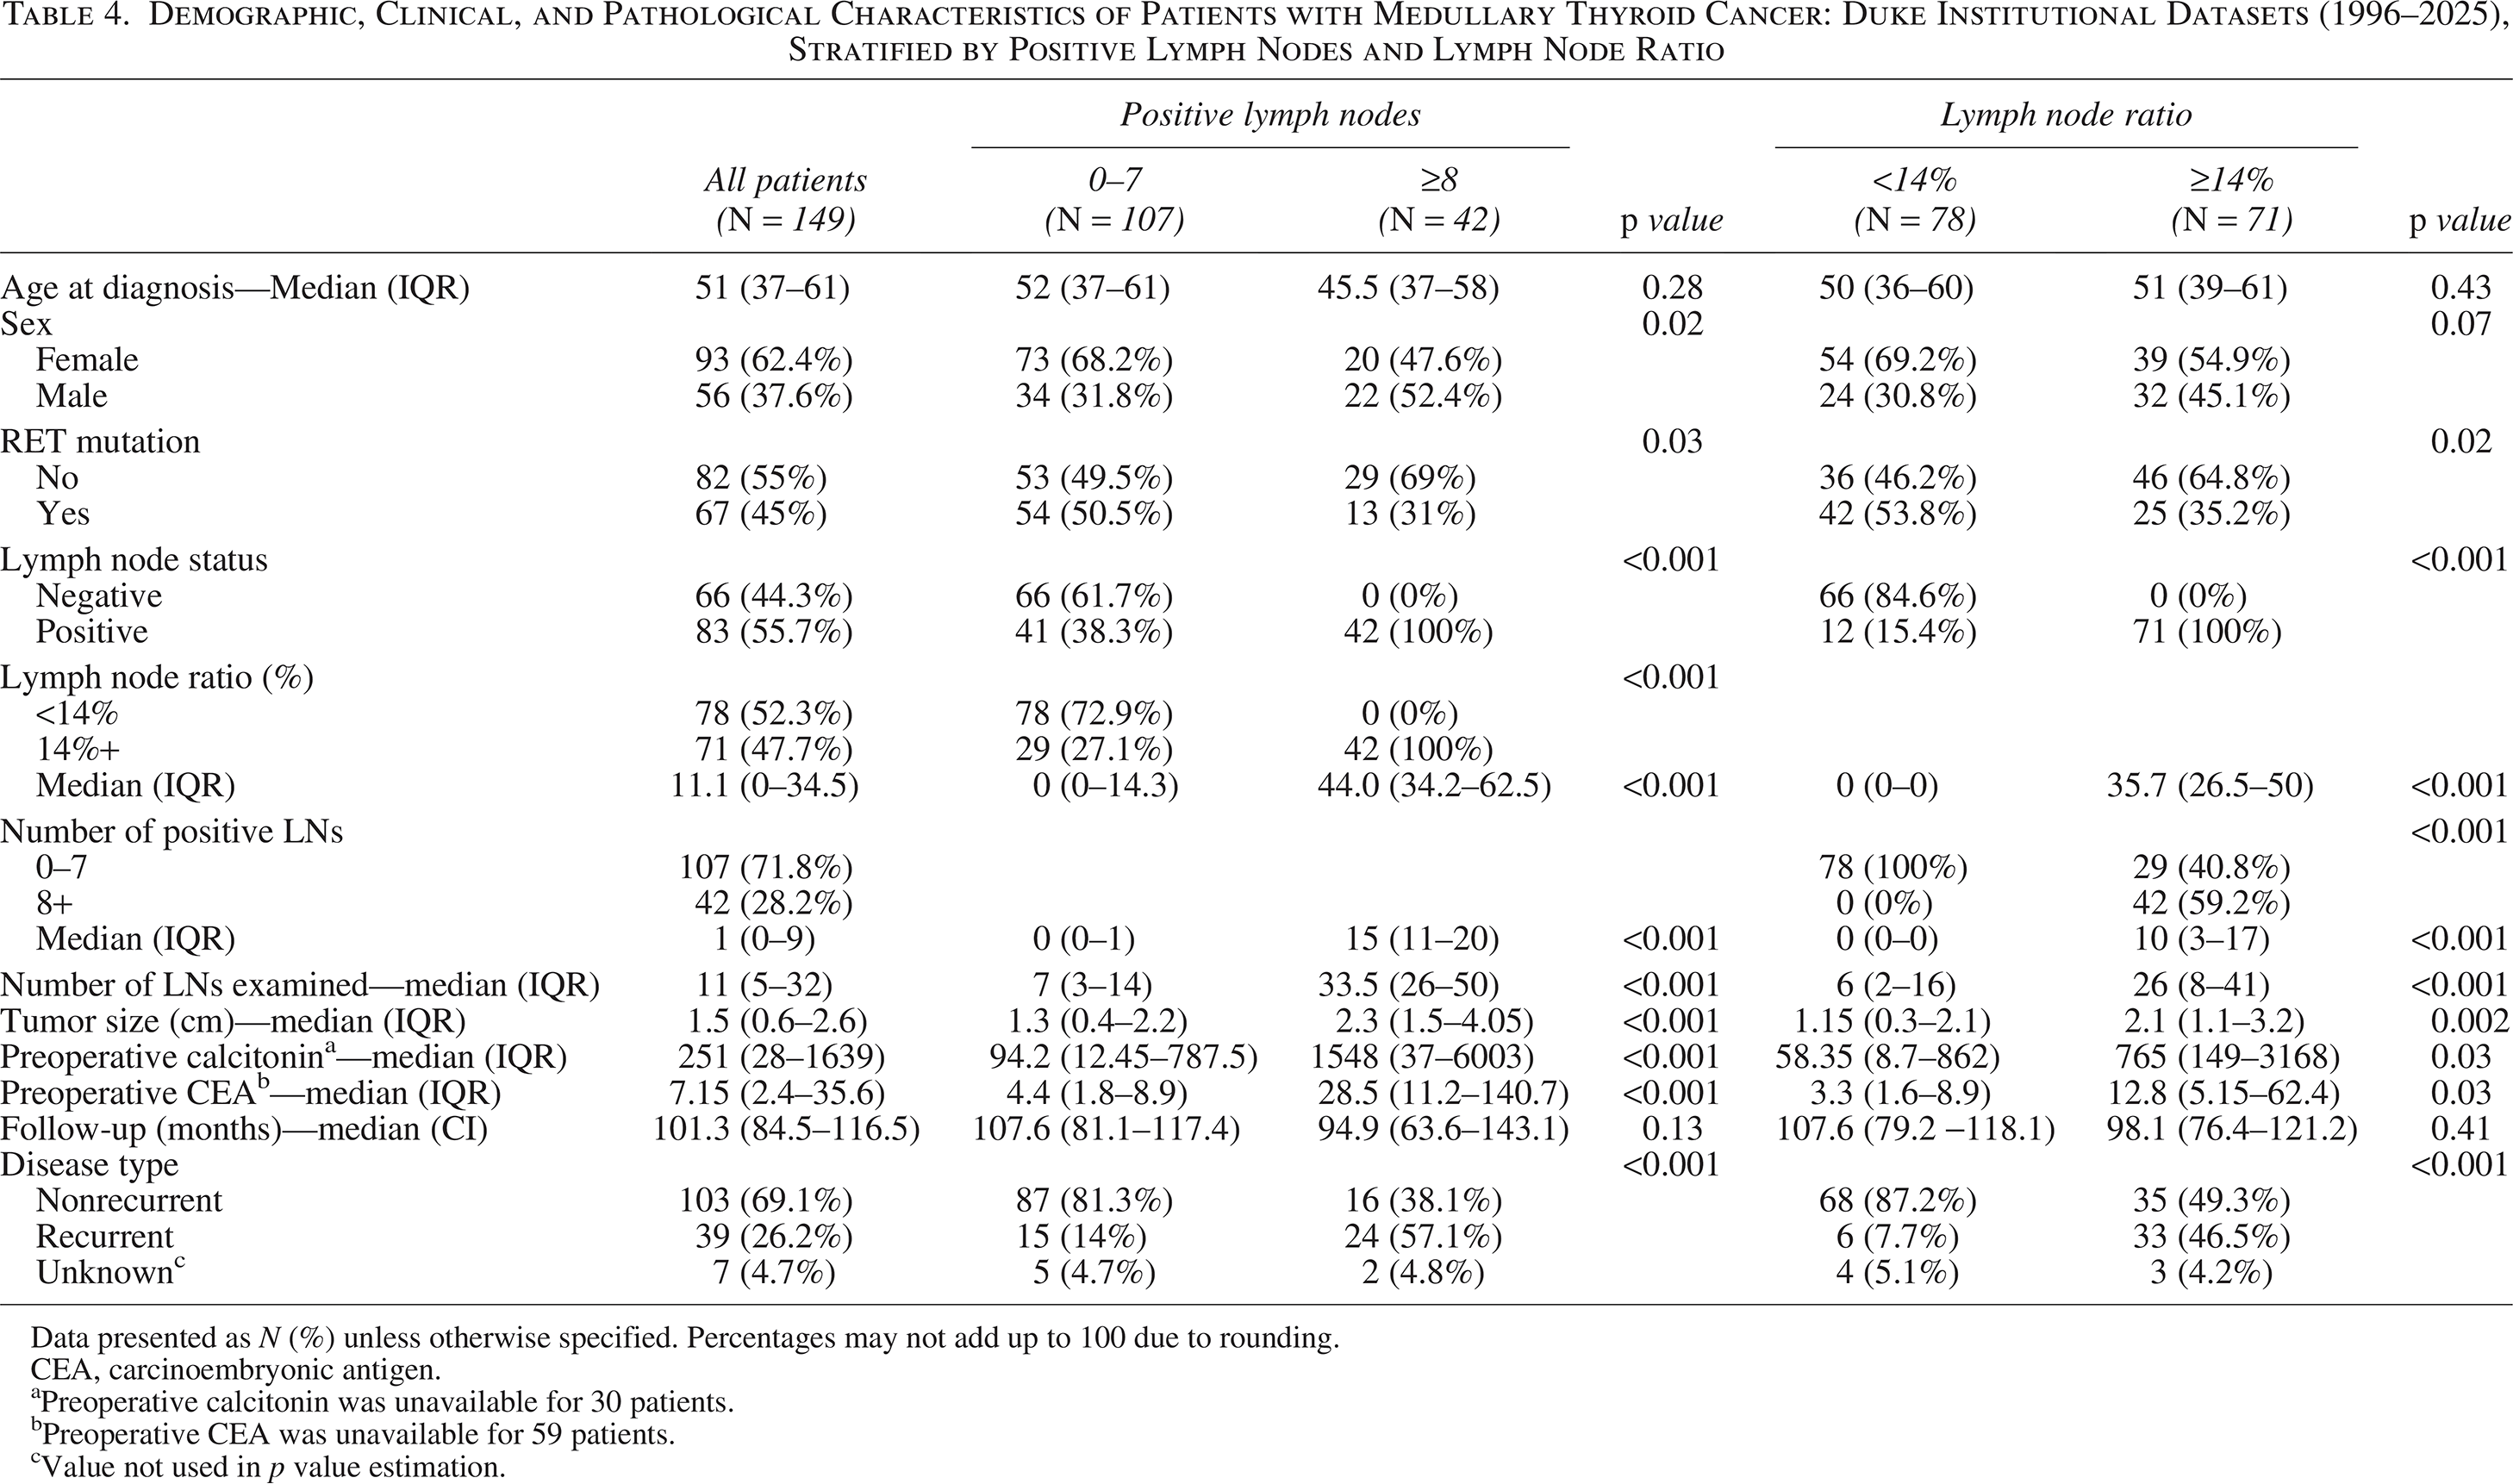
A total of 149 patients were identified with a diagnosis of MTC and available LN data from 1996 to 2025 in the institutional datasets. Median age at diagnosis was 51 years (IQR 37–61). Most patients (62.4%) were female (Table 4). The median tumor size was 1.5 cm (IQR 0.6–2.6). Most patients (55%) had sporadic MTC. Approximately 55.7% of patients had positive LN status. Median preoperative calcitonin was 251 pg/mL (IQR 28–1639). Median preoperative CEA was 7.15 pg/mL (IQR 2.4–35.6). Of the 149 patients examined, 42 had ≥8 positive LNs and 107 had <8 positive LNs (Table 4); 71 had LNR ≥14%, and 78 had LNR <14% (Table 4).
Demographic, Clinical, and Pathological Characteristics of Patients with Medullary Thyroid Cancer: Duke Institutional Datasets (1996–2025), Stratified by Positive Lymph Nodes and Lymph Node Ratio
Data presented as N (%) unless otherwise specified. Percentages may not add up to 100 due to rounding.
CEA, carcinoembryonic antigen.
Preoperative calcitonin was unavailable for 30 patients.
Preoperative CEA was unavailable for 59 patients.
Value not used in p value estimation.
Appraisal of LN threshold values identified in the SEER database using institutional data
In analyzing recurrence-free survival, patients who had ≥8 positive LNs had significantly worse recurrence-free survival than patients who had <8 positive LNs (Fig. 6). At 5 years, estimated recurrence-free survival was 56.5% (CI: 39.5 − 70.4) for patients with ≥8 positive LNs and 90.5% (CI: 82.5 − 94.9) for patients with <8 positive LNs (log-rank p < 0.001). Likewise, patients with LNR ≥14% had significantly worse recurrence-free survival than patients with LNR <14%. At 5 years, 67.9% (CI: 55 − 77.9) of patients with LNR ≥14% had a recurrence-free survival, while 92.8% (CI: 83.6 − 97) of patients with LNR <14% had a recurrence-free survival (log-rank p < 0.001).
Kaplan–Meier curves for recurrence-free survival for the validation dataset. Survival curves are stratified by
Adjusted analyses
After adjusting for preoperative calcitonin and presence of a RET mutation, patients who had ≥8 positive LNs had a significantly increased recurrence hazard compared with patients with <8 positive LNs (HR: 3.38, CI: 1.47–7.81, p = 0.004). Patients with LNR ≥14% additionally had a significantly increased recurrence hazard compared with patients with a LNR <14% (HR: 2.84, CI: 1.23–6.57, p = 0.01) (Supplementary Table S5).
Discussion
As noted in the 2016 American Thyroid Association guidelines, emerging literature has recognized the prognostic potential of the number of involved LNs in MTC staging. 11 However, the current AJCC staging for MTC does not include a quantitative assessment of LN involvement. This study is unique in its use of sophisticated methodology to identify LN metastasis and LNR threshold values associated with worse MTC survival. Using a large population-level database, we analyzed LN data for a representative sample of 2709 patients with MTC.34–38 In line with our hypothesis, we objectively identified prognostic thresholds for LN involvement. Specifically, we identified that a threshold of ≥8 positive LNs and a LNR ≥14% were significantly associated with worse MTC-specific survival. In particular, a LNR ≥14% was found to have a greater association with MTC-specific mortality (HR 3.308) than ≥8 positive LNs (HR: 1.54). We demonstrated the clinical significance of the identified LN thresholds with our single-institution cohort while correcting for clinically pertinent factors such as calcitonin not reported in national databases. Furthermore, this study is notable in its assessment of recurrence-free survival, a clinically important outcome that is often not captured in population-level databases. Based on our identified thresholds, patients with ≥8 positive LNs or LNR ≥14% were found to have significantly worse recurrence-free survival than patients below either threshold even after adjusting for calcitonin and RET mutation status.
Using arbitrary thresholds of LN metastases, a number of studies have sought to delineate the impact of LN metastases number on MTC patient prognosis. Machens and Dralle grouped patients as having 1–10, 11–20, and over 20 involved nodes or as “low-,” “medium-,” and “high-risk” in a cohort of 715 patients with MTC. 12 Higher risk categories were found to be predictive of distant lung, liver, and bone metastasis, and number of positive LNs was concluded to be an important prognostic classifier. Aside from limitations in sample size, theirs was a single institution limiting its generalizability. In a study of 2968 patients with MTC in the U.S. National Cancer Database (NCDB), Esfandiari et al. classified LN metastases as 0, 1–5, 6–10, 11–15, and >16 nodes. 13 This larger study showed that an increased number of positive LNs was associated with a significant decrease in OS. Given NCDB constraints, their study could not report on MTC-specific mortality. In contrast, the present study utilizes SEER to estimate MTC-specific mortality and establishes thresholds independent of subjective categorization.
The LNR, defined as the number of metastatic LNs divided by the total number of LNs removed, has additionally emerged as a potentially important prognostic marker for cancer staging. However, studies exploring LNR as a prognostic parameter for MTC are sparse.3,14–16 Leggett et al. explored the predictive power of LNR on MTC prognosis. They found LNR as a continuous variable to be a significant predictor of worse OS upon multivariable analysis. 3 Similar to this study, Leggett et al. used SEER data, but the analysis was limited to patients who underwent total or near-total thyroidectomy and lymphadenectomy (n = 534). The standard treatment for MTC is total thyroidectomy. However, this present study included patients submitted to lobectomy and subtotal thyroidectomy to reflect patients with a delayed diagnosis to final pathology. In addition, unlike the current analysis, Leggett et al. did not find or propose LN thresholds.
Other studies have proposed cutoffs for LNR ranging from 0.1 to 0.5.14–16 In a study of 132 patients with MTC treated at a single institution, Kim et al. identified a LNR of 0.20 (i.e., 20%) as an optimal cutoff for high-risk patients; the authors examined LNR in arbitrary 0.05 (5%) intervals. 14 Despite a small sample size, their study indicated that LNR cutoffs do exist, which is consistent with our findings. Instead of utilizing arbitrary intervals, the novel use of restricted cubic splines in this study permits objective data-driven derivation of an optimal LNR cutoff. We, in fact, found that a threshold LNR of ≥14% is associated with a larger hazard ratio for MTC-specific mortality than a threshold of ≥8 involved LNs.
Key limitations of this study include SEER database constraints and sample size limitations of the testing dataset. SEER does not provide information on surgical complications, recurrence, or revisional surgeries, limiting analysis of morbidity. SEER does not capture information on targeted therapies, including tyrosine kinase inhibitors and specific chemotherapy agents, which may introduce time-dependent confounding and limit the ability to fully account for treatment effects over time. In addition, although a small number of patients received adjuvant therapies and sensitivity analyses excluding patients who received adjuvant therapies agreed with the results of the primary analysis, immortal time bias may have affected the estimated threshold effect sizes. SEER only includes extension data for patients diagnosed through 2015 and distant metastasis data for patients diagnosed in 2010 and beyond. Because these factors are known to be associated with survival in this patient population, we opted to include them in adjusted modeling by allowing for a covariate level of “diagnosed 2016 or after” for extension, which and “diagnosed prior to 2010” for distant metastasis. While the HRs for these levels are not directly interpretable, including these variables and the full patient cohort in the adjusted survival models allowed for more generalizable estimation. Due to limitations in the SEER dataset, we could not ascertain whether lymphadenectomy was incidental or done in conjunction with the planned procedure. This analysis may be influenced by further differences in surgical technique, including LN yield. In consideration of these differences, we analyzed combined LN metastases and LNR thresholds. Further studies are required to analyze optimal LN yield and its relation to LNR thresholds. The derivation (SEER) arm of this study was also limited in its analysis of genetic information, including the presence of RET oncogene, and tumor marker data. Presence of specific RET mutations is important prognostically and can result in more aggressive disease or recurrence. Data for calcitonin, an important MTC marker, 39 is not included in SEER. Likewise, levels of carcinoembryonic antigen, another MTC marker associated with poorer prognosis,40–42 were not available, additionally limiting estimation of our thresholds’ significance. We would expect such mutations and elevated calcitonin and CEA to be associated with an increase in number of metastatic LNs. As such, it may prove difficult to parse out an independent effect, and number of LN metastases may be considered an appropriate proxy.
For the testing dataset, while the surgical intent was not captured, all patients had MTC; therefore, the lymphadenectomies are likely representative of therapeutic lymphadenectomies, as that is the standard of care. While our testing set was granular in its examination of calcitonin, CEA levels, and presence of RET mutation, it was limited in sample size and power for adjusted analysis. Therefore, in-depth multivariable analysis could not be done due to a sizeable number of missing values for calcitonin and CEA as well as relatively few outcome events. Moreover, although the testing dataset consisted of patients with MTC treated at our institution in an ∼30-year time period (1996–2025), the majority of patients were captured in the databases after 2012 (when electronic health records were being instituted), limiting analysis of survival. Furthermore, as detailed in prior work, data for calcitonin assays within the testing set are limited by variability in reference ranges for “normal” and “detectable” calcitonin levels throughout the study period. 33 Future studies incorporating calcitonin and CEA are needed to assess the independent effect of nodal metastases. Nonetheless, since calcitonin testing may not be readily available in resource-limited settings and may be associated with a prohibitive cost,40,43 a heavier emphasis on nodal data for MTC staging and prognostication may prove beneficial and efficient in the care of patients with MTC.
Conclusions
In summary, using robust statistical methodology, we objectively identified thresholds of 8 positive LNs and a LNR of 14% that were significantly associated with MTC-specific outcomes and appraised the identified thresholds using an institutional cohort. Future studies, including prospective studies, are necessary to assess the robustness and generalizability of these identified thresholds and their applicability to a refined staging system. Further work is needed to assess how LN-based metrics complement molecular and biomarker data to improve risk stratification, and whether minimum LN yield thresholds should be established to standardize surgical practice and enhance LNR interpretability. It remains uncertain whether LNR and LN count thresholds should serve as modifiers or tiers within the current N1 classification. Future studies are needed to assess this.
Authors’ Contributions
C.V.L.: Conceptualization (lead); writing—original draft (lead); formal analysis (equal); and writing—review and editing (lead). F.W.: Methodology (lead); formal analysis (lead); and writing—review and editing (equal). S.M.T.: Methodology (equal); formal analysis (equal); and writing—review and editing (equal). T.F.: Conceptualization (equal) and writing—review and editing (equal). N.F.: Conceptualization (equal) and writing—review and editing (equal). R.P.S.: Conceptualization (equal) and writing—review and editing (equal). H.S.K.: Conceptualization (lead); writing—original draft (lead); and writing—review and editing (equal).
Footnotes
Acknowledgment
A portion of the data from this study were presented as a poster at the American Thyroid Association conference on November 2, 2024.
Author Disclosure Statement
C.V.L. has no conflicts of interest or disclosures to report. F.W. has no conflicts of interest or disclosures to report. S.M.T. has no conflicts of interest or disclosures to report. T.F. has no conflicts of interest or disclosures to report. N.F. has no conflicts of interest or disclosures to report. R.P.S. has no conflicts of interest or disclosures to report. H.S.K. has no conflicts of interest or disclosures to report.
Funding Information
C.V.L. has no pertinent funding to declare. F.W. has no pertinent funding to declare. S.M.T. is supported by NIH grant P30CA014236, PI: Michael Kastan MD, PhD, as part of the Duke Cancer Institute. T.F. has no pertinent funding to declare. N.F. has no pertinent funding to declare. R.P.S. has no pertinent funding to declare. H.S.K. has no pertinent funding to declare. This research did not receive any specific funding from agencies in the public, commercial, or not-for-profit areas.
Supplemental Material
References
Supplementary Material
Please find the following supplemental material available below.
For Open Access articles published under a Creative Commons License, all supplemental material carries the same license as the article it is associated with.
For non-Open Access articles published, all supplemental material carries a non-exclusive license, and permission requests for re-use of supplemental material or any part of supplemental material shall be sent directly to the copyright owner as specified in the copyright notice associated with the article.