
Abstract
Background
Modeling is one of the engineering analyses that can predict most of the accidents and thus reduce damages caused by them.
Objective
In this paper, an effort is made to forecast the fire accident and physical consequences in the Kingdom of Saudi Arabia (KSA) in the period 2002–2021 by one of the statistical models known as Autoregressive Integrated Moving Average (ARIMA) models.
Methods
This retrospective investigation performed in the year 2023 within the Kingdom of Saudi Arabia. Information, including injuries and fatalities, as well as fire accidents occurring between 2002 and 2021, was obtained from a database. Those were related to the entire Kingdom of Saudi Arabia. To forecast the variables under examination, the ARIMA model, developed by Box and Jenkins, was employed. Statistical analyses were conducted using Minitab software.
Results
The results showed that the number of accidents, injuries, deaths, and population are increasing from 2002 to 2021. It is observed that forecasted values of injuries per 100,000 persons and accidents per 100,000 persons due to fire in KSA have increasing trends, and forecasted values of deaths per 100,000 persons, injuries per 1000 accidents, and deaths per 1000 accidents had decreasing trends. Also, the results indicated that the proposed model would be well-fitted to forecast the studied parameters.
Conclusions
Based on the findings, the ARIMA technique has robust performance and high accuracy for forecasting fire accidents and physical consequences.
Introduction
There are various harmful agents.1,2 According to the definition of the World Health Organization (WHO), an accident is unexpected and unplanned which leads to damage. Every year in the world, about 6 million people die as a result of injuries caused by accidents which make up one-tenth of all deaths.3,4
Tens of millions of people also refer to emergency medical centers as a result of unintentional accidents such as road accidents, drowning, falls, burns, and poisoning. In addition to this, millions of people also suffer from disability, and heavy costs are imposed on the individual, family, and society.3,5
Today, we know that the advanced industrial world owes to fire. 6 Fire gives heat and light, and in general, it can be said that without fire, life will be very difficult, and industries and factories will be shut down and society will return to the Stone Age. Therefore, we can see that fire has done a great service to the world and the human world, and in this sense, it has been respected by mankind since ancient times. There is a proverb that says “Fire is a good servant but a bad master” because fire may occur at any moment and burn everything around it.7,8
Fire hazards are always on an upward curve in line with the rapid advancements in technology, so the number and intensity of fires and explosions and the number of damages and the number of casualties, and injuries are increasing exponentially. Human knowledge, despite centuries of persistent efforts, is unable to find a decisive solution. There is no fire or explosion for complete neutralization. However, the study of accurate fire statistics by developed countries has proven that more than 75 to 80 percent of fires can be predicted and prevented. The prediction and prevention of fire hazards is the creation of extensive and deep scientific and technical information, the necessity of which has been fully felt since a century ago. 9
Fire can attack any type of building, establishment, or area. So that there is no house, school, office, factory, laboratory, hospital, warehouse, forest, farm, ship, airplane, train, or car that is immune from the danger of fire. If there is no fire in a certain place for several years, it is not a sign that it is immune from fire, just as if a person does not get sick for several years it is not the reason that he/she is immune from disease. Therefore, fire has a general aspect, it can happen anywhere and to anyone, and it often involves heavy financial losses and casualties and injuries.7,10 Based on the world statistics of fire incidents in the years from 1993 to 2016, 2.5 to 4.5 million fires occurred and approximately 62,000 fire deaths were recorded from 57 countries. 11 Historical accidents, including the Piper Alpha disaster, the fire at the Buncefield oil depot, the BP Texas City disaster, the BP Deepwater Horizon explosion, and the Cleveland explosion, underscore the critical need to analyze fire and explosion accidents in various environments at the world. 12
Modeling is one of the engineering analyses that can predict most of the accidents and thus reduce the damages caused by them. One of the forecasting methods is the one-variable method of the Box-Jenkins model. This method basically involves fitting an Autoregressive Integrated Moving Average (ARIMA) model to the data. In this method, after determining the order of differentiation and the order of each of the autoregression (AR) and moving average (MA) processes, the parameters of the model are specified. The appropriateness of the model is checked by analyzing the residuals of the fitted model. If the model is correctly identified, the residuals should have the properties of independent normal random variables with zero mean and constant variance.13,14
In order to predict, first the time series of the data should be drawn. A series has a trend and is unstable. Stationarity can be checked by drawing an autocorrelation function (ACF). A correlation plot in which r values do not approach zero at a reasonable rate indicates instability. If r values decline quickly, the series will be stationary. If the values of the autocorrelation function slowly tend to zero, it is a confirmation of the instability of the corresponding series. In fact, we need to calculate the sample autocorrelation function for a stationary time series.15,16
Given that determination of trends related to fire accidents and their physical consequences in various countries are required for planning preventive measures by policy-makers and also, given that no study has been performed in the Kingdom of Saudi Arabia (KSA) on this issue, an effort is made to forecast the fire accident and physical consequences in KSA in period 2002–2021 by one of the statistical models known as ARIMA models.
Methods
This retrospective study was conducted in 2023 in the KSA. The Saudi open data portal, which is a National e-government Portal, was used to obtain data. Providing data from the national portal as well as from the internet site of the Ministry of Economy was the perspective followed by the Kingdom of Saudi Arabia. 17 The national open data portal permits researchers to access, download, and use the data of ministries and government agencies in the Kingdom of Saudi Arabia. 17 The data on physical consequences (injuries and deaths) and fire accidents from 2002 to 2021 were extracted from the database and were related to the entire KSA.
The ARIMA model, developed by Box and Jenkins, has been widely utilized for forecasting various parameters. This model involves a three-stage iterative procedure, which includes model selection, parameter estimation, and model checking. However, recent explanations of the process have recommended an additional preliminary stage of data preparation and a final stage of model application or forecasting.
The methodology proposed by Box and Jenkins consists of several steps. Firstly, data preparation is conducted to stabilize the variance and transform the data into a stationary series through differencing. Various tests can be employed to ensure the stationarity of the data, such as the Augmented Dickey-Fuller (ADF) test.
Next, in the model suggestion stage, potential models are identified based on the patterns observed in the data. The ACF and partial autocorrelation function (PACF) are examined to determine suitable models. It is crucial to build the model around the suggested order, considering multiple models with different orders if necessary.
Following that, in the model selection stage, appropriate criteria are applied to select the best-fitting model. Criteria of goodness-of-fit such as AIC (Akaike Information Criterion), AICc (corrected Akaike Information Criterion), and BIC (Bayesian Information Criterion) are utilized for this purpose. Models with significant values and lower AICc, AIC, and BIC values are considered proper. Additionally, adequacy checks for fitted models are performed using Modified Box-Pierce (Ljung-Box) Chi-square statistics and four plots: histogram of residuals, normal plot of residuals, residuals versus fits plot, and residuals versus order plot. The normality of residuals is examined using the Kolmogorov-Smirnov test.
Once a model with white noise residuals is obtained from these stages, it can be used for forecasting. The accuracy of the model is compared to that of competing models, and the chosen final model should demonstrate higher accuracy. To validate the fitted model, actual observations are plotted alongside predicted values for a specific time. Additionally, the accuracy of the model can be assessed using metrics such as Root Mean Square Error (RMSE) and mean absolute percentage error (MAPE). Ofori et al. have suggested interpretations for MAPE values: less than 10% indicates highly accurate forecasting, 10% to 20% suggests good forecasting, 21% to 50% implies reasonable forecasting, and 51% and above indicates inaccurate forecasting. 18 The statistical tests were carried out using Minitab software.
Results
Table 1 represents the descriptive statistics of the studied variables from 2002 to 2021. The results showed that the number of accidents, injuries, deaths, and population are increasing from 2002 to 2021.
The descriptive statistics of the studied variables from 2002 to 2021.
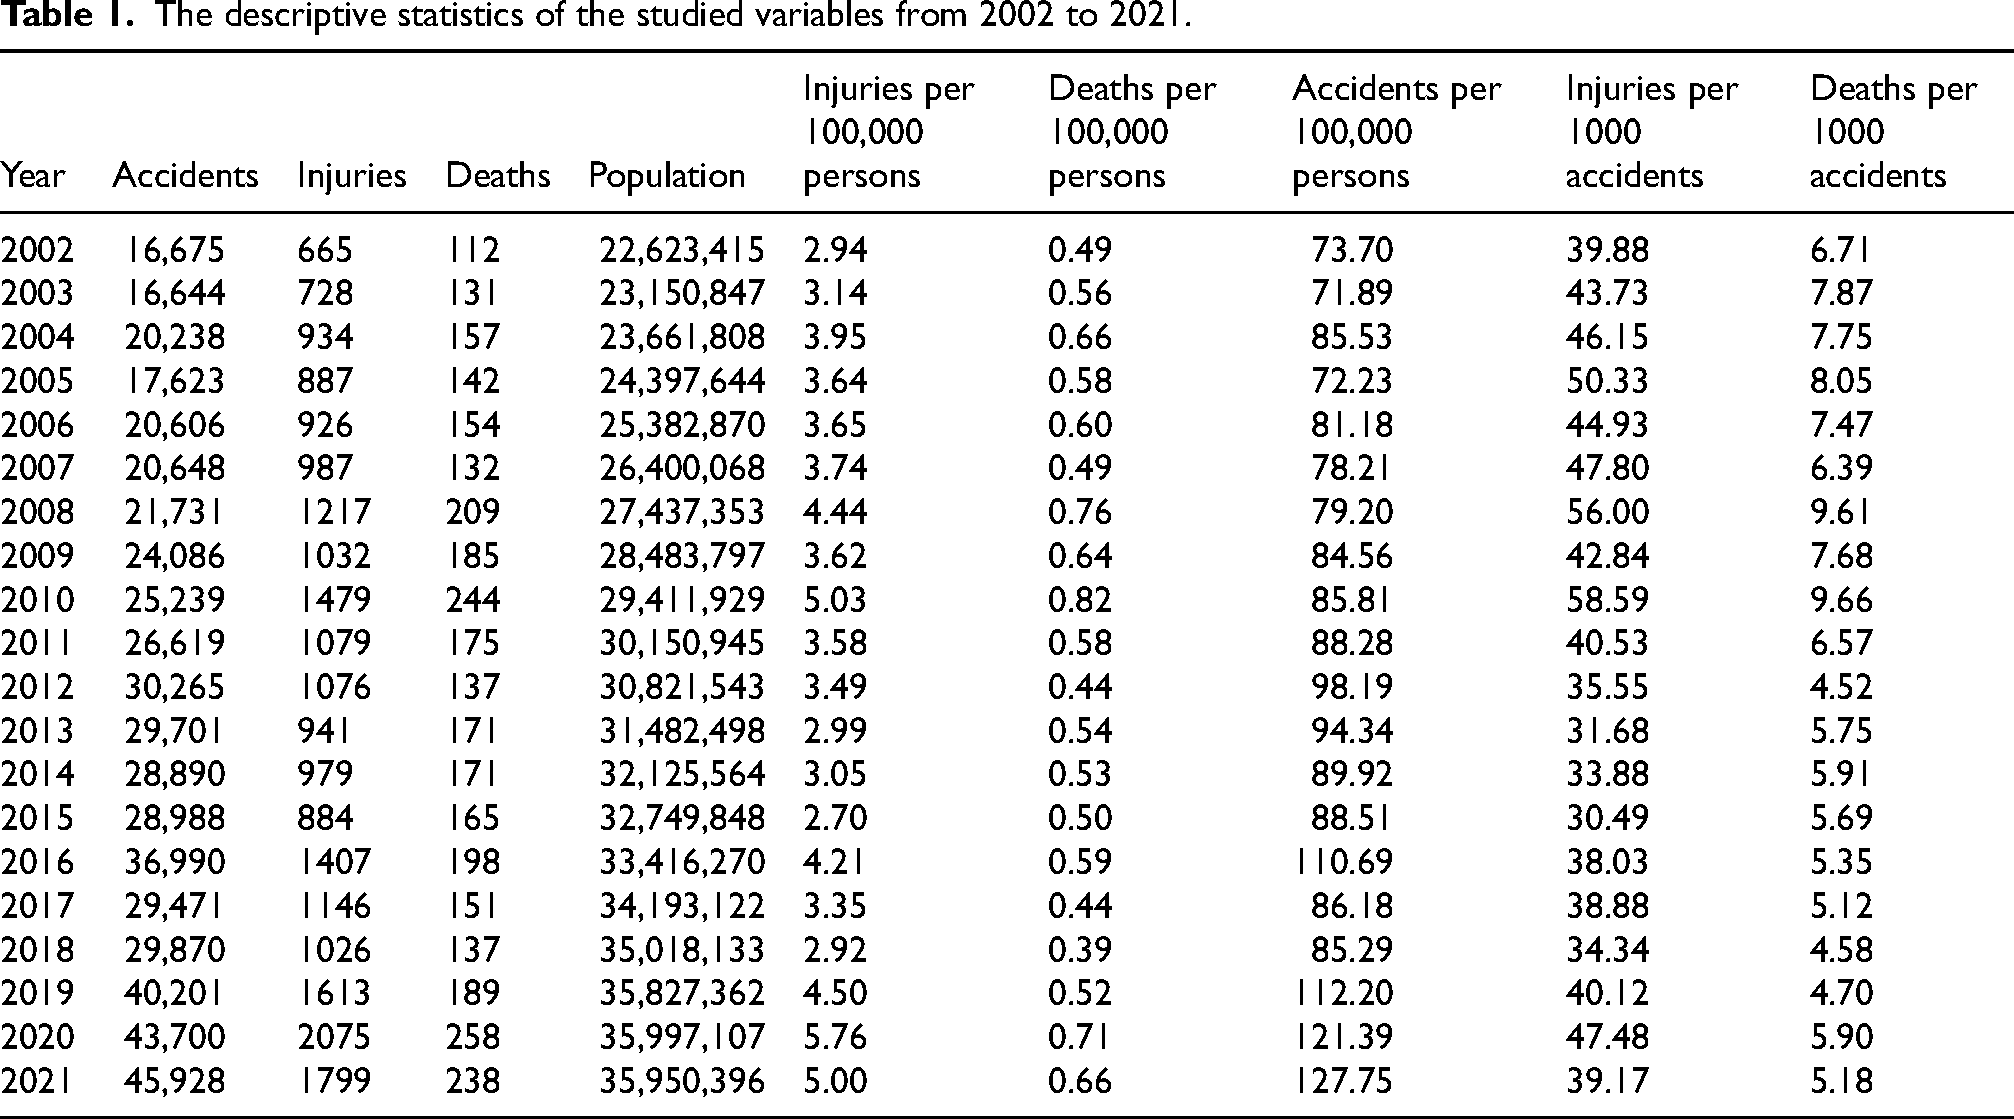
Figure 1 shows the time series plots of the studied variables from 2002 to 2016. The variables consisted of injuries per 100,000 persons, deaths per 100,000 persons, accidents per 100,000 persons, injuries per 1000 accidents, and deaths per 1000 accidents.
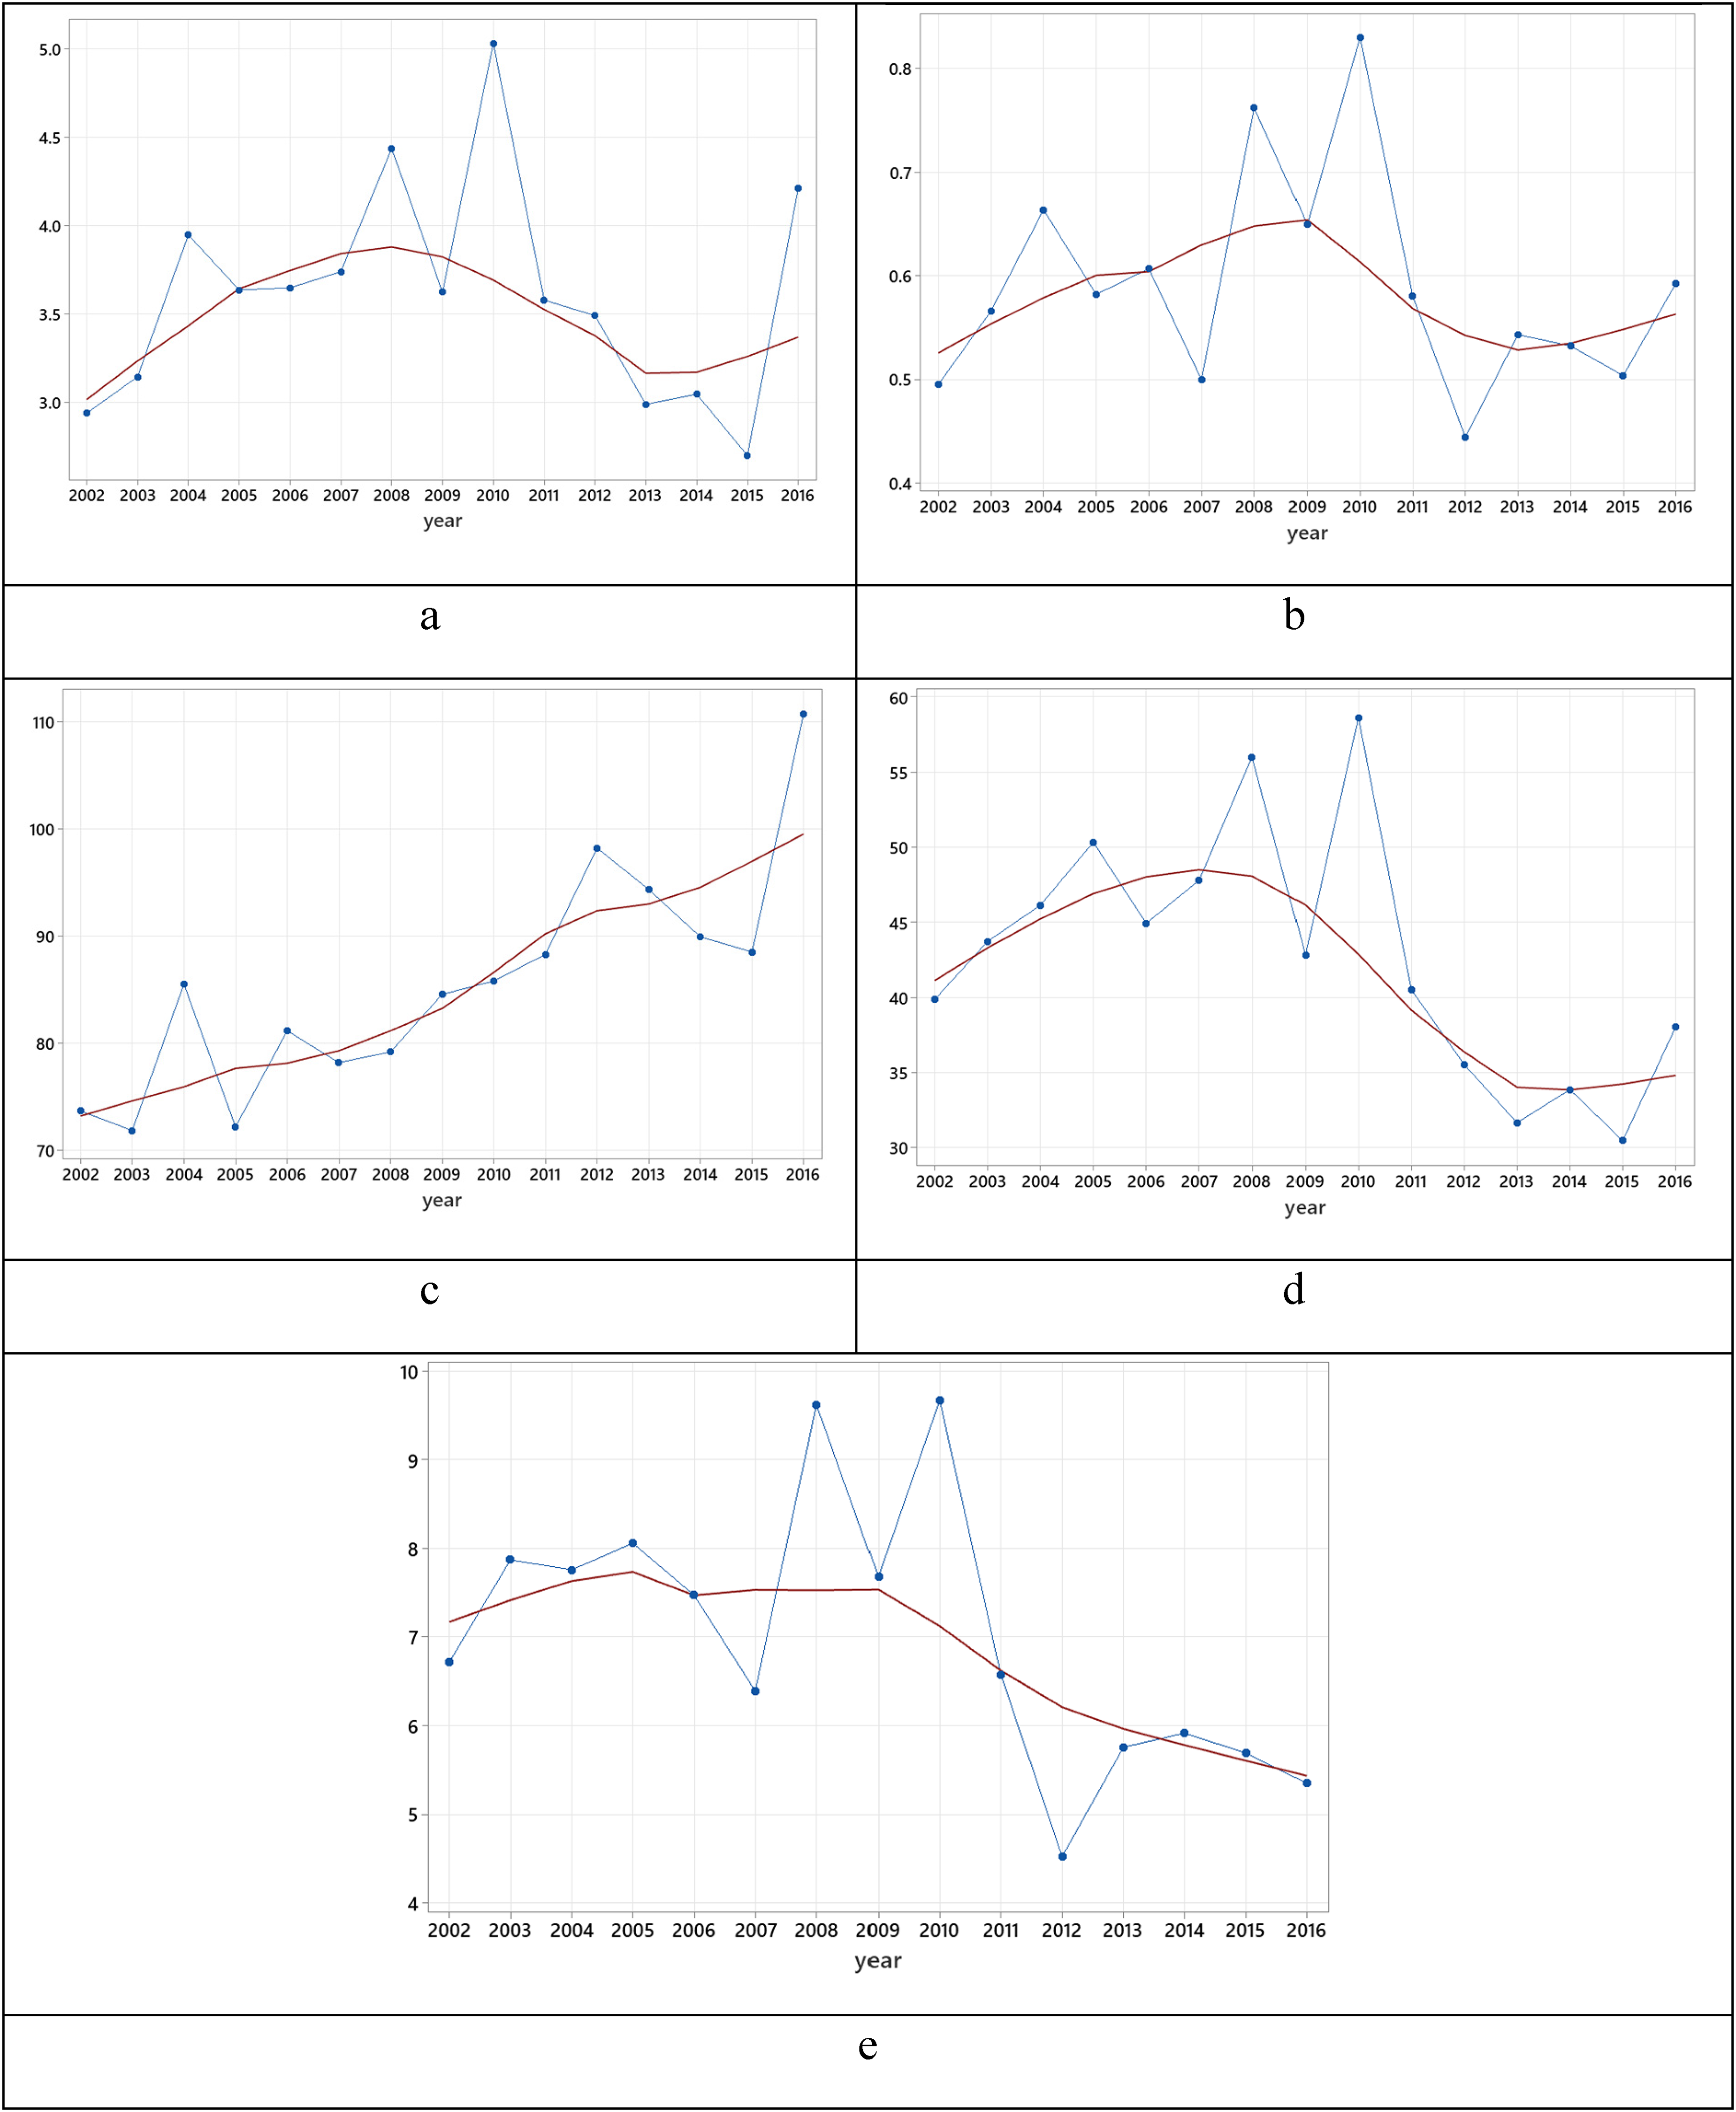
Time series plots of the studied variables from 2002 to 2016: (a) injuries per 100,000 persons, (b) deaths per 100,000 persons, (c) accidents per 100,000 persons, (d) injuries per 1000 accidents, and (e) deaths per 1000 accidents.
Figure 2 indicates Box-Cox plots of the studied variables. The results showed that the values of λ for the variables were acceptable.
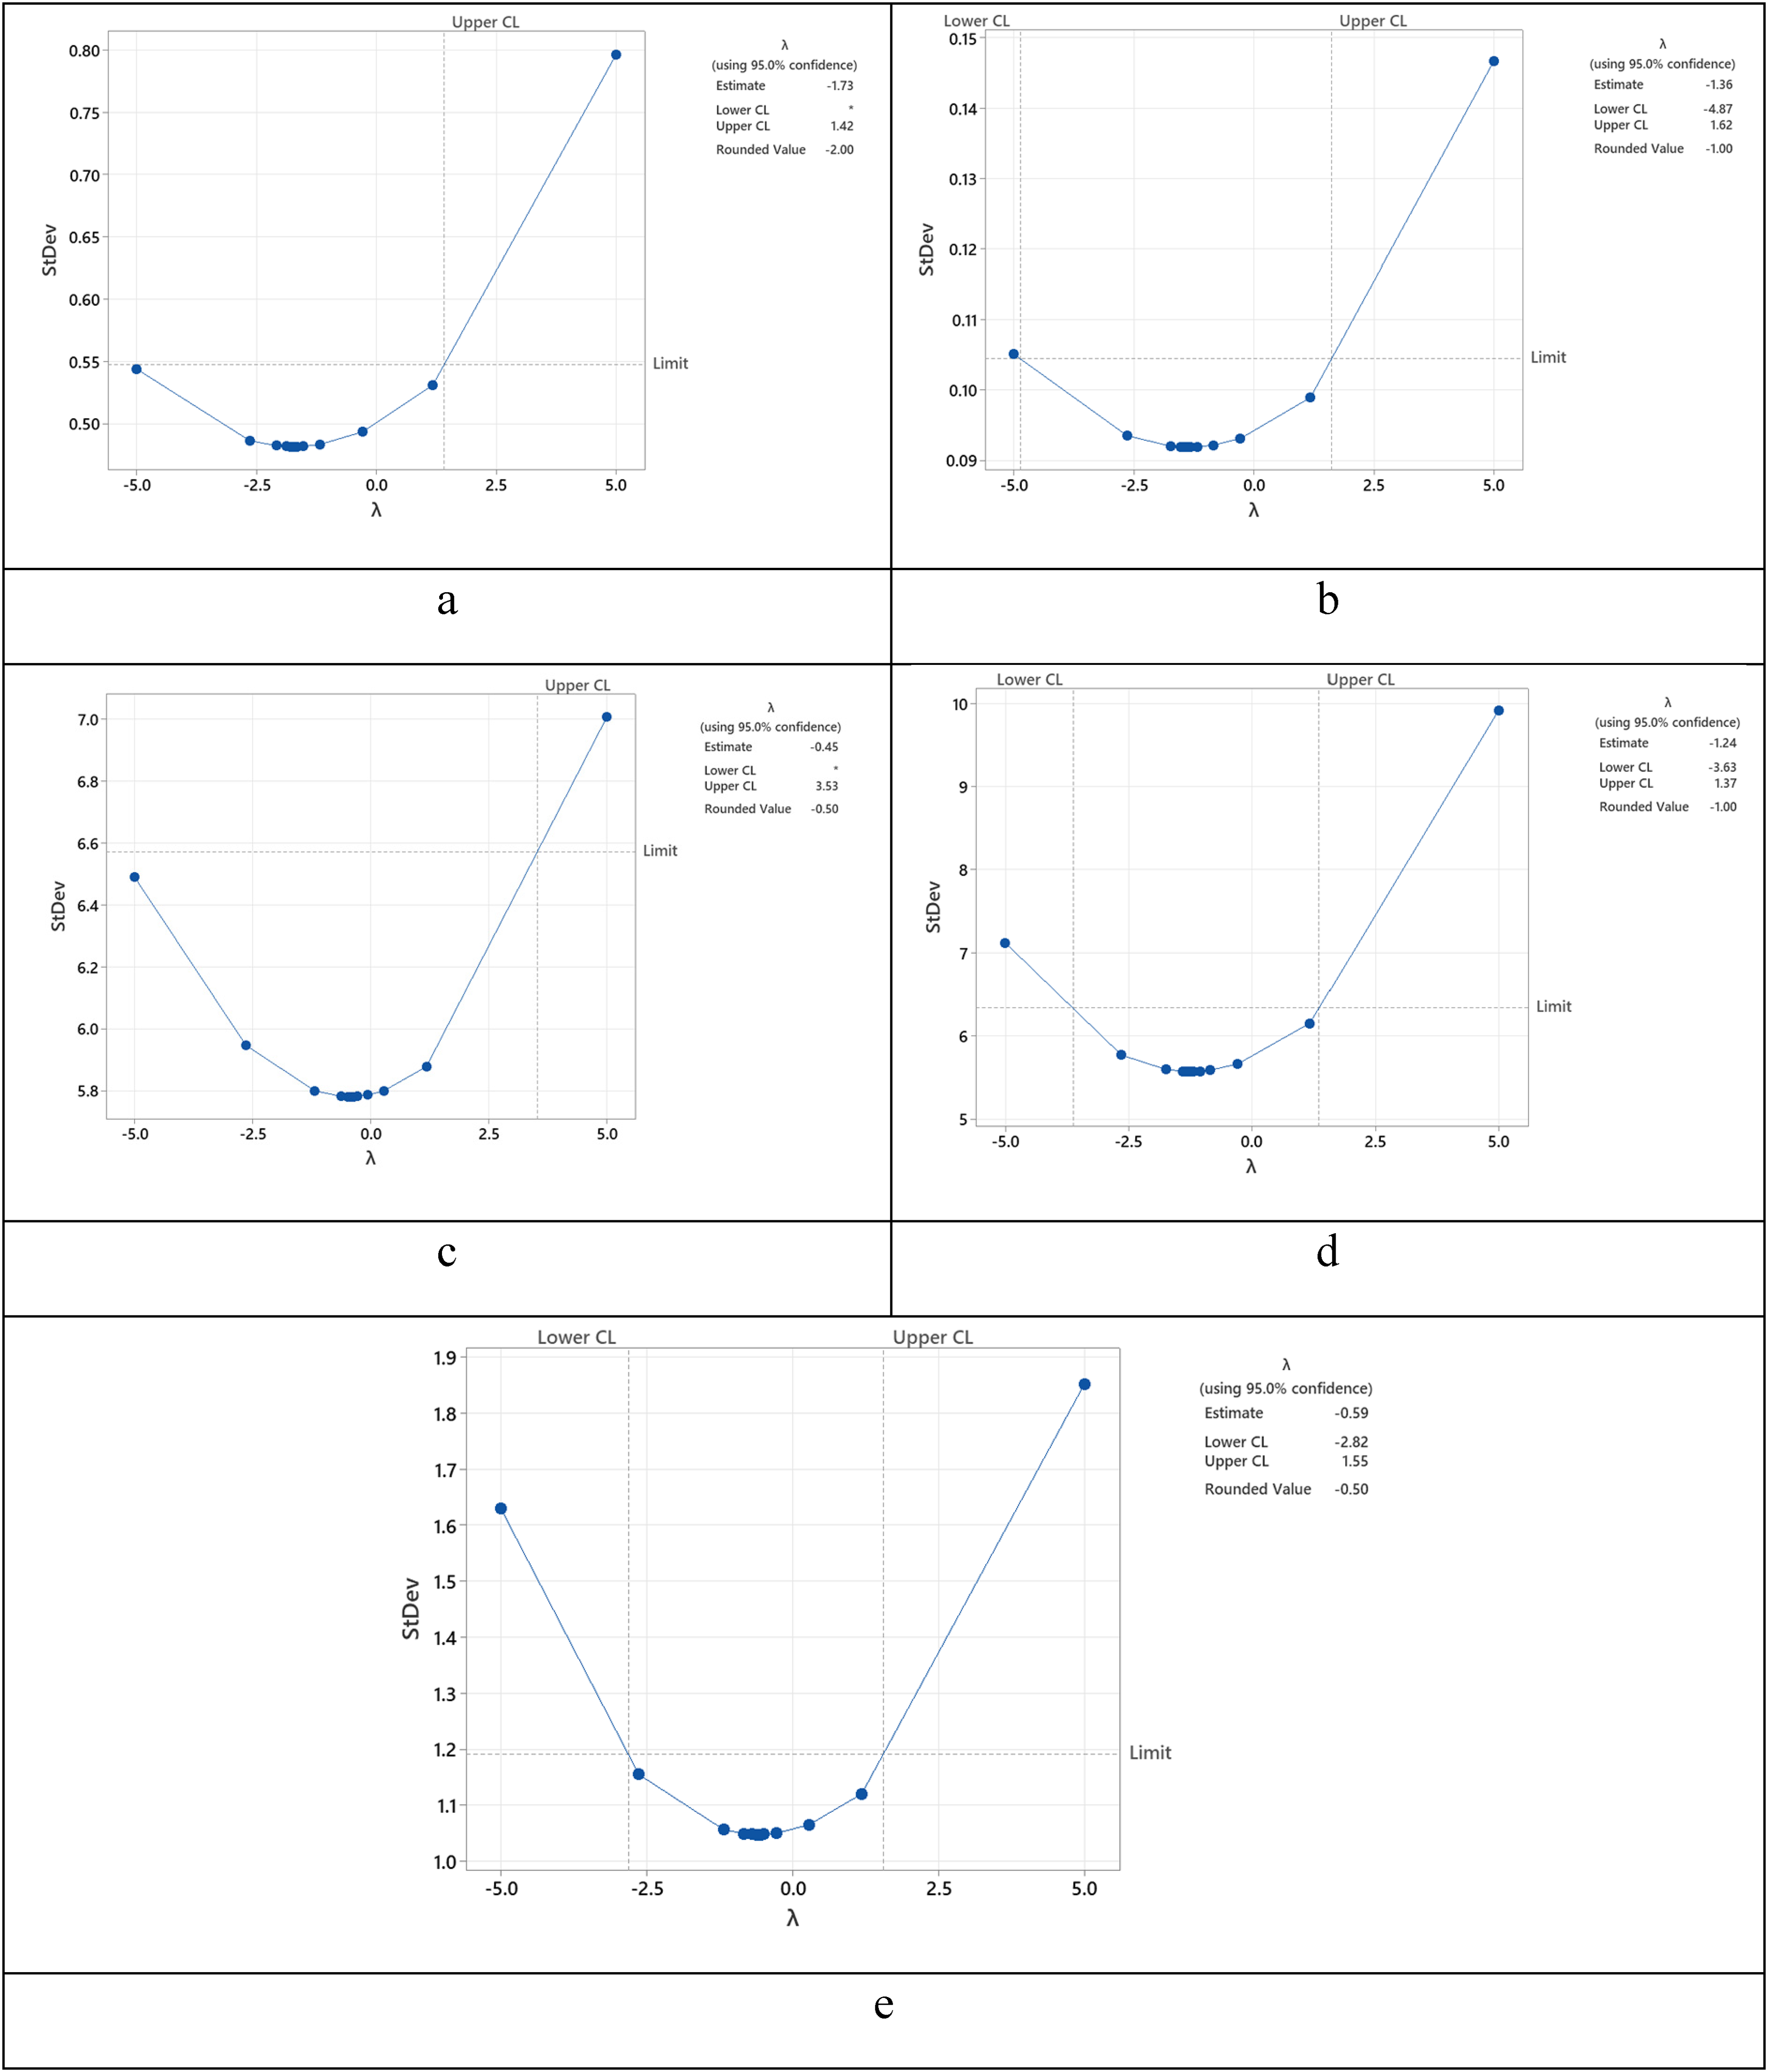
Box-Cox plots of the studied variables: (a) injuries per 100,000 persons, (b) deaths per 100,000 persons (c), accidents per 100,000 persons, (d) injuries per 1000 accidents, and (e) deaths per 1000 accidents.
Figure 3 depicts time series plots of the first difference for the studied variables. To obtain a stationary series, the researcher decides to take the first difference of data to remove trends from the series. Also, the Augmented Dickey-Fuller test to the first difference of data reveals that the values of P-value for the studied parameters was less than 0.05. This implies that the first difference in the testing data is stationary.
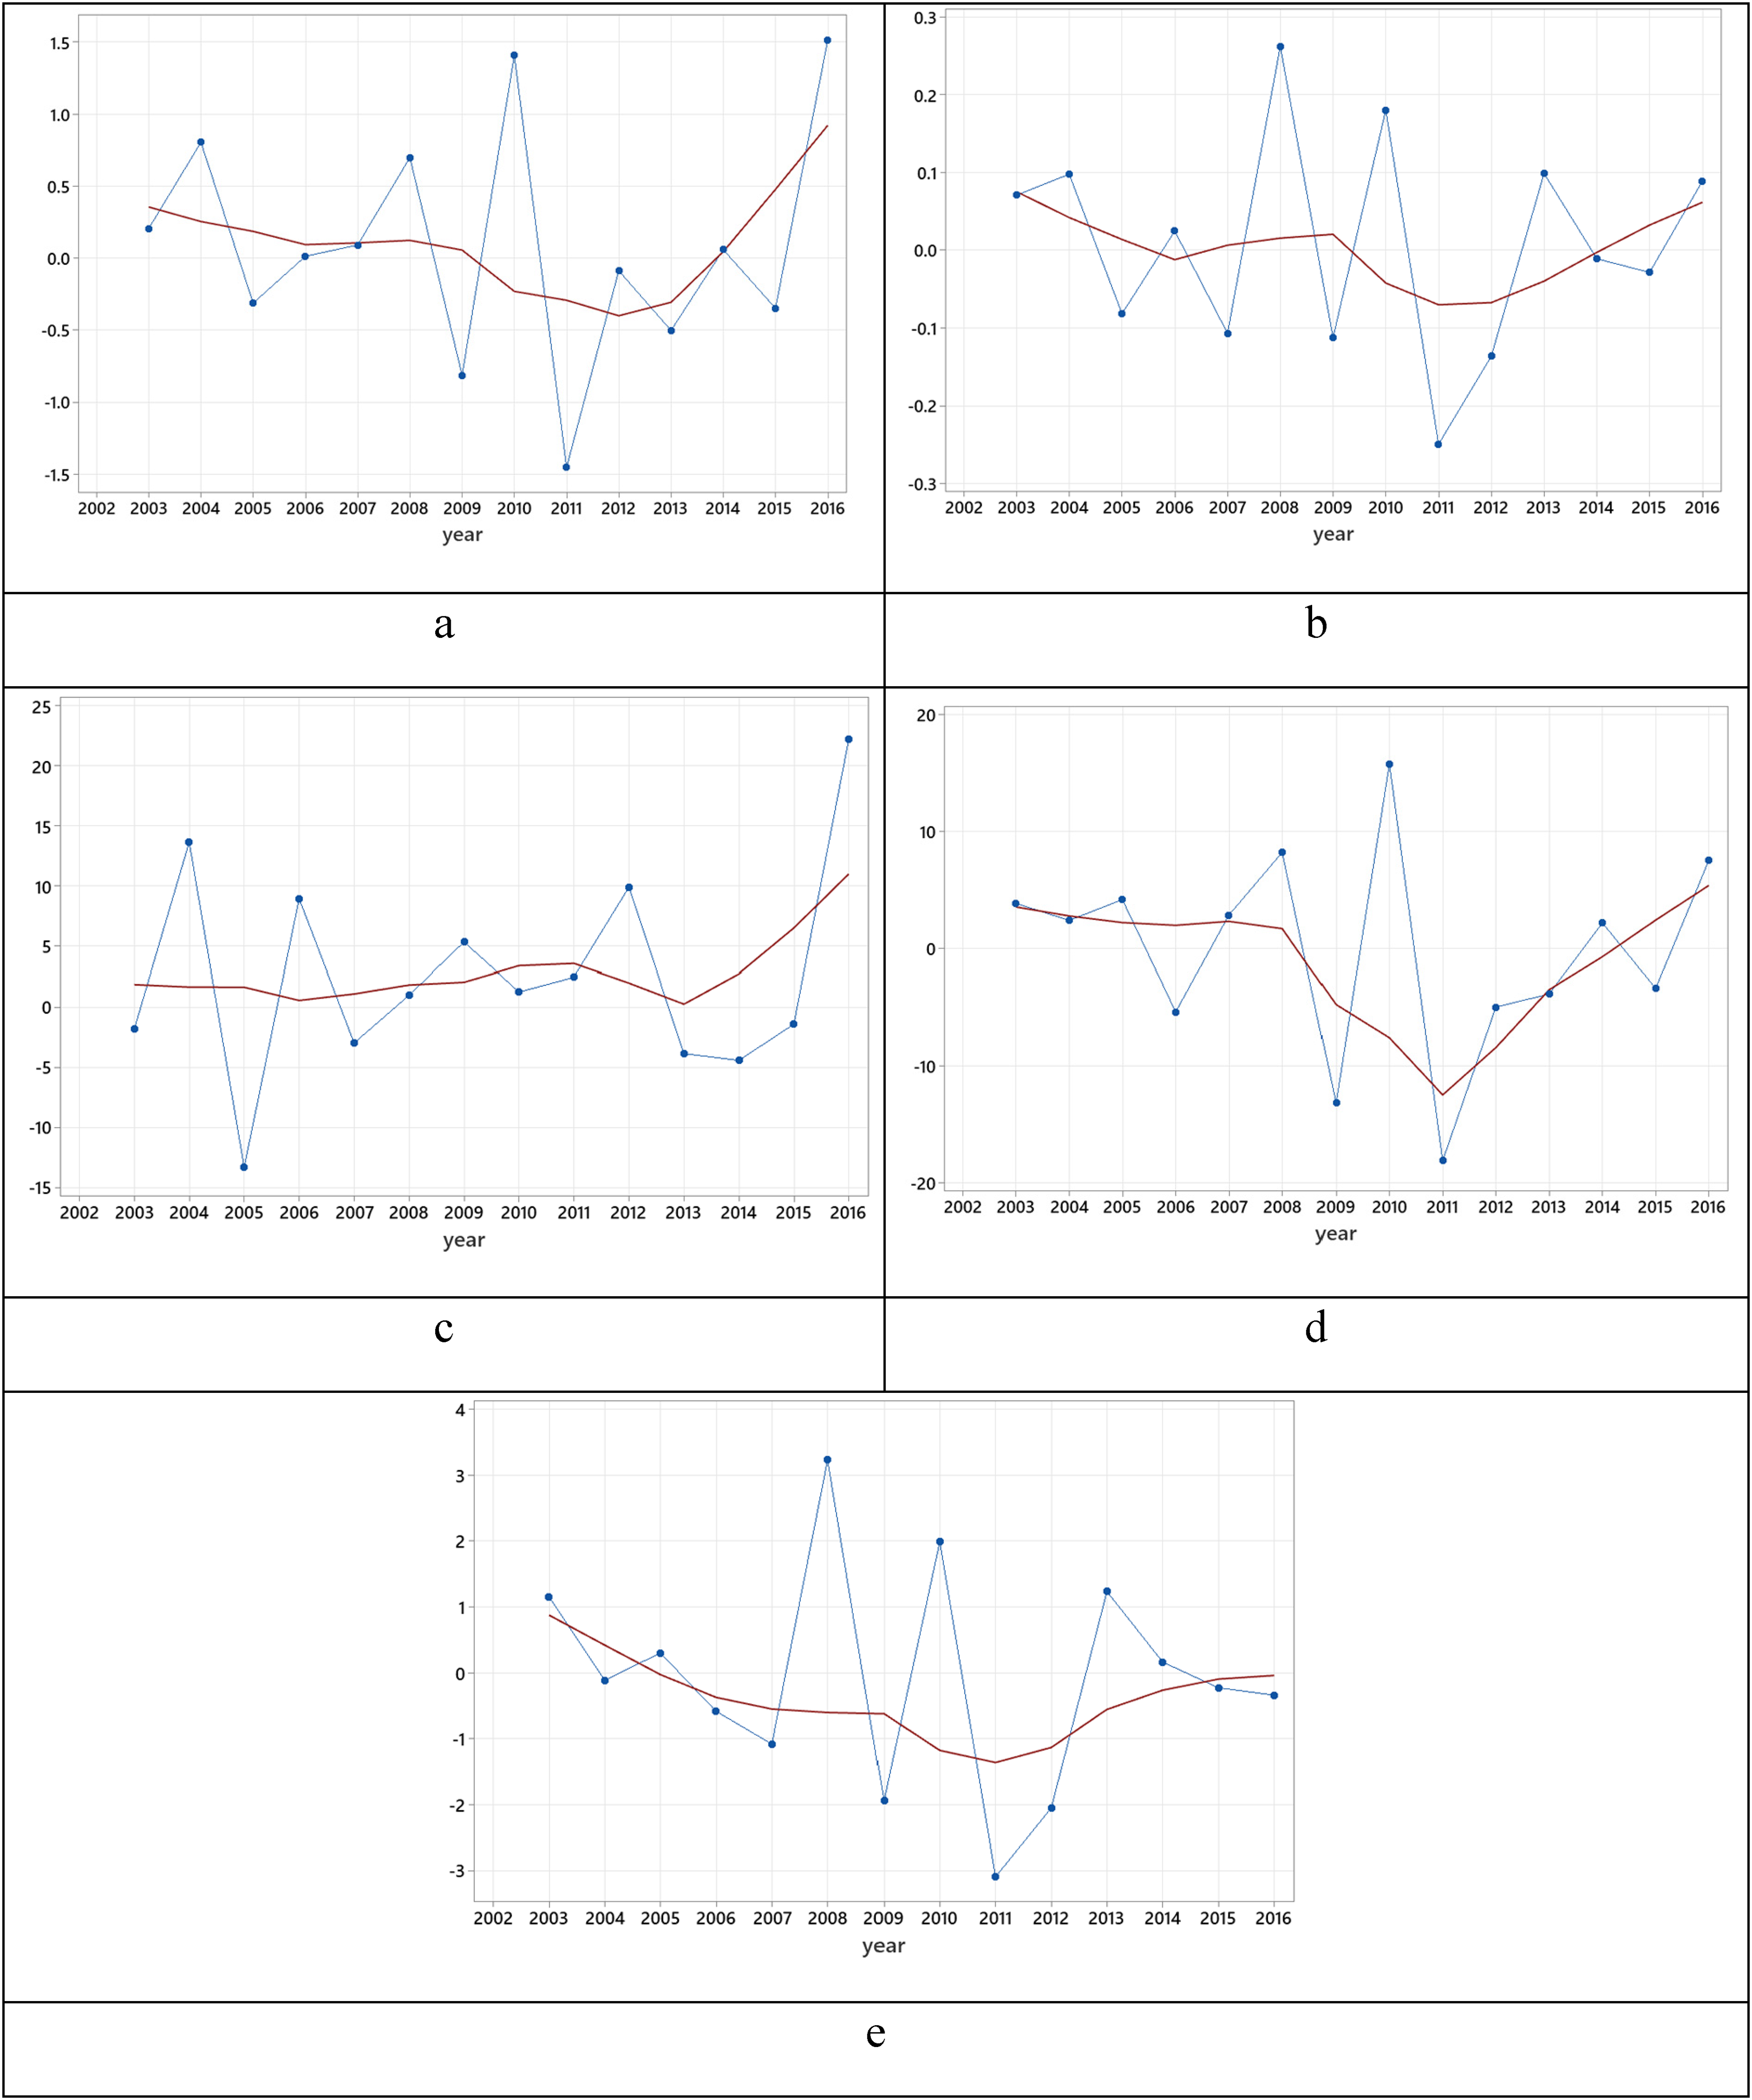
Time series plots of the first difference for the studied variables: (a) injuries per 100,000 persons, (b) deaths per 100,000 persons, (c) accidents per 100,000 persons, (d) injuries per 1000 accidents, and (e) deaths per 1000 accidents.
Figures 4 and 5 display the ACF and PACF for the studied variables. The ACF and PACF were examined to identify potential models. The suggested orders are used to build the model. Based on the results, the values of autocorrelation and partial autocorrelation for the studied parameters were not significant in any lag.
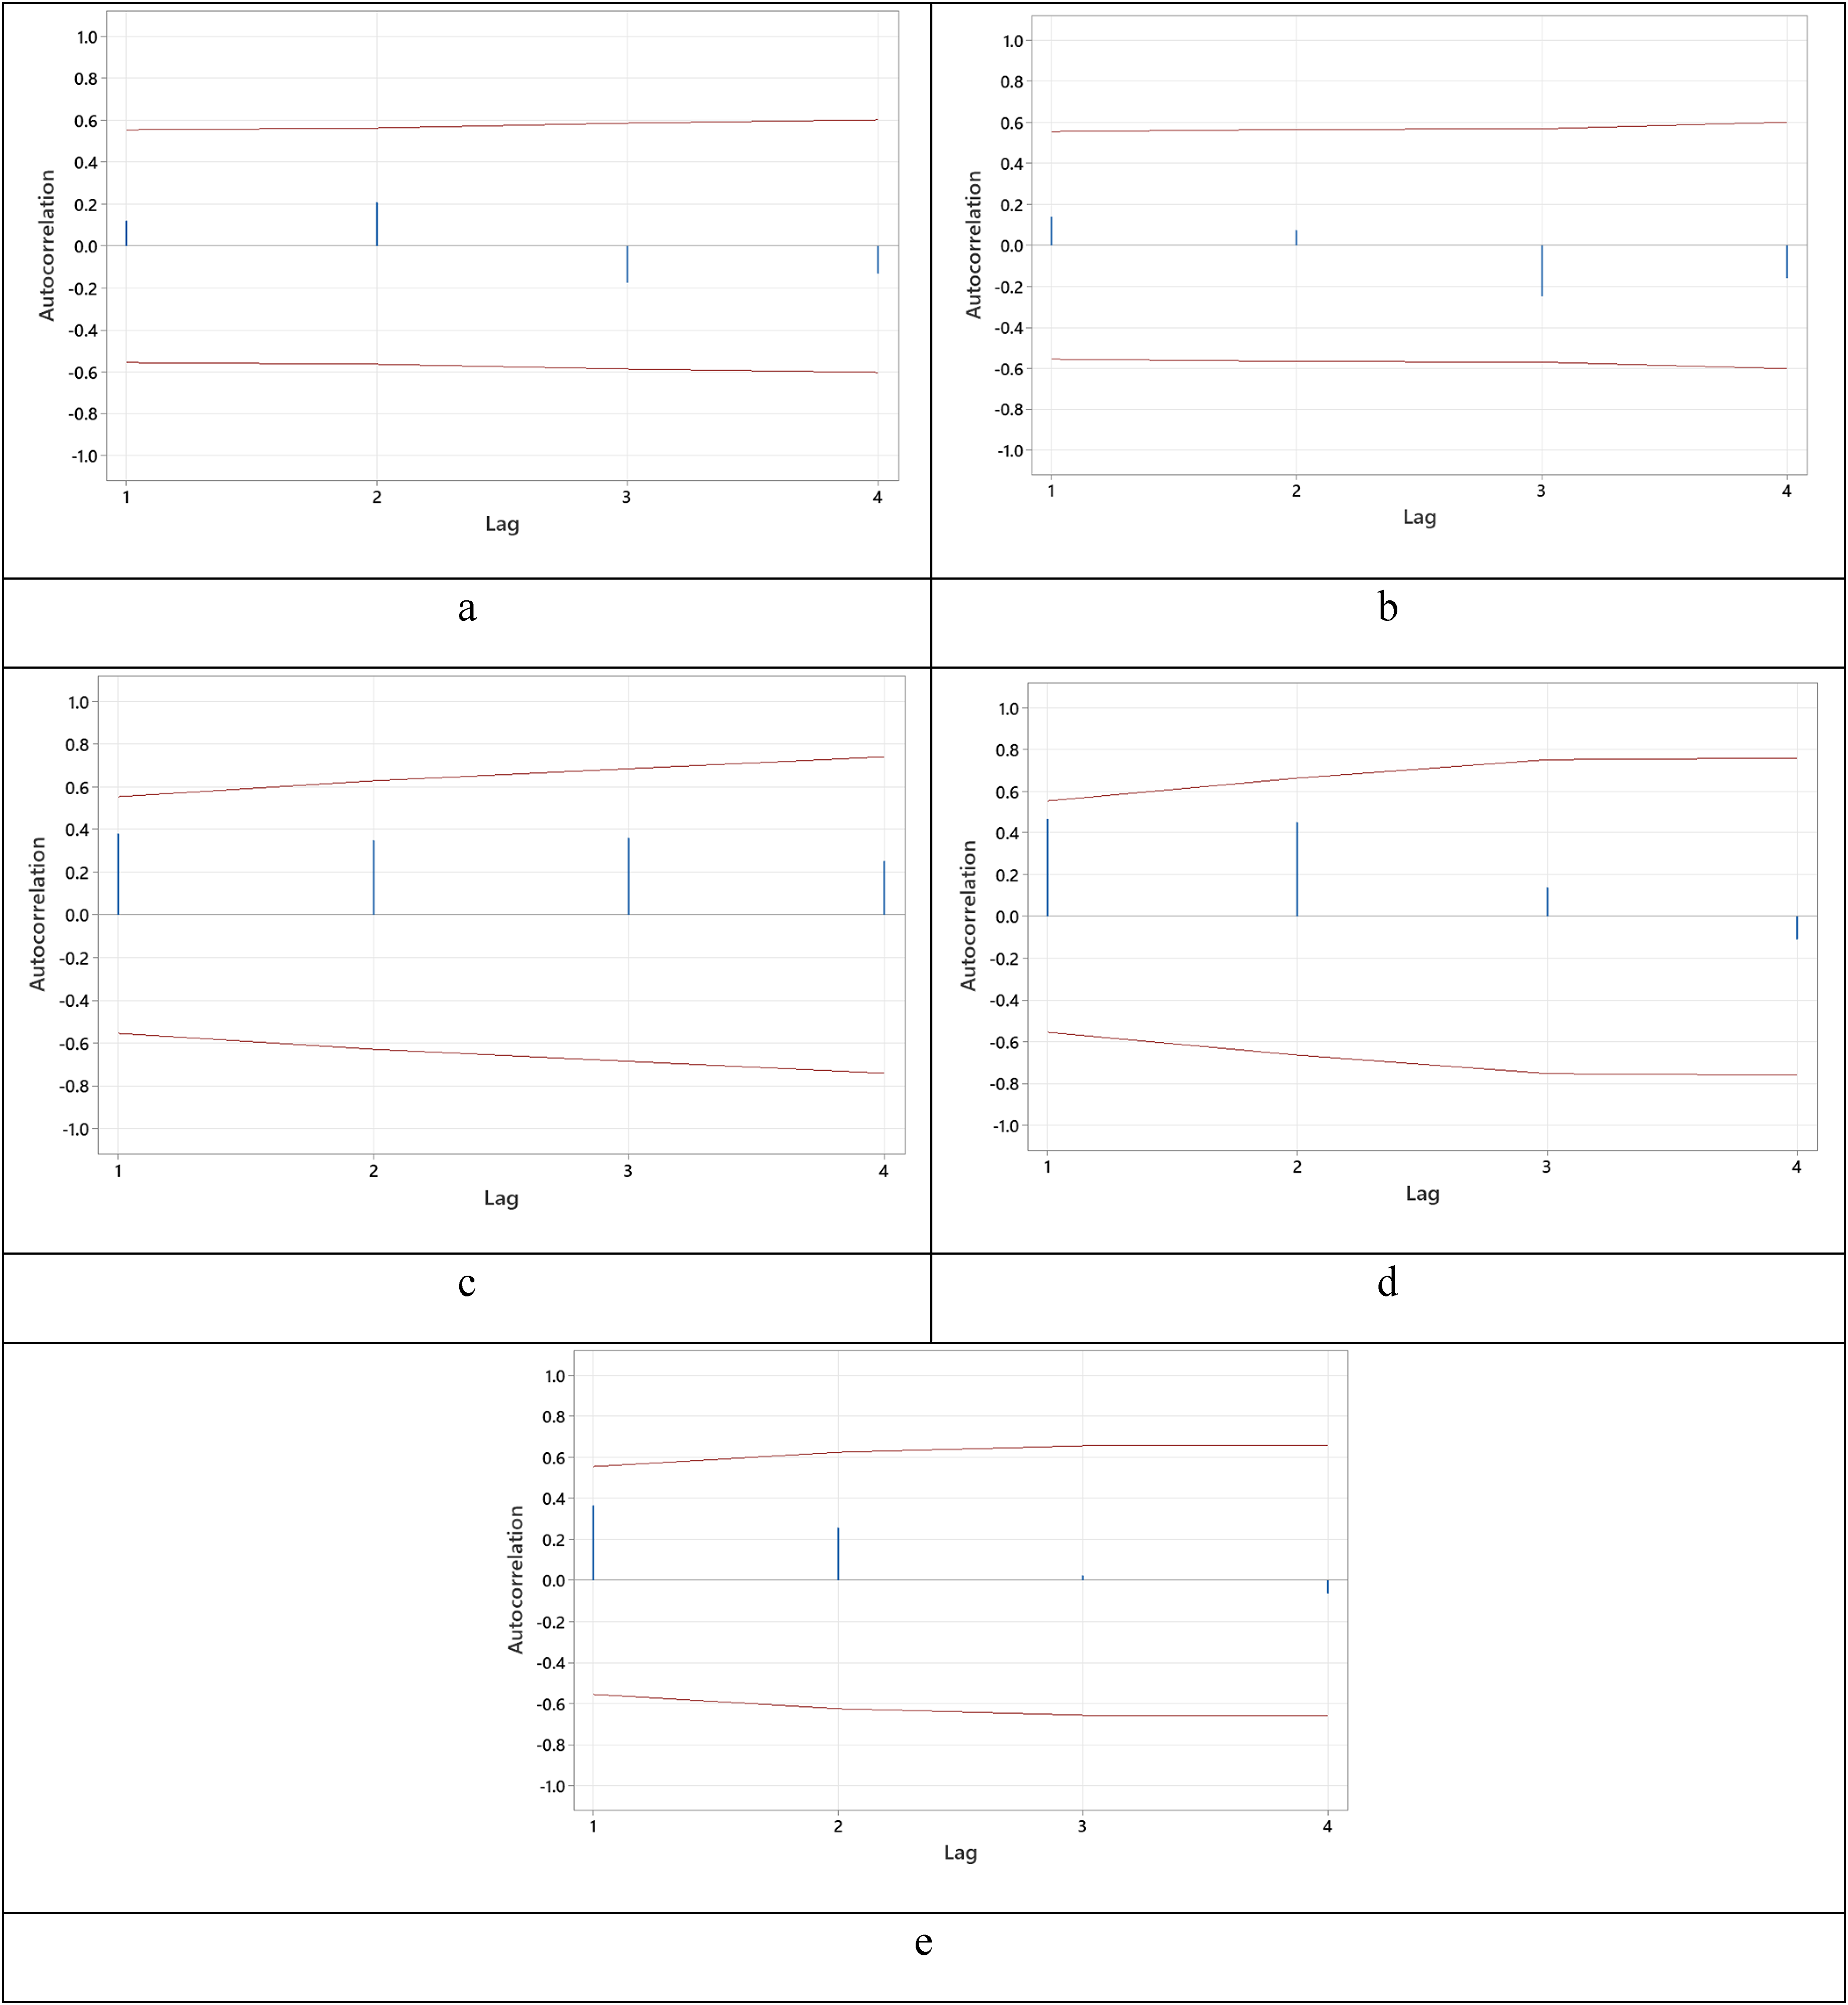
Autocorrelation function for the studied variables: (a) injuries per 100,000 persons, (b) deaths per 100,000 persons, (c) accidents per 100,000 persons, (d) injuries per 1000 accidents, and (e) deaths per 1000 accidents.
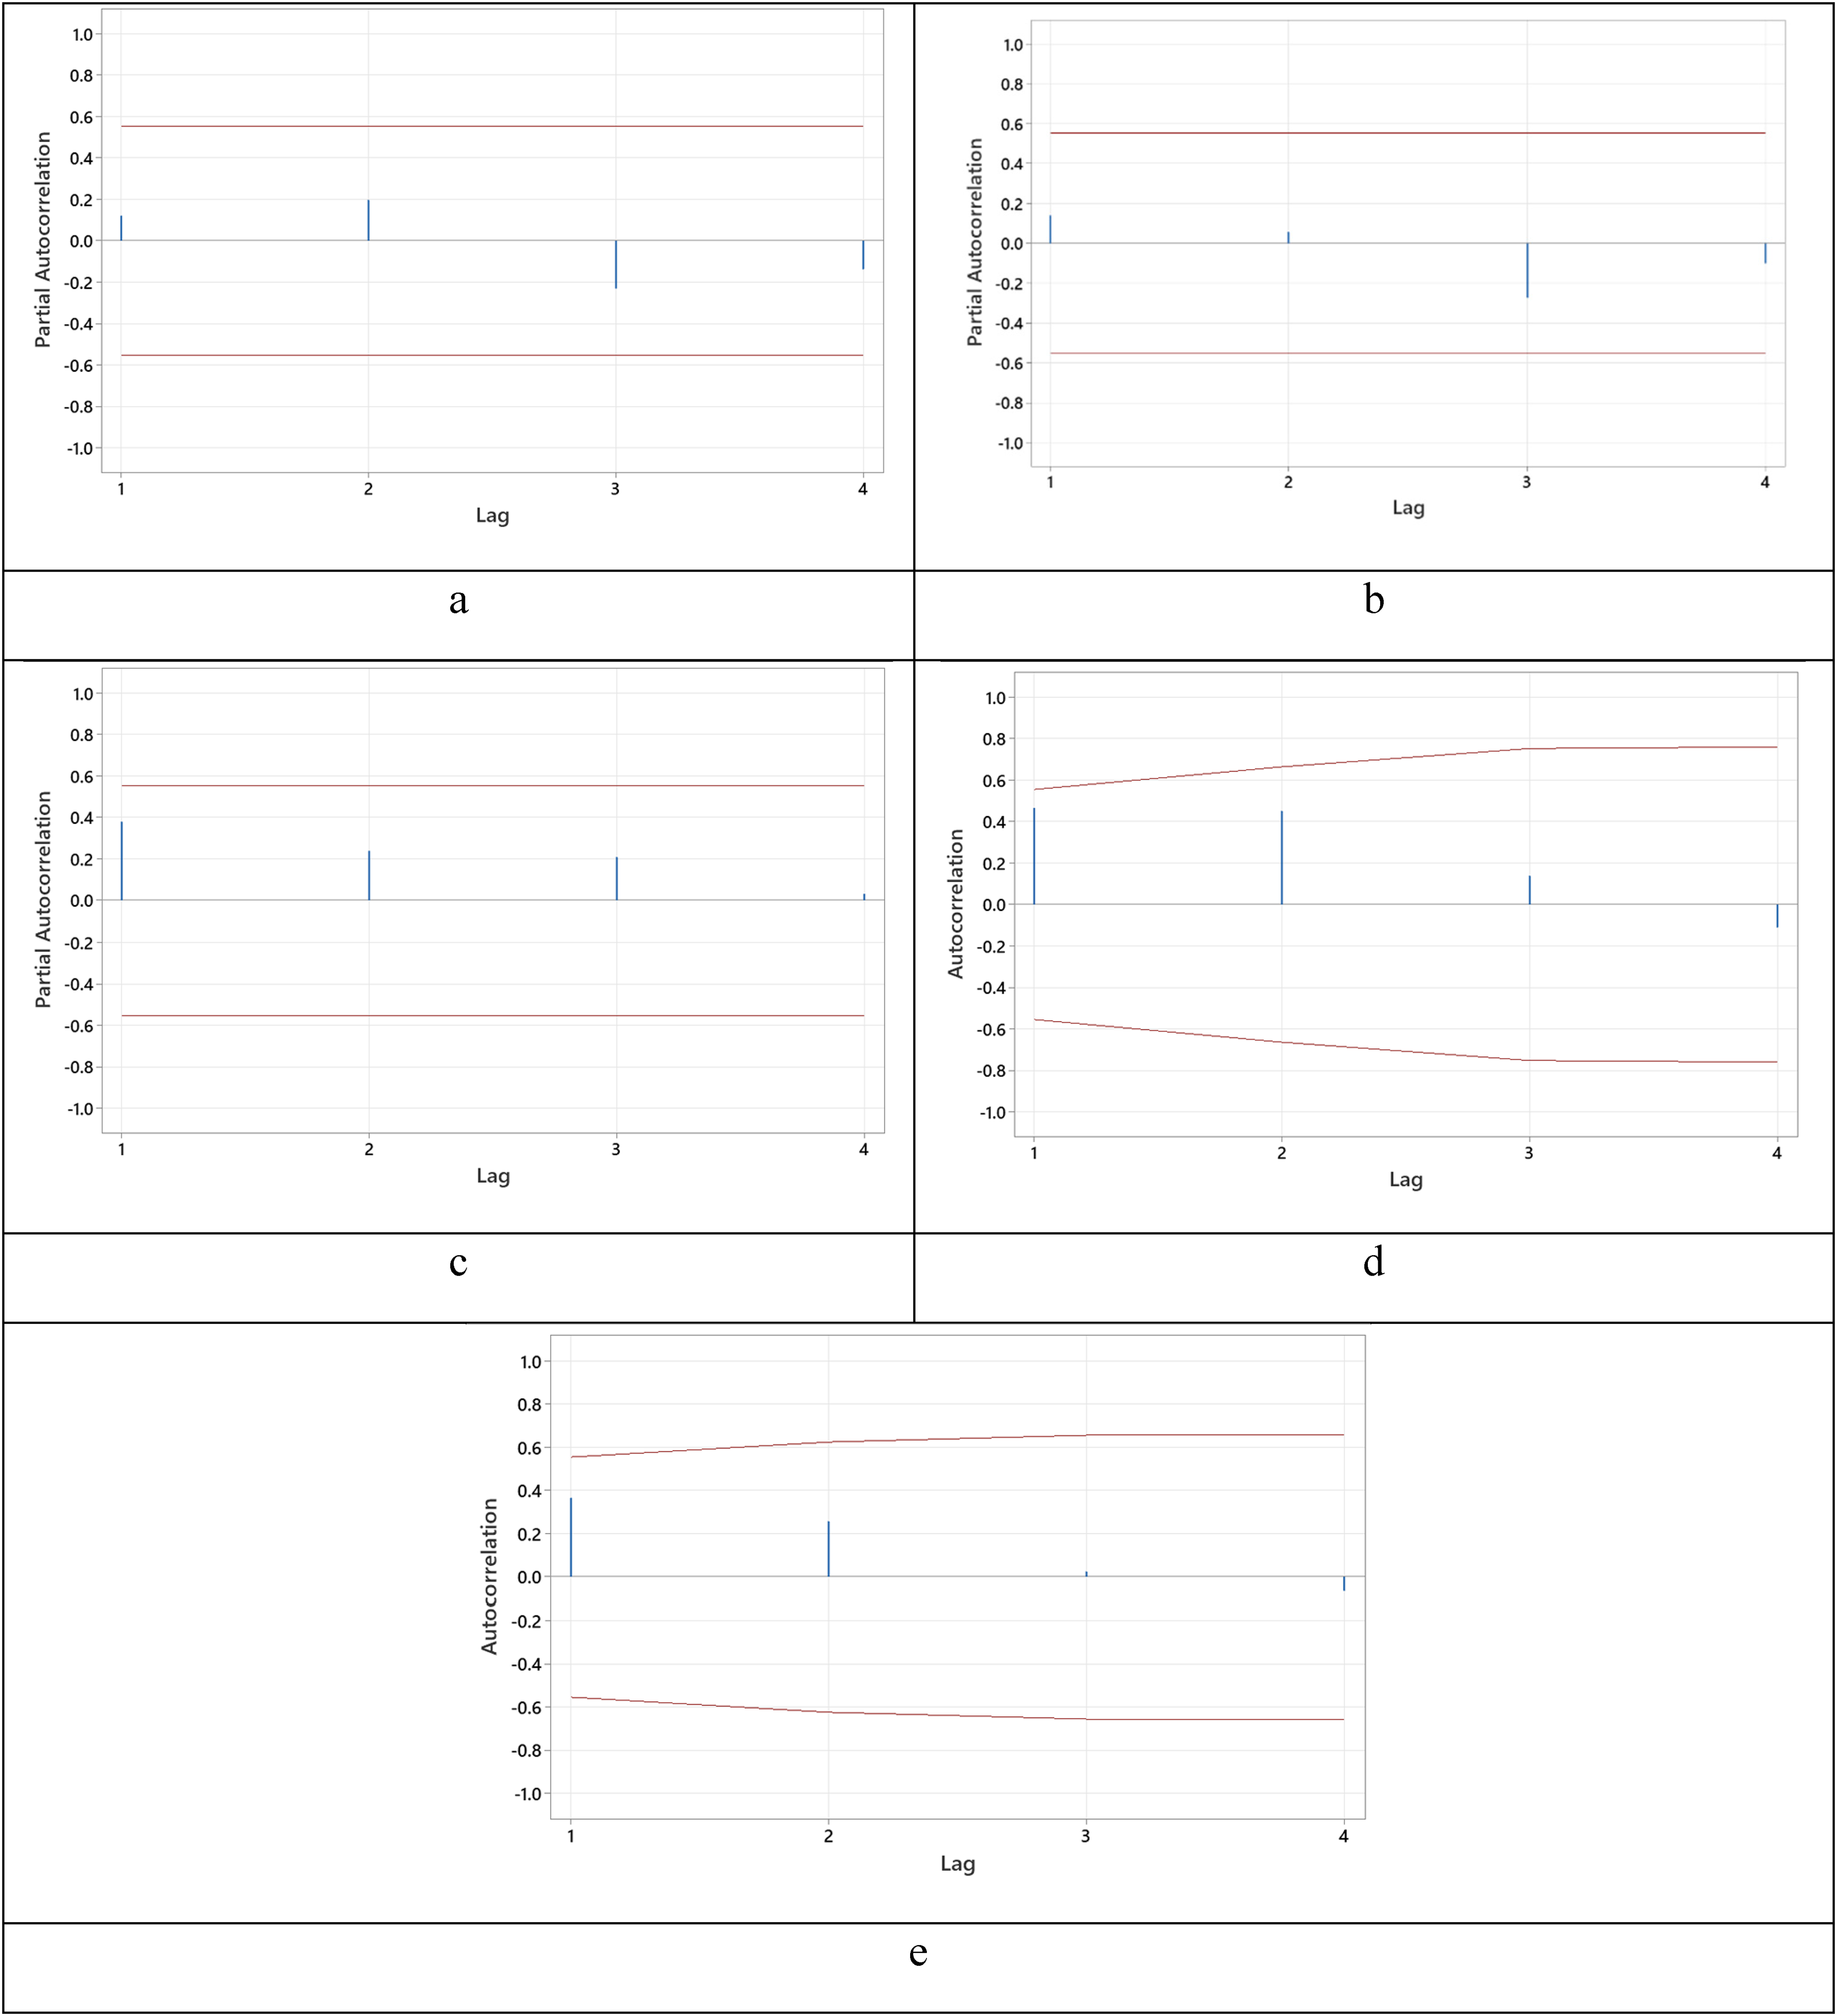
Partial autocorrelation function for the studied variables: (a) injuries per 100,000 persons, (b) deaths per 100,000 persons, (c) accidents per 100,000 persons, (d) injuries per 1000 accidents, and (e) deaths per 1000 accidents.
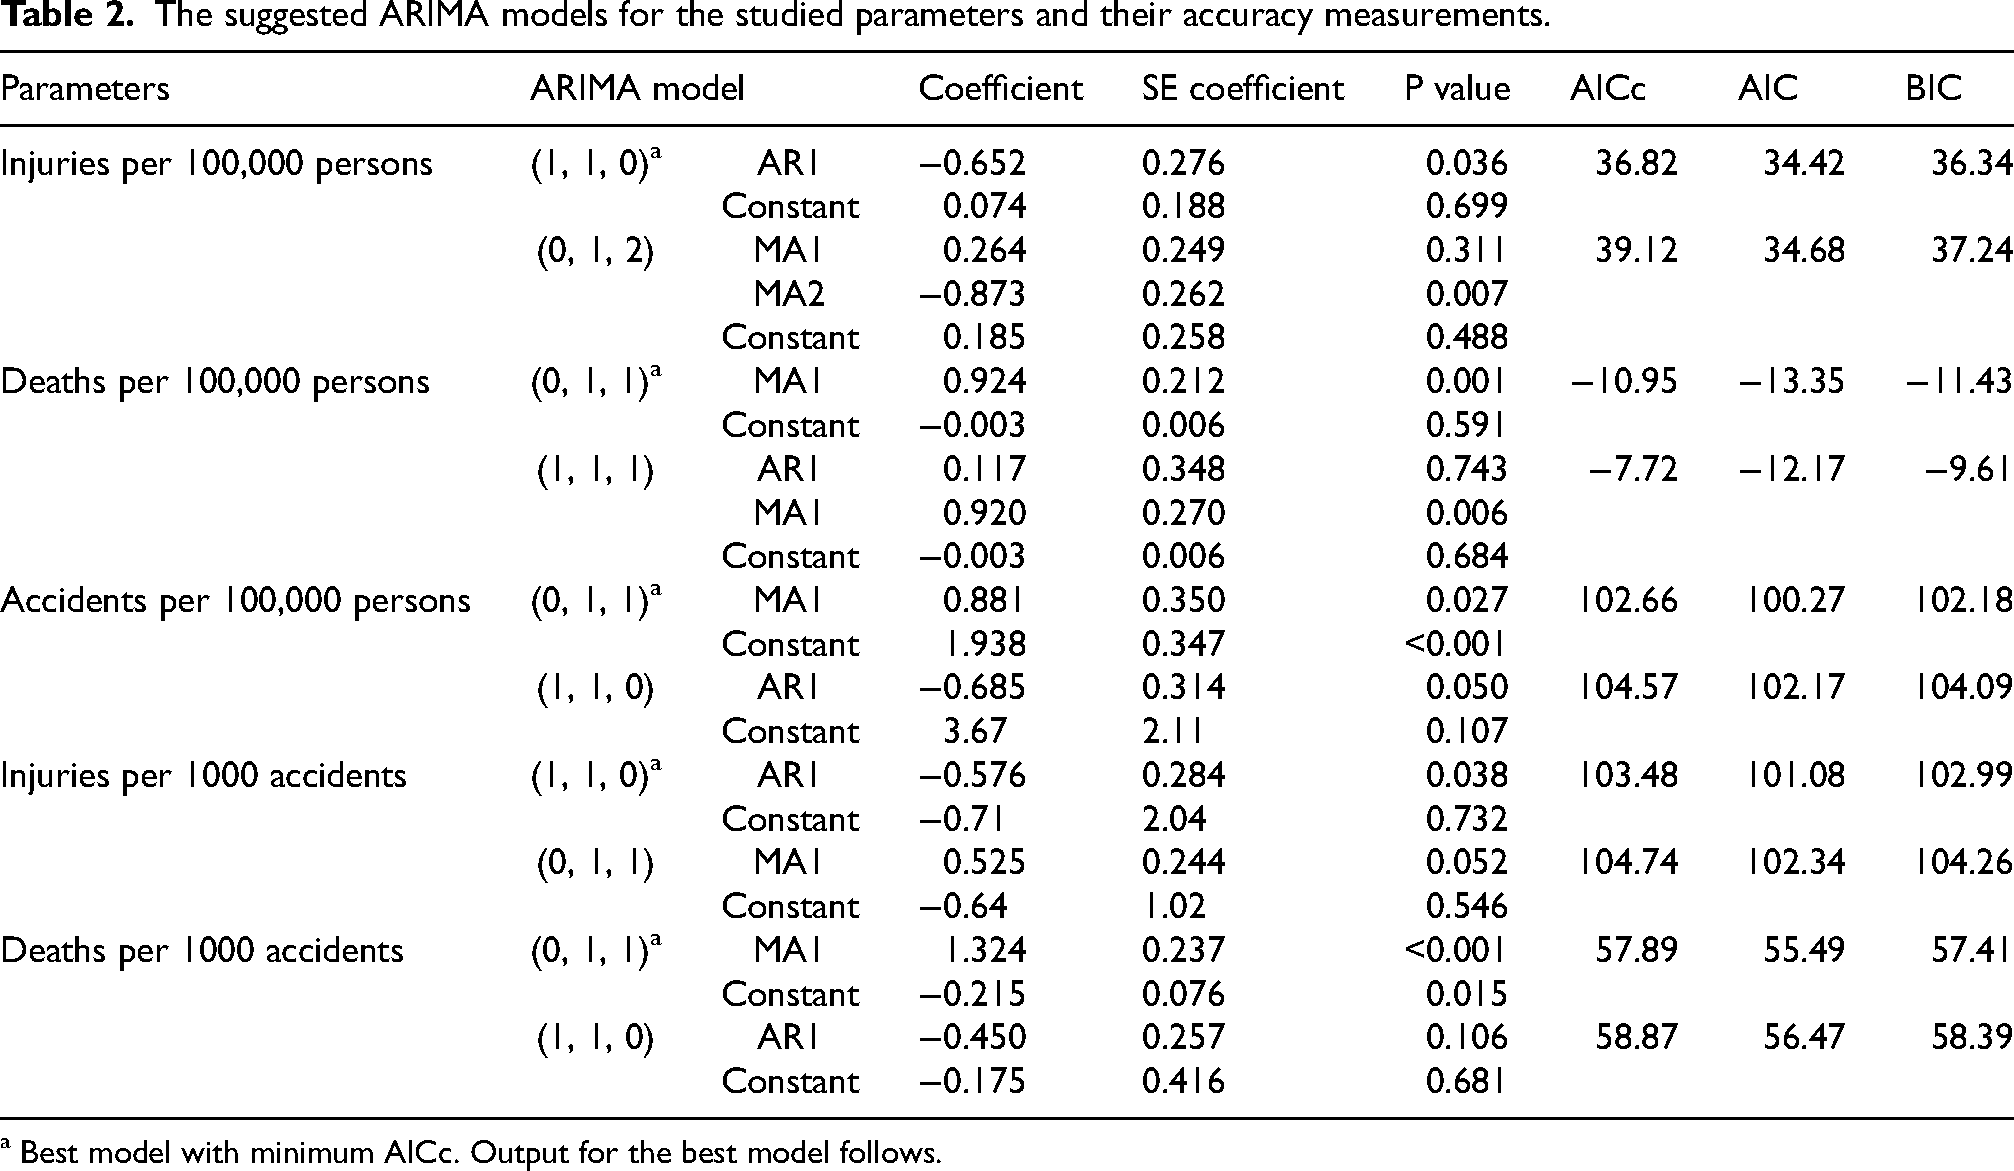
Table 2 describes the suggested ARIMA models for the studied parameters and their accuracy measurements. Based on the results, ARIMA (1, 1, 0) model for injuries per 100,000 persons, ARIMA (0, 1, 1) model for deaths per 100,000 persons, ARIMA (0, 1, 1) model for accidents per 100,000 persons, ARIMA (1, 1, 0) model for injuries per 1000 accidents, and ARIMA (0, 1, 1) model for deaths per 1000 accidents had the lowest values of AICc, AIC, and BIC. Therefore, these models were selected for forecasting the studied parameters. Next, the researcher checked the adequacy of the fitted models. The results indicated that modified box-pierce (Ljung-Box) Chi-square statistics are not significant at any positive lags for the models (P > 0.141). Also, Figure 6 depicts the four plots of the histogram of residuals, normal plot of residuals, residuals versus fits, and residuals versus order for confirmation of the selected ARIMA models. It is observed that the standardized residuals plot of the model is independently and identically distributed with one outlier. There is no evidence of significance in the autocorrelation functions of the residuals of the model, and the standardized residuals appear to be normally distributed. The results of Kolmogorov-Smirnov showed that the residuals have normal distributions (P > 0.105).
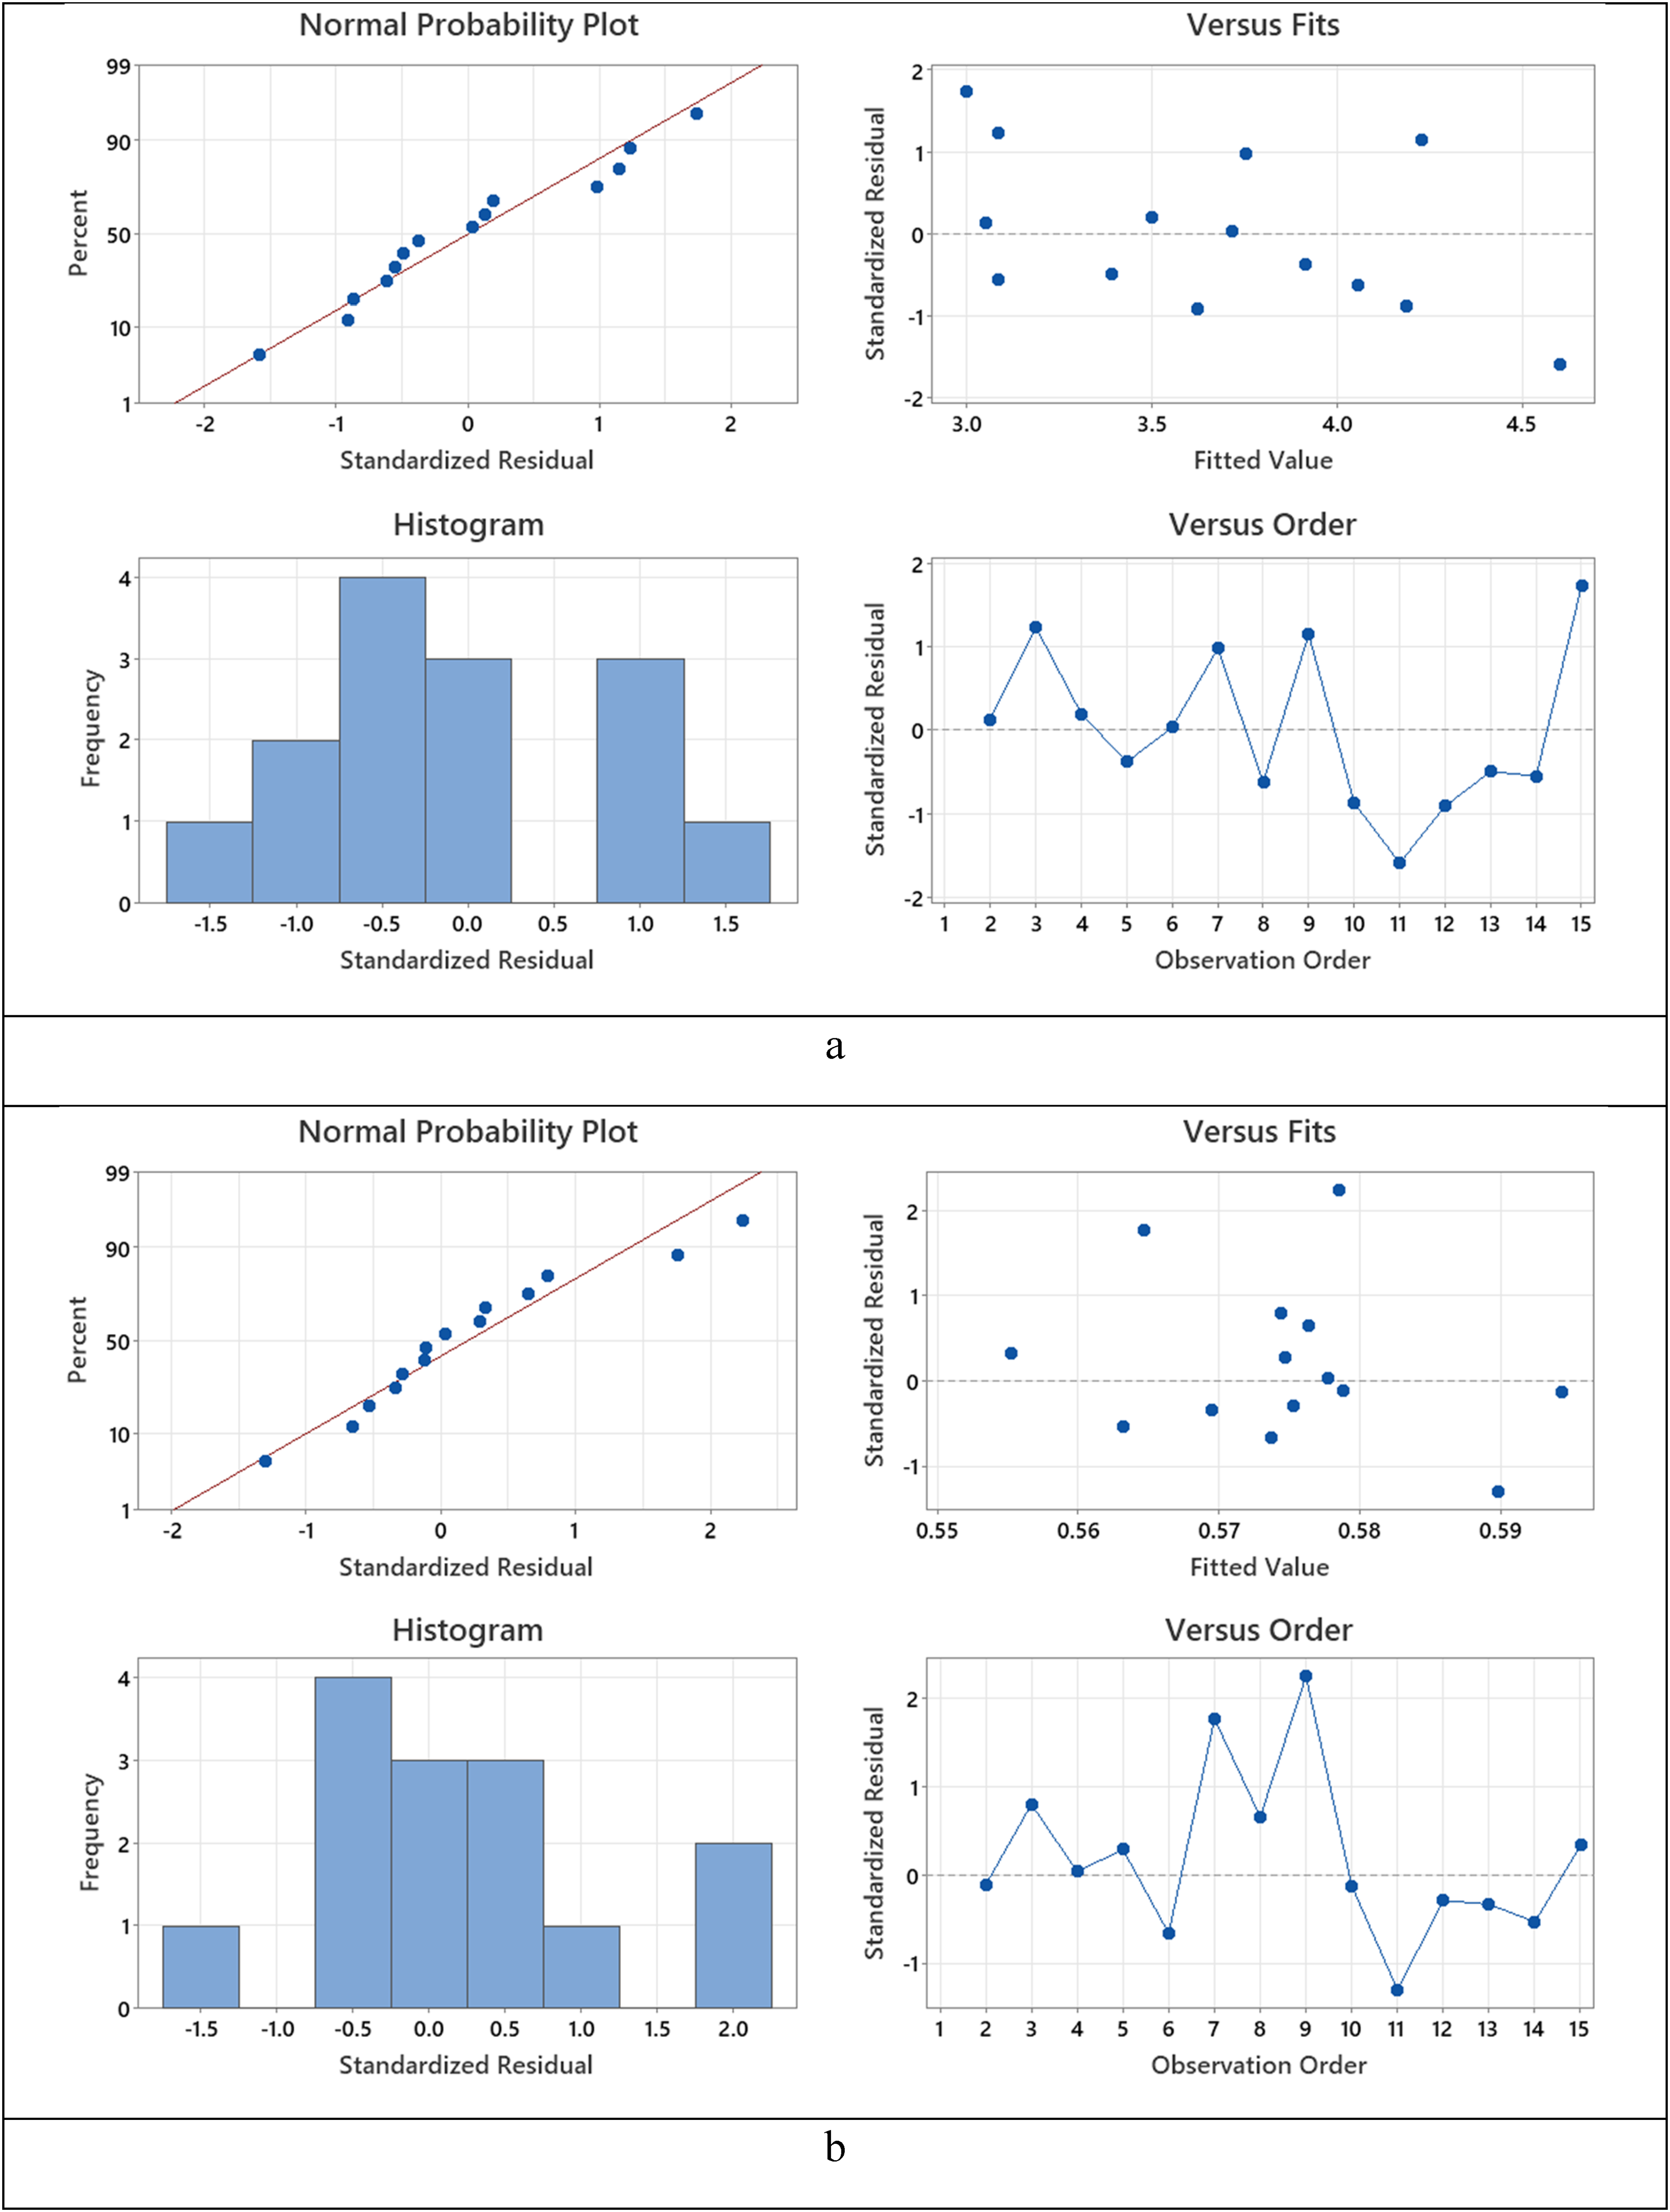
The four plots of the histogram of residuals, normal plot of residuals, residuals versus fits, and residuals versus order for confirmation of the selected ARIMA model: (a) injuries per 100,000 persons, (b) deaths per 100,000 persons, (c) accidents per 100,000 persons, (d) injuries per 1000 accidents, and (e) deaths per 1000 accidents.
The suggested ARIMA models for the studied parameters and their accuracy measurements.
a Best model with minimum AICc. Output for the best model follows.
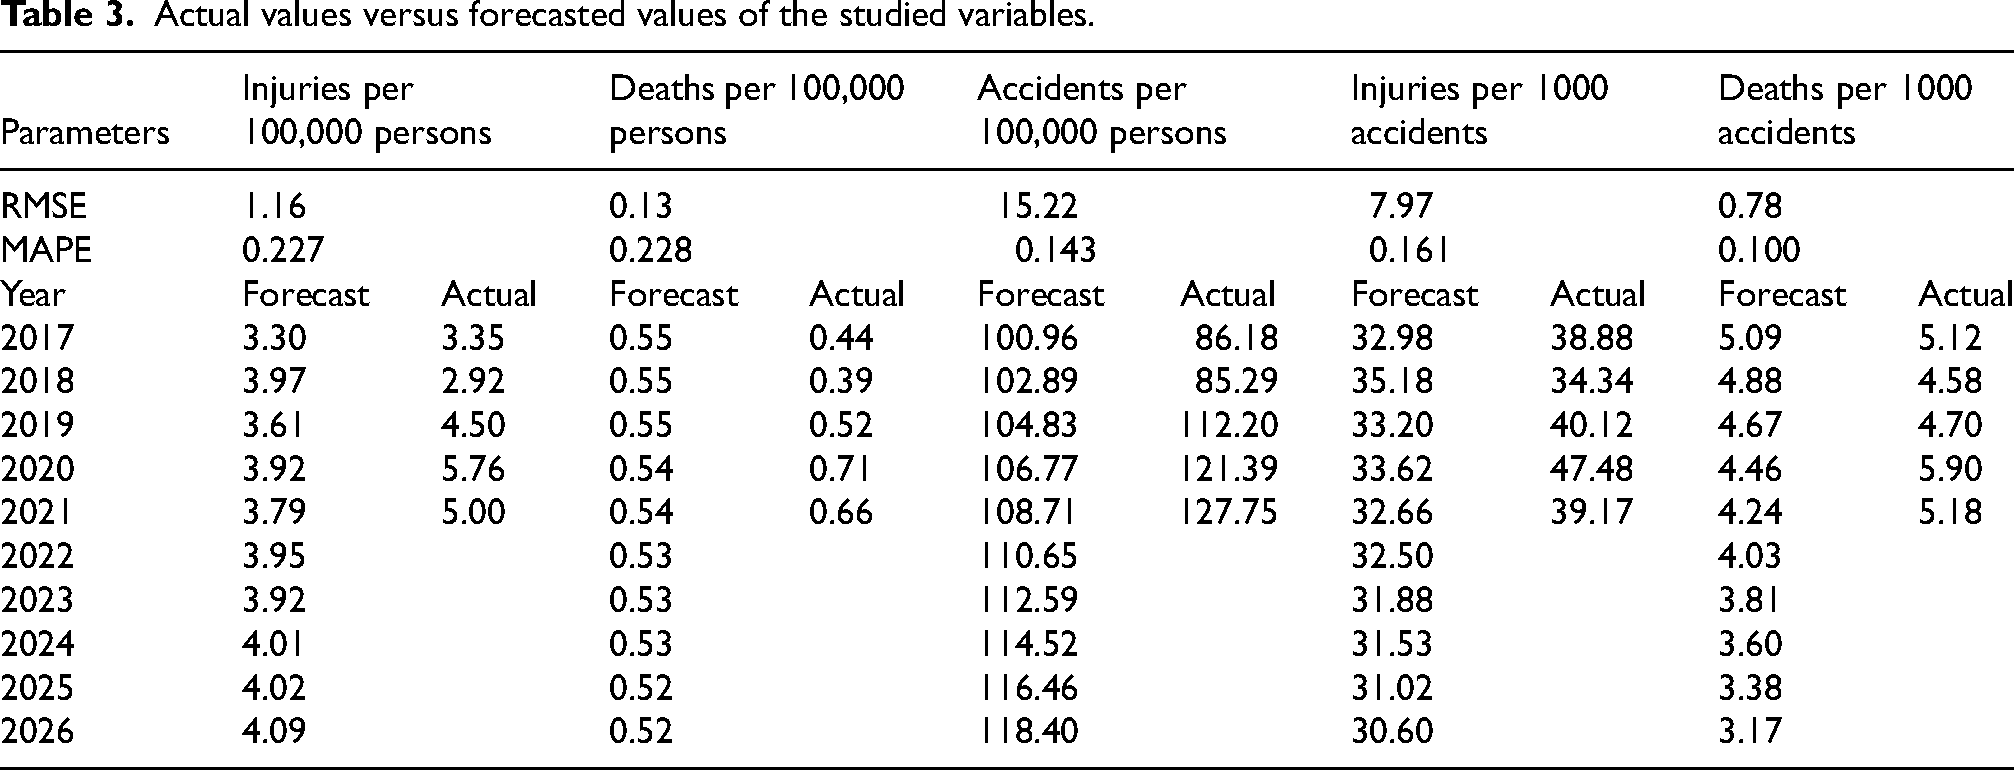
Figure 7 indicates trends of the studied variables for the upcoming 10 years from 2017 to 2026. Moreover, Table 3 reports the actual values versus forecasted values of the variables from 2017 to 2021. As a result, it is observed that the trends of forecasted values of injuries per 100,000 persons and accidents per 100,000 persons due to fire in KSA are increasing, and the trends of forecasted values of deaths per 100,000 persons, injuries per 1000 accidents, and deaths per 1000 accidents are decreasing. Moreover, to check the validity of the fitted model, the actual observations are plotted with predicted values from 2017 to 2021 (5 years). Based on the values of MAPE, forecasting was reasonable for injuries per 100,000 persons and deaths per 100,000 persons and good for accidents per 100,000 persons, injuries per 1000 accidents, and deaths per 1000 accidents. Therefore, it may be concluded that the proposed model would be well-fitted to forecast the studied parameters.
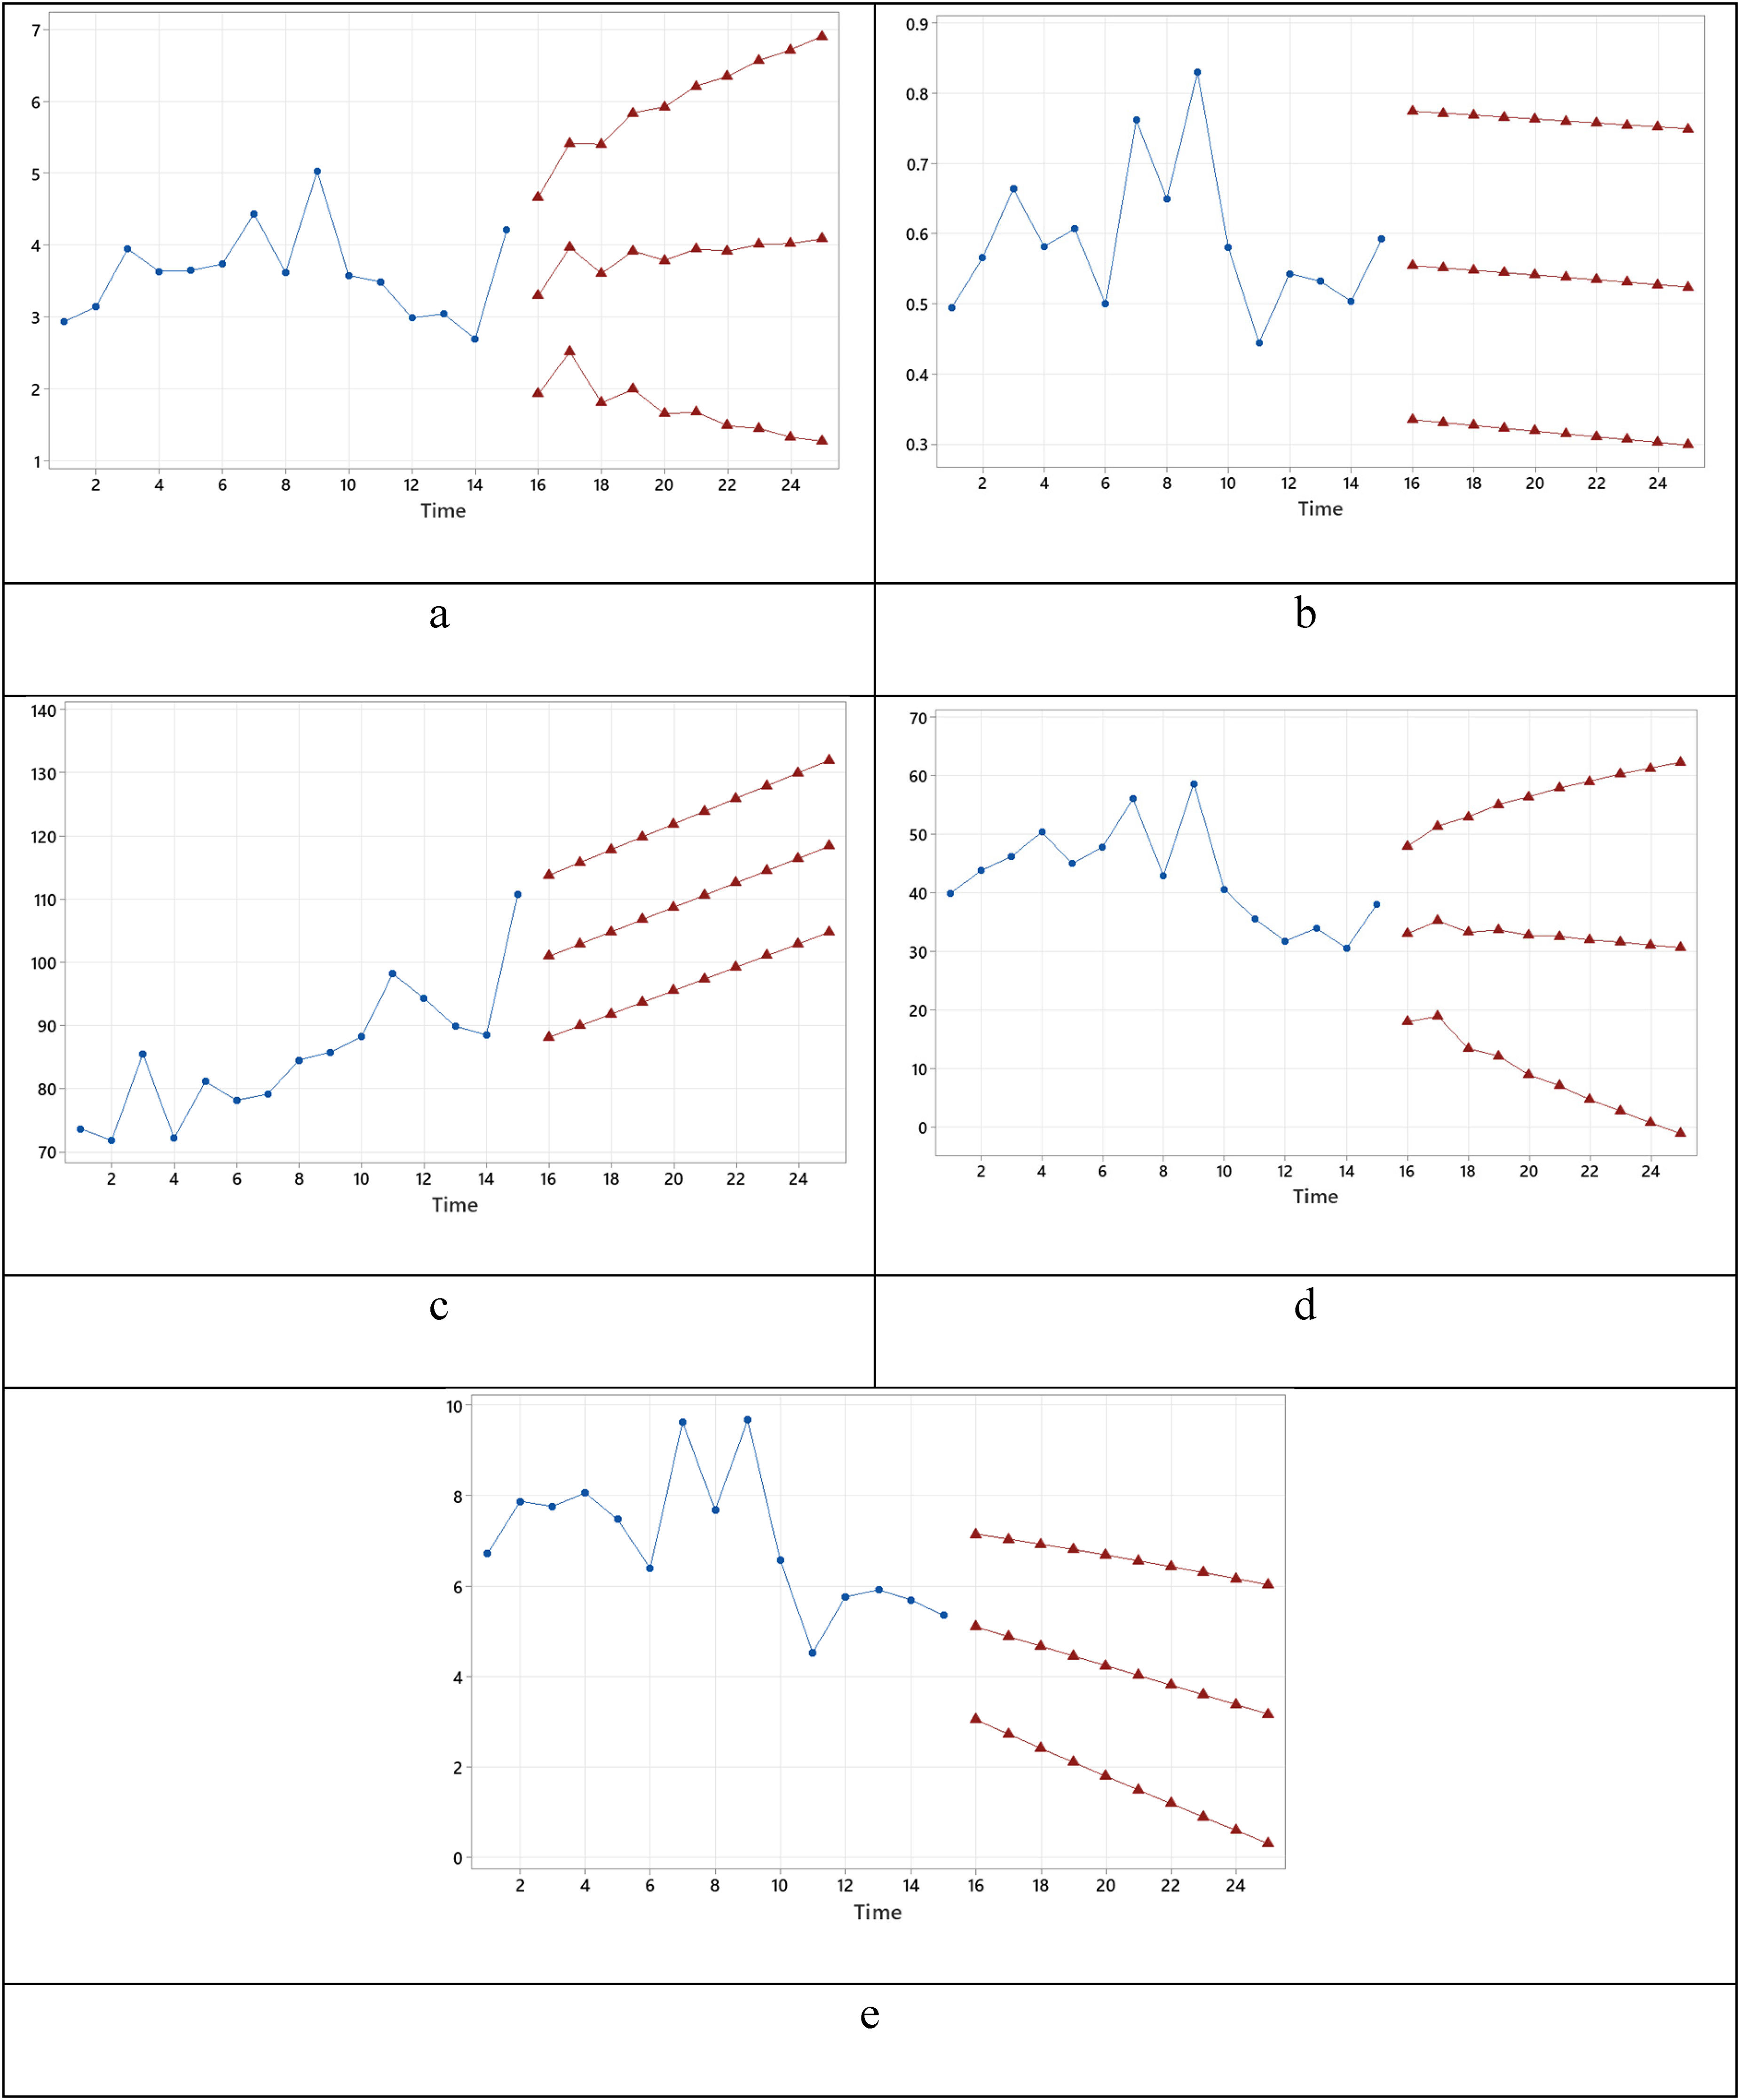
Trend of the studied variables for the upcoming 10 years: (a) injuries per 100,000 persons, (b) deaths per 100,000 persons, (c) accidents per 100,000 persons, (d) injuries per 1000 accidents, and (e) deaths per 1000 accidents.
Actual values versus forecasted values of the studied variables.
Discussions
This paper analyzes the data of fire accidents and physical consequences from 2002–2021, applies the ARIMA algorithm to produce a forecast model, and then utilizes the data of these years for correction and analysis. In the end, the prediction for the studied parameters is performed until 2026.
Based on the results, it is observed that forecasted values of injuries per 100,000 persons and accidents per 100,000 persons due to fire in KSA had increasing trends and forecasted values of deaths per 100,000 persons, injuries per 1000 accidents, and deaths per 1000 accidents had decreasing trends.
Throughout history, accidents and incidents can threaten human health and life, but due to the occurrence and spread of infectious diseases, they are not a priority for the prevention and control of health facilities in countries. While today, accidents and incidents are considered one of the biggest problems in human life. These injuries are the second cause of death in all ages and the first cause of death in the age group less than 40 years old. Those are considered as important agents of disability and death. This epidemic problem is not only on the road, but also at home, schools, recreation centers, sports fields, workshops, and everywhere, which can lead to consequences such as maiming, disability, and death. 11 A significant percentage of accidents in industrial facilities, transportation, homes, and schools happen because of fire. Fire is significant not only because of its direct impact but also because of its effect on equipment which can lead to the loss of more flammable materials and thus exacerbate the accident scenario. This is particularly significant in those industrial facilities that are designed on a very compact layout. Offshore oil platforms and some process industries have a great quantity of equipment that can lead to such conditions. In a study, an analysis was done to determine the origin, type, and physical consequences of fire incidents in hazardous materials transportation and process industries. The results showed that 28.4% and 27.2% of fire accidents occurred in process industries and hazardous materials transportation, respectively. 19
As a result of the present study, trends of injuries per 100,000 persons and accidents per 100,000 persons due to fire in KSA are increasing and trends of deaths per 100,000 persons, injuries per 1000 accidents, and deaths per 1000 accidents are decreasing. With the increasing trend of urban population growth and city density and also, more use of electrical current, there is an increase in urban fire accidents and events. Among the possible accidents, fires with frequent and potential consequences are a group of the most important accidents in the urban area. 20 According to the latest statistics provided by the International Technical Committee for the Prevention and Extinction of Fire (CITF) and based on the reports of firefighting organizations, 2.5 to 4.5 million fires and 17 to 62 thousand direct deaths occur annually in 57 large countries. The highest number of urban fires is related to the United States (USA) with six hundred thousand to one million and five hundred thousand incidents in a year. 21 The highest number of deaths due to urban fire has also occurred in the three countries of India, Pakistan, and Russia with 10 to 25 thousand deaths during a year. 21 In recent years, due to the increase in population density in residential houses, offices, and commercial environments in KSA, the occurrence of fires has rapidly spread and has also spread to neighboring areas. 22
In a study, the accidents due to fire and explosion in maritime transportation were reviewed and analyzed. This analysis was done in the period 1991–2015. Based on the results, fire and explosion during the time had a fluctuating trend but the number of fatalities decreased during the period, 23 which is consistent with the results of the present study. It can be due to preventative or mitigation measures performed by different organizations such as the fire department. In KSA, fire and rescue teams are well-trained and the system is equipped with new technologies developed for fire prevention. 24 Also, another reason could be because of improvement in the health system in KSA. In recent years, the health system in KSA has hired professional medical personnel and high-tech equipment for hospitals. 25
The findings revealed that forecasting was reasonable for injuries per 100,000 persons and deaths per 100,000 persons and good for accidents per 100,000 persons, injuries per 1000 accidents, and deaths per 1000 accidents. Therefore, it may be concluded that the proposed model would be well-fitted to forecast the studied parameters. Therefore, it may be concluded that the proposed model would be well-fitted to forecast the studied parameters. So, the ARIMA technique has robust performance and high accuracy for forecasting fire accidents and consequences.
As a limitation, data on other consequences due to fire accidents and other information related to these accidents were not available. Moreover, the statistics were not separately available for occupational and non-occupational types in the use database. Also, it must be noted that ARIMA has very good accuracy for short-term forecasting, whereas for long-term forecasting the accuracy of forecasting is not good.
Conclusions
This paper analyzes the data of fire accidents and physical consequences from 2002 to 2021, applies the ARIMA algorithm to produce a forecast model, and then utilizes the data of these years for correction and analysis. In the end, the prediction for the studied parameters is performed until 2026. Based on the results, forecasted values of injuries per 100,000 persons and accidents per 100,000 persons due to fire in KSA had increasing trends, and forecasted values of deaths per 100,000 persons, injuries per 1000 accidents, and deaths per 1000 accidents had decreasing trends. Based on the findings, the ARIMA technique has robust performance and high accuracy for forecasting fire accidents and physical consequences. It is suggested that these analyses are separately performed for occupational and non-occupational types in the next studies.
Footnotes
Acknowledgements
Researchers need to thank all persons who have helped to perform this study.
Ethical approval
Not applicable.
Informed consent
Not applicable.
Funding
The author received no financial support for the research, authorship, and/or publication of this article.
Declaration of conflicting interests
The author declared no potential conflicts of interest with respect to the research, authorship, and/or publication of this article.