
Abstract
Background
As technology develops rapidly and complex systems become more widespread, the study of mental workload (MWL) for monitors has become increasingly important.
Objective
To explore the signaling features of functional near-infrared spectroscopy (fNIRS) in different MWL states.
Methods
Twenty participants performed the N-back task and fNIRS data were collected to measure changes in blood oxygenation levels in the prefrontal cortex. Additionally, performance metrics and NASA Task Load Index (NASA-TLX) questionnaire results were recorded.
Results
NASA-TLX scores increased progressively from 0-back (M = 8.750) to 1-back (M = 34.792), 2-back (M = 52.292), and 3-back (M = 75.625). Significant differences were observed in oxygenated hemoglobin (HbO) concentrations (F3, 57 = 10.557, p < 0.001) across these tasks. HbO increased from 0-back (M = -0.008) to 1-back (M = -0.002) and 2-back (M = -0.001), but decreased to 3-back (M = -0.002). Channels CH16, CH17, and CH18, located in the left dorsolateral prefrontal cortex (DLPFC), were significantly activated in the 1-back, 2-back, and 3-back conditions. CH1 and CH2, which are located in the right DLPFC, showed significant activation in both the 2-back and 3-back tasks.
Conclusions
Our results showed that different levels of the N-back tasks triggered different MWL states. Significant differences in HbO concentrations and activated channels were observed across tasks with varying MWLs. HbO followed an “inverted U” pattern, increasing as the MWL shifted from underload to normal, and subsequently decreasing as it reached overload. Additionally, the left DLPFC was activated earlier than the right DLPFC, with the latter gradually engaging as the MWL increased. This study provides valuable insights into the assessment of MWL states.
Keywords
Introduction
With the rapid development and widespread application of computers, automation, and artificial intelligence technologies, the level of automation in human-machine systems has increased significantly. The division of labor between humans and machines has consequently changed substantially compared to the past, with human activities shifting from physical to mental labor. 1 This transformation is particularly evident in complex operational environments, such as nuclear power 2 and aviation, 3 in which the primary role of human operators, often referred to as monitors in these contexts, is to monitor automated systems and make critical decisions when necessary. To achieve these tasks, monitors must process instrument data and information, combine them with the surrounding environment to allow for comprehensive analysis, and quickly make accurate decisions. The human brain is required to allocate cognitive resources during these tasks; as such, the mental workload (MWL) of monitors is receiving increasing attention.
MWL, as opposed to physical workload, reflects the degree to which cognitive resources are allocated during a tasks. 4 MWL can encounter two types of issues: underload and overload. Underloaded MWL can lead to boredom, drowsiness, and reduced attention, resulting in a lack of monitoring and loss of control of the situation. 5 However, if the MWL becomes overloaded, it can trigger higher stress levels, increased error rates, and even accidents. 6 To summarize, improper MWL states can exert serious negative consequences. As such, assessing and managing MWL to maintain it within an appropriate range not only helps preserve situational awareness and task performance, but also enhances safety and user experience.
Generally, there are three methods for assessing MWL: task performance, subjective, and physiological measurement. 7 Physiological measurements offer several advantages compared to the other two methods: they avoid recall bias, do not interfere with the primary task, and allow for real-time and continuous monitoring of MWL fluctuations during task execution.8,9 Following advancements in sensor technology, an increasing number of physiological measurement methods of MWL detection have been developed, including electrocardiography, eye tracking, respiration measurement, skin conductance, electroencephalography, and functional near-infrared spectroscopy (fNIRS). 9 Among these, fNIRS has been proven to offer many advantages, including improved safety, portability, non-invasiveness, minimal interference with tasks, strong spatial resolution, and wireless measurement. 10 The theoretical basis of fNIRS is that the neural activity in the brain regions responsible for task execution intensifies when performing tasks with increased MWL, leading to changes in blood oxygen metabolism. Further, levels of oxygenated hemoglobin (HbO) increase, while deoxygenated hemoglobin (HbR) levels decrease, thereby altering the absorption of near-infrared light by the tissue. Through monitoring these changes in the brain, fNIRS can assess neuronal activity and infer MWL levels. 11
In recent years, a substantial body of research has utilized fNIRS to study MWL under various scenarios. For example, Midha et al. (2021) demonstrated the sensitivity of fNIRS in measuring changes in MWL during reading tasks, showing significant differences in left prefrontal cortex (PFC) activation under different reading conditions. 12 Geissler et al. (2021) used fNIRS to examine MWL during simulated driving, finding that activation of the PFC activation increased with MWL, and identifying the rostral part of the right middle frontal gyrus as a potential hub of MWL-related activity. 13 Further, Hamann and Carstengerdes (2022) conducted a simulated flight experiment, the results of which revealed that higher task difficulty induced greater PFC activity and reduced frontal HbR concentrations. 14 However, existing studies have not specifically defined the different MWL states, such as overload, normal load, and underload, nor did they explore blood oxygenation levels in the PFC under these states. Consequently, it is difficult to use these findings to determine which fNIRS signal features may indicate adverse MWL states requiring intervention. The present study therefore addresses this gap in the literature.
Methodology
Participants
This study was approved by the Institutional Review Board of our University. Twenty college students, comprising ten males and ten females ranging in age from 20 to 26 years (M = 24.3, SD = 2.7), were recruited as participants.
Experimental design
The N-back task, a commonly used experimental paradigm in cognitive neuroscience, 15 was applied to induce different levels of MWL. In the N-back task, participants were required to continuously remember the last n stimuli (e.g., letters, numbers, or images) from a rapidly presented series, and to thereby determine whether the current stimulus matched that from n steps prior (Figure 1). The N-back and monitoring tasks were similar in at least two aspects: First, as in practical scenarios, monitors must maintain prolonged focus, while the N-back task requires participants to continuously track a series of stimuli, demanding sustained attention. 16 Second, monitors must remember a large amount of information, such as different screen regions and event sequences, whereas the N-back task requires participants to remember the prior n stimuli. 17
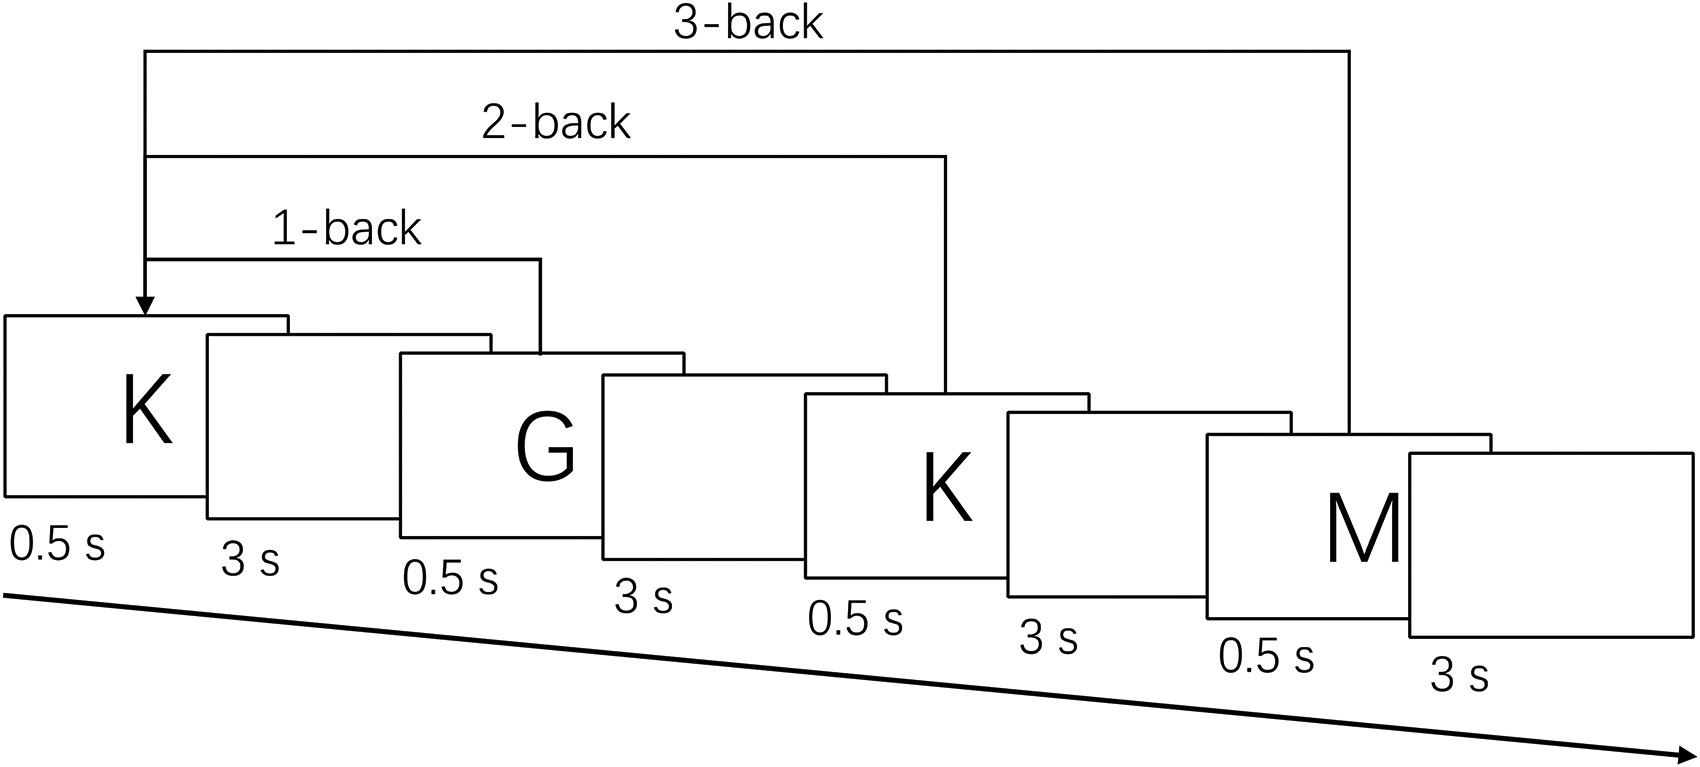
Schematic overview of the N-back task.
A within-subjects experimental design was employed, with the independent variable being the number of letters the participants needed to recall, set to four levels: 0-, 1-, 2-, and 3-back. The dependent variables in this study included three aspects: (1) performance, measured as the mean reaction time (RT) and accuracy (ACC); (2) Subjective MWL, assessed using the NASA Task Load Index (NASA-TLX) scale 18 ; (3) fNIRS signals, primarily focusing on HbO and HbR concentrations, as well as the activated channels.
Apparatus and materials
fNIRS signals were recorded using the NirSmart system, which utilized two wavelengths, 765 nm and 856 nm, to continuously record hemodynamic data from the PFC at a sampling frequency of 11 Hz. Seven light-emitting sensors and seven light receivers were attached to the forehead with distances of 3.5 cm between each sensor and receiver, thereby forming an 18-channel fNIRS signal layout, as outlined in Figure 2.
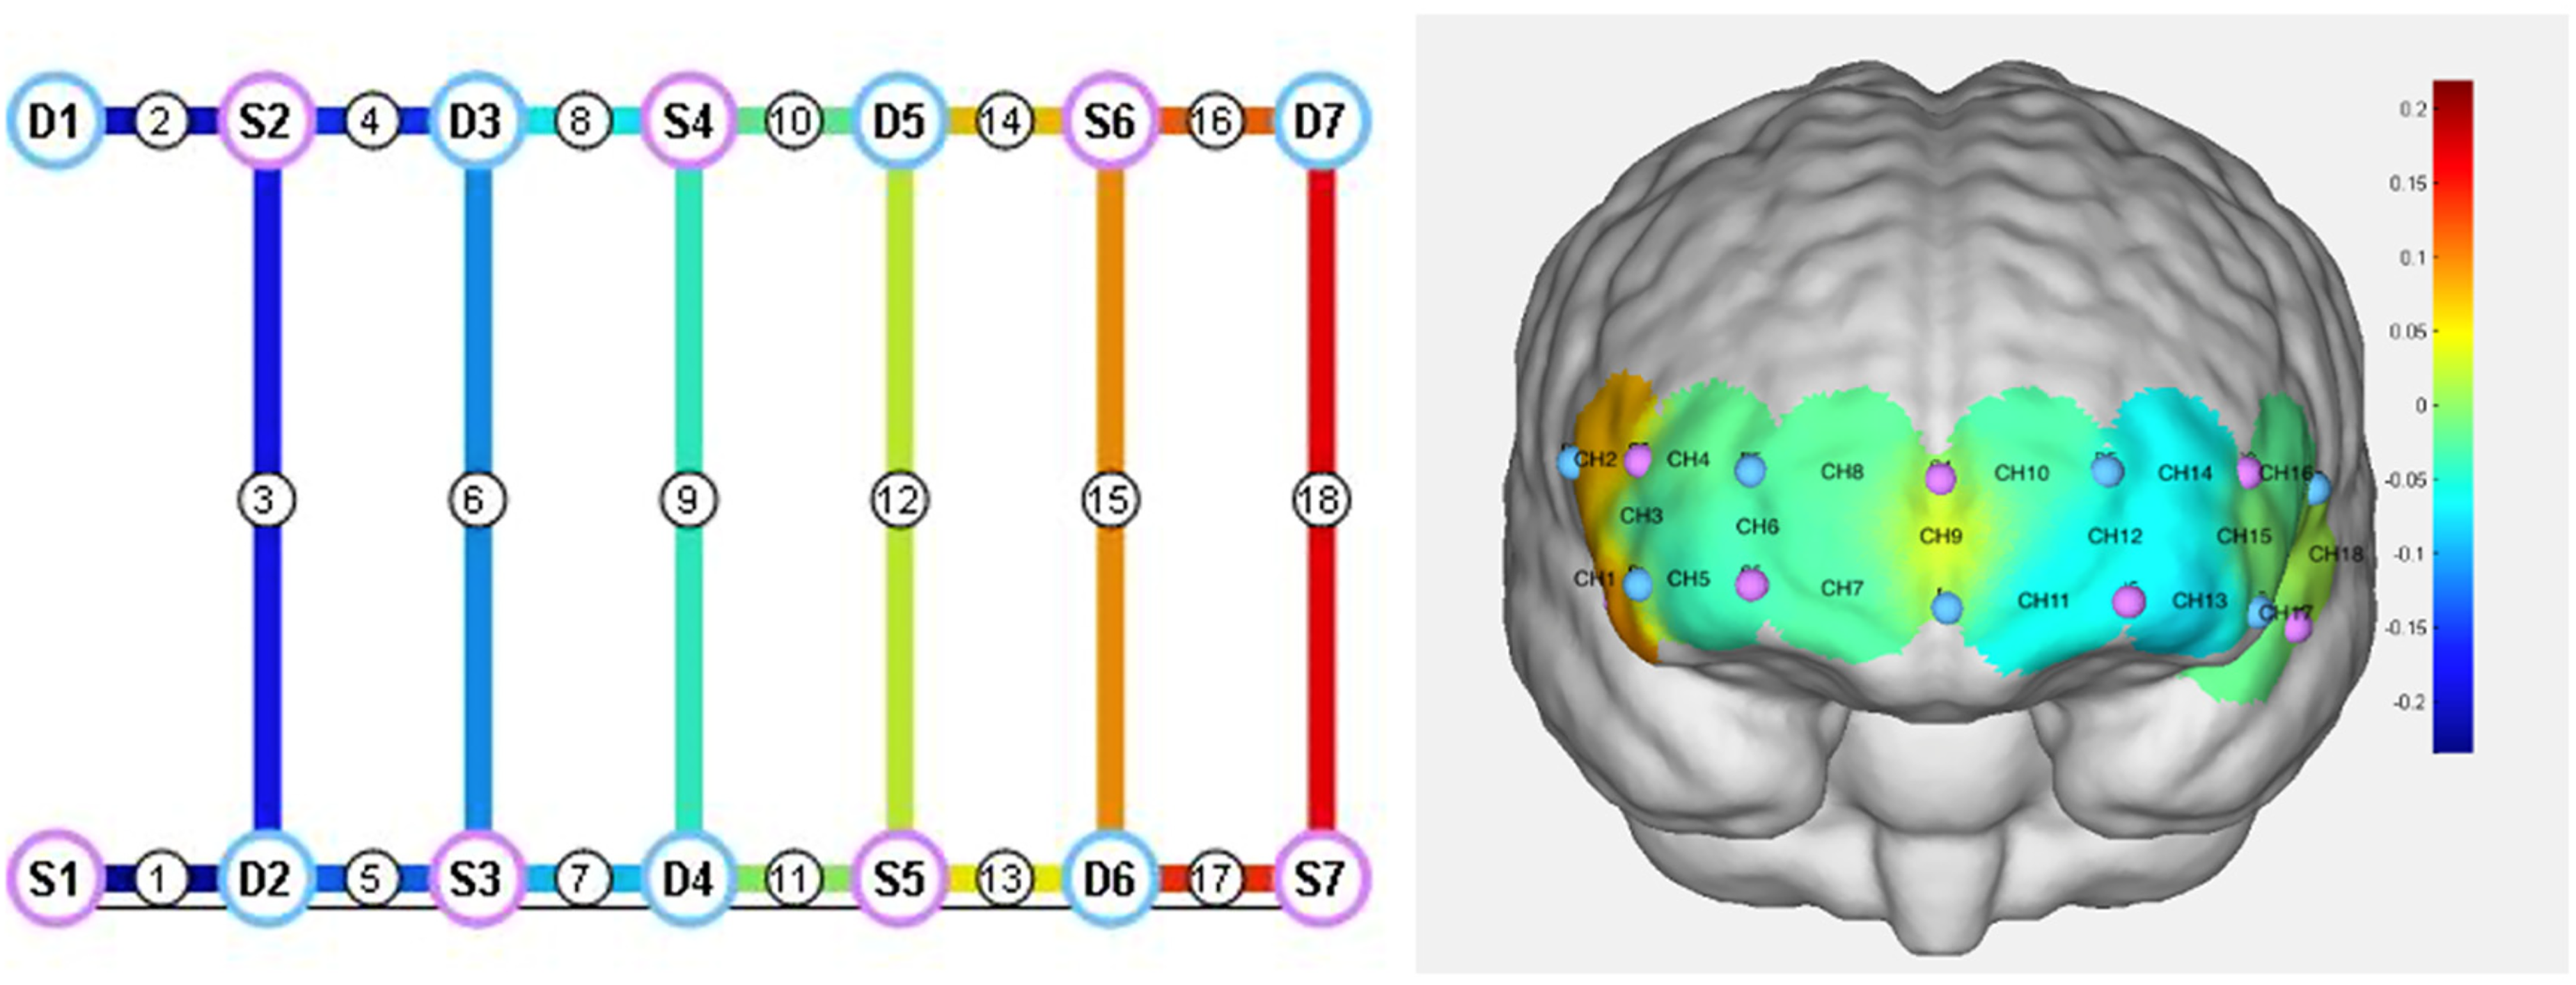
Measurement and locations of the 18 channels.
The N-back experimental platform used in this study was programmed in Java (Figure 3), while the RT and ACC data were automatically calculated using the program. Participants were required to press the left arrow key on the keyboard when the current letter matched the one presented n rounds earlier, and to press the right arrow key when they did not match. The experiment was conducted on a ThinkPad X1 laptop, equipped with a 14-inch screen with a resolution of 2240 × 1400.

The interface of the N-back task.
Experimental procedure
Each participant provided informed consent prior to initiation of the experiment, and were asked to learn the rules of the N-back task and complete a practice trial. Before the formal experiment began, the experimenter assisted the participants in positioning the fNIRS headgear, after which they rested for 3 min to establish a baseline measurement. Each trial was initiated with a 5-s instruction, notifying the participants of the upcoming task (i.e., 0-, 1-, 2-, or 3-back). The letters were subsequently presented every 3.5 s, with each letter displayed for 0.5 s, followed by 3 s on a blank screen (Figure 1). Twenty-two letters were presented in each trial, which had a total duration of 82 s. After each trial, participants filled out the NASA-TLX questionnaire. Upon completion, a cross was displayed on the screen for 60 s to allow the participants to relax before moving on to the next trial. Each participant completed four trials and the experimental order for the different conditions was assessed using a Latin square.
Data analysis
The fNIRS data underwent preprocessing to ensure the accuracy of the analysis. A band-pass filter with a frequency range of 0.01–0.20 Hz was applied to eliminate high-frequency noise, baseline drift, and physiological interference. The modified Beer-Lambert law was also applied to convert the light intensity signals from the two wavelengths in each channel into signals that reflect the concentrations of HbO and HbR. Data were normalized to the baseline data.
Then, statistical analysis was performed using SPSS software. Means and standard deviations were calculated to present the descriptive statistics for RT, ACC, NASA-TLX scores, and HbO and HbR concentrations. Repeated-measures analysis of variance (ANOVAs) were conducted to examine the effect of different N-back task levels on the dependent variables. T-tests were used to analyze whether the HbO concentrations in different channels significantly differed from baseline across task levels. Statistical significance was set at p < 0.05.
Results
Performance
Figure 4 shows the results of the task performance in the N-back task. ANOVA revealed a significant effect of N-back task levels on both RT (F3, 57 = 33.545, p < 0.001) and ACC (F3, 57 = 4.479, p = 0.009). As the difficulty of the N-back task increased, RT increased, with values for the 0- to 3-back conditions calculated as 0.363, 0.481, 1.077, and 1.213, respectively (Figure 4(a)). At the same time, ACC decreased, with corresponding values of 0.982, 0.948, 0.925, and 0.863, respectively (Figure 4(b)). These data indicate that the different N-back tasks elicited different levels of MWL.
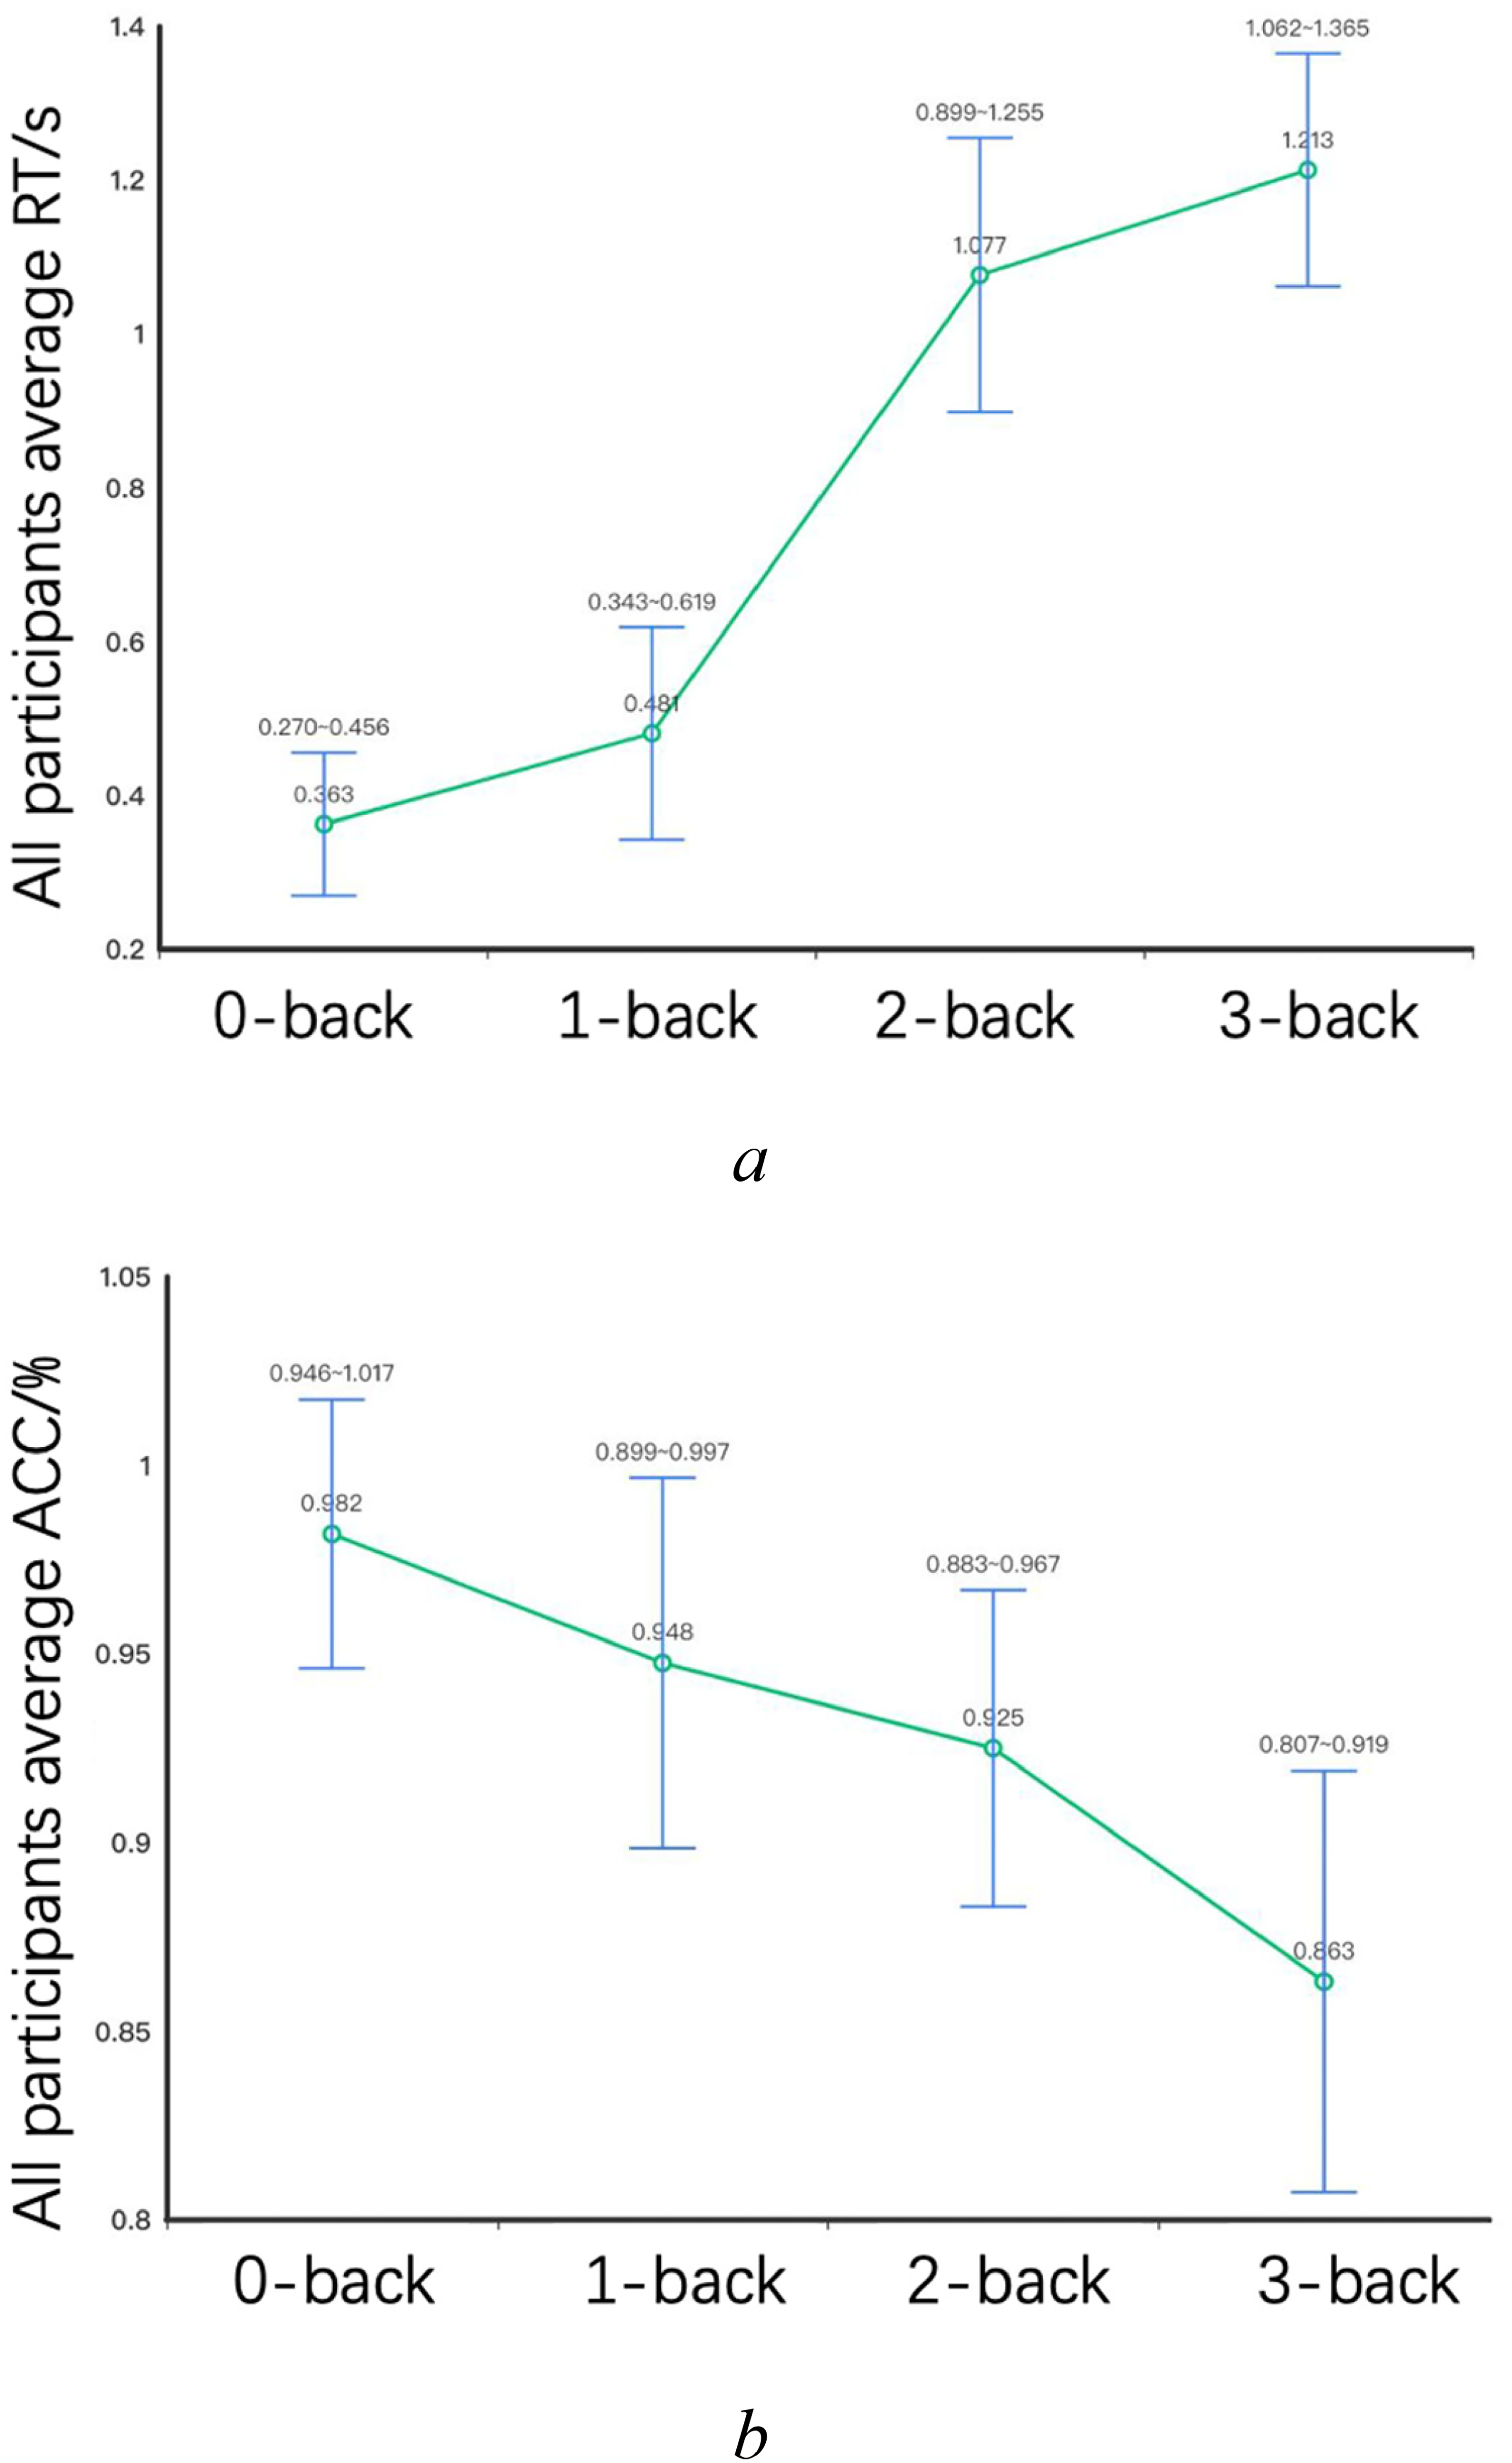
Average RT (a) and ACC (b) of the participants in the different N-back tasks.
Subjective MWL
Figure 5 shows the subjective MWL measured by the NASA-TLX for different N-back conditions. The ANOVA results indicated a significant effect of the N-back level on subjective MWL (F3, 57 = 21.125, p < 0.001), which increased progressively from 0-back (M = 8.750, SD = 2.204) to 1-back (M = 34.792, SD = 7.988), 2-back (M = 52.292, SD = 8.881), and 3-back (M = 75.625, SD = 4.534).
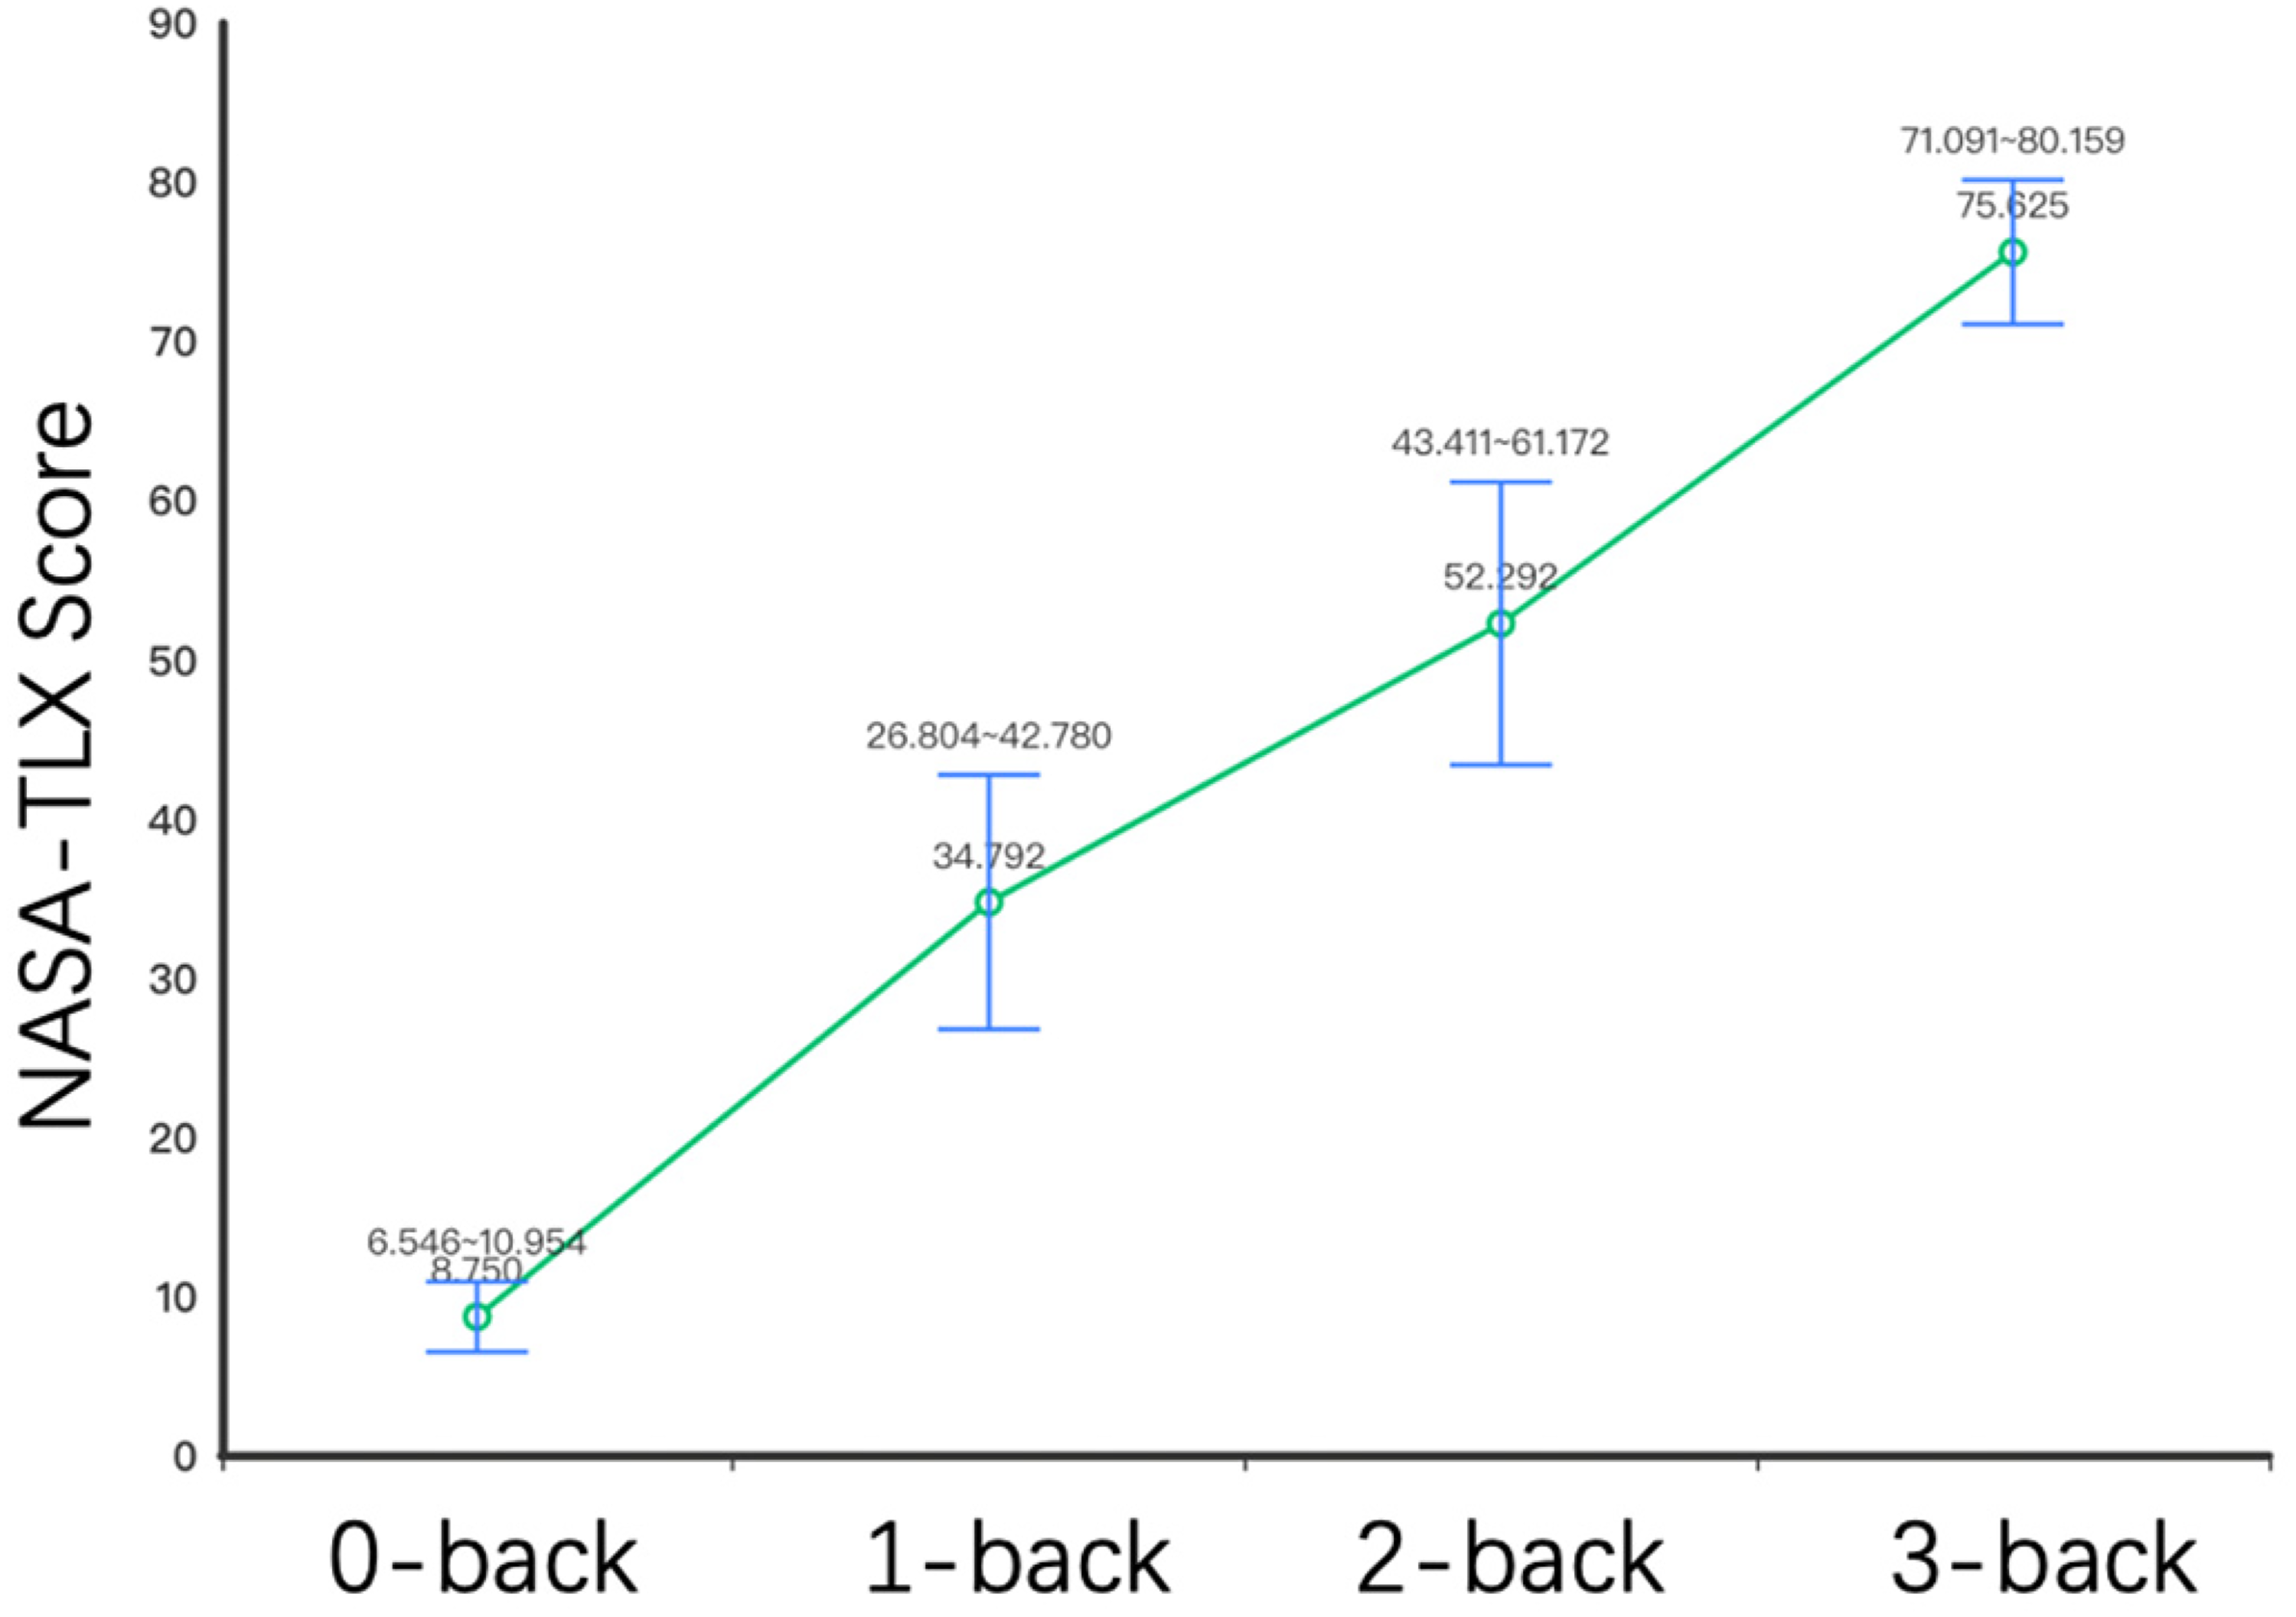
NASA-TLX scores for the different N-back tasks.
According to a prior study by Vu Thanh Nguyen, a NASA-TLX score below 10 for the 0-back task indicates an underload state, while a mean score above 75 for the 3-back task suggests an overload state. 19 In addition, the NASA-TLX scores for the 1-back and 2-back tasks fall between 25 and 75, indicating normal MWL, with the 1-back task representing lower MWL. 19
fNIRS signals
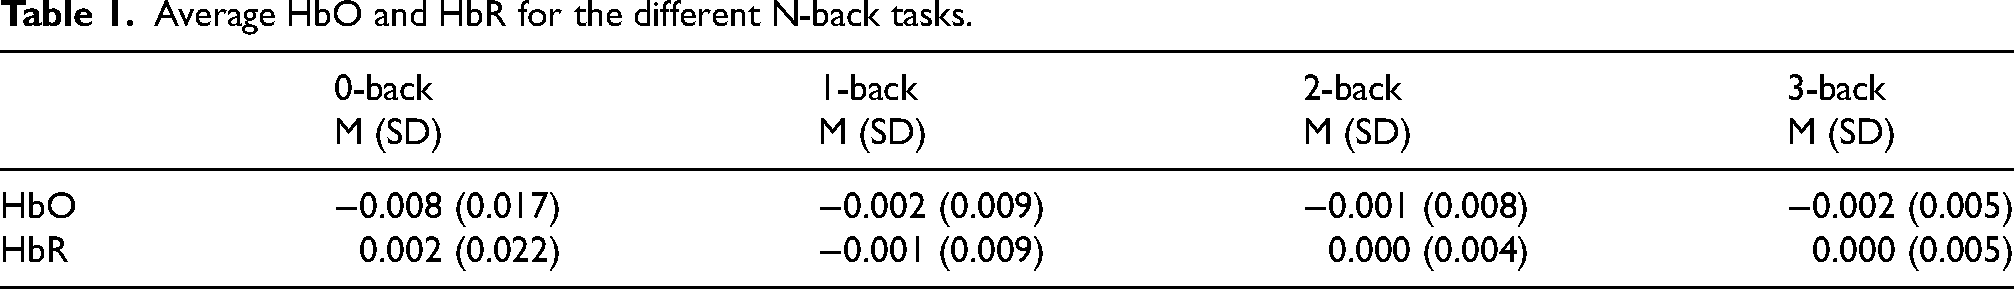
Table 1 shows the average HbO and HbR concentrations in all channels under different N-back conditions. The ANOVA results indicated a significant effect of N-back levels on HbO concentration (F3, 57 = 10.557, p < 0.001). As task difficulty increased, the HbO followed an “inverted U” pattern, initially rising from 0-back to 2-back, but decreasing from 2-back to 3-back. No significant effect of the N-back level on HbR concentration was found (F3, 57 = 1.277, p = 0.299).
Average HbO and HbR for the different N-back tasks.
The HbO and HbR concentration curves for each N-back condition and channel were visualized using the NIRspark software. In Figure 6, thicker black lines represent the average HbO and HbR concentrations across all 18 channels, whereas the thinner colored lines represent the HbO and HbR concentrations in each channel.
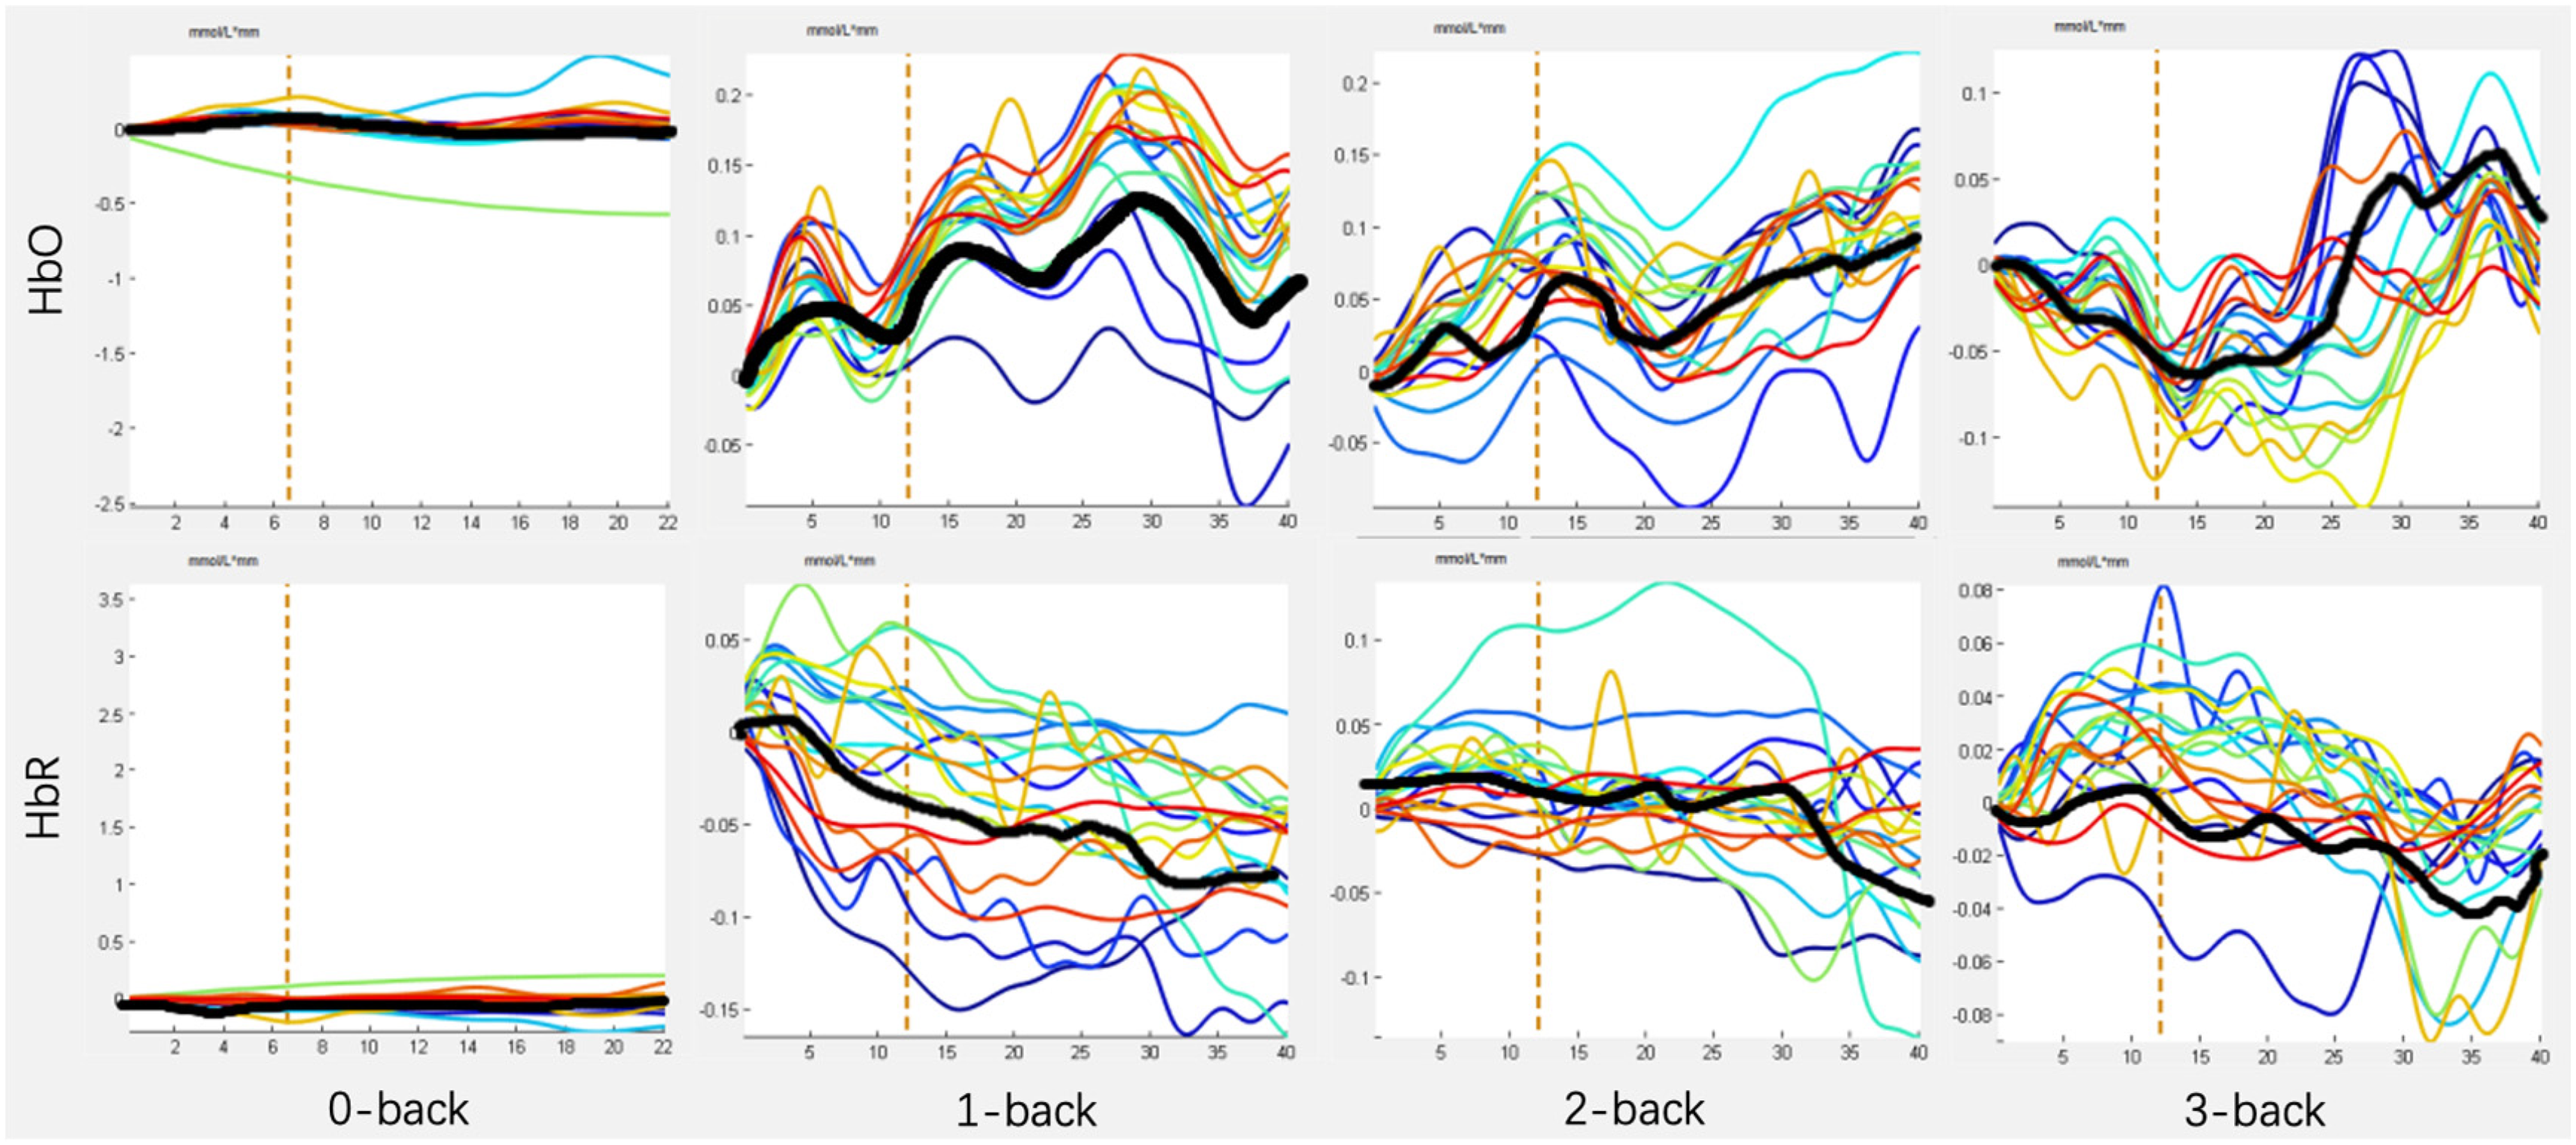
Hbo and HbR across the four N-back conditions.
The HbO results indicated no significant activity across channels in the 0-back condition. Notably, in the 1-back and 2-back conditions, most channels showed a substantial increase in HbO concentration compared with the 0-back condition. However, during the 3-back task, the average HbO concentration in most channels was lower than that at the corresponding time points during the 1-back and 2-back tasks. Additionally, in the 3-back task, HbO levels in most channels initially increased, peaked, and then declined subsequently.
HbR concentration showed no significant activity across channels in the 0-back condition. Under the other three conditions, the average HbR in some channels exhibited a downward trend over time.
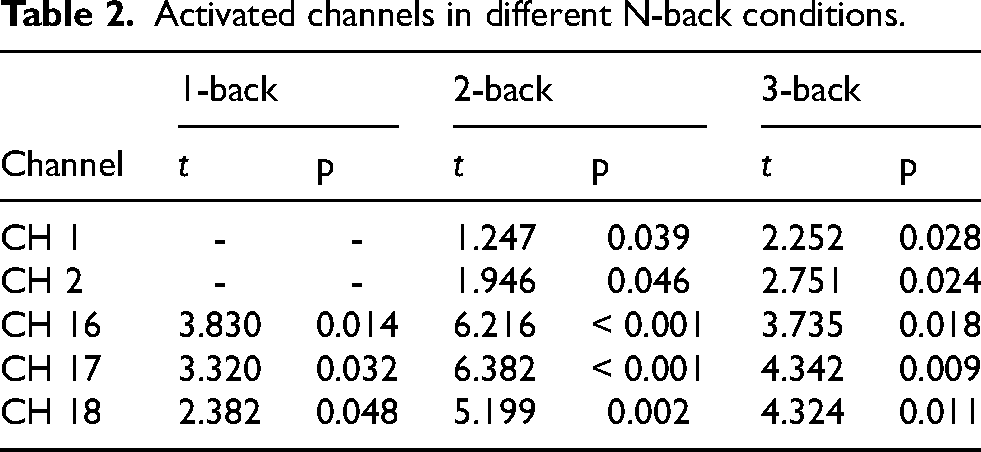
As there was minimal activity across channels in the 0-back condition, a t-test was conducted on HbO concentrations from the 18-channels under the 1-back to 3-back conditions to explore the activated brain regions. The results (Table 2) showed that under the 1-back to 3-back condition, CH16, CH17, and CH18, all located in the left hemisphere, were significantly activated. Additionally, in the 2- and 3-back conditions, CH1 and CH2, located in the right hemisphere, were significantly activated.
Activated channels in different N-back conditions.
Discussion
Overall, this study utilized the NASA-TLX scale to determine the MWL states corresponding to different N-back tasks: the 0-back task was associated with an underloaded MWL state; the 1-back and 2-back tasks were associated with a normal MWL state; and the 3-back task was associated with an overloaded MWL state. These findings are further supported by the performance data.
The fNIRS results indicated that the activity of the dorsolateral prefrontal cortex (DLPFC) activity followed an inverted U-shaped pattern. As the MWL increased from an underloaded level (i.e., 0-back) to a normal level (i.e., 1-back and 2-back), the HbO concentration increased, reflecting increased DLPFC activity. However, under the overload condition (i.e., 3-back task), the HbO concentration began to decrease, indicating reduced DLPFC activity. The DLPFC is a key anatomical region associated with the central executive system and plays a critical role in task monitoring and cognitive control. 20 During the early stages of increased MWL, HbO levels in the DLPFC increased, reflecting heightened brain activity to meet the cognitive demands of the task, and leading to increased oxygen consumption and blood flow. However, when the MWL exceeded the brain's compensatory capacity, HbO levels in the DLPFC declined, indicating that the brain's functional limits have been reached or exceeded.
Additionally, channels in the left DLPFC (CH16, CH17, and CH18) were activated earlier than those in the right DLPFC. As task difficulty increased, channels in the right DLPFC (CH1 and CH2) became significantly activated, possibly because the left hemisphere is the dominant hemisphere, as people tend to engage the left DLPFC first when processing tasks. However, when MWL reaches higher levels, the non-dominant hemisphere (i.e., the right side) can be recruited as a compensatory resource. 21
This study further revealed differences in oxygenation response patterns and channel activation levels in the DLPFC under varying MWL conditions, particularly in the overloaded state, thus providing valuable insights for future efforts to assess MWL using fNIRS, which could help to enable timely interventions and strategies to enhance work efficiency and ensure operational safety. Further, these results contribute to a deeper understanding of the activation characteristics of different brain regions under various MWL conditions.
However, this study has several limitations. First, it lacked further exploration and explanation of the temporal characteristics of DLPFC activation, which could provide valuable insights into the dynamic processes of brain activity. Future research should focus on analyzing the time-based relationship of DLPFC activation to better understand these dynamics. Additionally, while the N-back task is a widely used cognitive paradigm and shares some similarities with monitoring tasks, it may not fully represent the broader range of real-world tasks that involve complex attention management and decision-making. Therefore, the conclusions of this study should be generalized with caution. Future research should explore the cognitive processes and neural mechanisms in real-world monitoring contexts (e.g., nuclear power or aviation) to identify fNIRS features that are more applicable in practical settings. Finally, the participants in this study were students aged 20–26, a relatively narrow demographic whose cognitive abilities may not be representative of the general population. To enhance the generalizability of the findings, future studies should include participants from a broader range of ages and occupations.
Conclusion
The findings of the present study revealed that different N-back task levels elicited varying MWL states. Significant differences were observed in HbO concentrations and activated channels across tasks with varying MWL states. HbO further exhibited an “inverted U” pattern, increasing as MWL shifted from underload to normal, and decreasing as MWL reached overload. Moreover, the left DLPFC was activated earlier than the right DLPFC, reflecting hemispheric dominance. Finally, as the MWL increased, the right DLPFC gradually became activated. Overall, this study confirmed the utility of fNIRS to assess the MWL state in monitors.
Footnotes
Acknowledgements
We thank the associate editor and the reviewers for their useful feedback that improved this paper.
Ethical approval
This study was approved by the Institutional Review Board of Tsinghua University and complied with all relevant ethical regulations.
Informed consent
Informed consent was obtained from all participants involved in this study.
Funding
This work was supported by the Foundation of National Key Laboratory of Human Factors Engineering (Grant No. HFNKL2023J09) and the National Natural Science Foundation of China (Grant No. 72171134).
Declaration of conflicting interests
The authors declared no potential conflicts of interest with respect to the research, authorship, and/or publication of this article.