
Abstract
Background
The COVID-19 pandemic has affected schooling since university professors must switch to online and remote learning. Working from home requires adaptation to new noise, temperature, and lighting conditions, and those factors affect the instructors’ job effectiveness.
Objective
To examine and measure how noise, temperature and lighting conditions affect a professor's job effectiveness during the COVID-19 pandemic.
Methods
A questionnaire was first developed to obtain information to test the hypotheses, including the hypothesized model variables: Noise, temperature, lighting (independent variables), and performance (dependent variable). The independent variables contained three items each, while the dependent variable contained eight items, evaluated with a five-point Likert-type scale. Subsequently, the online questionnaires were sent to Latin American university professors, Excel® automatically recorded the data, and SPSS 25® software was used for the analysis. A structural equation model was created, and WarpPLS 8.0 software and data from 257 responders were used to test the hypotheses.
Results
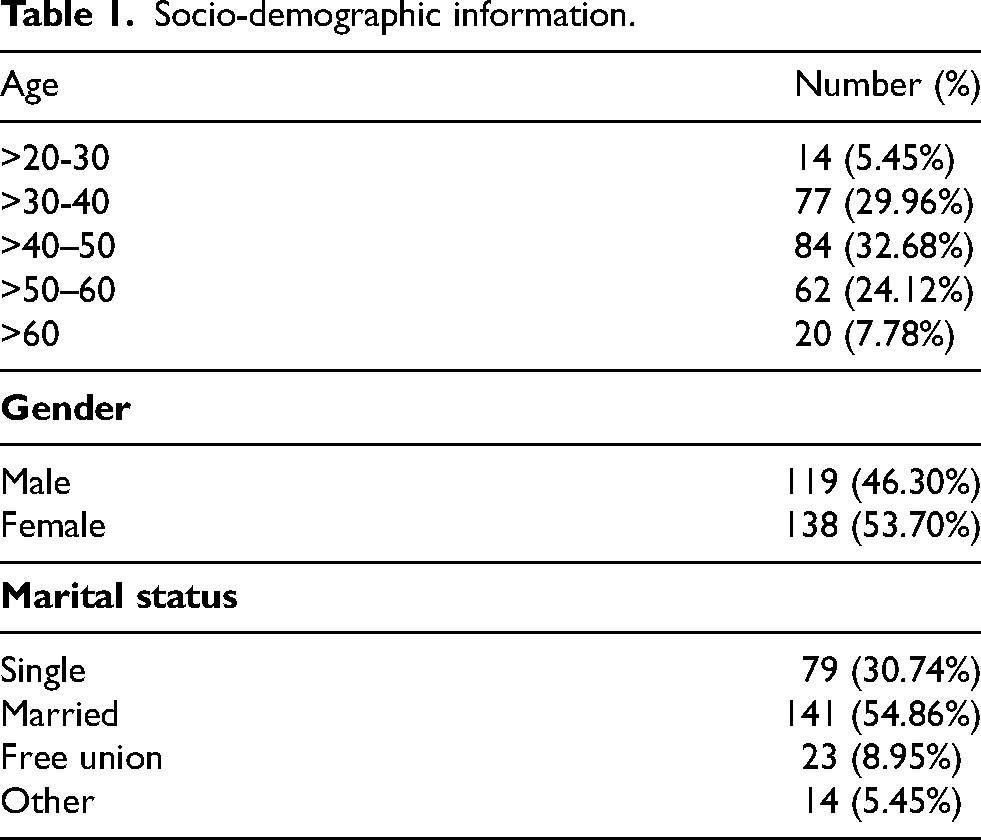
119 (46.30%) of surveyed teachers were male, and 138 (53.70%) were female. Most of them (32.68%) were 40–50 years old, while the minority (5.45%) were between 20–30 years of age. Regarding the effects on performance, Noise had an effect of 0.22, Temperature one of 0.20, and Lighting one of 0.21. These variables explained 29% of the variance in teachers’ performance.
Conclusions
Noise, lighting and temperature directly and positively affect teachers’ performance, such as class quality, student learning and growth, and society's sustainability.
Introduction
The COVID-19 epidemic has affected many sectors of society, including education, presenting sustainability difficulties. As the epidemic drove schools to shut down and employ remote learning, the viability of the education system was tested. 1 The school system in Latin America (LA) faced issues during the COVID-19 epidemic due to social, environmental, and economic sustainability. 1 In LA education during the COVID-19 pandemic, human resource elements were key to achieving social sustainability (SOS) and prioritizing educator well-being and mental health 2 because teachers have been affected by the quick move to online schooling.
This abrupt transition from traditional classroom teaching to remote online instruction has presented numerous challenges for university teachers (UT), such as adapting to new factors, including technological tools and platforms, managing virtual classrooms, finding effective ways to engage students through online means, and adapting to environmental factors while working from home. 3 Furthermore, increased workload and additional responsibilities associated with online teaching can lead to stress, anxiety, overwhelming feelings, burnout, and fatigue among UT. 4 Adjusting to this new teaching context requires significant effort and resources from UT, resulting in physical health implications.
Effects of online teaching on professors
Prolonged hours spent in front of computer screens and lack of physical activity can lead to musculoskeletal issues, eye strain, and fatigue, 5 and the social and emotional impact of the pandemic itself cannot be ignored. Many UTs deal with personal and family stressors associated with the pandemic, such as concerns about health, financial instability, and caregiving responsibilities, 6 all of which can contribute to anxiety, depression, and decreased well-being.
Job performance (JP) is an important indicator of SOS. 7 The ability of individuals to engage in meaningful and fulfilling activities necessary for daily life, such as work, education, and leisure, plays a crucial role in their overall well-being. 8 JP can indicate SOS because it reflects how individuals participate in and engage with their communities. JP encompasses work conditions, education, and overall quality of life.
The COVID-19 pandemic has dramatically damaged the performance and quality of LA university instructors. 9 Studies have found excessive stress, burnout, and psychological discomfort among university professors due to the COVID-19 pandemic. Moreover, many UT have reported feeling overwhelmed and exhausted, which can negatively impact their ability to perform their duties effectively. 10 LA university lecturers have faced environmental concerns during the COVID-19 epidemic, in addition to online instruction and workload. The COVID-19 pandemic has caused LA colleges to switch to online instruction, affecting instructors’ physical workspace. Studies have shown that the environmental factors affecting UT during this pandemic have both physical and mental health. Some authors have mentioned that the home environment could also impact teachers’ performance during the pandemic. 11 The distractions caused by environmental factors can make it difficult for teachers to focus on their teaching responsibilities and may lead to decreased effectiveness and job satisfaction. Consequently, teachers may feel frustrated and discouraged, decreasing their motivation and performance.
Research problem and objective
Maintaining employees’ health and productivity is part of human resource sustainability for companies, and teacher and university sustainability has been threatened by the COVID-19 pandemic. 12 Thus, ergonomic examination of university instructors’ working circumstances is required to enhance SOS and performance by providing better education to students and preventing discomfort in professors. Based on this backdrop, contextual variables may have influenced LA university professors’ online teaching ability during the COVID-19 pandemic. No study has examined how noise, temperature, and lighting affected online instructors’ performance during the COVID-19 pandemic.
This study examines the relationship between noise, temperature, and lighting in LA University instructors’ performance during the COVID-19 epidemic. The study seeks to quantify the relationships through quantitative analysis, seeking to identify the critical factors that alter online professors’ physical and mental well-being to generate positive, pleasant and effective learning environments. However, even though the COVID-19 contingency has ended, it is still possible to learn from teachers’ experiences to generate prevention strategies that guarantee teachers’ physical and mental well-being and to know what actions to take in case of another similar contingency.
After this introduction, Section 2 reports a literature review regarding the relationships between noise, lighting and temperature in teacher performance and proposes the hypotheses. Section 3 presents the methodology to test the hypotheses, Section 4 presents the research results, and Section 5 presents the conclusions and recommendations.
Literature review and hypotheses formulation
Effects of noise on the performance of UT
Noise exerts two primary impacts: auditory and non-auditory effects. The non-auditory effects, including physiological, cognitive, and psychological impacts of noise, manifest at low sound pressure levels (SPLs) and are particularly significant for occupations with high mental demands, such as educators, drivers, medical professionals, and bankers. 13
The impact of noise pollution on human resource sustainability is a critical concern. As discussed in various studies, noise pollution harms individuals’ physical and psychological health, 14 and its effects can severely affect human resources regarding productivity, well-being, and sustainability. Noise pollution can directly affect the physical and psychological well-being of individuals in the workplace. 15 For instance, the World Health Organization (WHO) highlights that noise pollution can lead to hearing impairment, sleep disturbance, and interference with communication, and has been linked to cardiovascular and physiological effects, psychological impairment, interference with social behavior, and lower performance at work and school. 16 All of these can result in decreased productivity, increased employee absenteeism, and communication and sleep disorders.
In the case of UT, noise pollution is a pervasive environmental factor that can significantly impact performance, well-being, harm concentration, cognitive processing, and overall job satisfaction. 17 Research has indicated that prolonged noise exposure can lead to reduced focus, increased stress levels, fatigue, and decreased information retention, further diminishing teachers’ performance. 18 Excessive noise can harm teachers’ ability to effectively teach and communicate with their students. This noise can come from various sources such as background in the home environment, technical issues with online platforms, distractions from other family members or pets, disrupting concentration and impairing the ability to deliver lessons effectively, reducing concentration and focus, causing teachers to struggle with delivering lessons, and providing individualized attention to students. 19
Similarly, the COVID-19 pandemic has influenced noise levels in university professors’ working environments while teaching online because they are more sensitive to distractions and interruptions from background noise in their homes or other non-traditional teaching settings. 20 In conclusion, noise can come from their home environment, such as noise from roommates or family members, which can hinder their ability to effectively deliver online lessons. 21 Therefore, universities should address noise pollution to promote a sustainable workforce. Based on this background, hypothesis H1 is proposed.
Effects of temperature on the performance of UT
Temperature plays a crucial role in an individual's overall well-being and productivity, directly affecting their physical and mental health and performance. 22 Extreme temperatures can harm an individual's health and ability to perform their work effectively, and can lead to dehydration, fatigue, and reduced cognitive function, affecting an individual's ability to function optimally in their work or educational environments. 23 Furthermore, extreme heat events can result in decreased productivity and diminished functioning among individuals, making it more challenging for them to perform their duties effectively.
The COVID-19 pandemic has exacerbated the impact of temperature on the sustainability of human resources, particularly in the education sector in LA. 9 Educators may have difficulty delivering excellent instructions remotely at extreme temperatures, emphasizing the necessity for effective policies and interventions to reduce their impact on human resource sustainability. 24 The effects of temperature on UT performance are significant and multifaceted, impacting various aspects of students’ professional capabilities and overall classroom effectiveness. Studies have shown that temperature can significantly affect cognitive performance, comfort, and overall wellbeing. Moreover, research has shown that extreme hot and cold temperatures can impair cognitive functions, including attention, memory, problem-solving abilities, and overall performance. 25 Additionally, high temperatures can lead to physical discomfort, fatigue, and reduced motivation, ultimately affecting the quality of instruction and student engagement. 26
Lack of control over temperature can negatively impact teachers’ ability to concentrate, leading to decreased job satisfaction and potentially lower quality of instruction. 27 Thus, the effects of temperature on UT performance can be significant, implying that when teachers are exposed, their ability to perform effectively in the classroom may be compromised. Additionally, temperature fluctuations can increase stress, discomfort, and distraction among teachers, further hindering their performance. 28 Teachers may struggle to concentrate when it is too hot or cold in the classroom, leading to difficulties in delivering engaging and practical lessons and effectively managing classroom interactions and student behavior. 28 In conclusion, extreme temperatures have significant implications for the sustainability of human resources, including their physical and mental well-being, productivity, and ability to perform effectively.
Based on this background, hypothesis H2 is proposed.
Effects of lighting on the performance of UT
The impact of lighting on human resource sustainability is multifaceted and should not be underestimated. Adequate lighting in the workplace has been proven to contribute to employees’ overall well-being and productivity and reduce their absenteeism. 29 Furthermore, the presence of natural light in an office has been shown to have several advantages, including improved employee happiness and well-being. 30 Moreover, the impact of lighting on the sustainability of human resources extends beyond productivity and well-being. 31 Research has shown that adequate lighting is crucial for creating a productive and comfortable workspace, and poor lighting can lead to eyestrain, fatigue, and difficulty concentrating, thereby decreasing productivity and job satisfaction. 32
Proper lighting in the workplace is critical for guaranteeing employee safety and wellness, because it improves employee visibility and minimizes the likelihood of accidents. On the other hand, inadequate lighting can increase the risk of employee accidents and fatigue, resulting in decreased productivity and increased absenteeism due to work-related injuries. 33 The shift to online teaching has meant that teachers have had to adapt to teaching from home or other nontraditional settings, and this change may not always provide the lighting conditions necessary for optimal performance. 34 Furthermore, inadequate lighting can negatively affect mental health and well-being, and switching from in-person to online teaching has increased stress levels for teachers as they transition to a new teaching format and prepare lectures differently. 35 The psychological issues experienced by university lecturers in Los Angeles during the COVID-19 pandemic may have been compounded by the impact of these shifts, paired with the possible impacts of inadequate lighting conditions. Lighting has a profound influence on human resource sustainability. 36 The psychological issues experienced by university lecturers in Los Angeles during the COVID-19 pandemic may have been compounded by the impact of these shifts, paired with the possible impacts of inadequate lighting conditions. Lighting has a profound influence on human resource sustainability. 36 Previous knowledge has led us to consider H3.
Figure 1 illustrates the causal model.
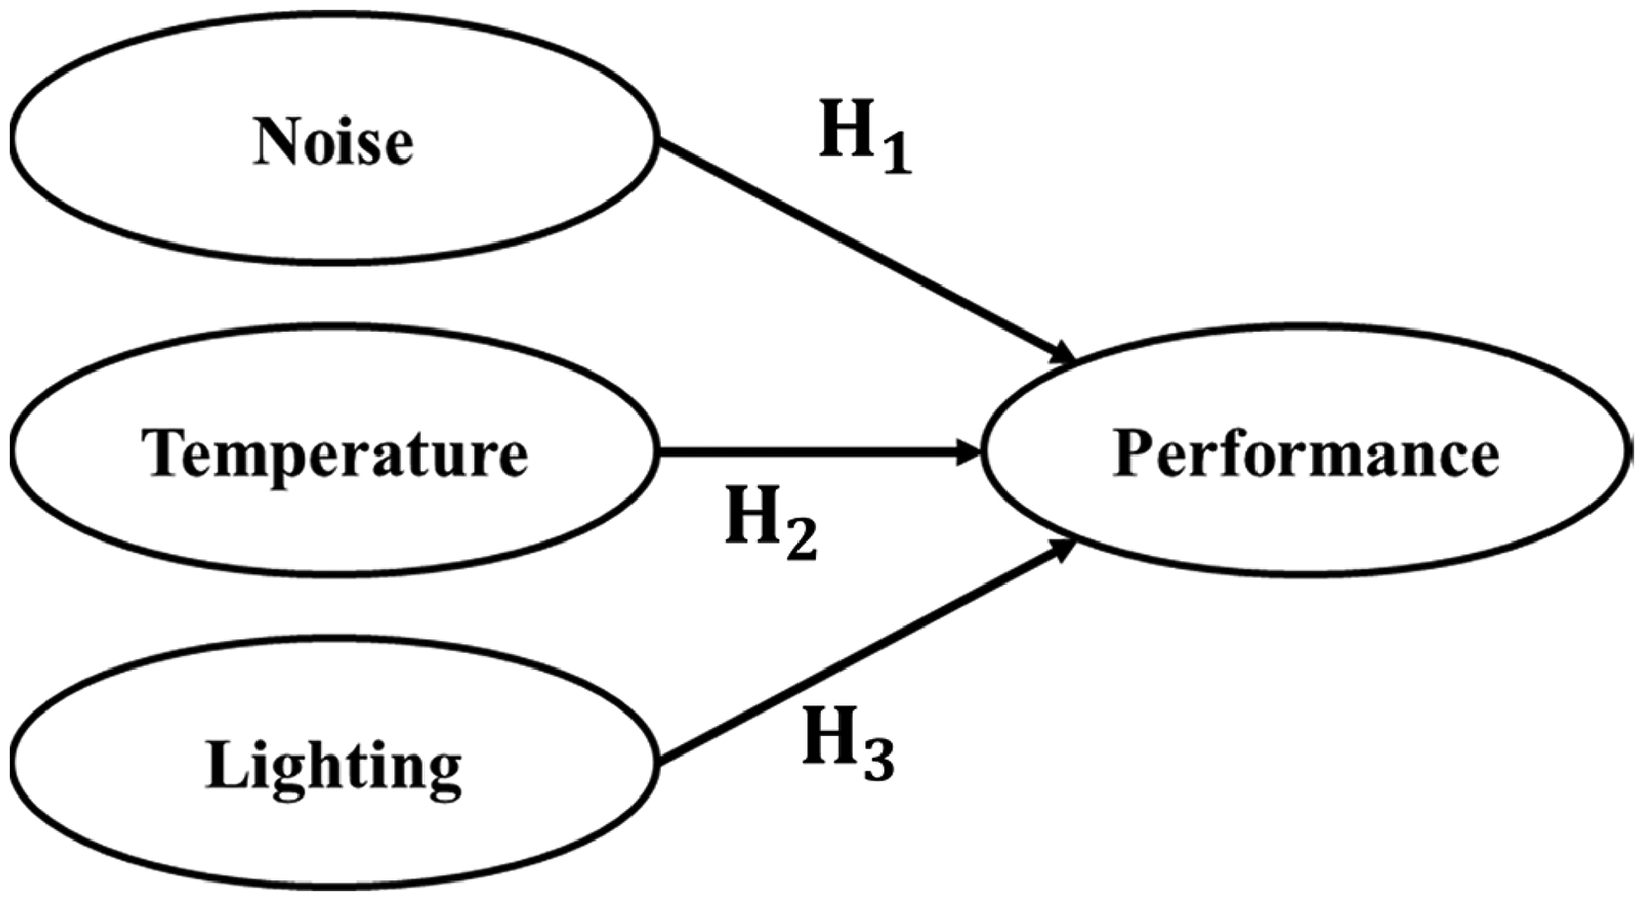
Hypothetical causal model.
Methods
This study used a cross-sectional survey design. The process is divided into four stages, as detailed below.
Stage 1: questionnaire development
The use of surveys to collect data on the impact of noise, temperature, and lighting on teacher performance is well known. Researchers have found questionnaires to be valuable tools for assessing and understanding how environmental factors impact teachers’ performance in educational settings. 37 One questionnaire used in previous studies is the “Questionnaire of Effects from Online Classes on University Students’ Health and Academic Performance”. 38 This questionnaire collects information about ambient elements, such as lighting, noise, and temperature, and allows researchers to gather valuable information on teachers’ subjective experiences and perceptions of these environmental factors.
Furthermore, the questionnaire provides a simple and fast evaluation of environmental factor qualities and has shown strong validity and reliability in measuring and assessing environmental factors. 39 Questionnaires are also important for researching risk perception and the impact of environmental factors on teachers’ performance. 40 Researchers can collect data on teachers’ perceptions of noise, annoyance, disturbance, listening difficulties, and speech comprehension.
These questionnaires demonstrated that teachers are sensitive judges of their noise settings and can identify the number and type of noise sources to which they are subjected. 41 Questionnaires are also the recommended instrument for measuring noise perception and its influence on teacher performance as well as for gathering reliable and anonymous data while guaranteeing that instructors feel at ease and deliver honest replies without fear of criticism or prejudice. 42 In conclusion, the literature emphasizes the significance of employing questionnaires to collect data on the impact of noise, temperature, and lighting on teachers’ performance.
We then created a questionnaire to assess the impact of online classes on the health and performance of university lecturers (QEOCT). The questionnaire was organized as follows: Introduction, demographic data, environmental factors, technical considerations, motivation, JP, mental workload, and the impact of online classes on university professors. As the primary goal of this study was to investigate the impact of environmental variables on the performance of university professors, only parts (3) and (6) were included. To construct the QEOCT, a literature analysis was conducted to discover prior studies on how independent factors (noise, temperature, and lighting) influence the dependent variable (university instructors’ JP). The review of the literature was conducted using databases and the most often used terms were “noise,” “temperature,” “lighting,” “academic performance,” “school,” and “university instructors.” An assessment of the literature is regarded as a reasonable justification for developing a questionnaire. 31
Before the application, the survey was validated using seven judges to understand all items by LA professors better. The judges have the following profiles: Possess experience in the manufacturing industry, hold a certification in Ergonomics, belong or have belonged to national and/or international Ergonomics organizations, have publications in journals and/or congresses, have at least 10 years of experience in the area of Ergonomics, have experience in Occupational Health, and preferable, have a postgraduate degree related to Ergonomics. Judges evaluated item relevance, semantics, content, clarity and comprehension, and cultural appropriateness.
Once the things have been chosen, they are adapted for use in an online classroom scenario, where professors conduct lessons outside the classrooms of educational institutions. The QEOCT used in this study appears as complementary material. For each of the variables analyzed, the items that comprise it, an acronym and the source from which it was extracted are illustrated. The final QEOCT was then entered into a Google form. Since it was introduced in recent studies, it must be responded to using a five-point Likert scale. 43
Stage 2: administration of the QEOCT
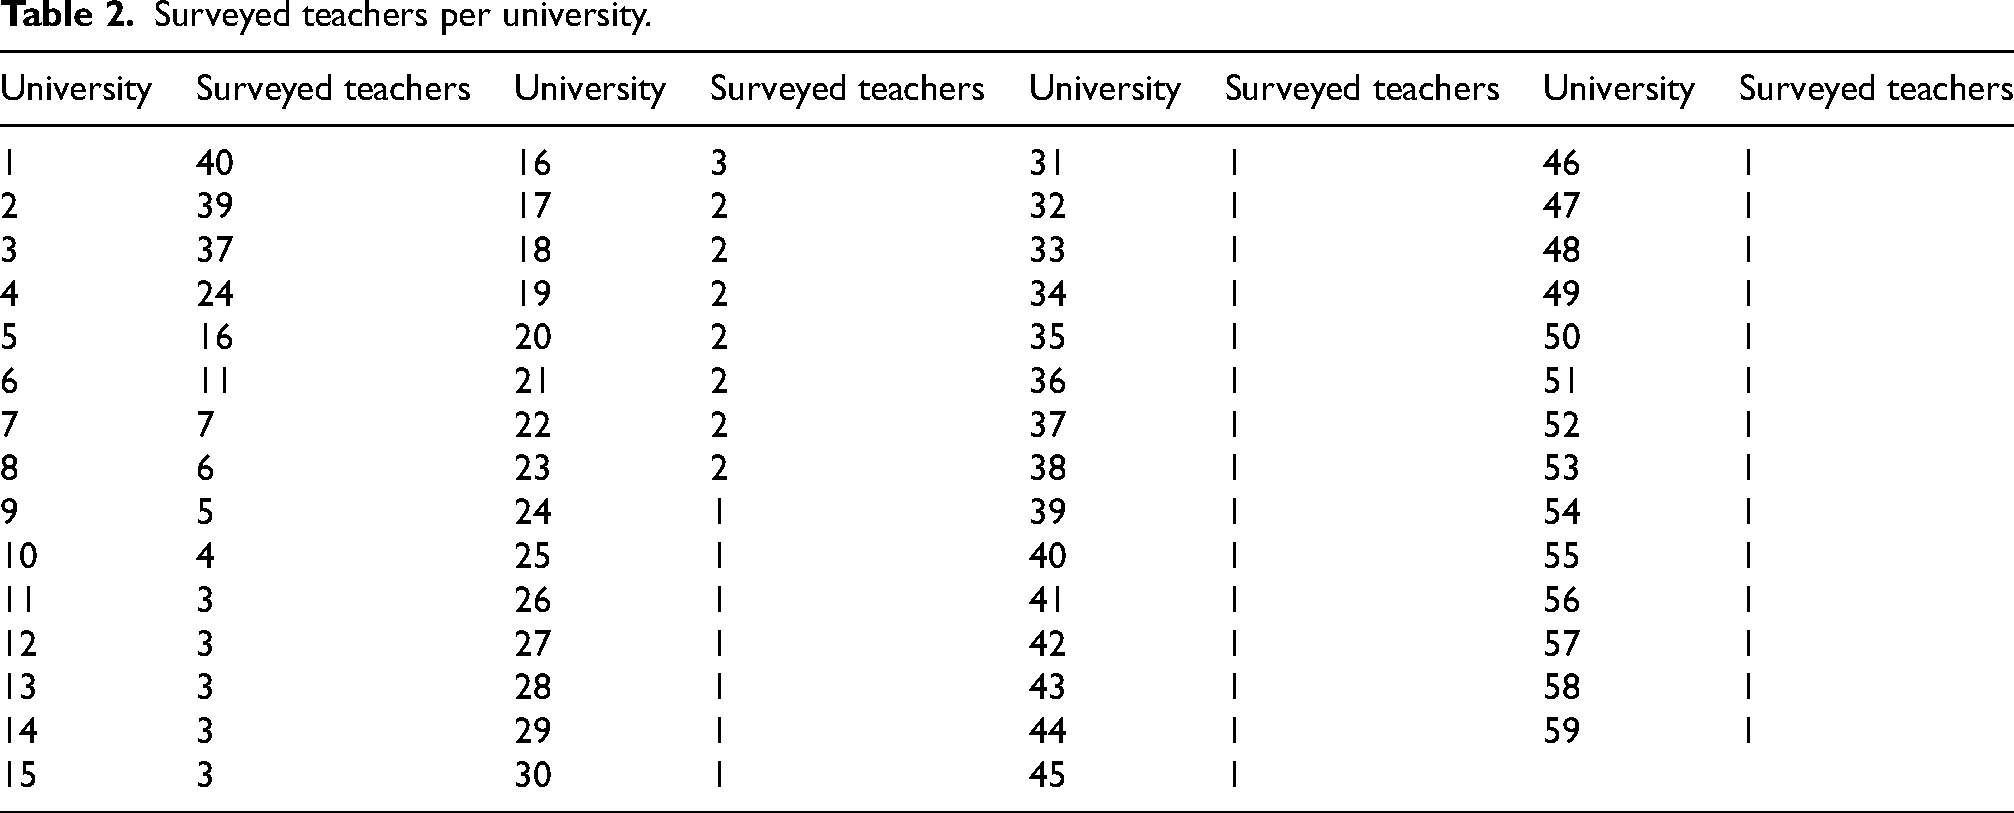
Once the Institutional Review Board (IRB) accepted the study, instructors from six nations (and 59 universities) in LA who had given online classes during the COVID-19 pandemic were required to complete the QEOCT. From July to October 2020, the QEOCT was applied online. To spread QEOCT, the first contact was established with well-known university lecturers from several LA nations. As a result, these professors were moved by the QEOCT and inspired to share it with other teachers in their nations or from other institutions.
Owing to its low cost and excellent practicability, convenience sampling was used for QEOCT. 44 This non-probabilistic sampling approach consists of people responding to a questionnaire when they have time to complete it. The collected data were examined. This study complied with the 1995 Declaration of Helsinki (updated in Edinburgh in 2000) and all essential ethical rules for human research were followed. A total of 257 questionnaires were issued and completed, and questions on the QEOCT were required. In addition, as indicated previously, all instructors participated voluntarily, it was difficult to implement QEOCT face-to-face, and teachers had limited time available. According to Kock, 45 the minimum sample size necessary for a significance level of 0.05, minimum path coefficient of 0.197, and statistical power of 0.8, was 160.
The majority of instructors were over 40–50 years old (32.68 percent), female (53.70%), and married (54.86%). Table 1 shows the participants’ sociodemographic characteristics. Table 2 presents the number of instructors at each institution. University A had the highest teacher participation, with 40 participants.
Socio-demographic information.
Surveyed teachers per university.
Stage 3: data analysis
As mentioned in the next two subsections, statistical data analysis attempts to validate QEOCT and hypothesis testing to discover correlations between the variables.
Step 1. Questionnaire validation
The SPSS 25® software was used for data analysis. Outliers were replaced with the median because the data were gathered on an ordinal basis (Likert scale). There was no missing information because every question on the form was necessary. Each QEOCT variable was statistically verified if Cronbach's alpha coefficient was higher than 0.70. 46
Average variance extracted (AVE) was used to assess discriminant and convergent validity. Because the analysis was performed using a 95 percent confidence interval, it must be more than or equal to 0.5 for each item, and the associated p-value must be less than or equal to 0.05. 47 The degree of collinearity across variables was then determined by calculating the variance inflation factor (VIF) index value, which had to be less than 3.30. 48 Because the data are ordinal, the Q2 coefficient is a nonparametric measure of predictive validity that must be greater than zero. 49 The Q2 coefficient is only accessible for endogenous latent variables. 50 In this study, the endogenous latent variable is JP.
Step 2: structural equation modeling
Correlations between the factors shown in Figure 1 were also investigated. This program combines structural equation modeling (SEM) with partial least squares calculations (PLS). The latter approach is appropriate for analyzing data on an ordinal scale because it requires a sample size that is somewhat less than normal, as normality is not required for multivariate analysis. 51 It also relies on discovering optimum factors by factoring and amplifying specified variables in proportion to the effect of the construct on endogenous variables. 51
The model was interpreted using the average path coefficient (APC), average R-squared (ARS), and adjusted average R-squared (AARS) efficiency indices. These indices were considered significant when they were less than 0.05. In addition, the average block VIF index (AVIF) is utilized to assess multicollinearity between exogenous variables and must be less than five. 52 The common technique bias was evaluated using the average total collinearity VIF (AFVIF) index. To avoid such bias in the dataset, the VNIF must be below 3.3. 53 The Tenenhaus index was then applied to evaluate the model fit (GoF). If the GoF is between 0 and 1, it is modest, 0.25, moderate, and in 0.36 is huge. 54
SEM assesses the factors’ total, direct, and indirect effects. The premises of the model are validated by direct consequences, as indicated by the arrows in Figure 1. In contrast, indirect effects quantify the relationship between two variables using two or more segments between an independent and dependent latent variable. The sum of the direct and indirect impacts is the total effect. 55 There are no indirect effects in the hypothetical model represented in Figure 1 because there is only one segment between each independent variable and dependent variable. Hence, the total effects match direct effects.
Direct effects are represented by the letter β, expressed in standard deviations, and represent a standardized relationship measurement parameter for two variables. This metric is related to a p-value that establishes, with a 95% confidence interval, whether the association between the two variables is statistically significant. 31 Finally, we calculated the capacity to rank the contribution of an independent variable to each dependent variable, and the explanatory strength of each impact using the effect size (ES) was computed. 31
Stage 4: sensitivity analysis
For latent variables, the probabilities of occurrence were analyzed in terms of high (+) and low (−) probabilities. Probabilities of occurrence were classified into three categories. The first is the likelihood of a single event. This category applies when a latent variable is isolated in high and low probability situations. The second category, the probability of simultaneous occurrence, happens when two variables co-occur in a mix of high- and low-probability situations and is represented by (
Results
Responders and universities participating
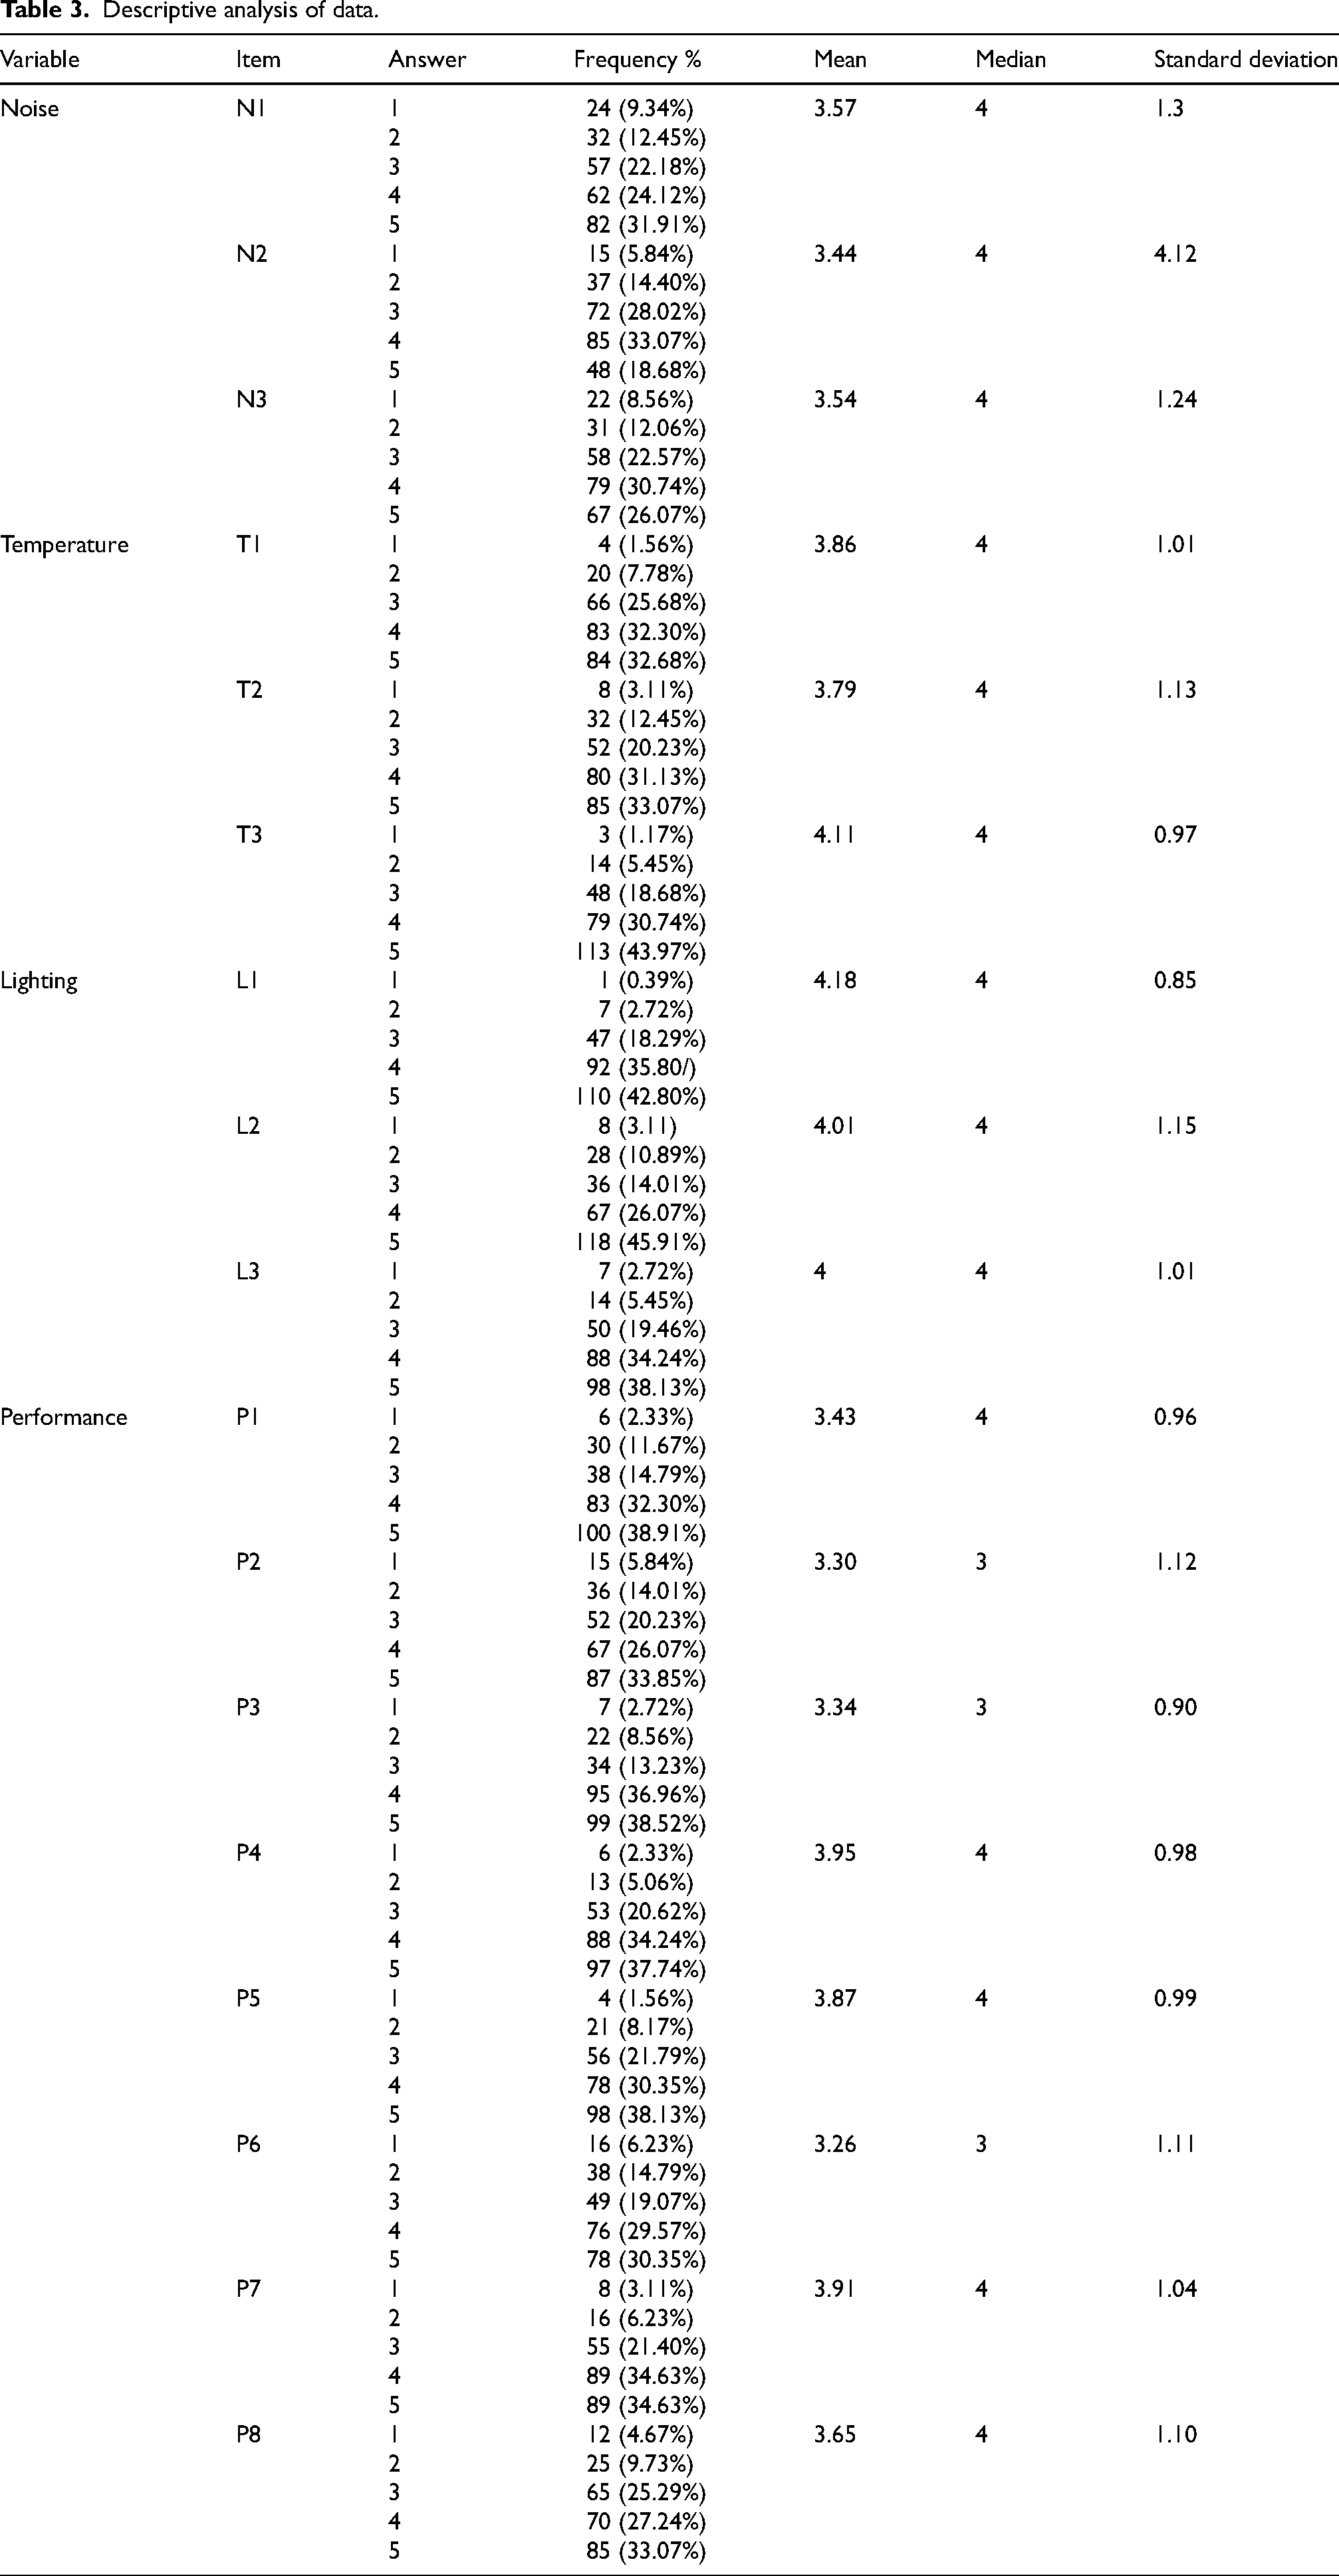
Table 3 presents the descriptive data analysis for each dependent and independent variable. For the three independent variables, most instructors answered, 3 = sometimes, 4 = usually, or 5 = always. The same was true for the dependent variable JP, with five being the most common response for all items. This finding implies that, when teaching online classes, most professors engage in pleasant ambient settings.
Descriptive analysis of data.
Items description
Table 4 presents the QEOCT questionnaire's validation results. Each variable yielded Cronbach's alpha values greater than 0.70. Furthermore, if any item of the four variables was eliminated, the corresponding Cronbach's alpha value would decrease, so it was decided not to eliminate any item from the QEOCT. Consequently, QEOCT has adequate internal and content validation, maintaining all original elements.
Validation of variables and items.
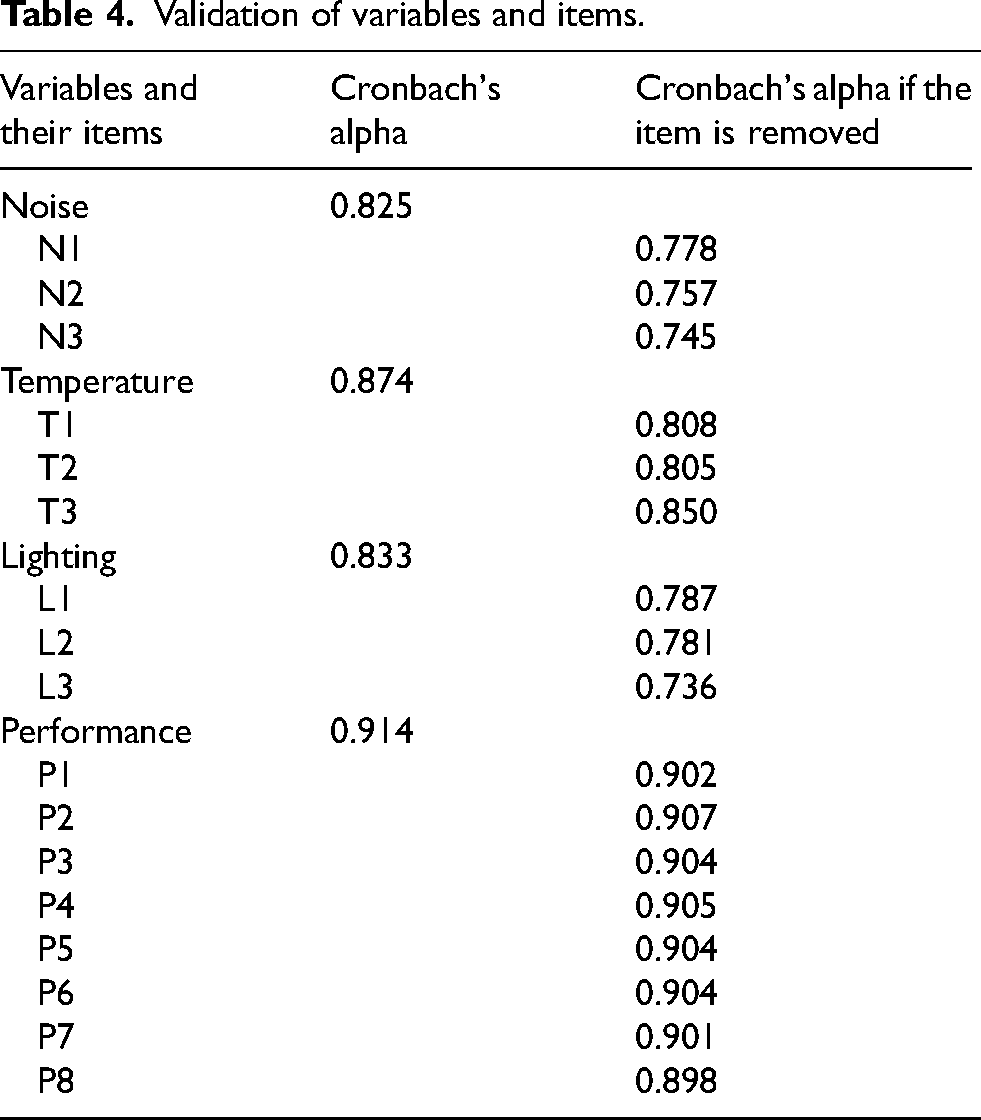
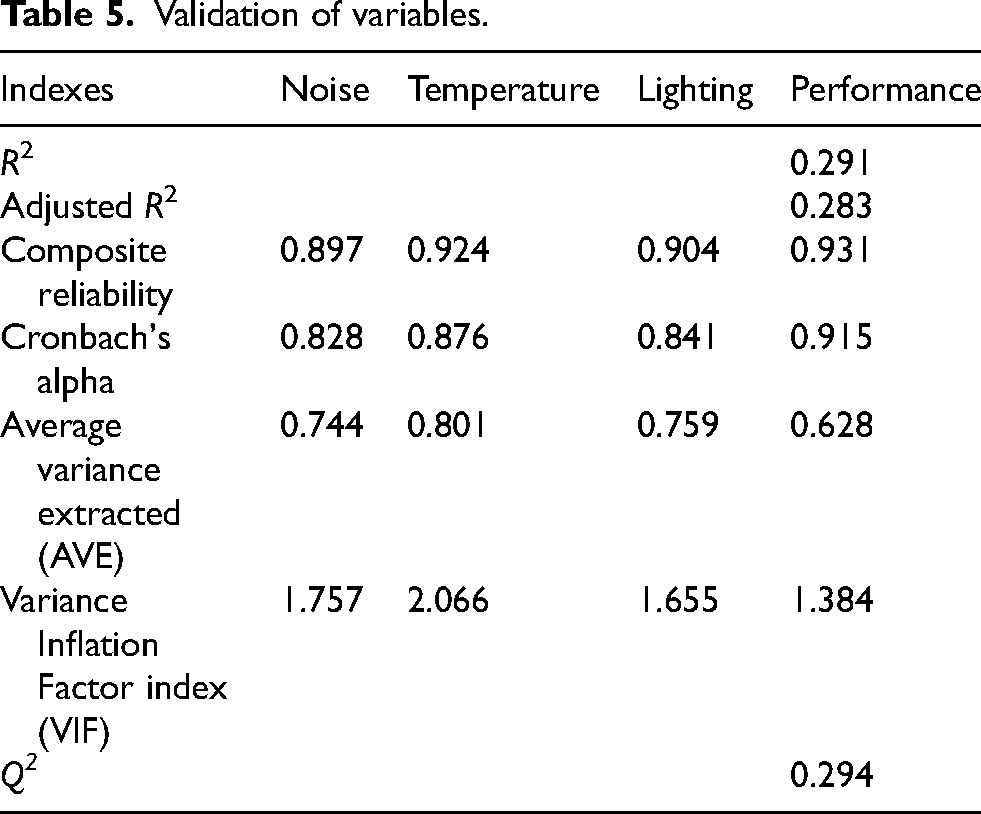
Table 5 lists the indices that verified the dependent and independent variables indicated in the current investigation. Evidently, these variables fulfilled the basic criteria for acceptability. Additionally, predictive validity was achieved because the adjusted R2 and R2 values exceeded 0.02. 45 According to the validation findings, these variables can be incorporated into the SEM for analysis.
Validation of variables.
Structural equation modelling
Figure 2 illustrates the evaluation findings of the model. The letter β reflects the direct impact of the relationships between the variables, while their respective p-values show the importance of their links. Moreover, the continuous lines suggest that the hypotheses are not rejected, whereas the dashed arrows imply that the hypotheses are not rejected. As shown, there are no arrows with dashed lines. Similarly, R2 measures the extent to which the dependent factors explain the variation in the dependent variable.
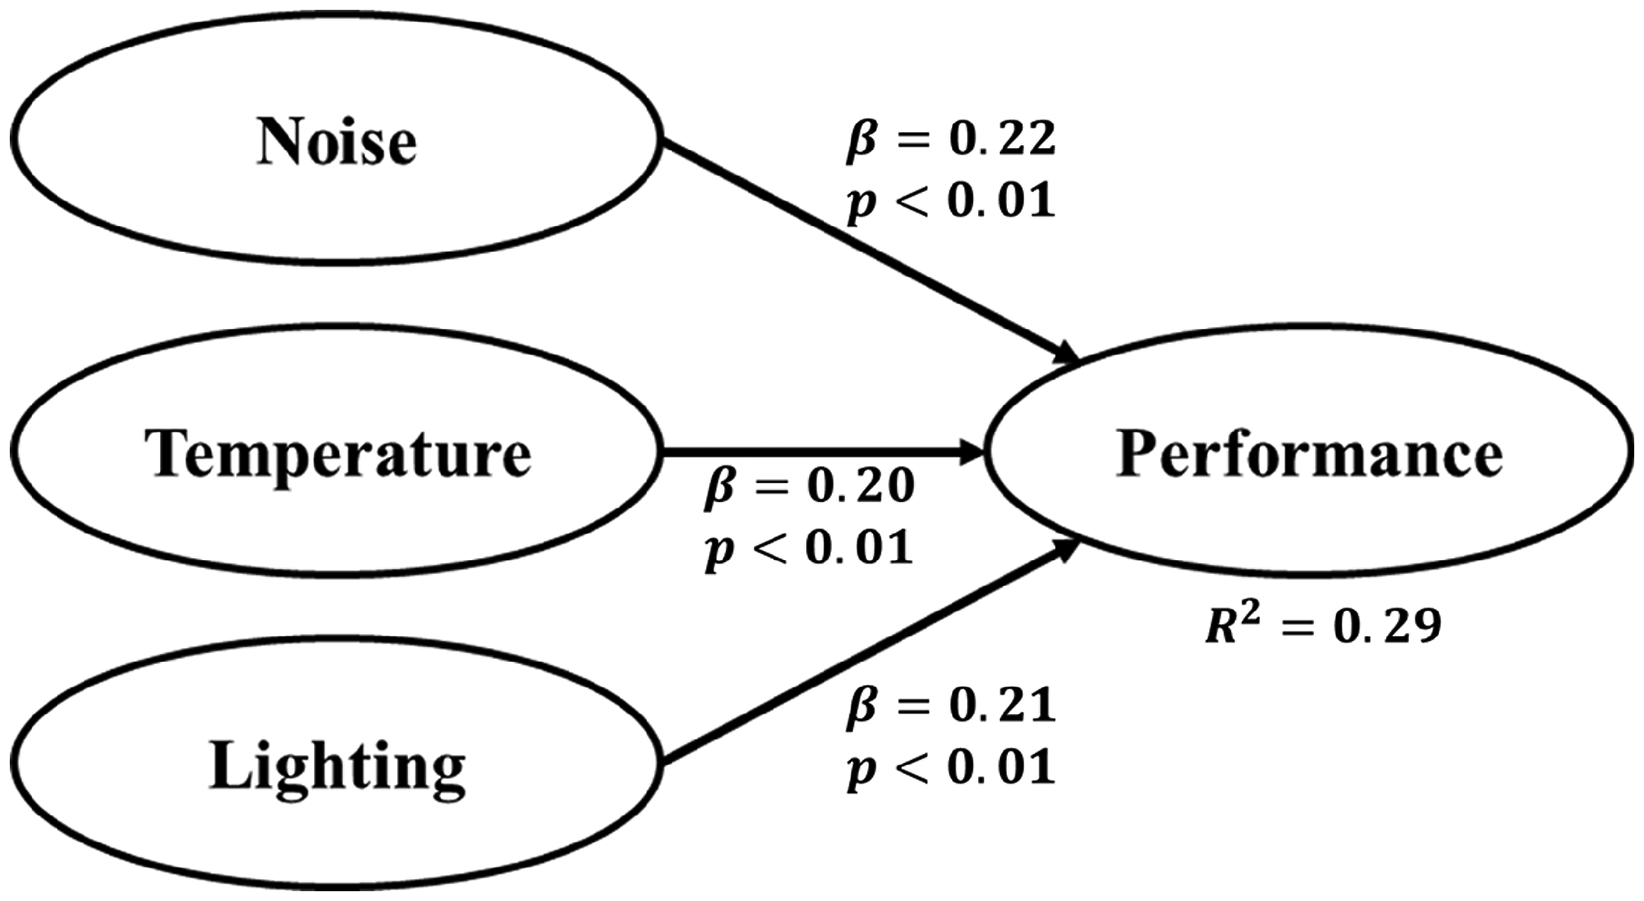
Model evaluation.
Validation of the model
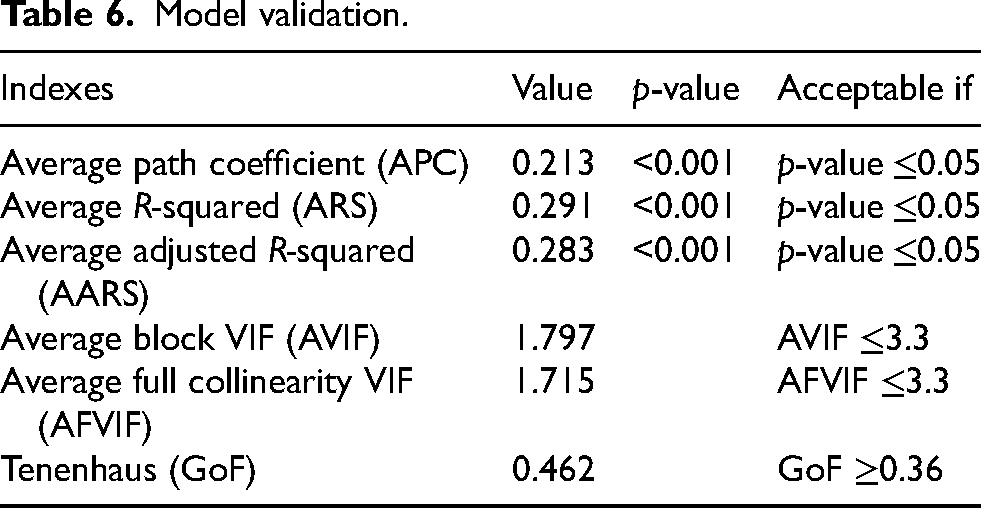
Table 6 presents the results of model validation indices. Each index satisfied the minimum and maximum parameters specified in the methodology section. Therefore, there were no collinearity issues, indicating that the model had predictive validity and had sufficient data.
Model validation.
Direct effects
Table 7 displays the values of β corresponding to each direct impact along with the accompanying p-values. If the p-value of the direct effect was less than 0.05, the effect was deemed significant. The p-values of the three hypotheses, H1, H2, and H3, were less than 0.05; hence, it was decided not to reject them. Moreover, with an effect size of 0.102, the noise variable has the greatest influence on the dependent variable. However, the impacts of temperature and light on the performance of university instructors were 0.09 and 0.09, respectively. During the COVID-19 epidemic in LA, the variable that had the greatest impact on the job performance of UT instructing online classes was noise.
Direct effects and decision on each hypothesis.
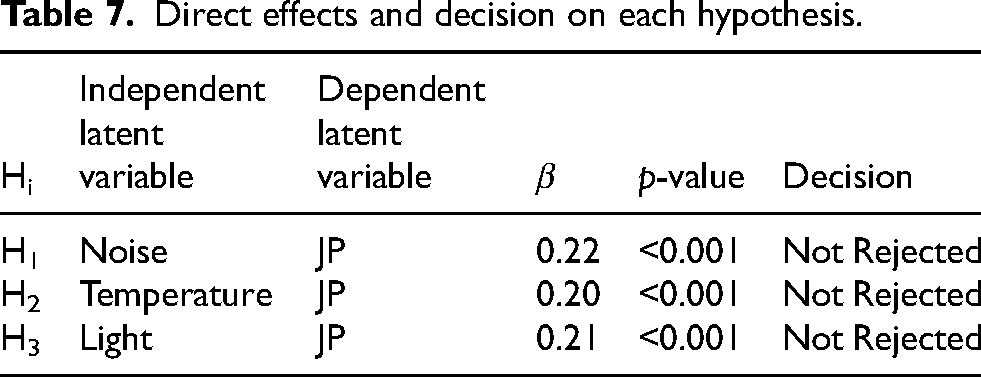
Based on what is shown in Table 7, the following can be said for each hypothesis:
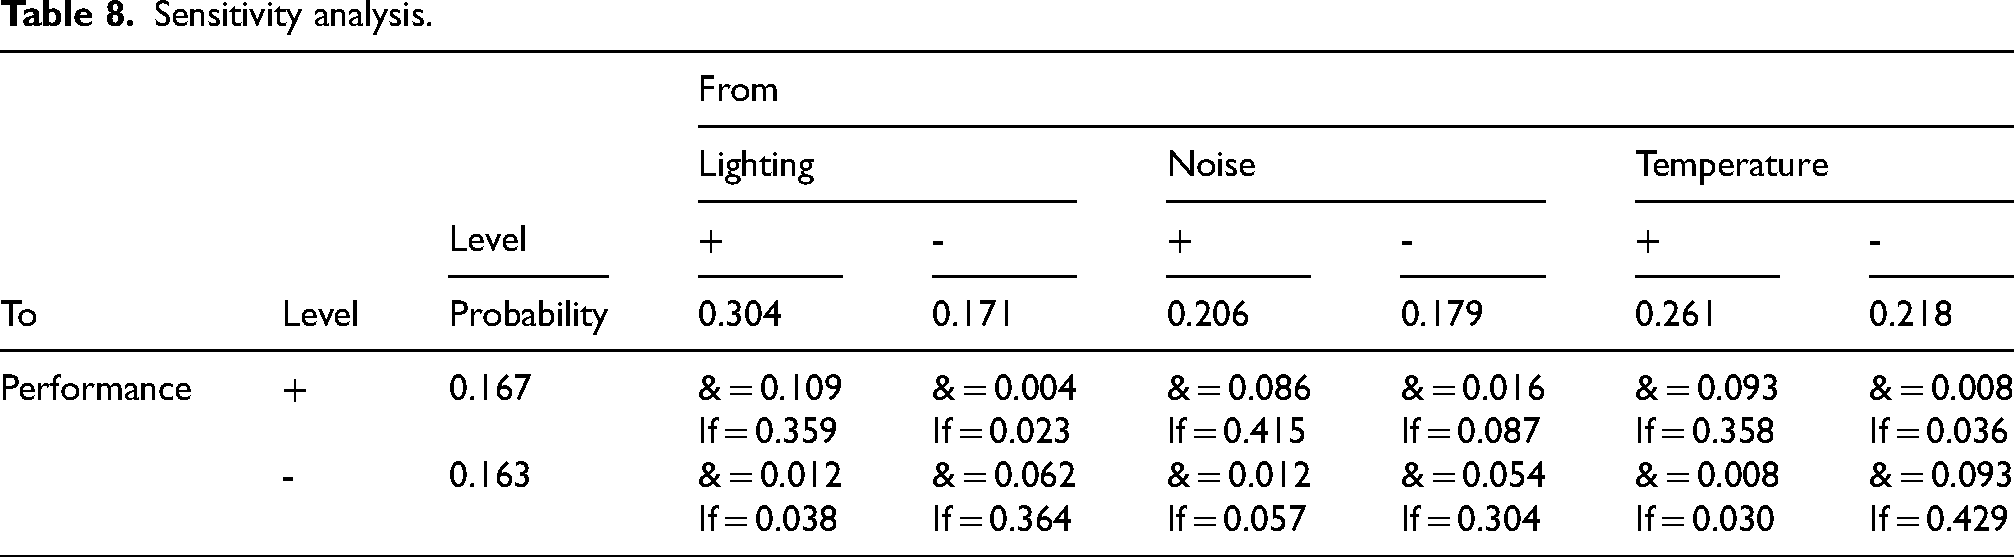
Sensitivity analysis
Table 8 shows model sensitivity analysis findings. These findings represent the chance that two latent variables occur alone, jointly, or conditionally with high and low probability values.
Sensitivity analysis.
Discussion of results
Our findings are consistent with other authors. For example, several studies have consistently demonstrated that noise significantly impacts teachers’ performance. 56 Other research has indicated that high classroom noise levels can impede a teacher's ability to convey lessons effectively and engage students, ultimately affecting their performance. 57 Furthermore, exposure to constant high noise levels can negatively impact teachers’ health and well-being, affecting their job performance. 58 Additionally, the effects of noise on teacher performance can manifest as increased stress, decreased job satisfaction, and burnout. 59 Sensitivity analysis also revealed that Noise + leads to Performance + with a probability of 0.415, whereas Noise− favors Performance− at 0.304. These findings emphasize the importance of creating quiet and conducive teaching and learning environments for students and teachers.
Regarding temperature and its impact on teacher performance, research suggests that providing comfortable classroom temperatures through proper ventilation and temperature control systems can significantly improve teacher performance. 60 Studies have also shown that access to resources such as fans or heaters to cope with temperature fluctuations and professional development programs focused on stress management and self-care strategies can further enhance teacher performance. 61 By equipping teachers with the necessary knowledge and skills to manage their well-being in the face of temperature fluctuations, academic institutions can mitigate the negative effects of climate on teacher performance and, ultimately, improve student education quality.
Research has shown that the effects of lighting on the overall productivity and well-being of individuals in the workplace are multifaceted and can have a significant impact. 62 Previous studies have demonstrated the direct physiological and psychological effects of lighting conditions in the workplace on individuals. 63 The findings of this study are consistent with those of other studies, which have shown that changes in lighting, such as variations in luminous conditions and the presence of natural light through windows, can have a considerable impact on visual capability, visual comfort, and perception of the working environment. 64 Inadequate lighting can also contribute to discomfort and impaired task performance through the glare caused by inappropriate lighting systems. The sensitivity analysis results are consistent with those from previous studies, with Lighting + leading to Performance + with a probability of 0.359 and Lighting− leading to Performance− with a probability of 0.364.
Conclusions and practical implications
Noise, temperature, and lighting conditions directly impacted the performance of Latin American university professors who taught online classes during the COVID-19 pandemic. Structural equation modeling analysis supported the three hypotheses (H1, H2, H3) relating these environmental factors to teaching performance. Of the three factors, noise had the largest effect on teaching performance, with a path coefficient (β) of 0.22 and an effect size of 0.102. This means that a one standard deviation increase in noise leads to a 0.22 standard deviation decrease in performance.
Temperature and lighting also significantly affected performance, with path coefficients of 0.20 and 0.21, respectively. A one-standard-deviation increase in uncomfortable temperature or poor lighting quality reduced performance by approximately 0.2 standard deviations. The questionnaire developed and validated in this study (QEOCT) proved to be a reliable and valid instrument to measure the impact of environmental factors on the performance of university teachers in an online teaching context during the pandemic.
Additionally, sensitivity analysis revealed that high noise has a 41.5% chance of leading to low performance, while low noise has a 30.4% chance of high performance. Similarly, uncomfortable temperatures and poor lighting are likely to lower teacher effectiveness.
The last conclusions have some practical implications; for example, universities should help faculty optimize their home teaching environments by providing guidance and resources on reducing background noise, maintaining comfortable temperatures, and ensuring adequate lighting. This can help mitigate negative impacts on teaching performance. Administrators should understand the challenges posed by suboptimal environmental conditions as teachers adapt to online instruction during the pandemic. Adaptations and support may be needed.
Other researchers and institutions can use the validated QEOCT instrument to assess environmental impacts on teacher performance and effectiveness in virtual environments. This can help identify areas for specific interventions, and efforts should especially focus on reducing noise levels, as this was found to be the most detrimental of the environmental factors examined. Possible strategies include using noise-canceling headphones, finding quieter spaces for teaching, and establishing “quiet hours” with family members.
Maintaining a sustainable and effective teaching force during the shift to online learning requires addressing instructors’ physical working conditions, not just technological and pedagogical considerations. A holistic approach that addresses environmental factors can help promote teacher well-being and success.
Limitations and future research
The variables analyzed here can be measured objectively and quantitatively, allowing for more complete analyses. For example, a sonometer can measure noise, indicating the exact decibel level in a teacher's environment. Similarly, the temperature can be quantified on various scales, and a luxmeter can measure lighting to determine lumens. This research has the limitation of being based on teachers’ perceptions concerning the variables noise, temperature, and illumination, so in future research, pilot tests will be conducted in which exact measurements are made in the environment in which the teacher works.
Supplemental Material
sj-docx-1-wor-10.1177_10519815251315638 - Supplemental material for Effects of environmental factors on university teachers’ performance from Latin America during the COVID-19 pandemic
Supplemental material, sj-docx-1-wor-10.1177_10519815251315638 for Effects of environmental factors on university teachers’ performance from Latin America during the COVID-19 pandemic by Arturo Realyvásquez Vargas, Jorge Luis García Alcaraz, Bogart Yail Márquez Lobato, Alfonso Jesús Gil López and José Roberto Díaz Reza in WORK
Footnotes
Acknowledgements
The authors would like to thank all the teachers who responded to our survey in the different educational institutions. Also, authors want to thank the Tecnológico Nacional de México (Instituto Tecnológico de Tijuana) for the support provided by means of the use of their installation and technology.
ORCID iDs
Ethical approval (name of institute and number)
The study was approved by the Ethical Committee of Tecnológico Nacional de México/Instituto Tecnológico de Tijuana (no. ERN-2024-001).
Informed consent
Before answering the survey, each participant read the following statement to give her/his consent to use the data she/he provided: “I have read the information and purpose of this research in the academic sector. I understand that my participation is voluntary, and I give my consent to take the proposed survey”.
Funding
The authors received no financial support for the research, authorship, and/or publication of this article.
Conflicting interests
The authors declared no potential conflicts of interest with respect to the research, authorship, and/or publication of this article.
Supplemental Material
Supplemental material for this article is available online.
References
Supplementary Material
Please find the following supplemental material available below.
For Open Access articles published under a Creative Commons License, all supplemental material carries the same license as the article it is associated with.
For non-Open Access articles published, all supplemental material carries a non-exclusive license, and permission requests for re-use of supplemental material or any part of supplemental material shall be sent directly to the copyright owner as specified in the copyright notice associated with the article.