
Abstract
Background
Central sensitization (CS) is increasingly recognized as a key contributor to persistent shoulder pain. While self-report tools such as the Central Sensitization Inventory (CSI) and the Pain Sensitivity Questionnaire (PSQ) are commonly used to assess CS, the psychometric properties of these tools have not been established in individuals with shoulder pain.
Objective
This study aimed to examine the convergent validity and test–retest reliability of the CSI and PSQ by comparing them with objective pain sensitivity measures.
Methods
Fifty-three adults with chronic shoulder pain completed the CSI and PSQ and underwent quantitative sensory testing including pressure pain threshold (PPT) and mechanical temporal summation (TS), while sensitivity to movement-evoked pain (SMEP) was assessed using a repetitive lifting task. Convergent validity was assessed using correlations analysis. Test–retest reliability was evaluated using intraclass correlation coefficients (ICC 3,1) and standard error of measurement (SEM).
Results
The PSQ-Total (r = 0.30) and PSQ-Minor (r = 0.34) scores were significantly associated with SMEP at the symptomatic shoulder. No statistically significant associations were found between the CSI and QST or SMEP measures. Both the CSI and PSQ demonstrated moderate to excellent test–retest reliability (ICC range: 0.75–0.94).
Conclusion
The PSQ demonstrated good reliability with modest convergent validity in assessing pain sensitivity during movement in individuals with shoulder pain. In contrast, the CSI did not correlate with objective measures, suggesting the CSI may assesses related but distinct constructs rather than direct measures of CS.
Keywords
Introduction
The underlying mechanisms that contribute to the experience of shoulder pain remain poorly understood.1–3 Increased nociceptive processing in the central nervous system (i.e., Central sensitization (CS)) may provide an explanation for the shoulder pain experience.2,3 CS, a heightened responsiveness of the nervous system, has been associated with various musculoskeletal conditions, including low back and knee pain.4–6 Moreover, recent research suggests that characteristics of CS are present in individuals suffering from chronic shoulder pain.6,7
Direct assessment of CS in humans is not currently possible.8,9 However, several surrogate indicators, such as quantitative sensory testing (QST) have been developed to identify features associated with CS.10,11 QST procedures comprise psychophysical tests designed to investigate the functional state of the somatosensory system, which commonly used to assess features of CS.11–13 Additionally, the sensitivity to movement-evoked pain (SMEP) index serves as a functional marker of CS, as patients with chronic shoulder pain often demonstrate increased pain summation during repeated active shoulder movements.14,15
Further, features of CS can be evaluated using self-reported tools,16,17 such as the Central Sensitization Inventory (CSI) 18 and the Pain Sensitivity Questionnaire (PSQ). 19 The CSI is a comprehensive self-reported measure designed to identify symptoms commonly associated with central sensitivity syndromes, such as fibromyalgia, chronic fatigue syndrome, and temporomandibular joint disorder.17,18 The PSQ, on the other hand, assesses patients’ perceptions by asking them to imagine various stimuli occurred in daily life. 19 Research has demonstrated significant correlations between PSQ scores and experimentally derived pain intensity ratings in individuals with musculoskeletal pain.19–22
Although tools, such as the CSI and PSQ are available, few studies have explore their construct validity in relation to QST.16,23 Moreover, no research has specifically examined the relationships between the CSI, PSQ, and SMEP in individuals with shoulder pain. Self-reported questionnaires, such as the CSI and the PSQ, can be used as a practical alternative to QST in clinical settings because they are easy to administer to large number of patients, compatibility with electronic health records, and do not require advanced training. 16 Therefore, this study examined the convergent validity of the CSI and PSQ against QST measures and the SMEP index, as well as their test–retest reliability in individuals with chronic shoulder pain. The present study hypothesized that both the CSI and the PSQ would demonstrate significant associations with QST and SMEP measures, as well as acceptable test–retest reliability.
Materials and methods
Study design
This study is an observational study design including both a cross-sectional component and a reliability component. The cross-sectional component examined the convergent validity of the CSI and the PSQ by comparing them with QST and SMEP measures, while the reliability component evaluated the test–retest reliability of the CSI and the PSQ. The current study forms part of a larger research project investigating pain sensitivity in individuals with shoulder pain. While our previous publication focused solely on psychophysical measures of pain sensitivity (i.e., QST), 24 the current study extends that work by examining the associations between these quantitative measures and self-reported pain sensitivity tools. Ethical approval for the study was obtained from the Human Research Ethics Committee at the Faculty of Medical Rehabilitation Sciences, King Abdulaziz University (Reference No. FMRS-EC2023-020).
Study population
Adults between 18 and 65 years; complaints of chronic non-specific shoulder pain were recruited for the study. Chronic non-specific shoulder pain includes a patient complaint of continuous shoulder pain primarily limited to the anterior, lateral, or posterior shoulder for at least 3 months with a current pain intensity of at least 3 on an 11-point numeric pain rating scale (NPRS).
Exclusion criteria
Participants with shoulder pain arising from the following conditions were excluded from the study: (1) history of trauma; (2) inflammatory arthritis or infectious diseases; (3) neurological disorders; (4) neck pain with referral to the shoulder region or associated with radicular symptoms/radiculopathy; (5) history of surgery within the past six months; (6) pregnancy; and (7) diagnosis of fibromyalgia. Additionally, a subjective screening was performed during the eligibility assessment to identify any comorbid conditions that could potentially affect pain processing, including central sensitivity syndrome-related conditions identified in Part B of the CSI. 18
Sampling and study procedures
Participants were recruited using a convenience sampling approach. Individuals from the general community were invited to participate through study advertisements (flyers/posters) distributed via social media platforms, sports clubs, and fitness centres. Interested volunteers contacted the research team at the Physiotherapy Department, King Abdulaziz University, and a trained team member screened all volunteers for eligibility. To minimize variability in QST responses, participants were instructed to avoid taking analgesic or anti-inflammatory medications for at least 24 h prior to the assessment session.
On the day of testing, written informed consent was obtained from each participant prior to data collection. After completing the self-reported questionnaires, the outcome assessor conducted a series of sensory testing, including pressure pain threshold (PPT), temporal summation (TS), and sensitivity to movement-evoked pain (SMEP) using a repeated lifting task. Participants were then scheduled for a follow-up visit one week after the baseline assessment. During this session, the same assessor re-administered the CSI and PSQ. Participants were instructed to maintain their usual care and avoid starting any new interventions to remain clinically stable.
Pain intensity
The Brief Pain Inventory (BPI) was used to assess pain intensity. 25 The BPI was designed to provide a quick and straightforward assessment of pain intensity as well as the extent to which pain interferes with an individual's life. The BPI uses an 11-point numerical rating scale (0–10), with 0 indicating “no pain” and 10 representing “pain as bad as you can imagine.” In the present study, participants simply rated their current and average pain intensity.
Measures of sensitization
Central sensitization inventory (CSI)
The CSI is a self-reported tool designed to identify symptoms commonly associated with central sensitivity syndromes.17,18 In this study, only the responses from Part A (the 25-item questionnaire) were analyzed. Participants rated each item on a 5-point scale, ranging from 0 (“never”) to 4 (“always”), resulting in a total score between 0 and 100. A score of ≥40 has been established as a reliable cut-off for identifying individuals with central sensitivity syndromes. The Arabic version of the CSI was utilized in this study. It has demonstrated strong psychometric properties, including excellent test-retest reliability (ICC = 0.94) and internal consistency (Cronbach's α = 0.88). 26
Pain sensitivity questionnaire (PSQ)
The PSQ assesses an individual's perceived pain intensity in response to 17 imagined scenarios involving painful everyday situations. 19 Participants rate their pain intensity on a numerical rating scale (NRS) from 0 to 10. The PSQ generates a total score (PSQ-total) and includes two subscales: PSQ-moderate and PSQ-minor. The PSQ-total score is the average rating of 14 specific items (1, 2, 3, 4, 6, 7, 8, 10, 11, 12, 14, 15, 16, and 17). The PSQ-moderate subscale averages seven items (1, 2, 3, 8, 15, 16, and 17), which represent scenarios of moderate pain intensity. The PSQ-minor subscale averages another set of seven items (3, 6, 7, 10, 11, 12, and 14), which represent scenarios of mild pain intensity. Three items (5, 9, and 13) are excluded from scoring as they represent situations typically perceived as non-painful. The current study utilized the Arabic version of the PSQ (PSQ-A). The PSQ-A demonstrated good test-retest reliability: 0.80 for the total score, 0.74 for the moderate subscale, and 0.77 for the minor subscale. 21
Quantitative sensory testing (QST)
Pressure pain threshold (PPT)
PPT was measured using a handheld algometer (Wagner Force One™ FDIX). PPT represents the smallest amount of force required to produce a pain sensation.9,27 The algometer was positioned perpendicularly on the anatomical testing site (i.e., mid-deltoid muscle), and pressure was gradually raised from zero to a maximum of 1000 kPa.13,28 Participants were asked to indicate the exact moment when the sensation shifted from pressure to the first feeling of pain. At that moment, the test was immediately terminated and the associated pressure reading was recorded. The average of three consecutive trials was used to compute the final PPT value.24,28
Mechanical temporal summation (TS)
TS was assessed using a Von Frey filament (no. 6.65) applied on the dorsum of the distal forearm (unaffected side) and the mid-deltoid muscle (affected side).6,9,15 Participants first received a single stimulus, followed by a series of ten stimuli delivered at a frequency of 1 Hz. Participants rated their pain intensity after a single stimulus and after a train of ten stimuli using an 11-point Numerical Pain Rating Scale (NPRS). The procedure was performed three times, with a one-minute rest interval between trials. TS was calculated as the absolute difference between the mean pain rating for the ten-stimulus series and the mean rating for the single stimulus.15,24
Sensitivity to movement-evoked pain (SMEP)
After completing the QST procedures, participants performed a standardized canister-lifting task.15,29 This task has been validated and proven to be reliable in individuals suffering from shoulder pain.15,24,29 Participants lifted 18 visually identical canisters of three different weights (2.9, 3.4, and 3.9 kg), arranged in three rows of six. Each canister was labelled alphabetically (A–R), and participants lifted them in order. participants raised each canister and rated their pain intensity using an 11-point numerical pain rating scale. The SMEP index was calculated by subtracting the mean pain rating of the first three lifts from the mean pain rating of the final three lifts.15,29,30 Additionally, the average pain rating across all 18 lifts was calculated to quantify the movement-evoked pain (MEP).
Sample size
A priori power analysis (G*Power 3.1.2, Kiel, Germany) was performed based on a recent study reporting a correlation of r = −0.414 between CSI and PPT in individuals with shoulder pain.15,23 With a two-tailed significance set at 0.05 and power at 80%, the required sample size was estimated at a minimum of 40 participants.
Statistical analysis
All statistical analyses were conducted using IBM SPSS Statistics (Version 26). Descriptive statistics were generated for all demographic variables and sensitization measures. The convergent validity of the CSI and PSQ with QST and SMEP measures was examined using Spearman's rank-order correlation. Statistical significance was set at p ≤ 0.05. Correlation strength was interpreted as follows: weak (0.00–0.24), fair (0.25–0.50), moderate to good (0.51–0.75), and good to excellent (>0.75). 31 The correlation analyses in this study were exploratory in nature. However, multiple partial correlation analyses were performed, and possible confounders were accounted for. The key variables were sensitization measures, with sex, age, and BMI added as covariates.
Reliability analyses were performed using both relative (ICC) and absolute (SEM) indices. The relative reliability across the 2-time points was calculated to obtain the Interclass Correlation Coefficient (ICC). The ICC was obtained using a single measure, consistency, 2-Way mixed-effect model (ICC3,1) described by Shrout and Fleiss (1979). 32 ICC values >0.90 were interpreted as excellent reliability, values between 0.75 and 0.90 as good, values between 0.50 and 0.75 as moderate, and values <0.50 as poor. 33 The standard error of measurement (SEM) was derived from the square root of the mean square error term of the repeated-measures ANOVA and was reported as both absolute values and percentages (SEM%). As no formal criteria exist for interpreting SEM%, prior reliability studies have classified SEM% values as excellent (≤10%) or acceptable (11–30%).34–36 These same interpretive thresholds were applied in the present study.
Results
Figure 1 illustrates the sequence of steps involved in recruiting and screening study participants. In total, 53 individuals experiencing chronic shoulder pain were recruited for the study and subsequently included in the present analysis.
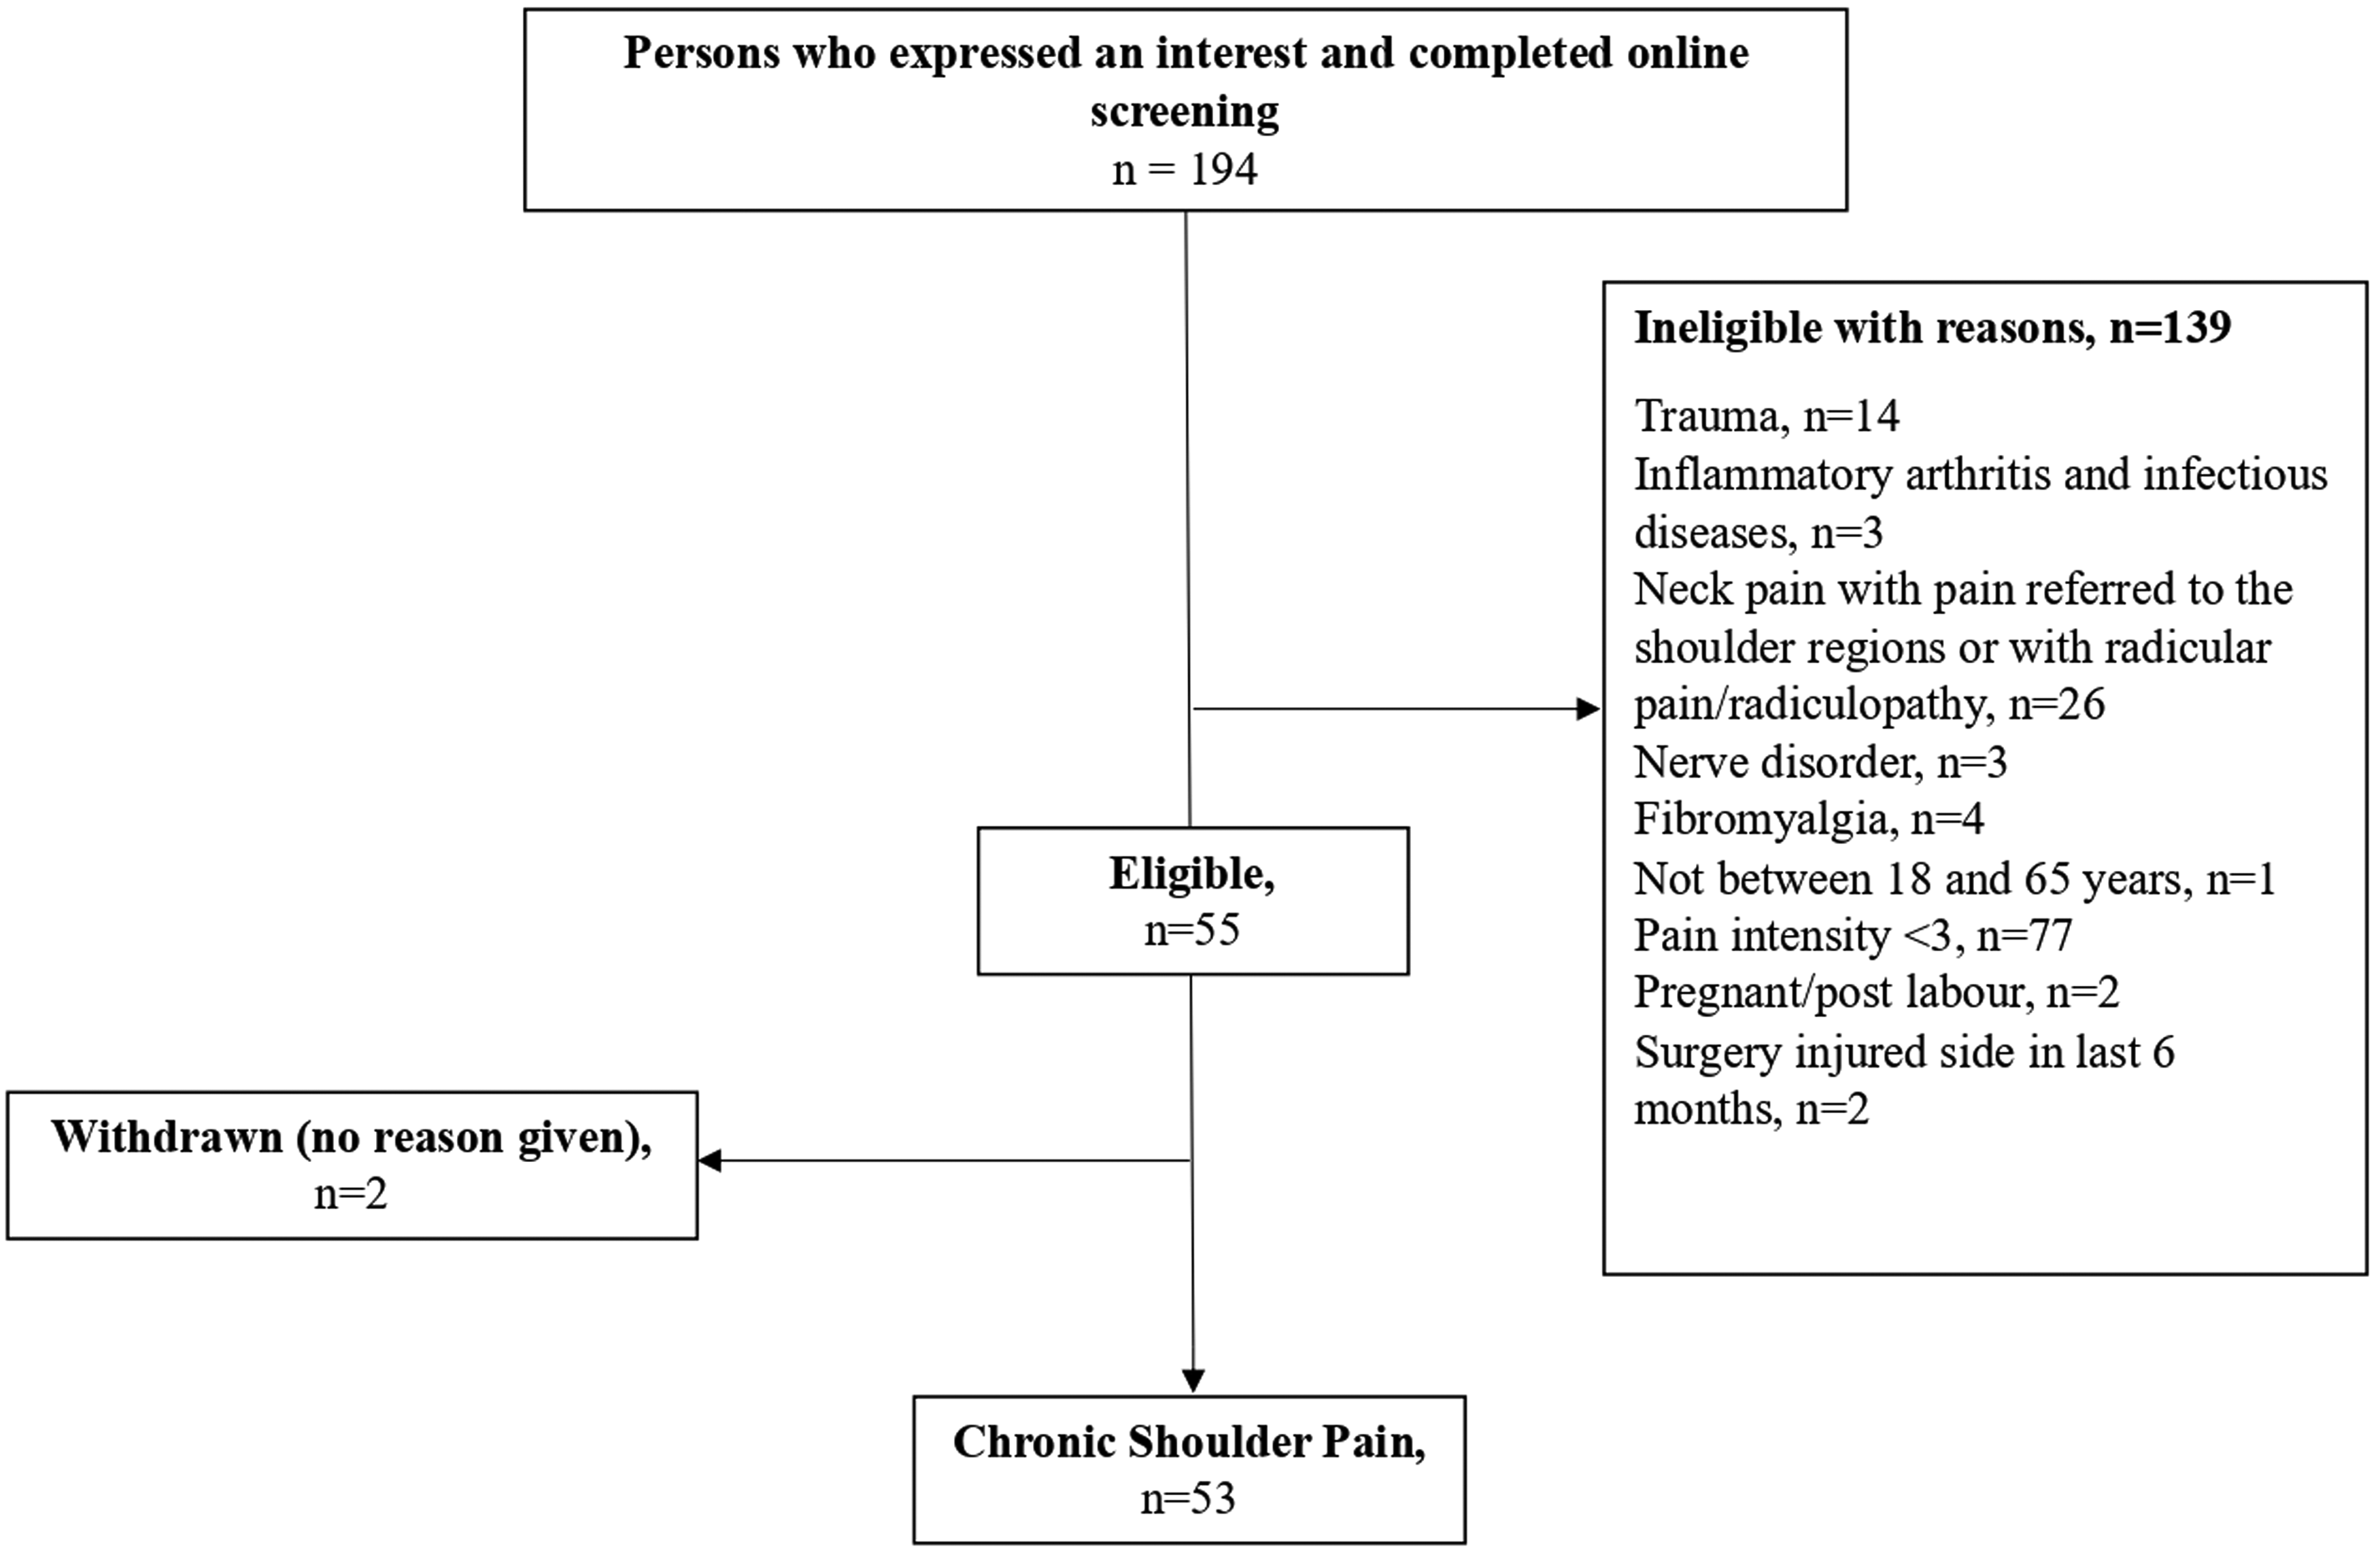
Flow chart of recruitment and screening process.
Participant characteristics
Table 1 summarizes the demographic and clinical characteristics of the study participants. The sample included 53 individuals with chronic shoulder pain, comprising 40 males (75.5%) and 13 females (24.5%), aged between 20 and 62 years, with BMI values ranging from 17.90 to 42.02. Most participants were right-hand dominant (94.3%, n = 50), and 30 individuals (56.6%) reported pain in their right shoulder. Nearly all participants were residents of Saudi Arabia (94.3%, n = 50), and 41 individuals (77.4%) were university students. The majority of the sample (86.8%, n = 46) reported being single. Pain severity was generally mild to moderate, with an average pain intensity score of 3.91 (SD = 1.10) on an 11-point Numerical Pain Rating Scale (NPRS).
Participant's characteristics
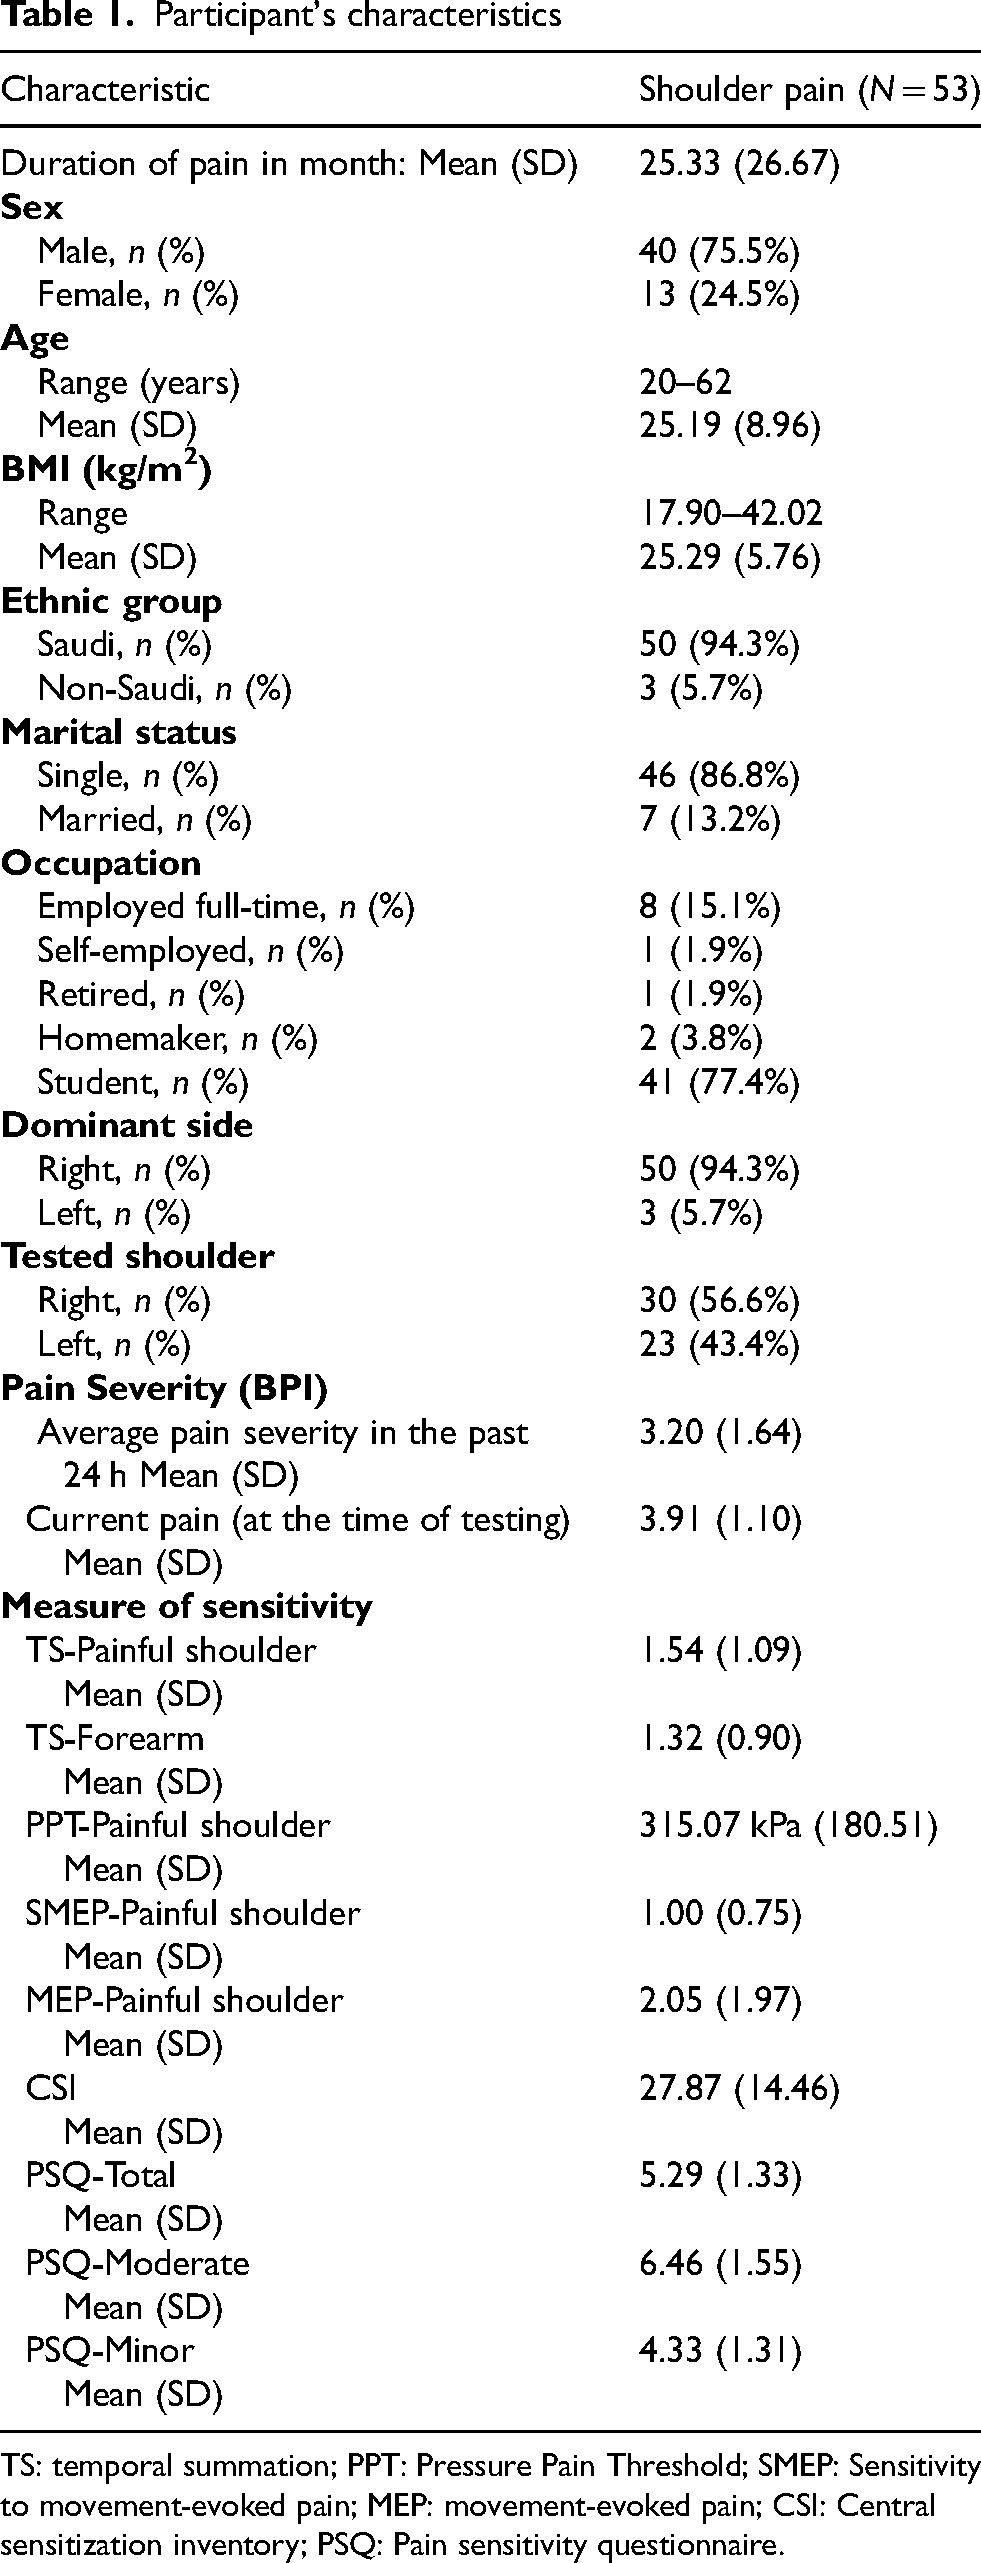
TS: temporal summation; PPT: Pressure Pain Threshold; SMEP: Sensitivity to movement-evoked pain; MEP: movement-evoked pain; CSI: Central sensitization inventory; PSQ: Pain sensitivity questionnaire.
The participants’ scores on the CSI, PSQ, QST, and SMEP are also detailed in Table 1. At baseline, the mean (±SD) scores for the PSQ were 5.29 (±1.33) for the total score, 6.46 (±1.55) for the moderate subscale, and 4.33 (±1.31) for the minor subscale. The CSI scores averaged 27.87 (±14.46), with 20.8% of participants (n = 11) scoring ≥40, indicating significant central sensitization symptoms. For TS, the painful shoulder recorded a higher TS score of 1.54 (±1.09) compared to the remote site, which had a mean (±SD) of 1.32 (±0.90). In contrast, the SMEP score had a lower mean of 1.00 (±0.75), suggesting a smaller magnitude relative to TS at both sites.
Associations between Cs measures
Table 2 presents the results of the correlation analysis examining the relationships between the CSI, PSQ, PPT, TS, and SMEP. A significant (fair) association was observed between both SMEP and the PSQ-Total (r = 0.30) and PSQ-Minor (r = 0.34) at the symptomatic shoulder. Additionally, elevated SMEP scores showed significant correlations with lower PPT scores (r = −0.32). The SMEP shows fair relationship with TS scores at the symptomatic shoulder (r = 0.30) and at the forearm (r = 0.43). However, no statistically significant associations were identified between CSI scores and other measures of sensitization. Table 3 presents the partial correlation analyses adjusted for age, sex, and BMI. Similar patterns of association were observed after adjustment, indicating that the main findings remained consistent.
Spearman rank-order correlations between measures of sensitization.
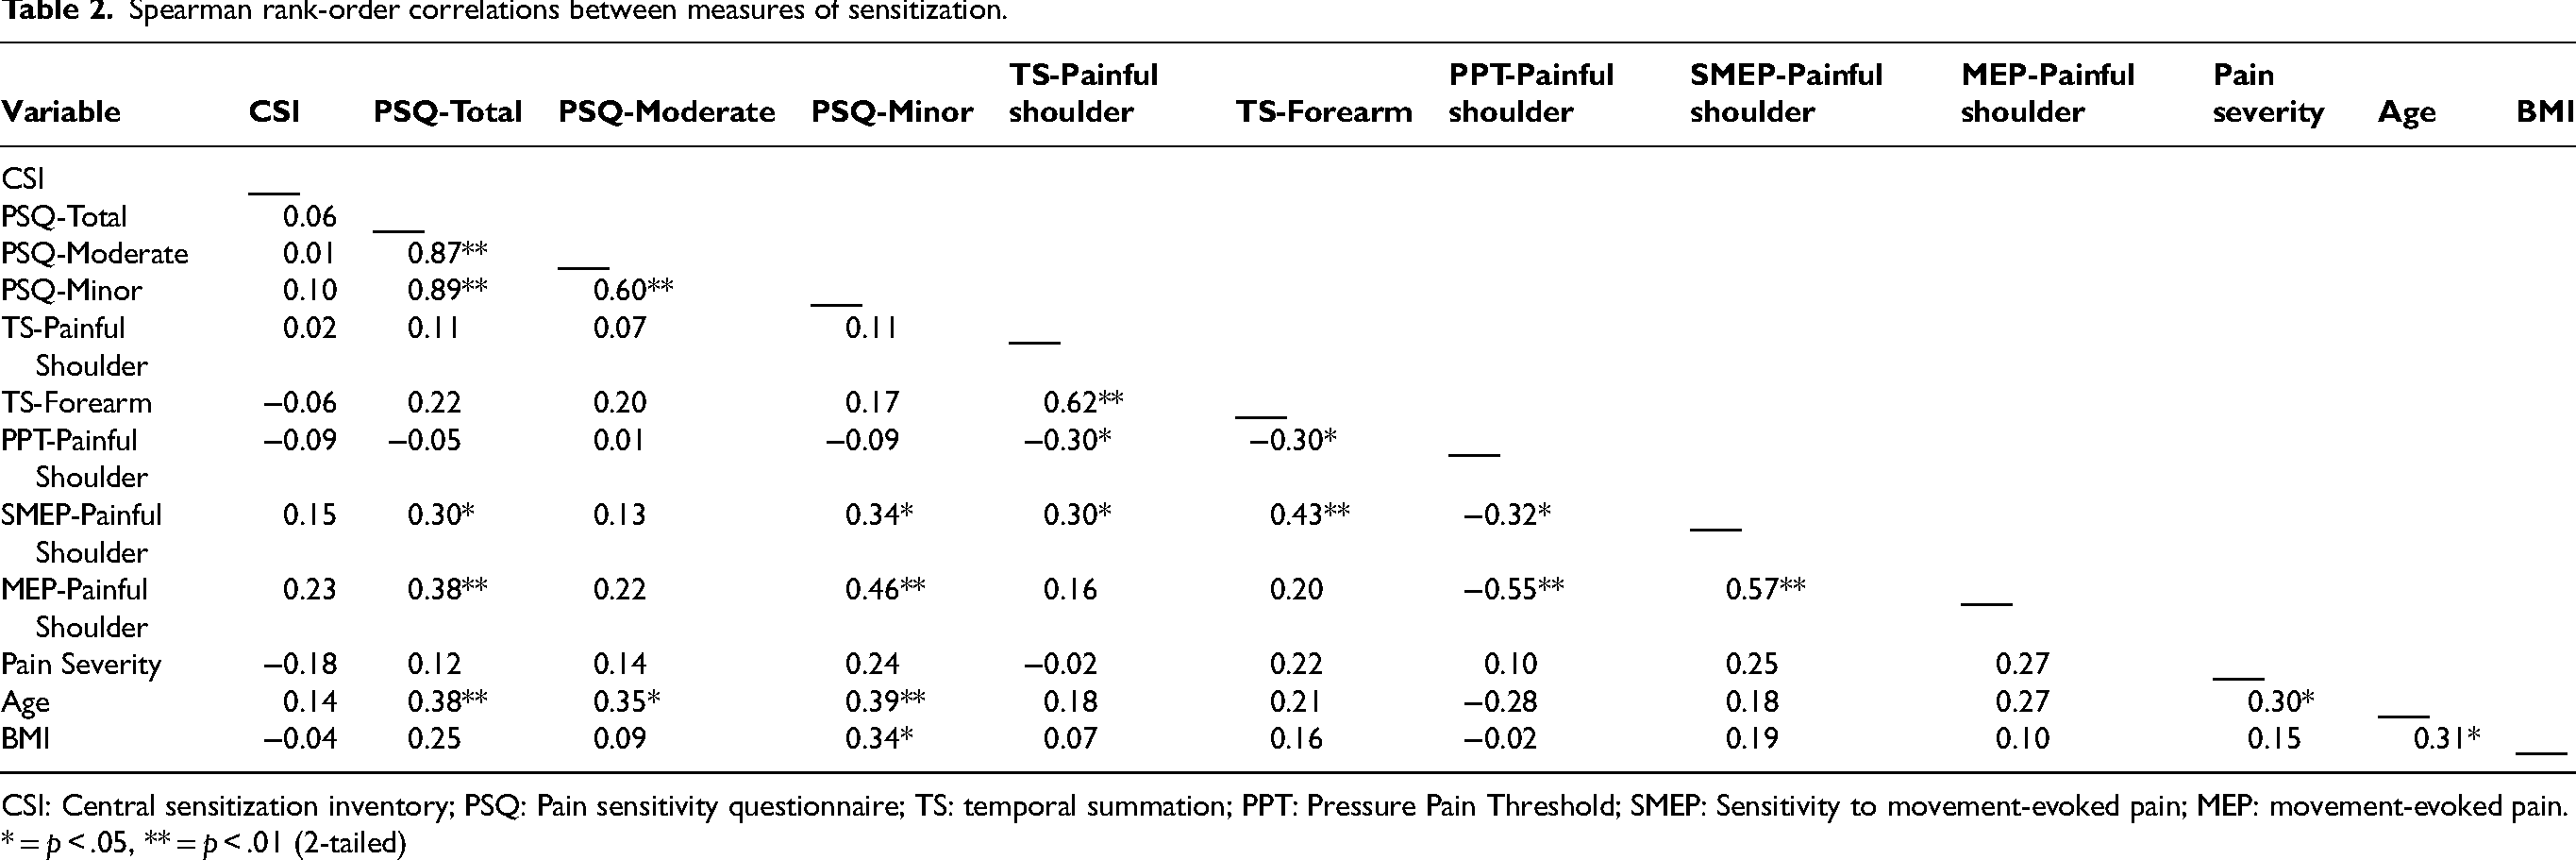
CSI: Central sensitization inventory; PSQ: Pain sensitivity questionnaire; TS: temporal summation; PPT: Pressure Pain Threshold; SMEP: Sensitivity to movement-evoked pain; MEP: movement-evoked pain.
* = p < .05, ** = p < .01 (2-tailed)
Partial correlations between CSI, PSQ, QST and SMEP measures with age, sex, and BMI added as covariates.
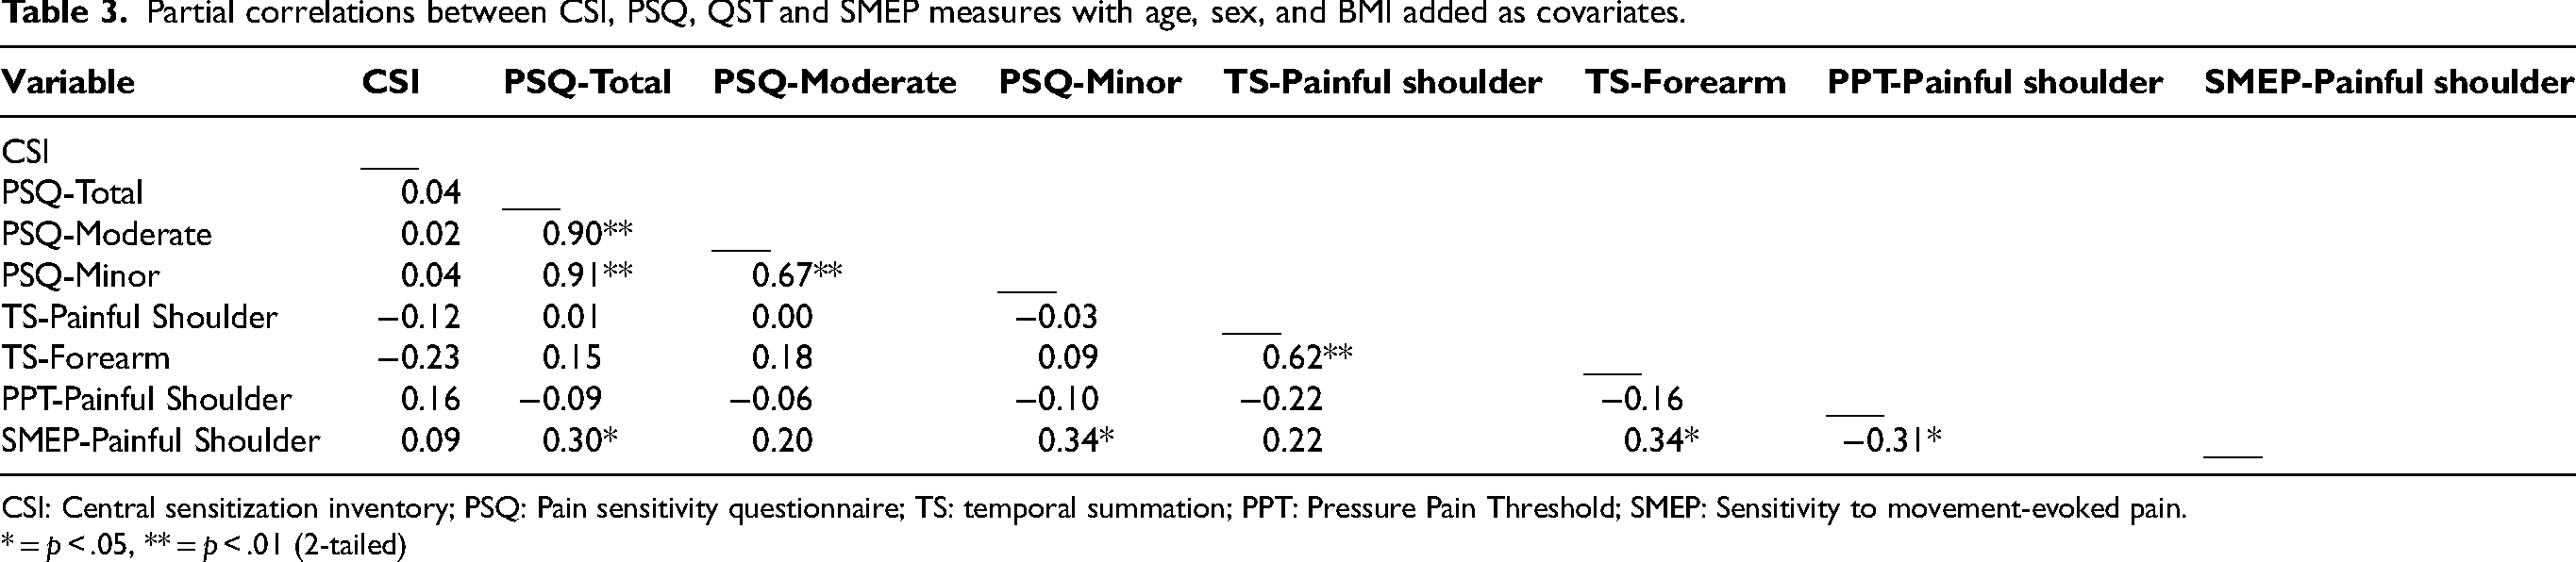
CSI: Central sensitization inventory; PSQ: Pain sensitivity questionnaire; TS: temporal summation; PPT: Pressure Pain Threshold; SMEP: Sensitivity to movement-evoked pain.
* = p < .05, ** = p < .01 (2-tailed)
Associations between Cs measures and pain outcomes
None of the sensitization measures showed a significant association with shoulder pain severity at rest. However, higher scores on both PSQ-Total (r = 0.38) and PSQ-Minor (r = 0.46) were significantly associated with increased pain severity during movement, as measured by MEP. Further, there was a moderate to good association between greater MEP and lower PPT (r = −0.55) and higher SMEP (r = 0.57) scores.
Reliability of CSI and PSQ
The reliability analysis results are presented in Table 4. The ICC for the CSI and PSQ ranged from moderate to excellent (0.75 to 0.94). The CSI demonstrated excellent reliability, indicating high precision, particularly among participants with shoulder pain. Among the PSQ subscales, PSQ-Moderate showed the lowest ICC value (0.75). The Standard Error of Measurement (SEM%) for the CSI and PSQ ranged from 12.54% to 14.36%, with PSQ-Minor displaying the highest SEM (14.36%). Despite these variations, both the CSI and PSQ exhibited acceptable levels of measurement error.
Test-retest reliability of the CSI and PSQ.
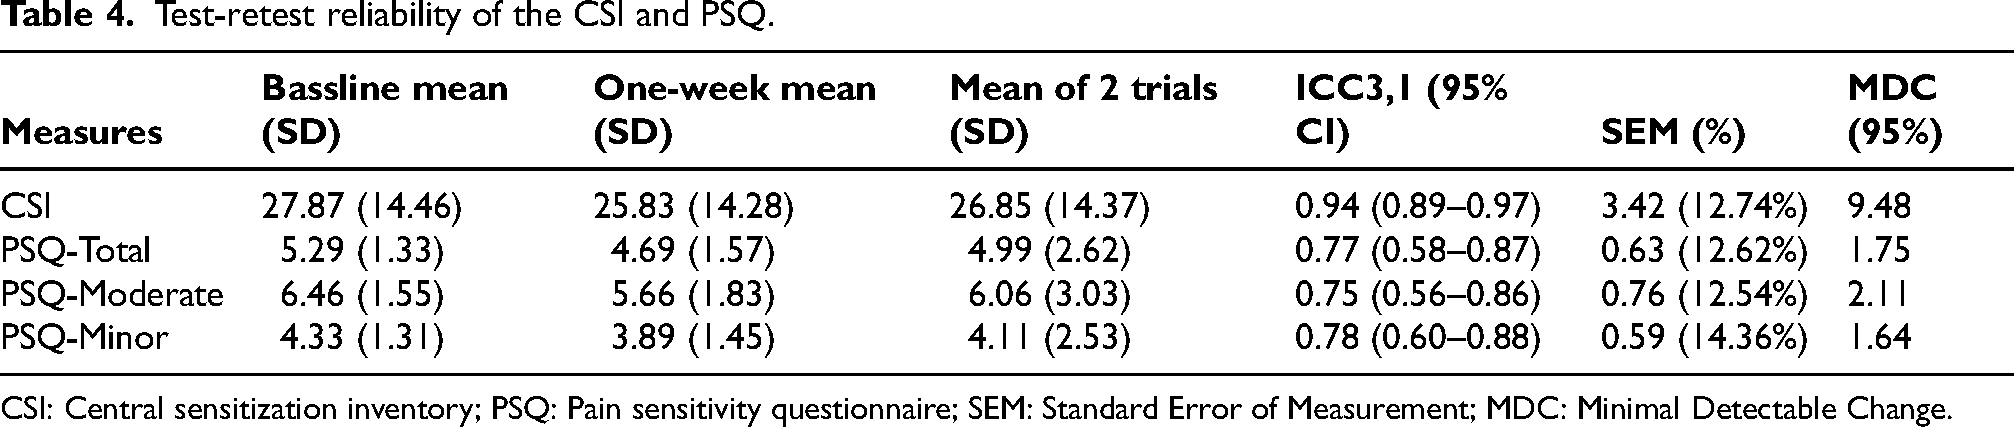
CSI: Central sensitization inventory; PSQ: Pain sensitivity questionnaire; SEM: Standard Error of Measurement; MDC: Minimal Detectable Change.
Discussion
This study evaluated the convergent validity and test–retest reliability of the CSI and PSQ in individuals with shoulder pain. Although the study hypothesized that both the CSI and PSQ would be associated with QST and SMEP measures, only the PSQ demonstrated significant associations, whereas the CSI showed no significant relationships with these measures. Validity analysis showed that higher PSQ-Total and PSQ-Minor scores associated with increased SMEP scores at the symptomatic shoulder. Among the sensitization measures, PPT, SMEP, and PSQ scores demonstrated the strongest associations with pain severity during movement (i.e., MEP). Reliability analysis indicated excellent reliability for the CSI and moderate-to-excellent reliability for the PSQ and its subscales, with both measures demonstrating acceptable measurement error, supporting their clinical and research utility.
The validity analysis revealed that the PSQ scores were significantly associated with SMEP scores at the symptomatic shoulder. This finding may be supported with previous research indicating that the PSQ effectively captures pain sensitivity linked to everyday functional activities.19,37,38 The PSQ involves imagining painful scenarios from daily life, which may influenced by both cognitive and emotional aspects of pain processing. Thereby, the PSQ reflects dynamic pain responses that manifest during physical tasks, such as the SMEP.19,21 However, the current study is the first to explore and observe a significant association between the PSQ and SMEP, suggesting that the PSQ may reflect functional pain sensitivity.
The SMEP represents a functional correlate of activity-induced pain summation in individuals experiencing pain.14,15 It is suggested that repetition-induced summation of pain during physical movement is linked to CS.39–41 Similarly, the PSQ was proposed to evaluates sensory facilitation through imagined painful scenarios, aligns with CS processes. 19 Thus, the modest association between the PSQ and SMEP suggests that these measures may be useful for assessing sensory facilitation related to CS.
Surprisingly, no association was observed between the PSQ and QST measures (i.e., PPT and TS) in the current study. This finding is supported by a recent systematic review showing that the PSQ had a weak association with PPT and a negligible association with TS. 42 However, the systematic review interestingly highlighted strong association of the PSQ with phasic heat and tonic cold stimuli, indicating its potential to predict responses to specific pain modalities. 42 In this study, age and BMI showed a significant association with the PSQ. The modest associations between PSQ scores, age, and BMI should be interpreted cautiously, as they may reflect broader influences on self-reported pain perception rather than construct-related effects, and do not necessarily undermine the measure's construct validity.
Previous studies have reported stronger association between the PSQ scores and pain intensity ratings at the pain threshold (e.g., pain at PPT), with coefficients reaching up to 0.7.16,19,37,38 However, the present study did not assess pain intensity at the PPT, which may have limited the exploration of potential relationships between the PSQ scores and pain intensity at threshold levels. Notably, studies have also shown that the PSQ predicts suprathreshold experimental pain, such as heightened responses during the cold pressor test, suggesting that the PSQ may primarily reflects pain facilitation rather than thresholds. 43
The current findings showed no association between the CSI scores and other measures of sensitization. Consistent with our findings, previous research has reported a lack of association between the CSI scores and QST measures in individuals with musculoskeletal pain.44,45 In shoulder pain in particular, Coronado and George found no statistically significant associations between the CSI and QST. 16 Additionally, a recent systematic review advises caution in interpreting data derived from the CSI, as there is currently insufficient evidence supporting its validity as a measure of CS.42,46 These findings highlight the necessity for further research to substantiate the CSI's role in assessing CS mechanisms in individuals with shoulder pain.
The CSI was developed to screen for central sensitivity syndromes (e.g., fibromyalgia, temporomandibular disorder, and migraines) and their associated psychological aspects.17,18,47 Findings from previous studies suggested that the CSI may primarily capture symptomatology and psychological dimensions linked to CS, rather than directly measuring underlying CS mechanisms.18,47 The CSI scores can distinguish individuals with chronic musculoskeletal pain from pain-free controls and are strongly associated with psychological constructs such as anxiety, depression, and stress42,47,48
Interestingly, the current results indicated that higher PSQ scores were associated with increased pain severity during movement (i.e., MEP), but not with spontaneous pain. In fact, previous data showed that suprathreshold heat pain response was found to predict MEP but not spontaneous pain after induction of delayed-onset muscle soreness in the healthy population. 49 An explanation could be that measures of spontaneous pain that do not involve physical movement may not provide the best index of an individual's pain experience, particularly the repeated nature of physical movement associated with the performance of work-related duties. 14
It is suggested that changes in pain during repeated movement may reflect a distinct pain dimension, differing in mechanisms and prognostic value from spontaneous pain.14,30,50 Evidence shows that central pain mechanisms contribute to movement-evoked pain (MEP) in individuals with persistent musculoskeletal conditions, with QST measures correlating with MEP paradigms such as the timed-up-and-go and 6-min walk tests.14,39 Additionally, movements perceived as threatening can influence central pain processing through cognitive and emotional responses. 14 This aligns with the notion that the PSQ focusing on imagined painful scenarios, which captures cognitive and emotional dimensions of pain that often exacerbated during movement. 21
This study supports the test-retest reliability of the CSI and PSQ, confirming their consistency over time. The excellent reliability of the CSI observed in the current study aligns with findings from previous validation research, demonstrated excellent internal consistency (i.e., Cronbach's alpha of 0.88), and test-retest reliability (i.e., ICC of 0.94). 26 These findings suggest the robustness of the Arabic versions of CSI in assessing symptoms linked to CS syndromes. 26 Our data also indicates that the PSQ subscales had moderate to excellent reliability. This finding is supported by Ruscheweyh et al. (2012) who reported excellent reliability of PSQ, with high internal consistency (Cronbach's alpha >0.9). 37 Similarly, Alqarni et al. (2024) reported that the Arabic PSQ exhibited moderate to excellent reliability across its total and subscale scores (Cronbach's alpha >0.85, and ICC ranged from 0.74 to 0.8). 21 Additionally, both the Arabic versions of the PSQ and CSI exhibited acceptable levels of measurement error, reinforcing their utility in clinical and research settings.
Limitation
To the author's knowledge, the present study is the first to investigate the convergent validity and test–retest reliability of the CSI and PSQ comparing them with pain sensitivity measures among individuals with shoulder pain. However, the interpretation of the findings should be approached with caution. The cross-sectional design of the study limits the ability to draw causal inferences among the variables examined. This study used convenience sampling from social media, sports clubs, and fitness centres, which may limit the representativeness and generalisability of the findings. In addition, the sample size may also limit generalisability, and that conducting multiple correlations increases the risk of Type I error.
Another notable limitation is the gender imbalance in the sample, with a significantly higher proportion of male participants (75.5%) compared to females (24.5%), which could impact the generalizability of the results. Furthermore, since no formal classification exists for SEM%, this study adopted criteria from previous reliability research, which categorized SEM% as excellent (≤10%) and acceptable (11–30%). These thresholds were applied to interpret the results within the context of this study. A limitation of this study is that the same assessor conducted both baseline and follow-up measurements, and blinding was not possible, which may have introduced potential measurement bias despite the use of standardized procedures. Additionally, in this study the PPT was assessed only at the symptomatic shoulder, which may reflect local mechanical hyperalgesia rather than widespread sensitization. However, TS and SMEP were also assessed to provide insight into central pain facilitation mechanisms.
Clinical implication
The findings of this study have important clinical implications for the assessment and management of patients with chronic shoulder pain. The association between the PSQ and SMEP highlight the potential utility of the PSQ in identifying patients with heightened pain sensitivity during functional activities. This can inform treatment decisions and prioritize interventions aimed at improving functional capacity and quality of life. However, clinicians should use the CSI and PSQ cautiously and consider supplementing it with objective measures (i.e., QST and SMEP) to gain a more comprehensive understanding of sensitization in this patient population.
Future research
Future research should address the limitations identified in this study to enhance the understanding of pain sensitivity measures and their clinical utility. Longitudinal studies are needed to establish causal relationships between self-reported measures, such as the CSI and PSQ, and shoulder pain characteristic. Future research should also include more balanced and diverse participant demographics, particularly regarding gender, to improve the generalizability of findings. Additionally, Future studies should investigate the predictive value of the PSQ for suprathreshold pain responses across different experimental pain models to clarify whether the PSQ primarily reflects pain facilitation rather than pain thresholds.
Conclusion
The PSQ demonstrated modest associations with SMEP measures and moderate-to-excellent test–retest reliability. In contrast, the CSI showed no associations with other sensitization measures (i.e., PPT, TS, SMEP), suggesting that the CSI may capture related but distinct constructs rather than directly measuring CS. Further research with diverse samples and longitudinal designs is recommended to optimize the clinical use of these tools in comprehensive pain management strategies.
Footnotes
Acknowledgements
Not applicable
Ethical approval and informed consent
Ethical approval for the study was obtained from the Human Research Ethics Committee at the Faculty of Medical Rehabilitation Sciences, King Abdulaziz University (Reference No. FMRS-EC2023-020).
Consent to participate
On the day of testing, written informed consent was obtained from each participant prior to data collection.
Author contributions
Dr Rani Othman and Dr Abdullah Alqarni conceptualized and designed the study and supervised the research. Abdullah Alqarni collected the data, and Dr Rani Othman performed the analyses and drafted the manuscript. Both authors interpreted the results and approved the final version.
Funding
The authors disclosed receipt of the following financial support for the research, authorship, and/or publication of this article: This Project was funded by the Deanship of Scientific Research (DSR) at King Abdulaziz University, Jeddah, Saudi Arabia under grant no. (IPP: 691-883-2025). The authors, therefore, acknowledge with thanks DSR for technical and financial support.
Conflicting interest
The authors have no conflict of interest to declare.
Data availability
The data that support the findings of this study are available from the corresponding author upon reasonable request.