
Abstract
Ongoing expansion of early education services in the United States is often rooted in these programs’ contribution to development that promotes later academic and behavioral competence. Multi-tiered systems of support (MTSS, sometimes referred to as Response to Intervention) represent one increasingly common resource to promote desired outcomes for all children. MTSS requires seasonal screening of all students and progress monitoring of those selected for more intensive intervention. This study explores development and evaluation of measures for these uses, designed specifically to assess the language and early literacy development of 3-year-old children. Results from assessment of 449 children describe measure reliability, growth across three seasonal screenings, development of criterion-referenced benchmarks, and variations in growth for children at different levels of initial performance. Results are discussed in terms of normative versus criterion-referenced standards for building MTSS assessment systems as well as future directions for research, policy, and practice.
Keywords
Volumes of evidence indicate high-quality early childhood services benefit young children’s language and early literacy development (Barnett & Frede, 2011; Diamond et al., 2013; Lonigan et al., 2000; McConnell & Wackerle-Hollman, 2016; Molfese et al., 2009; Scarborough et al., 1991). Partly in response to this mounting evidence, the United States is witnessing growth in federal, state, and local policies and practices to provide these services to young children, particularly those most likely to experience sociodemographic or experiential variables that place them at risk for academic achievement difficulties (Afton Partners, 2019; Bogard & Takanishi, 2005; Keily et al., 2019; Lieberman, n.d.; Stipek et al., 2017).
In particular, promotion of later reading proficiency (and prevention of future reading problems) is often cited as a reason for policy and program development. This reflects the preventive and developmental significance of oral language (Dickinson & Porche, 2011; Fernald & Weisleder, 2011; Hart & Risley, 1995), phonological awareness (Goswani, 2001; Scarborough, 1998), alphabet knowledge (Piasta et al., 2021; Piasta & Wagner, 2010), and other aspects of reading skill development that occur prior to kindergarten entry.
In the United States, final decades of the 20th century and early decades of the 21st century witnessed both an expansion in the proportion of young children attending preschool programs, and policy, research, and practice efforts to monitor and improve all aspects of program quality to improve program outcomes (Azer & Morgan, 2002; Bipartisan Policy Center, 2018). As part of this development, early educators have faced a complementary need to be able to assess and differentially respond to individual children’s skills in critical domains, especially in those programs that target children’s acquisition of language and early literacy skills that contribute directly to later reading proficiency and school success (Carta et al., 2016; Greenwood et al., 2012). Early childhood multi-tiered systems of support (EC-MTSS), sometimes referred to as examples of Response to Intervention, have emerged as one promising way to provide this differentiated service (Carta & Miller, 2019).
EC-MTSS requires direct, universal, and periodic assessment of individual students’ status in acquisition of critical skills, differential grouping of children based on this assessed status, intervention that differs in intensity to meet the needs of identified students, and frequent progress monitoring to evaluate the efficacy of this intervention. Central to this approach is the efficient, reliable, and meaningful assessment of children’s current levels of performance, both during seasonal screening (typically to identify those individuals for whom supplemental intervention is needed), and for monitoring progress toward long-term goals.
Individual Growth and Development Indicators (IGDIs) have been developed to address this need (McConnell et al., 2015). Research has produced measures, procedures, and evidence of application efficacy for assessing oral language and early literacy skills of 4-year-old children who speak English (Bradfield, Besner, et al., 2014; Wackerle-Hollman, Rodriguez, et al., 2015; Wackerle-Hollman, Schmitt, et al., 2015) as well as those who speak Spanish (Durán et al., 2019; Wackerle-Hollman et al., 2020). IGDIs are examples of General Outcome Measures (GOMs; Fuchs & Deno, 1991); these are brief and repeatable measures of child developmental or academic performance that mark achievement toward a socially important long-term goal. As preschool GOMs, IGDIs are typically intended to assess status and growth of prerequisite or precursor skills for reading or mathematics competence in early elementary grades. Given this practical goal, psychometric evaluation has to be completed over time; early-stage evaluation includes assessment of measure reliability, concurrent relation to measures that predict later academic performance in the target domain, and evidence of sensitivity to growth over different intervals of time along with other validity evaluations (Rodriguez, 2010).
To date, however, the primary focus of this work has been design, evaluation, and dissemination of language and early literacy assessments appropriate for the range of performance typically seen in children the year before kindergarten entry (e.g., programs for 4-year-old students or PK4). As both universal and targeted program expansion continues in early education, more policy recommendations are calling for, and jurisdictions are enrolling children into, aligned programs that extend to 2 years prior to kindergarten (e.g., programs for 3-year-old children or PK3; Bogard & Takanishi, 2005; Keily et al., 2019). Furthermore, logical analyses and early-stage empirical investigations suggest the importance of content alignment across PK3, PK4, and K–3 classrooms while addressing the unique developmental needs of younger PK3 learners (Cohen-Vogel et al., 2021; Kelly, 1980; Stipek et al., 2017). The current level of expansion, and reasonable expectation that this expansion will continue in future years, creates a pressing need for assessments that can support EC-MTSS and are designed and evaluated to systematically support content alignment across preschool and, ultimately, primary grade years (McConnell, 2019; McConnell & Wackerle-Hollman, 2016).
Language and Early Literacy Screening for Three-Year-Old Students
At least three requirements must be met to extend language and early literacy screening to younger preschool children. First, measures must be developed or adapted to sample relevant aspects of children’s development. While it is broadly assumed that literacy development begins substantially before kindergarten enrollment (Dickinson & Neuman, 2006; Neuman & Dickinson, 2001), we also can broadly assume variation across time in the specific behaviors that mark this development, or the topography of early literacy development (Lonigan et al., 1998). As a result, measures designed and evaluated for older or more developmentally advanced children may not sample appropriate behaviors among younger children who are typically earlier in their learning trajectory.
Second, measures must be evaluated specifically for use with this new, younger population. To date, we have relatively little experience with direct, classroom-based assessment of 36- to 48-month-old children. While it is possible that this younger group can benefit from assessment features like those made available to older preschoolers, high-quality assessment requires strong evidence that the measurement context is engaging, facilitates optimal participation and consistent responding, and can be done in ways that are easy and pleasing to both the young child and early educator. Such evaluation should include both practical or logistical issues that address behavioral characteristics of 3-year-old children, as well as psychometric standards for screening and instructional decision making.
Third, standards must be set and subsequently evaluated for utility in identifying individual children for whom supplemental or more intensive intervention may be warranted. A variety of empirical approaches are available for setting these standards (Cizek & Bunch, 2007), and there are advantages and disadvantages associated with each. Much of the conceptual and practical work in MTSS has assumed standards that reliably identify three groups of children—those scoring at or above the 20th percentile (a category often referred to as Tier 1), those scoring between the 5th and 20th percentile (referenced as Tier 2), and those scoring at or below the 5th percentile (generally described as Tier 3) (Albritton et al., 2022; Jimerson et al., 2016). While perhaps conceptually compelling and likely useful for identifying children who might benefit from different levels or intensities of intervention, such an approach provides little information to assist teachers and programs interested in helping children meet specific developmental and preacademic milestones that may be more directly related to future academic and behavioral competence. Put another way, comparing an individual child’s developmental performance to normative standards does not provide direct evidence of skill attainment, but instead provides a rank-ordering that may be broadly correlated with, but quite different from, evidence of skill attainment.
An alternative approach, to be explored in the current study, is to design and evaluate measures for criterion-referenced evaluation. This approach directs judgment of individual child performance to needed developmental status, rather than normative status. Such an approach is consistent with the dominant logic of GOM (Deno, 1997; Fuchs & Deno, 1991), where the intent is to assess an individual’s progress toward achieving a socially important yet future level of expected performance. By determining criterion-referenced expectations for child performance, and then allocating instructional resources as a function of these expectations, programs can have greater confidence that intervention design and implementation will achieve expected levels of long-term outcomes for all students.
One challenge, however, in using future performance as the criterion for setting benchmarks is the time and logistical complexity of following students longitudinally for two or more years. To speed the process of standard setting, IGDI developers have adopted an iterative process (cf., McConnell et al., 2015); first, teacher judgments of child performance, collected concurrent with direct assessment, are used as indicators of developmental achievement; this reflects evidence that teachers’ summary judgments of child performance are both informed by broad observation of classroom behavior and direct experience teaching children who differ in observed behavior. Measure developers then work to enhance and refine initial standards through both consideration of concurrent and short-term predictive validity and classification accuracy analyses, and eventually by studying relations to identified long-term goals. Work described here, early in the standard-setting process, relies primarily on teacher judgments of developmental achievement.
The purpose of the present study is to examine initial evidence of growth and classification base rates for IGDI measures designed specifically for 3-year-old students. While following procedures developed, used, and demonstrated as effective in building rigorous, highly useful measures (Durán et al., 2019; McConnell et al., 2015), the research described here addressed three primary research questions:
Method
Participants
Participating children (n = 449) were recruited from 35 classrooms from local educational agencies (LEAs), a Head Start program in the Midwest, and a charter program on the East Coast. A total of 35 classrooms were included. Most children were recruited from the Midwest, including a suburban school district (n = 21 classrooms), an urban Head Start program (n = 6 classrooms), and an urban school district (n = 2 classrooms). The remaining six classrooms were from a charter preschool in a major urban area on the East coast. Children were included in the current analyses if they had completed at least one measure for any given data collection season.
Demographic information on participating children was collected through administrative data using local reporting standards from each participating program (see Table 1, missing data ranged from 6.9% to 38.3% across variables), and in general reflected typical enrollment patterns for inclusive and publicly funded preschool programs. Across all classrooms, the average child age at the start of data collection was 3.6 years (SD = .30, minimum–maximum: 3–4.4 years). The sample was 44.1% male and 49.0% female (6.9% missing). Approximately 12.2% of the sample was reported as receiving special education services with an Individualized Education Program (IEP) and approximately 15.8% of children were reported as eligible for free/reduced price lunch. The majority of the sample was identified as white (39.6%) or Black (36.7%). English was the reported primary home language for 84.2% of the sample. See Table 1 for more detail regarding reported races and ethnicities and primary home language.
Child Demographic Characteristics (N = 449).
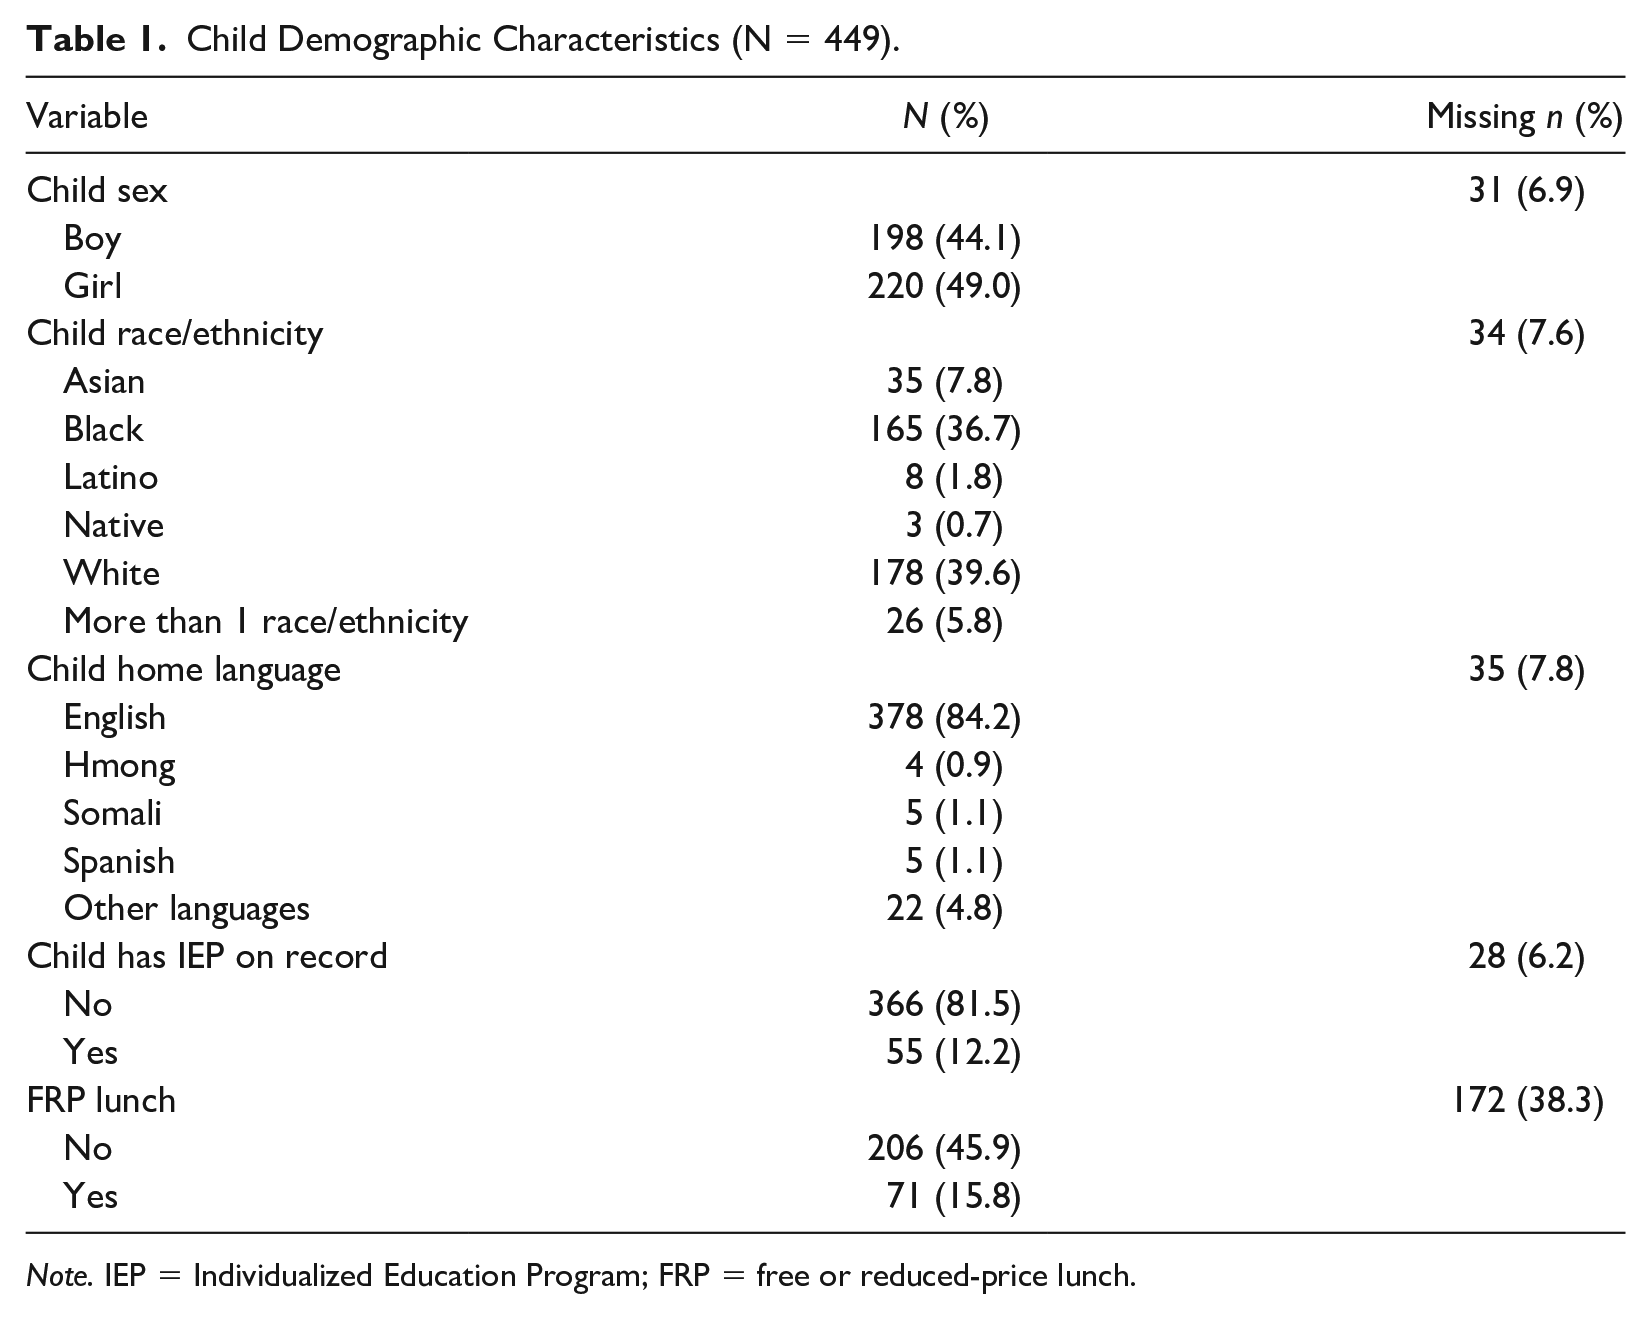
Note. IEP = Individualized Education Program; FRP = free or reduced-price lunch.
While around 15% of the sample did report a home language other than English, we only recruited children who would, by teacher report, be able to complete all assessments in English. Finally, it is important to note that we had a high percentage of missing data for the free/reduced price lunch variable (38.3%). Two of our partnering programs (i.e., urban school district, head start program) were assumed to serve a relatively high proportion of children eligible for free or reduced-price meals, but did not release this information to us. Note that the charter school program did not track this variable because all students were provided with meals. So, while 15.7% is a relatively low percentage of students eligible for free/reduced price lunch, this is likely an undercount due to missing data.
Setting
Children attended preschool programs that varied from full-day Monday to Friday sessions, to half-day, or split week sessions. Published early literacy and language curricula were used in 32 of the participating classrooms, with 24 classrooms using Creative Curriculum for Preschoolers by Teaching Strategies (Dodge et al., 2002). Instruction was delivered in English in all but one classroom (n = 34), and the remaining classroom provided instruction in English and Spanish. It is important to note that no prespecified language and literacy intervention was in place across classrooms during the course of the current study, as the study purpose was to assess growth in typical instructional environments. Rather, all participating programs continued to use curricula and instructional practices in place at study start.
Measures
The Age-3-Individual Growth and Development Indicators (IGDIs) are screening tools for measuring 3-year-old preschoolers’ language and early literacy abilities (McConnell et al., 2019). Age-3-IGDIs focus on three domains, oral language, phonological awareness, and alphabet knowledge, and can inform teachers’ instructional decisions regarding practices to support early literacy and language skills.
The Age-3-IGDIs include three measures: oral language (OL), alphabet knowledge (AK), and robot blending (Phonological Awareness; PA). The measures are untimed and administered on iPads in an assessor–child dyad. Each measure takes 2 to 5 min to administer per child.
Measure Development
All measures included here were developed systematically, following procedures detailed elsewhere (McConnell et al., 2021; Shuster et al., 2017). As with recent work and in keeping with Wilson’s (2005) model of measure development, all measure development was rooted in item-response theory generally, and Rasch modeling specifically (McConnell et al., 2015; Rodriguez, 2010). We began by specifying distinct domains for measure development; this work relied on empirical and theoretical analyses of early literacy development (National Early Literacy Panel, 2008) and review of existing curricula and assessments. Next, we tested prototypical formats, or the stimuli, presentations, and responses required by children, on small samples of preschool children. During these prototype assessments, we coded child engagement and examiners evaluated ease of both administration and scoring of child responses. These data were reviewed by research staff and collaborating early educators, and “best in domain” measures were identified. Finally, once formats were identified for each domain, a group of research staff and early educators was trained in and completed item writing for each domain. This work resulted in up to 150 items per domain to be tested in subsequent research.
Measure Administration
During administration of all receptive measures, all students’ responses are dichotomously scored as correct or incorrect. If a child did not select a response, the item was scored as no response. Measures were administered using fixed linear forms or Computer Adaptive Testing (CAT), depending on the measure and season. In the fixed linear forms, items were presented in the same order for each individual child. In the CAT forms, items were presented using an existing CAT algorithm (Wang et al., 2017) consistent with the adaptive process used for other IGDIs where each seasonal assessment began with a randomly selected item within .25 logits of the presumed seasonal benchmarks. After each child response, child ability was estimated and successive items were randomly selected from the item bank with difficulty ±.1 logit from the child’s estimated ability. All items within a given measure and item bank were calibrated, using data from prior test administrations, to a common logit scale. As a result, any forms constructed from an item bank, whether linear or adaptive, would provide ability estimates that were equated to the same scale per measure. Children completed each measure in 3 to 5 min.
In addition to analyses reported here, research with this sample included analysis of validity relations with other domain-specific measures for 3-year-olds (for more detail, see Lease et al., 2021). Convergent correlations between Age-3-IGDIs and existing measures of language and literacy including the Test of Preschool Early Literacy (Lonigan et al., 2007) r = .43 to .63, the Peabody Picture Vocabulary Test-Fourth Edition (Dunn & Dunn, 2007) r = .09 to .69, Quick Interactive Language Screener (QUILS; Golinkoff et al., n.d.) r = .42 to .60, and Get Ready to Read Revised (GRTR-R; Whitehurst & Lonigan, 2010) r = .15 to .52, demonstrated evidence for criterion-related validity (Lease et al., 2021).
Oral Language
The oral language (OL) measure contains two item types: Point to Picture (P2P) and Picture Naming (PN). P2P items are receptive and each item incudes 2 to 3 images. The assessor presents items one at a time on the child’s iPad screen and instructs the child to “point to the (target image).” PN items are expressive and each contain one image. The assessor presents the item on the child’s iPad screen and asks the child, “What is this?” Verbal responses are scored by the assessor as correct if the response is an exact match or an accurate extension of the correct response (e.g., if a child says “picture frame” when the correct response is “frame” and the image is of a picture frame, the item is scored as correct).
Alphabet Knowledge
The Alphabet Knowledge (AK) measure includes four item types concurrently calibrated to a single scale: Letter Find (LF), Letter Orientation (LO), Point to Letter (P2L), and Letter Naming (LN). LF has receptive items, each with two symbols or shapes (e.g., circle, question mark) and one letter. The assessor presents the symbols and letter on the child’s screen and instructs the child to “point to the letter.” LO has receptive items, each with three images of the same letter oriented in different directions. The assessor presents the letter images on the child’s screen and instructs the child to “point to the letter that’s the right way.” P2L has receptive items, each with three letters. The assessor presents the letter images on the child’s screen and instructs the child to “point to (target letter).” LN items are expressive and each contain one letter. The assessor presents the letter on the child’s screen and asks the child “What letter is this?”
Phonological Awareness (Robot Blending)
The Phonological Awareness (PA) measure (Robot Blending) has one receptive item type. The measure first introduces “IGDI” as an image of a robot on the child’s iPad and a recorded voice explaining IGDI “talks funny.” IGDI speaks words in segments to expose children to the speech format used in the measure. Items have 2 to 3 images each. The assessor presents and labels each image as it appears on the child’s screen (e.g., rake, shovel, road). The assessor asks the child “What is IGDI trying to say?” and presses a button to play a recorded clip (e.g., r/a/ke).
Procedures
Graduate research assistants trained assessors to administer and score the Age-3-IGDIs measures. During a 3-hr training session assessors learned about the project and the measures, viewed demonstrations of how to administer the measures, and practiced administration. Assessors had to demonstrate greater than 90% fidelity on each of the three measures before they were allowed to collect data in the field. Graduate research assistants also observed assessors in the field once per season to check fidelity.
Age-3-IGDIs were administered to children in the fall, winter, and spring of the academic year. Trained graduate research assistants and data collectors met with children individually during the school day and administered assessments in hallways or empty rooms near children’s classrooms. Children did not have to complete all three measures in one sitting and were allowed to take breaks as needed.
In the fall, children saw 27 to 28 OL items in one of three fixed forms, 25 AK items selected by the CAT algorithm, and 25 PA items also selected by the CAT algorithm. In the winter, children saw 25 items in CAT for each measure. In the spring, children saw 25 OL items in CAT. For spring AK and PA, classrooms were randomly assigned to one of two groups: (1) fixed AK form and CAT PA form or (2) fixed PA form and CAT AK form. All spring AK and PA forms had 25 items each.
Data Analysis Plan
To answer research question 1 regarding the measures’ provision of reliable estimates of child performance, we first estimated an average measurement error, an index of unreliability, for each measure and season using the individual standard errors (SE) associated with children’s ability estimates. IGDI scores (generically referred to as ability or theta scores) were estimated via unidimensional Rasch models that were established in a previous study and integrated into the assessment administration system (McConnell et al., 2021). These models also produced child SE. The average error was calculated as a root mean square error,
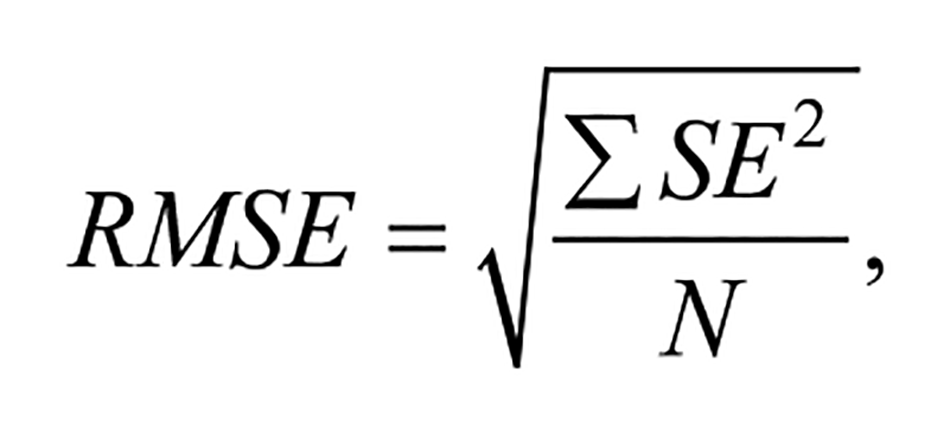
with the summation happening across all N children within a measure and season. A proxy for an overall reliability by measure and season was then calculated as
Following estimates of measure reliability, we estimated criterion-referenced cut scores for each measure for each season. Following recommendations of Cizek and Bunch (2007), we employed a contrasting groups design to identify IGDI scores that optimally differentiate children identified by their teacher as being in need of intervention (candidates for Tier 2/3 intervention) from those children the teacher estimated were successful in the current curriculum (i.e., candidates for continued Tier 1 instruction). Analyses were based on receiver-operating characteristic curves (ROC) which compared the proportions of children judged by teachers as having some need for instructional intervention (Tier 2/3) vs. not (Tier 1), across the ability scale and IGDI scores.
These cut scores were then used to form three categories of individual student performance, rooted in conceptual and practical applications of MTSS (cf., Carta & Miller, 2019). Past research with 4-year-old students suggested that developmental achievement alone was insufficient to directly assign individuals to “need for intervention” groups (Bradfield, McConnell, & Wackerle-Hollman, 2014). Instead, we worked to increase reliability of decision-making by using empirical cut scores and SEM confidence intervals to form three groups: Children scoring more than 1 standard error of measurement above the cut score were assigned to a “Tier 1/Above the Benchmark” category, children scoring more than 1 standard error of measurement below the cut score were assigned to a “Tier 2 or Tier 3/Intervention” category, and children scoring within 1 standard error of measurement above or below the cut score were assigned to a “Cut Range/On Watch” category to indicate that more information would be needed to determine an appropriate level of intervention.
To answer research question 2 on general growth across the school year for the full sample, we estimated unconditional longitudinal models for each measure. The base model included a fixed main effect for intercept and a linear slope over time. IGDI scores were standardized by measure (i.e., converted to z-scores with mean 0 and standard deviation 1). Although the three administration seasons can be rounded roughly to fall, winter, and spring, we coded time as months from the starting point of October 1, 2018. This coding of time in terms of months allowed us to account for variability in administration time within seasons, which was not negligible. Months were calculated as days from the starting point divided by (365.25/12). Continuing with research question 2, the base model was extended in two subsequent models that tested the statistical significance of random effects by child for the intercept and slope (i.e., effects that allow each child to deviate from the overall main effects for intercept and slope). These models provided a general understanding of linear growth over the academic year. To directly assess reliability of change across seasons at the group level, we also conducted paired-sample t-tests by measure to evaluate change across children from one season to the next directly, from fall to winter and from winter to spring. These models aggregated the varying times of administration into distinct categorical values.
Finally, to answer research question 3 on differential growth by tier, we extended our longitudinal models from question 2 to include an indicator variable for child tier candidacy at the start of the academic year. This indicator variable was calculated using the cut score determined in research question 1, classifying each score in each season as equal to or less than this cut score (coded as 1, and indicating a possible need for supplemental intervention), versus exceeding the seasonal criterion (coded 0). To evaluate whether growth trends differed for children above versus below the fall cut score, we evaluated the interaction between tier indication and growth. A generic version of this model is shown below. Month was calculated as described above, such that an administration date of October 1 would have month = 0.
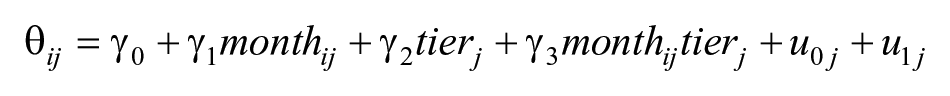
In this equation, IGDI score
All analyses were conducted in the statistical environment R (Version 4.1.2; R Core Team, 2022). Longitudinal models were fit using the lme4 package (Bates et al., 2015). Statistical significance for fixed effects was determined using two-tailed t-tests with Satterthwaite’s degrees of freedom, comparing to an alpha (type I error) of 0.01. Significance for random effects (intercepts and slopes) was determined using model fit comparisons, where a reduction in Akaike’s information criterion (AIC) for a model, compared to a less complex model that excluded a given random effect, indicated significance for that effect.
Results
Table 2 summarizes, by measure and season, distributions of IGDI scores as well as distribution of administration date, root mean square error (RMSE), and r or overall reliability. With IGDI theta scores standardized within a measure over seasons, fall means were all negative. Winter means were near or just above 0, and spring means reached 0.29 and 0.30 for PA and AK, and 0.41 for OL. SD for IGDI scores were close to 1.00, though variability was slightly less in the fall administration for OL and PA with SD of 0.85. Measures differed noticeably in their skewness, although all observed values are within typically acceptable ranges for GOMs (cf., McConnell & Wackerle-Hollman, 2016). AK demonstrated positive skew in the fall, then close to 0 and slightly negative skew in winter and spring. OL was always negatively skewed, but the absolute value of skew was more pronounced in spring. Skew for PA was always positive. Kurtosis ranged from about 2 to 5, and N counts were all close to or above 400. Fall administration dates occurred on average about 1 month after the October 1 start date, winter was approximately 4.5 months after October 1, and spring slightly more than 7 months after that date. Administrations varied by about 1/3 of a month on average from these means.
Distribution Characteristics by Measure and Season, Individual Growth and Development Indicators.
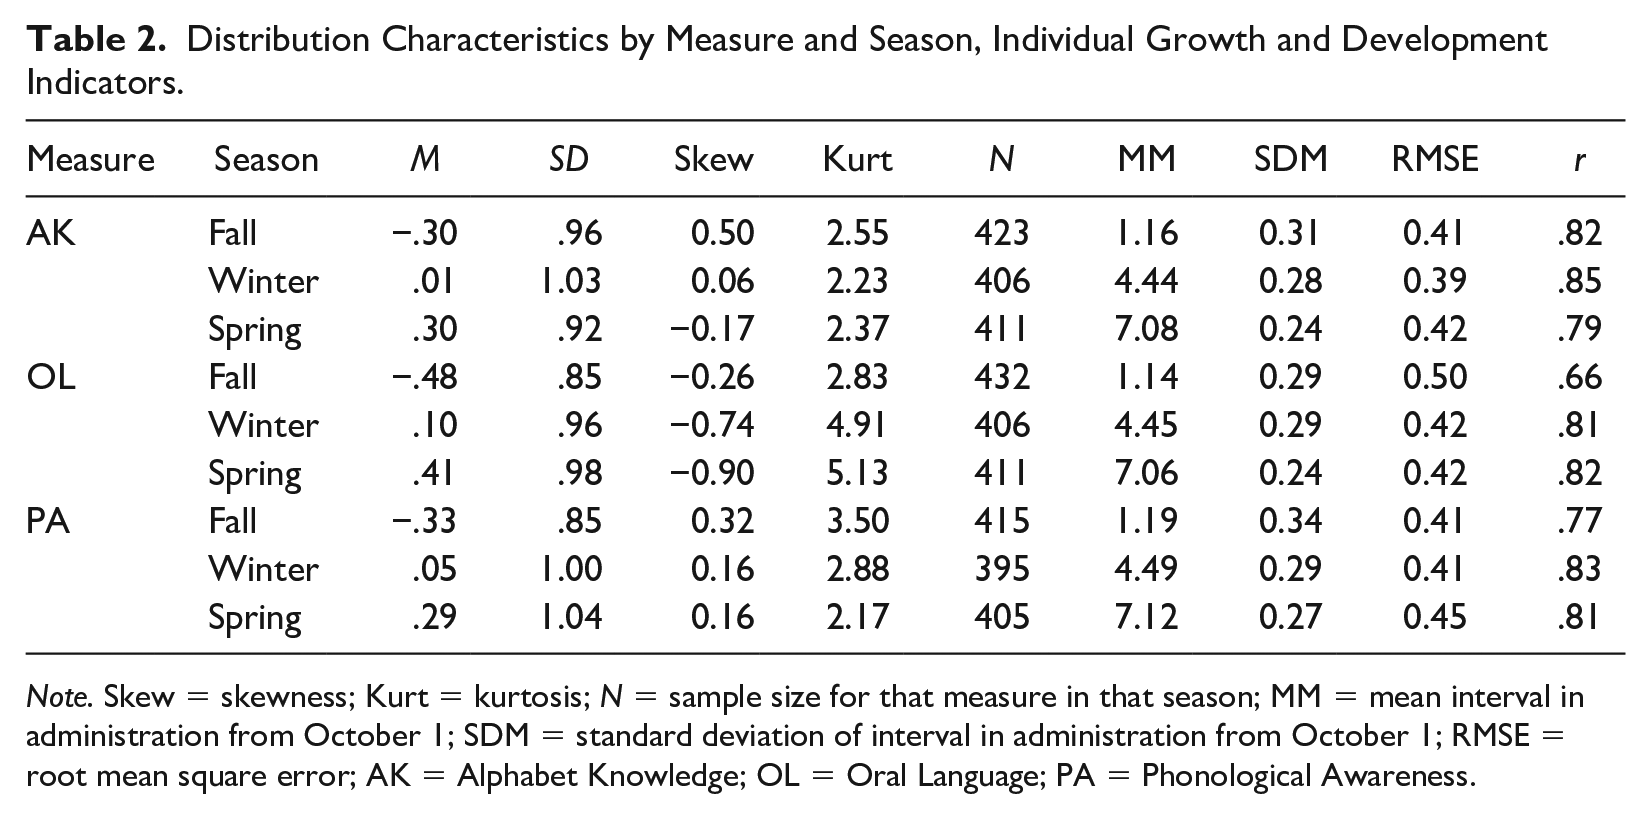
Note. Skew = skewness; Kurt = kurtosis; N = sample size for that measure in that season; MM = mean interval in administration from October 1; SDM = standard deviation of interval in administration from October 1; RMSE = root mean square error; AK = Alphabet Knowledge; OL = Oral Language; PA = Phonological Awareness.
Specifically addressing research question 1, average measurement error or RMSE ranged from a low of 0.39 for winter AK to a high of 0.50 for fall OL, with the remaining RMSE falling between these values. While smaller error is optimal, these values were determined to be acceptable based on standards from previous studies. Reliabilities (r) were also above standard thresholds for utility. The lowest reliability was 0.66, corresponding to the highest RMSE in fall OL. Remaining reliabilities were all at or above 0.75 with the largest value of 0.85 for winter AK.
Cut scores distinguishing those children who were judged by classroom teachers to be making adequate progress, versus those for whom some supplemental intervention may be warranted, were next calculated for each measure each season. Table 3 presents results, including each estimated cut score; sensitivity, specificity, and area under the curve (AUC) for this score when compared to individual teacher judgment, and numbers (percentages) of children assigned to each of three categories (i.e., Tier 2/3 scores less than 1 RMSE below cut score, Cut Range/On Watch scores within one RMSE above or below the cut score, and Tier 1 scores more than 1 RMSE above the cut score) based on the calculated cut score.
Cut Scores, Classification Accuracy, and Percentage of Students per Tier by Measure and Season.
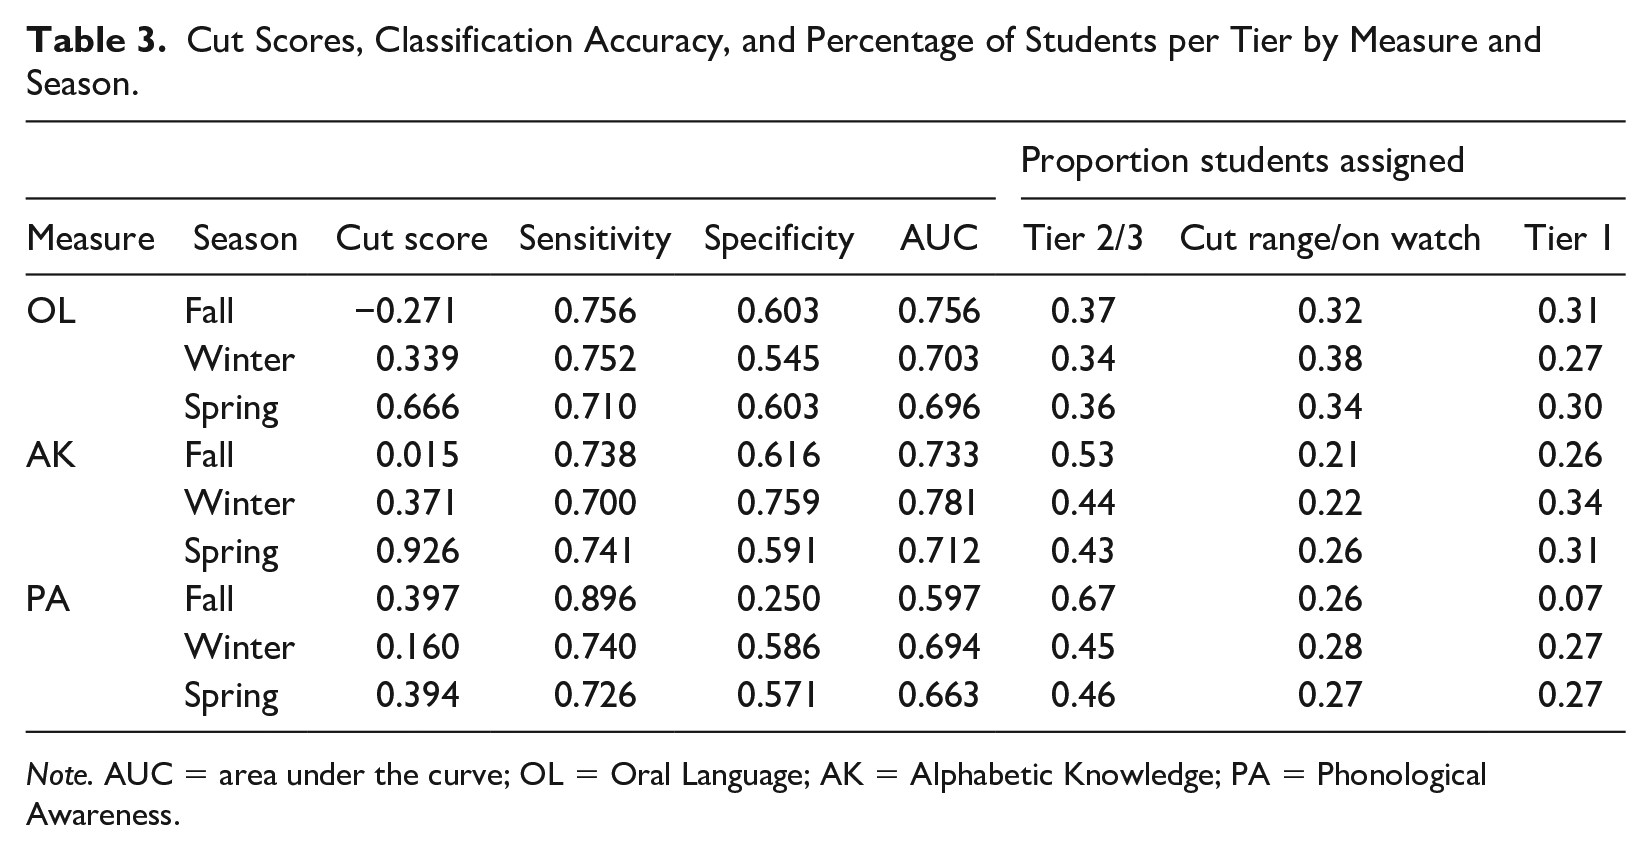
Note. AUC = area under the curve; OL = Oral Language; AK = Alphabetic Knowledge; PA = Phonological Awareness.
Addressing research question 2, results of paired-sample t-tests for all tested children confirmed that mean differences from fall to winter and winter to spring within measures were all statistically significant (all ts > 6 with df > 370 and p < .001). Seasonal comparisons by measure are presented in Table 4. Differences from one season to the next vary from slightly less than a quarter logit (Phonological Awareness, Winter to Spring) to 61% of a logit (Oral Language, Fall to Winter). As noted above, these mean comparisons essentially round the varying administration times to three discrete values.
Season-to-Season Difference, by Measure.
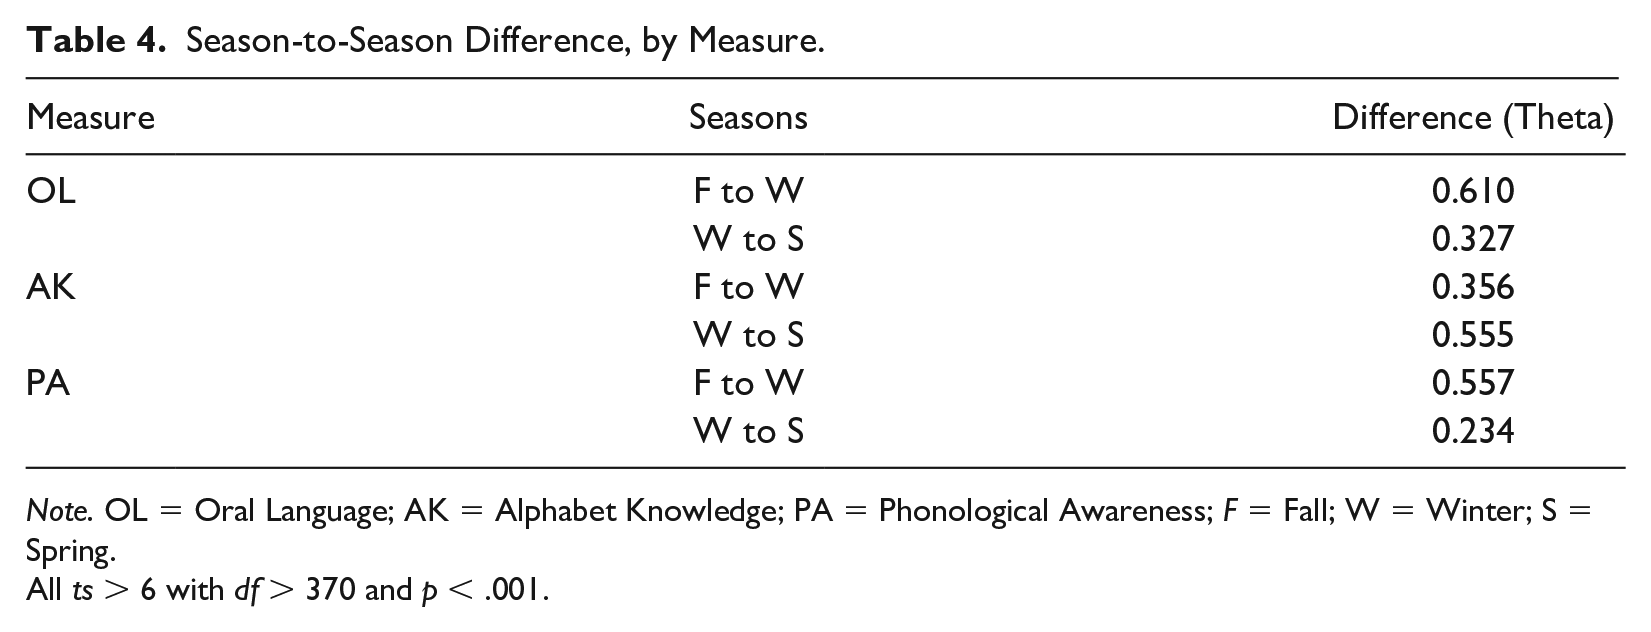
Note. OL = Oral Language; AK = Alphabet Knowledge; PA = Phonological Awareness; F = Fall; W = Winter; S = Spring.
All ts > 6 with df > 370 and p < .001.
A more comprehensive examination of growth trajectories is provided by longitudinal models that measure time on a continuous scale. Results from longitudinal modeling for question 2 are shown in Table 5. The intercept (
Longitudinal Models of Growth.
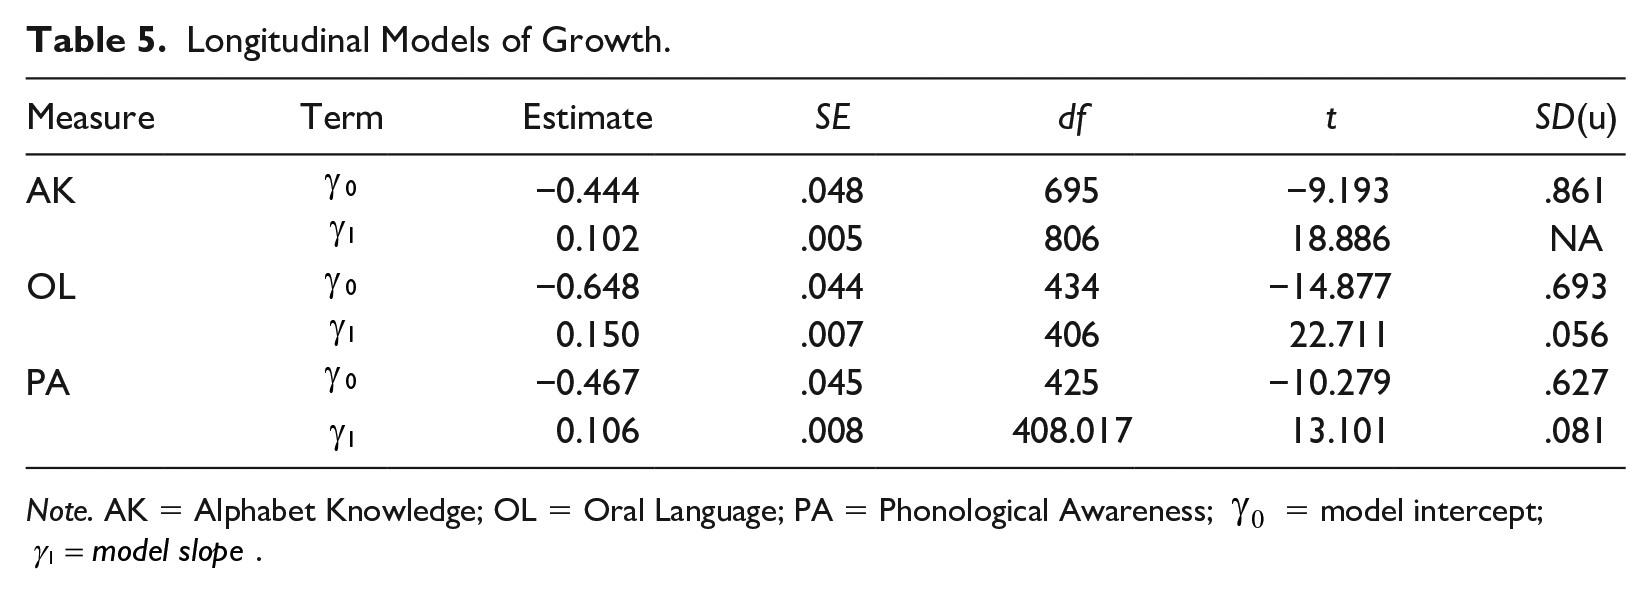
Note. AK = Alphabet Knowledge; OL = Oral Language; PA = Phonological Awareness;
The main term of interest here is the slope
The final column in Table 5 shows the standard deviation of the residual terms associated with the intercepts and slopes. For AK, standard deviation of residuals for intercept (0.861) indicates that individual children’s growth trajectory intercepts varied on average by 0.861 around the fixed effect intercept of -0.444 for AK. In AK, the model with random slopes by child failed to converge, thus this term was not estimated; instead, growth trajectories for all children are best described by the fixed slope of 0.102. In OL, intercepts varied on average across children by 0.693 and slopes varied on average by 0.056. In PA, intercepts varied by 0.627 and slopes by 0.081. All of the residual standard deviation terms show in Table 5 were statistically significant (AIC, not shown, decreased for the models containing these terms). Residual standard errors were 0.45, 0.51, and 0.59 for the final models in AK, OL, and PA, respectively.
Building on these initial growth results, research question 3 examined differential growth by tier level. The final model for each measure from question 2 served as the starting point for testing additional terms with more complex models. Because random slopes did not improve model fit for AK in question 2, only random intercepts are included for modeling, along with the fixed effects for intercept and slope. However, random effects for both intercept and slope were retained for OL and PA.
Table 6 presents results for the intercept and slope (
Longitudinal Models of Growth as a Function of Initial Tier Status.
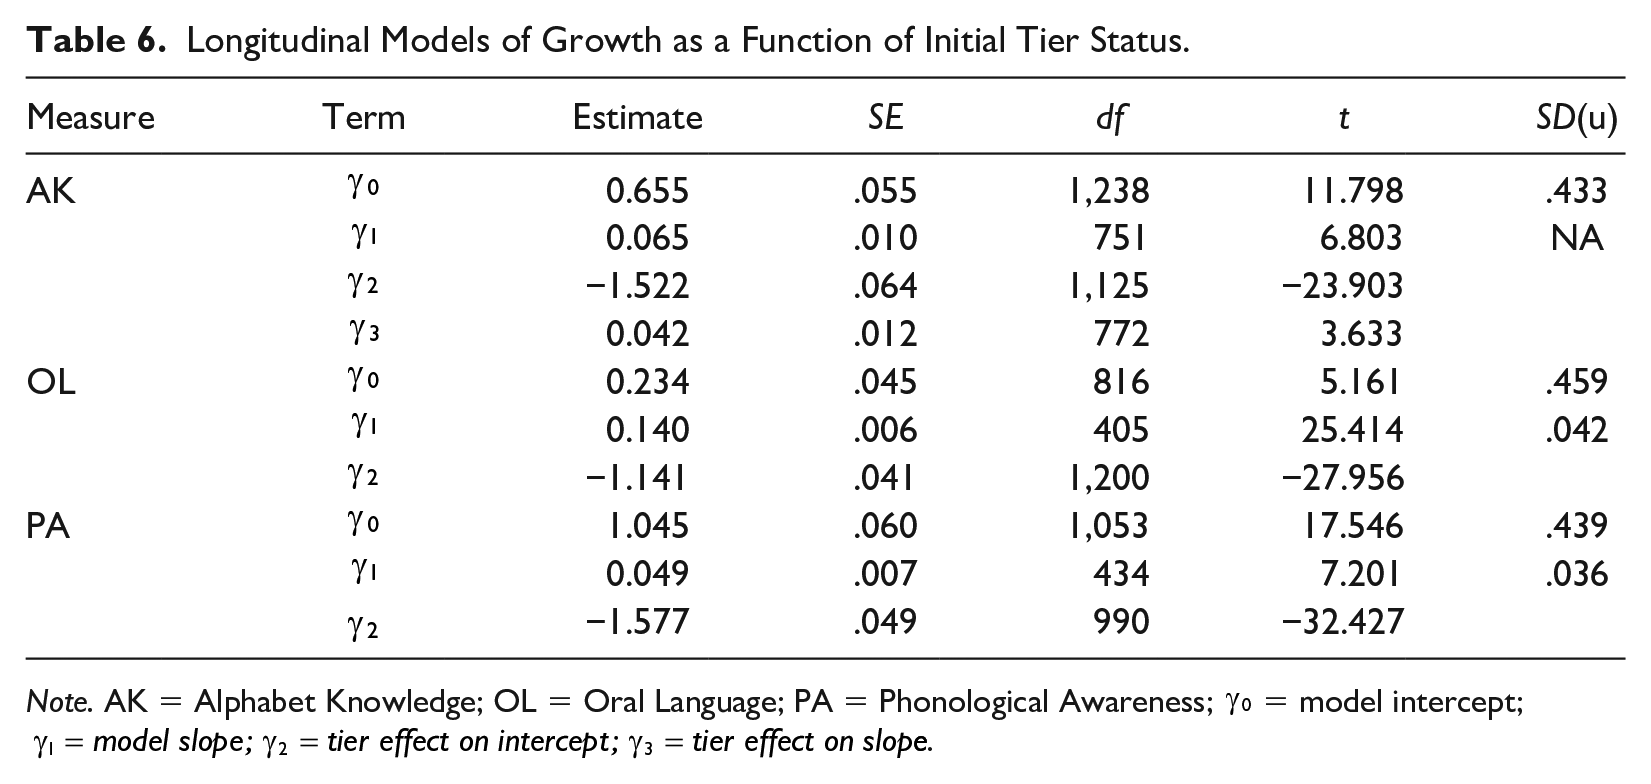
Note. AK = Alphabet Knowledge; OL = Oral Language; PA = Phonological Awareness;
The interaction term for tier status and growth
Discussion
The purpose of this investigation was to evaluate both psychometric features and likely practical utility for measures of language and early literacy development intended for use with younger preschool children (i.e., those serving children two full years before being age-eligible for kindergarten enrollment). This study used teacher judgment as an initial criterion for identifying students who may not have been making sufficient developmental growth to meet future desired outcomes in early literacy. Psychometrically, work presented here was intended to evaluate the degree to which child performance in three developmental domains—oral language, alphabet knowledge, and phonological awareness—could be sampled reliably using brief direct assessments in classroom settings. More practically, we investigated the extent to which these measures, if reliable, provided two essential metrics for instructional planning and evaluation: First, to what extent are the measures sensitive to growth over time, as would be required for any measure to be used for general outcome measurement generally and progress monitoring specifically? Second, to what extent do the measures reflect differences in growth rates across the school year for those children who perform above or below an empirical cut score of “on-track development” during their initial Fall assessment?
Item Response Theory served as foundation for design, evaluation, and application of the measures evaluated here. Evaluation of reliability of child performance estimates, across measures and seasons, yielded moderate but acceptable RMSE estimates and overall reliability estimates near or above typical criteria for individual “low-stakes” assessments of this sort. Given broad assumptions that the developmental evaluation of young preschoolers is inherently difficult and likely to be unreliable, these results offer some promise for use of these measures (along with other relevant data) to describe levels of performance in critical pre-academic domains in ways that should support differentiated intervention and accelerated growth for those children most in need.
Cut scores were estimated by contrasting students whose teachers judged them to be making adequate progress in the assessed developmental domain from those children who teachers judged to be in need of supplemental services to meet an “adequate progress” criterion. Results indicated that of students in this sample, 66% to 93% students were scoring at levels below standards based on teacher evaluation of developmental progress, with 34% to 67% of children (M = 45%) scoring more than 1 standard error of measurement below cut scores of “adequate progress” across measures and seasons.
This criterion-referenced standard-setting procedure led to rates of candidacy for supplemental service that differ markedly from those reported by Albritton et al. (2022), whose estimates were based on common normative standards used in previous MTSS work. At least three factors may account for the higher base rates of candidacy for supplemental intervention reported here. First, it is expected that children enrolled in publicly funded preschool programs during the time this study was completed often reflect a selected, rather than general or normal, population. Like Albritton et al. (2022), this study included children from Head Start and publicly funded school district programs that are specifically designed to enroll students who will benefit from preventive services. Such selection is also common in other early childhood programs. As a correlate of eligibility criteria for these programs, it is reasonable to expect that a relatively large proportion of students would be candidates for early and preventive intervention to meet long-term developmental goals.
Second, the language and early literacy skills and domains being measured in both studies are not necessarily skills that will develop without intervention, and samples in both studies are newly enrolled in preschool programs. As a result, it may be reasonable to expect that a “need for intervention” would be detected early in students’ enrollment. This may represent a departure from the logic of seasonal screening in MTSS programs for older students; in particular, rather than representing a need for intervention associated with deficits compared to peers or norm-referenced standards, lower performance here may represent the importance of explicit and ongoing intervention for most children. As such, evaluation of fall assessments going forward might better be conceptualized as baseline estimates of child development, useful for monitoring progress for individuals and groups as the school year unfolds, but with knowledge that broad “Tier 1” instructional practices in some content areas will likely be needed for many, if not most, students.
Third, effectiveness of intervention for the language and early literacy skills being assessed here may still be relatively low in typical early education programs, and as a result account for lower-than-possible rates of growth for initially lower-performing children. As core and supplemental intervention resources continue to improve (cf., Diamond et al., 2013), base rates (and perhaps cut scores) of criterion-referenced models may need to be updated.
Contrasting results from norm-referenced standards like those used by Albritton et al. (2022) and analyses reported here present a conceptual and potentially important policy and practical issues for early education programs. At a basic level, how should need for supplemental or intensive intervention be determined? While normative standards represent one approach, an argument can be made for additional validity evidence demonstrating that population-level norms are related to short- and long-term outcomes of interest. Other concerns arise when using normative bases for evaluation, including appropriateness of the underlying norm sample for interpreting performance of some children and groups. It also may be useful to more fully define, and then evaluate, the relation between normative evaluation standards and “competence.” While it is intuitively compelling that children at higher ranks in any skill distribution are more likely to meet absolute standards for competence, it would help to have both general analyses that buttress this claim and evidence of the specific rank that is associated with that competence.
Different, but perhaps similarly important, questions may arise from a criterion-referenced approach like used in the current study. As reported in Table 3, large proportions of participants in the current study were evaluated as performing below a level of “adequate progress.” Typical models of differentiated intervention are not well designed to respond to substantial percentages in any classroom needing “more intensive” intervention, and as a result these base rates may be off-putting. However, MTSS and other differentiated intervention models were designed to assure that adequate preventive and early intervention services are provided to those children who need them. While high base rates, in this study or in any practice setting, may seem daunting, they also potentially represent a clear call to action.
Descriptive review of mean scores for the entire sample across one school year suggested some degree of growth for all measures; this was confirmed both by season-to-season tests of mean differences and more robust longitudinal modeling. In the latter analyses, results indicated both mean growth across seasons for all three measures, and significant variation in individuals’ rates of growth for AK and PA. These models also indicated variation across individuals in fall assessments; while this finding is essential, for practical purposes it is a piece of evidence that is necessary but not sufficient to argue for the cross-season utility of these tools.
By elaborating these models, we finally explored variations in measure sensitivity as a function of individual children’s performance in fall, comparing those children whose scores indicated that they were making good progress toward later academic achievement to those whose scores might indicate a need for supplemental intervention to achieve later expected levels of performance. This observational analysis rested on a critical assumption that without screening results and differentiated intervention services, children initially performing at lower levels would evidence lower rates of change over time. This was only observed for AK, perhaps the one domain in this study most likely to be a target of explicit instruction in preschool classrooms.
Taken together, earlier research and development efforts and these findings provide initial support for universal screening of language and early literacy skills among 3-year-old children, in particular to support screening and differentiated intervention models like EC-MTSS. By extending purposeful data-based intervention to younger children, opportunities exist to leverage expanded enrollment in universal and targeted early education programs serving ever-younger children, and for aligning program design and intervention with both preschool and elementary programs that will serve these children. Together, individual screening and program alignment are likely creating resources to improve outcomes for all children (Carta & Miller, 2019; McConnell, 2019).
These findings also suggest future lines of inquiry. Technically, continued measure development may be appropriate to increase sensitivity to growth for oral language and phonological awareness skills and to evaluate measure utility when used repeatedly for progress monitoring. Perhaps even more pressing are opportunities to expand and develop practical applications of measures like those used here. Such work may include developing better supports, including technology applications, professional development programs, and coaching practices that expand data utilization, instructional planning, and intervention efficacy of the growing and diverse work force that serves 3-year-old children. Similarly, it is essential that we work to identify interventions that are aligned with the domains measured here and that demonstrate efficacy in promoting development in ways that in turn promote long-term academic achievement. Finally, it will likely be useful to create coordinated and efficient systems that support all features of data-based intervention (including screening, differentiated grouping and intervention planning, high-quality and high-dosage intervention), and disseminating these systems to programs, districts, and state agencies in ways that lead to broad-scale, high-fidelity implementation.
Evidence has accumulated that, under some conditions, early intervention services produce short- and long-term benefits to individual children and to their communities. Systematic efforts to expand these positive effects and to make them more routine must continue. Reliable and useful assessment tools are one essential part of this work.
Footnotes
Acknowledgements
The authors acknowledge and thank teachers and students who contributed their time and effort to this project, and the program leaders who made this work possible.
Declaration of Conflicting Interests
The author(s) declared the following potential conflicts of interest with respect to the research, authorship, and/or publication of this article: Scott McConnell, Alisha Wackerle-Hollman, and colleagues developed Individual Growth and Development Indicators, or IGDIs. Intellectual property from this research has been licensed to Renaissance Learning for commercial development and sale. These individuals and the University of Minnesota have royalty and may have equity interest in Renaissance Learning. These relationships have been reviewed and managed by the University of Minnesota in accordance with its conflict of interest policies.
Funding
The author(s) disclosed receipt of the following financial support for the research, authorship, and/or publication of this article: This work was supported by Grant Number R305A160034, Expanding Individual Growth & Development Indicators of Language and Early Literacy for Universal Screening in Multi-Tiered Systems of Support with Three-Year-Olds from the National Center for Educational Research, Institute of Education Sciences to the University of Minnesota, Scott McConnell and Alisha Wackerle-Hollman, Principal Investigators.