
Abstract
Background:
Analyze intrarater and interrater reliability for evaluating endoscopic images of velopharyngeal (VP) physiology.
Method:
Speakers produced 9 speech stimuli representing 4 stimulus types: sustained phonemes, repetitions of “puh,” single words, and short phrases. The 37-speaker participants included 16 patients with VP dysfunction and 21 control participants. Five raters independently rated the video images for degree of VP opening, location of opening, and pattern of closure. Outcome measures included intrarater and interrater measures of reliability and the effects of raters and stimulus type on ratings.
Results:
Intrarater reliability was acceptable, and ratings were logically consistent. Fixed effects regression coefficients for the patient and the control groups showed that raters were a significant source of variability for degree of opening and pattern of closing. Stimulus type was not a significant source of variation for any metric for the controls, but stimulus type was a significant determinant for degree of opening for patients. The degree of opening was larger for sustained phonemes than for the other speech stimuli. Ratings for degree of opening were most similar for repeated “puh.”
Conclusions:
Interrater reliability needs to be improved so that the assessment procedure produces more consistent findings among clinicians, thus strengthening our evidence base for this procedure. Interrater additional research is needed to understand how the stimulus affects ratings of VP physiology, to identify stimuli that yield the most useful clinical information, and to understand how training affects the ratings of VP physiology.
Introduction
Velopharyngeal (VP) endoscopy is one component of clinical evaluations of VP function and structure during speech production. These evaluations support treatment decisions for children with repaired cleft palate and for patients with VP dysfunction (VPD) secondary to disease, surgery, or trauma. The procedure requires subjective rating of visual images by a clinician. Although speech-language pathologists (SLPs) and other clinicians have been performing this examination for about 3 decades, there has been little research on the reliability of these ratings.
Measuring reliability of endoscopic image ratings and identifying factors that affect reliability are essential steps for establishing an evidence base to support endoscopic evaluation of VP closure and for implementing evidence-based practice (EBP) for VP evaluations. Evidence-based practice has played a growing role in the field of medicine since the early 1990s. Emphasis on EBP is also increasing in ancillary professions, such as psychology, dentistry, nursing, physical therapy, education, and speech-language pathology (Meline, 2006). Implementation of EBP for evaluation of VP competency requires standardized examination procedures and reliable ratings of endoscopy results. If ratings are sensitive to the speech stimuli used during the examination, implementation of EBP would also require accounting for that effect.
To support quality improvement for the ratings, it is also important to assess whether rater variations reflect random or systematic sources of variation. If variations between 2 raters are random, each rater would be equally likely to record the higher or the lower rating. If the variations are systematic, one rater would be significantly more likely to record the higher or lower rating. Distinguishing between systematic and random variation is useful because random variations suggest rater uncertainty, while systematic variations suggest that raters have idiosyncratic strategies for rating video images of speech.
To evaluate VP function, clinicians insert a flexible endoscope transnasally and position it to view the VP port. The patient is then asked to repeat specific speech stimuli. Following the procedure, examiners replay the video recording and rate the adequacy of VP movement toward closure. The content of the speech samples used in VP evaluations varies, but these samples usually contain sustained phonemes (vowels and fricatives), repeated consonant–vowel syllables such as “puh,” single words, and/or short phrases. The phoneme content of the stimuli is typically controlled to ensure sampling of vowels and consonants that challenge VP function (Kummer, 2014; Watterson and Grames, 2014). Word and phrase stimuli may be weighted with obstruents or sonorants and may or may not include nasal consonants (Watterson and Grames, 2014; Golding-Kushner et al., 1990). Some empirical studies of VP physiology employed sustained phonemes or various consonant–vowel combinations (Moll, 1962; Matsuya et al., 1974; Bell-Berti, 1976; Kuehn, 1976; Iglesias et al., 1980; Seaver and Kuehn, 1980; Kuehn and Moon, 1998). However, other authors did not report the specific speech stimuli produced by the subjects (Skolnick et al., 1973; Croft et al., 1981; Lam et al., 2006; Perkins et al., 2005; Yoon et al., 2006; Sie et al., 2008). The fact that the speech stimuli are not always reported leaves the impression that the speech stimuli are considered unimportant.
Empirical studies have reported differences in VP physiology for vowels versus consonants as well as differences within vowel and consonant categories. Although normal speakers typically close the VP port for consonant productions, they may not close the VP port for vowel production, especially for low vowels (Matsuya et al., 1974; Moll, 1962; Seaver and Kuehn, 1980). Matsuya et al. (1974) found that the vowel /a/ showed considerably more lateral pharyngeal wall (LPW) movement toward closure than /i/. Moll (1962) and Iglesias et al. (1980) reported significantly more velar displacement on high vowels than low vowels. Moll (1962, p. 34) also found that “high vowels exhibit greater VP closure than the low vowels.” Similarly, Bell-Berti (1976) found greater levator palatine activity for high vowels (/i/ and /u/) than for the low vowel /a/. For consonants, Bell-Berti (1976, p. 239) found that levator palatine EMG potentials were greater for stop consonants than for vowels and that the “area of the VP port varies directly as a function of oral cavity constriction.” In a study of VP closure force, Kuehn and Moon (1998) found greater closure force for voiceless than for voiced consonants, and Zajac and Mayo (1996) have suggested a positive relationship between closure force and intraoral pressure. Variations in the speech samples employed within and across endoscopic examinations, and published evidence of phoneme-dependent variations in VP physiology, raise the question of whether the content and reliability of visual judgments could be affected by the stimulus.
Two systems of rating VP physiology have been described in the literature. First, Skolnick et al. (1973) suggested that VP physiology could be described by assigning observed movement to 1 of 3 categories: “coronal,” “circular,” or “sagittal.” These categories differ according to the degree of movement observed in the LPWs relative to the velum. For example, the “coronal” pattern is associated with the greatest velar movement but the least LPW movement. Second, Golding-Kushner et al. (1990) proposed a system of describing movement in the VP port on a scale from 0.0 to 1.0, where 0.0 referred to 100% open with the VP port at rest. In cases where VP closure is not complete, the examiner would also rate the size of the opening and the location of the opening (Golding-Kushner et al., 1990; Watterson and Grames, 2014). Although these rating procedures were proposed many years ago, little is known about rater reliability when evaluating these metrics. Rater reliability is an important issue, because these observations constitute evidence that is frequently used in the selection of surgical procedures (Skolnick et al., 1973; Croft et al., 1981; Perkins et al., 2005).
Three early studies compared ratings of VP function based on endoscopy to ratings generated from radiography and cinefluoroscopy images. Sinclair et al. (1982, p. 113) compared the reliability of VP endoscopy to video fluorography, using a “standard set of words and syllables.” The subjects were patients suspected of VPD. Three raters individually estimated the size of the VP opening and rated the movement of the velum, LPWs, and the posterior pharyngeal wall. They found that basal view fluoroscopy and endoscopy provided more reliable information than lateral fluoroscopy. In a similar study, Karnell et al. (1983) compared the reliability of tracing a schematic of the VP port made from endoscopic images to cinefluoroscopic images. This study included 4 normal speakers who sustained isolated phonemes. They reported that the size of the VP port and movement of the velum were measured reliably for both endoscopy and cinefluoroscopy, but LPW movement was not. In a companion study, 2 raters measured tracings of the VP port at rest and during phonation (Ibuki et al., 1983). The participants were 2 normal speakers and the speech sample consisted of sustained phonemes. The authors concluded that the process of tracing and measuring photographs of the VP port was a reliable procedure.
Three more recent retrospective studies evaluated intrarater and interrater reliability more directly. The speakers in all 3 studies were patients suspected of VPD. First, D’Antonio et al. (1989) compared a group of expert raters to novice raters. The speech stimuli included single words and phrases with a variety of obstruent consonants. Velopharyngeal movement toward closure was rated on a 6-point scale, with equal appearing intervals, designed to quantify velar and pharyngeal wall movement. The pooled ratings provided by the group of experts were found to be more reliable than the ratings provided by individual novices. Second, Yoon et al. (2006, p. 948) evaluated ratings produced by 2 pediatric otolaryngologist faculty, 2 pediatric otolaryngologist fellows, and 2 SLPs. The speech stimulus was described as a “representative speech sample.” These authors concluded that intra- and interrater consistency was higher among the otolaryngology faculty than among the fellows or the SLPs. Third, Sie et al. (2008) examined interrater reliability among 16 otolaryngologists who worked in 8 different facilities. There was no description of the speech stimulus used in the study. The VP “gap size,” or opening, was rated on a category scale that included “large, moderate, small, and none” (p. 758); the opening was also rated on a 100-point linear scale with 0% indicating complete closure. For the category ratings, the overall interrater κ was 0.39, and for rating degree of opening on the 100-point scale, they reported an overall reliability coefficient of R = 0.63. For intrarater reliability, κ ranged from 0.60 to 0.70. They concluded that intrarater reliability was good but interrater reliability was only fair to moderate. All 3 studies reported that there is substantial room for improvement in interrater reliability.
Many of the studies discussed above indicate that additional research is needed. In this study, we address 3 research questions to improve our understanding of intra- and interrater reliability and support design of quality improvement efforts. Does the speech stimulus affect rater judgment and rater reliability? Is interrater variability random or systematic for rating the degree of opening and the pattern of closing? Are intra- and interrater reliability levels similar for patient versus control speakers?
This article reports the results of a prospective study designed to address these questions.
Method
Speakers and Examinations
The study included 37 speakers. Of these, 16 were patients who were referred to a cleft palate center for evaluation of suspected hypernasality and 21 were control participants with no history of hypernasality. Thirteen of the 16 patients had repaired cleft palate with or without cleft lip, 2 had neurologic etiology, and 1 had postpalatal resection for cancer. Patients with pharyngoplasty were not eligible to participate in the study. Pharyngoplasty patients were not included in our patient group to minimize interpatient variations and to allow us to focus on rater reliability and impacts of stimuli on reliability. The average age was 24 years for patients and 22 years for controls. Participant ages ranged from 9 years to 78 years. The examinations were performed by American Speech-Language-Hearing Association-certified SLPs with at least 30 years of endoscopy experience.
Speech Stimuli
Each speaker was asked to produce 9 speech stimuli: 2 sustained phonemes (/s/, /i/), the syllable “puh” repeated 5 times, 3 single words weighted with either fricatives (Suzy), stops (Puppy), or sonorants (Yellow), and 3 short phrases weighted with fricatives (Suzy sees the fish), stops (A big black cat), or sonorants (Why were you away?).
Procedure
Recordings
The procedure for soliciting speech samples from patients was the same at both centers. Each speaker practiced the speech stimuli before insertion of the endoscope. During the examination, the prescribed sequence of stimulus production was sustained phonemes, 5 repetitions of “puh,” single words, and then short phrases; however, some stimuli were captured out of sequence at the examiner’s discretion.
After each patient examination was complete, the examiner determined whether the examination was a good example of VP endoscopy and suitable for clinical diagnostic purposes. If so, the parent/guardian or patient was asked whether the examination could be used in a study of rater reliability. If consent was granted, the examination was copied to a DVD disk and stored on a Dell laptop computer. The procedure was the same for the controls, except permission to use the examination for research purposes was granted in advance of endoscopy.
When all 37 examinations were completed, the video for each speaker was split into 9 segments with one speech stimulus per segment. The video clips were copied and stored in 9 separate files, with one file storing the video clips for each speech stimulus. For example, one file contained videos generated when the speakers articulated the sustained phoneme /s/, a second file contained videos generated when the speakers articulated the sustained phoneme /i/, and so on. With 37 speakers articulating 9 speech stimuli, there were 333 potential video clips. Five of the video clips were not suitable for rating; hence, 328 clips were available for analysis. Of these, 143 were generated by patients and 185 were generated by controls. Each file contained 36 or 37 clips in which each of the patient and control speakers articulated a specific stimulus. Raters did not know whether each video clip was generated by a patient or control.
Data were collected in accordance with University of Nevada, Reno IRB protocol 666562 and Washington University IRB protocol 201503113.
Recording Equipment
The recording equipment at one cleft palate center was a KayPentax EPK 1000 processer with companion VNL-1070 STK distal chip endoscope and 9310 HD computer. At the other center, the recording equipment was a Storz 11101VN distal chip endoscope with a Storz SCB Image 1 Hub camera and a Storz 615 Xenon light source.
Raters
Each clip was rated by 5 raters working in 3 different cleft palate centers in 3 different states. Each rater had at least 11 years of experience rating VP physiology and treating patients with hypernasality.
Ratings
The 9 video files were copied to CDs and distributed to the 5 raters. The video clips stored in each file were de-identified. Therefore, raters evaluated each speech sample as a stand-alone piece of information. This experimental procedure contrasts with procedures in clinical settings, in which raters evaluate an individual speaker by examining a sequence of images. This study focuses on the reliability of ratings recorded by raters; it does not specifically address the reliability of VPD identification and associated speech disorders based on a battery of tests and information.
Each rater received written instructions detailing the rating protocol. Each rater provided 2 ratings for each of the 328 speech samples captured in the video clips, with a 2-week interval between the first and second ratings. With 5 raters rating each clip twice, the data include 3280 data points (328 video clips by 5 raters by 2 ratings each). Raters were permitted to review each video clip as often as they wished, but they were instructed not to return to a video clip after moving on to the next one.
Metrics
Ratings were recorded for degree of VP opening, location of VP opening (if observed), and pattern of VP closure, as follows:
Degree of VP opening
The original design specified that raters would rate the degree of opening relative to the size of the VP port opening during quiet breathing which was defined as an opening of 100% (Sinclair et al., 1982; Golding-Kushner et al., 1990). Thus, ratings would be recorded as a percent of the breathing opening. For example, a small opening might be rated as 5%, while a large opening might be rated as 80%. To provide the visual referent, speakers were asked to relax and breathe through the nose prior to producing each stimulus.
In practice sessions prior to collection of study data, many speakers were not able to demonstrate the expected degree of openness in the VP airway due to examination stress or surgical alteration to the VP mechanism. Therefore, the procedure was adjusted for data collection. Instead of asking speakers to breathe quietly prior to production of each stimulus, raters were asked to rate the degree of opening during speech relative to their experience with the expected size of a VP port during quiet breathing.
Raters were asked to rate the degree of opening on a 100-point scale. The 100-point scale ratings were used for the multivariate regressions. For computations of percent exact agreement and Kappa statistics, these ratings were grouped into 4 categories: very small (degree = 0%-10%), small (degree = 11%-20%), medium (degree = 21%-40%), and large (degree = 41%-100%). These categories were selected to reflect the nonlinear relationship between VP opening and speech/resonance disorders. Previous studies indicate that very small openings do not typically impact speech negatively; therefore, for the purposes of this study, persons with a VP opening in the very small category were considered to have a “functionally closed” VP mechanism (Warren and Dubois, 1964; Kummer et al., 2003; Kummer, 2014). For “small” and “medium” openings, however, speech is adversely impacted as the opening increases, but at some point the impact is maximized (large opening), and further increases are of no additional perceptual consequence (Watterson and Emanuel, 1981: Warren and Dubois, 1964; Lam et al., 2006; Bunton and Story, 2012).
Location of VP opening
Raters indicated the location(s) of each opening by marking a diagram that divided the VP port into 3 sections: center, right of center, and left of center. Because VP openings frequently involve more than one location, raters were instructed to mark all locations where any amount of opening occurred.
Pattern of VP closure
Raters indicated the pattern of VP movement toward closure by selecting 1 of 3 patterns suggested by (Skolnick et al., 1973): coronal, circular, or sagittal. Images of the 3 patterns of closure were provided with descriptions. Raters were asked to either specify one of these patterns or to indicate “I do not know” for each speech sample. It was reasoned that limiting the raters to 3 choices would improve rater reliability relative to previous studies (D’Antonio et al., 1989; Yoon et al., 2006; Sie et al., 2008).
Statistical Analysis
Intrarater reliability
Three strategies were employed to assess the internal consistency of the ratings submitted by each rater. First, the percent exact agreement was calculated between first and second ratings recorded by each rater, for each metric in the patient and control groups. Percent exact agreement for the degree and pattern categories is reported for the full patient and control groups. For the metrics indicating location, percent exact agreement is reported for subgroups of patients and controls in which the rater indicated that the degree of opening exceeded zero. This procedure conforms to the clinical practice of only indicating a location when there was incomplete closure.
Second, descriptive statistics indicate the extent to which rater assessments of degree of closure are consistent with the expectation that patients close less often than controls (Watterson and Grames, 2014). We used a 2-sample t test to test for differences between the number of control video clips rated as a “very small” opening (degree ≤10%) versus patient video clips.
Third, descriptive statistics were used to determine the extent to which rater assessments for each speaker were logically consistent across metrics. Logically, relatively “large” openings would be expected to spread across more locations (left, center, and/or right) than smaller openings. Similarly, if a rater indicated that the opening had degree equal to zero, then it would be expected that no location would be indicated. If a rater indicated a very small degree of opening, a logically consistent rater would have indicated a small number of locations.
Interrater reliability
We used 2 strategies to examine interrater reliability: Kappa statistics and multivariate regression. The first set of ratings provided by each rater was used to implement both strategies.
Kappa statistics (κ) were computed to measure the degree to which interrater agreement exceeded the level of agreement expected to occur if the ratings were assigned randomly. Perfect agreement between raters would generate κ = 1.0, whereas a level of agreement equal to the level expected by chance would generate κ = 0.0. Kappa statistics are usually interpreted for clinical significance. We used the (Viera and Garrett, 2005) scale to interpret the Kappa statistics. This scale categorizes interrater agreement as slight (κ = 0.01-0.20), fair (κ = 0.21-0.40), moderate (κ = 0.41-0.60), substantial (κ = 0.61-0.80), or almost perfect (κ = 0.81-0.99).
We report Kappa statistics separately for controls and patients. Kappa statistics were computed for the 4 categories indicating the size of the opening and the 3 categories (coronal, circular, sagittal) indicating the pattern of the closing, using the full patient group and the full control group. For the bivariate location metrics, Kappa statistics were computed for the patient and control subgroups for which incomplete closure was indicated by at least one rater for each video clip.
Multivariate regression results for the patient and control groups were used to test whether the variations across raters stemmed from a random or systematic source, and whether stimulus type exerts a significant impact. These regressions include speaker fixed effects (FE). All tests of statistical significance were 2-sided tests with P ≤ .05.
Results
Intrarater Reliability
Intrarater percent exact agreement was acceptable for both patient and control ratings. For degree category, the percent exact agreement was 74% for patients and 97% for controls. The percent exact agreement for the location variables ranged from 81% to 85% for patients, and 88% to 95% for controls. The percent exact agreement for the pattern metric was 79% for patients and 81% for controls.
Within-rater ratings were also logically consistent across the patient and control groups and across metrics. Consistent with expectations, each rater indicated a “very small” opening (degree ≤10%) for a larger proportion of controls than for patients. The difference between the proportions of control and patient video clips that were rated as very small was significant for each rater, with t-statistics ranging from t = 9.4 to t = 16.5.
In addition, ratings for the estimated degree of opening and the number of locations associated with the opening exhibited a logical relationship between the 2 variables. The data on first and second ratings, for both patients and controls, indicated that larger degrees of opening corresponded with increased numbers of locations. When a rater recorded that the degree of the opening was very small (degree ≤10%), that rater also indicated that the number of locations was equal to zero for 76% of the video clips, and it was equal to 1 for 18% of the clips, and equal to 2 or 3 for only 6% of the clips. When raters recorded that the degree of the opening was small (degree = 11%-20%), they indicated that the number of locations was equal to 2 or 3 for 59% of the video clips. The percentage of clips with 2 or 3 locations indicated increased to 73% when raters indicated that the degree of opening was medium (degree = 21%-40%), and increased it to 89% when the degree of opening was rated as large (degree >40%).
Interrater Reliability
For the degree metric, Kappa statistics were 0.12 for controls and 0.29 for patients. Kappa statistics for the 3 location metrics ranged from 0.10 to 0.14 for controls and 0.29 to 0.34 for patients. For the pattern metric, κ = 0.19 for controls and κ = 0.16 for patients (Table 1, Panel A).
Interrater Agreement.a
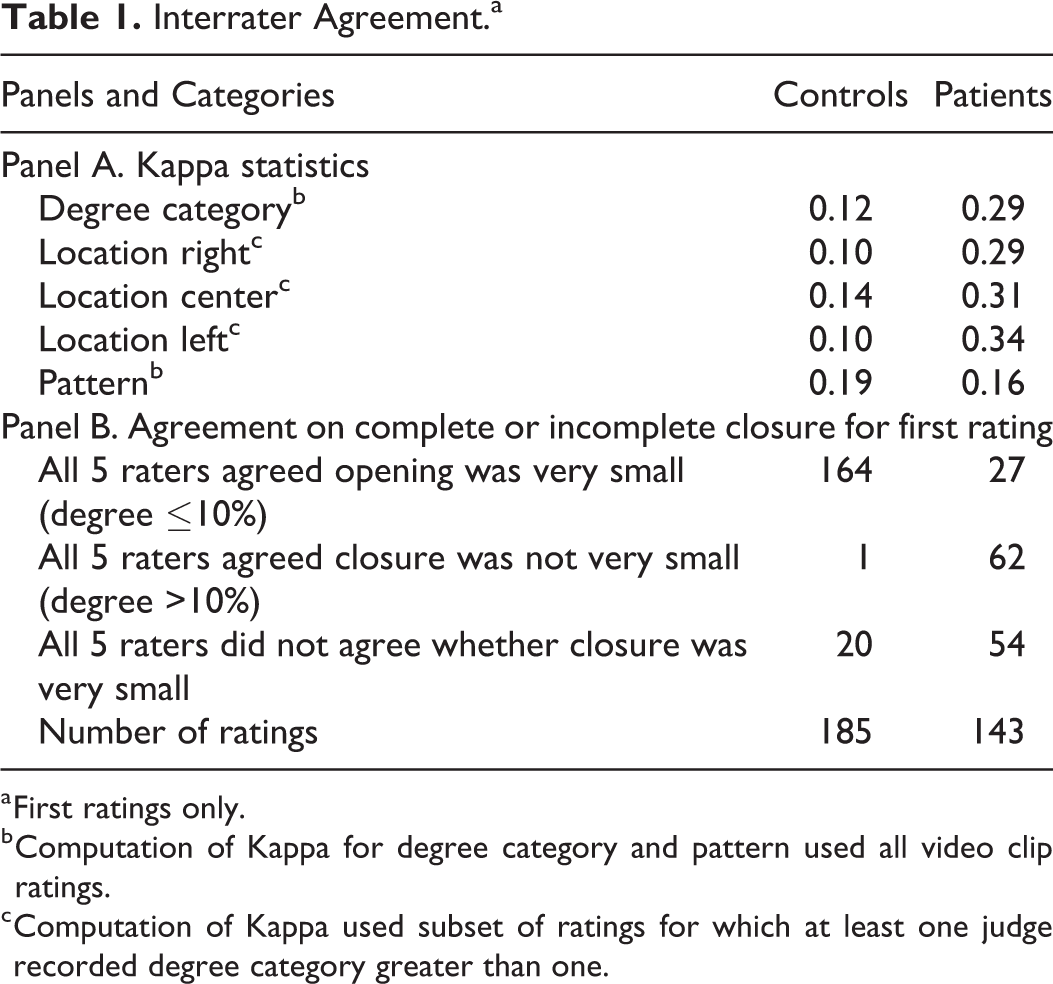
a First ratings only.
b Computation of Kappa for degree category and pattern used all video clip ratings.
c Computation of Kappa used subset of ratings for which at least one judge recorded degree category greater than one.
These values lie in the slight and fair ranges. For the control group, it is possible that the low values of Kappa could stem from the Kappa paradox described by Falotico and Quatto (2015). These authors showed that low Kappa statistics can occur in the presence of high levels of percent exact agreement if the proportion of ratings that fall in one category is greater than 90% or less than 10%. For controls, 97.5% of the ratings fell in the “very small” degree category and only 8.6% of the ratings fell in the sagittal pattern category. These percentages suggest that we cannot rule out the possibility that the low Kappa statistics for the controls reflect the Kappa paradox, rather than lack of interrater agreement. Consistent with this hypothesis, all 5 raters agreed that the degree of closure was “very small” or all 5 raters agreed that it was not “very small,” for 89% (165/185) of the 185 first-rating video clips for controls (Table 1 Panel B).
Descriptive statistics indicated greater disagreement among raters for the data generated by patients. For example, all 5 raters agreed that the degree of closure was either very small or not very small, for only 62% (89/143) of the first ratings of video clips for patients.
Figure 1 provides a second example of interrater variations for patient-generated video clips. The figure illustrates interrater variation in perceptions of the pattern of closing for the patient speech samples. The coronal pattern was selected by rater 5 for 89% of the video clips, but rater 1 selected this pattern for fewer than 50% of the clips. The circular pattern was selected by rater 1 for 52% of the clips, but it was selected by raters 2 and 5 for only 7% and 11% of the video clips, respectively. The sagittal pattern was selected by rater 2 for 38% of the clips, but it was rarely selected by the other raters. These descriptive statistics suggest systematic variations in rater perceptions of the closure pattern.
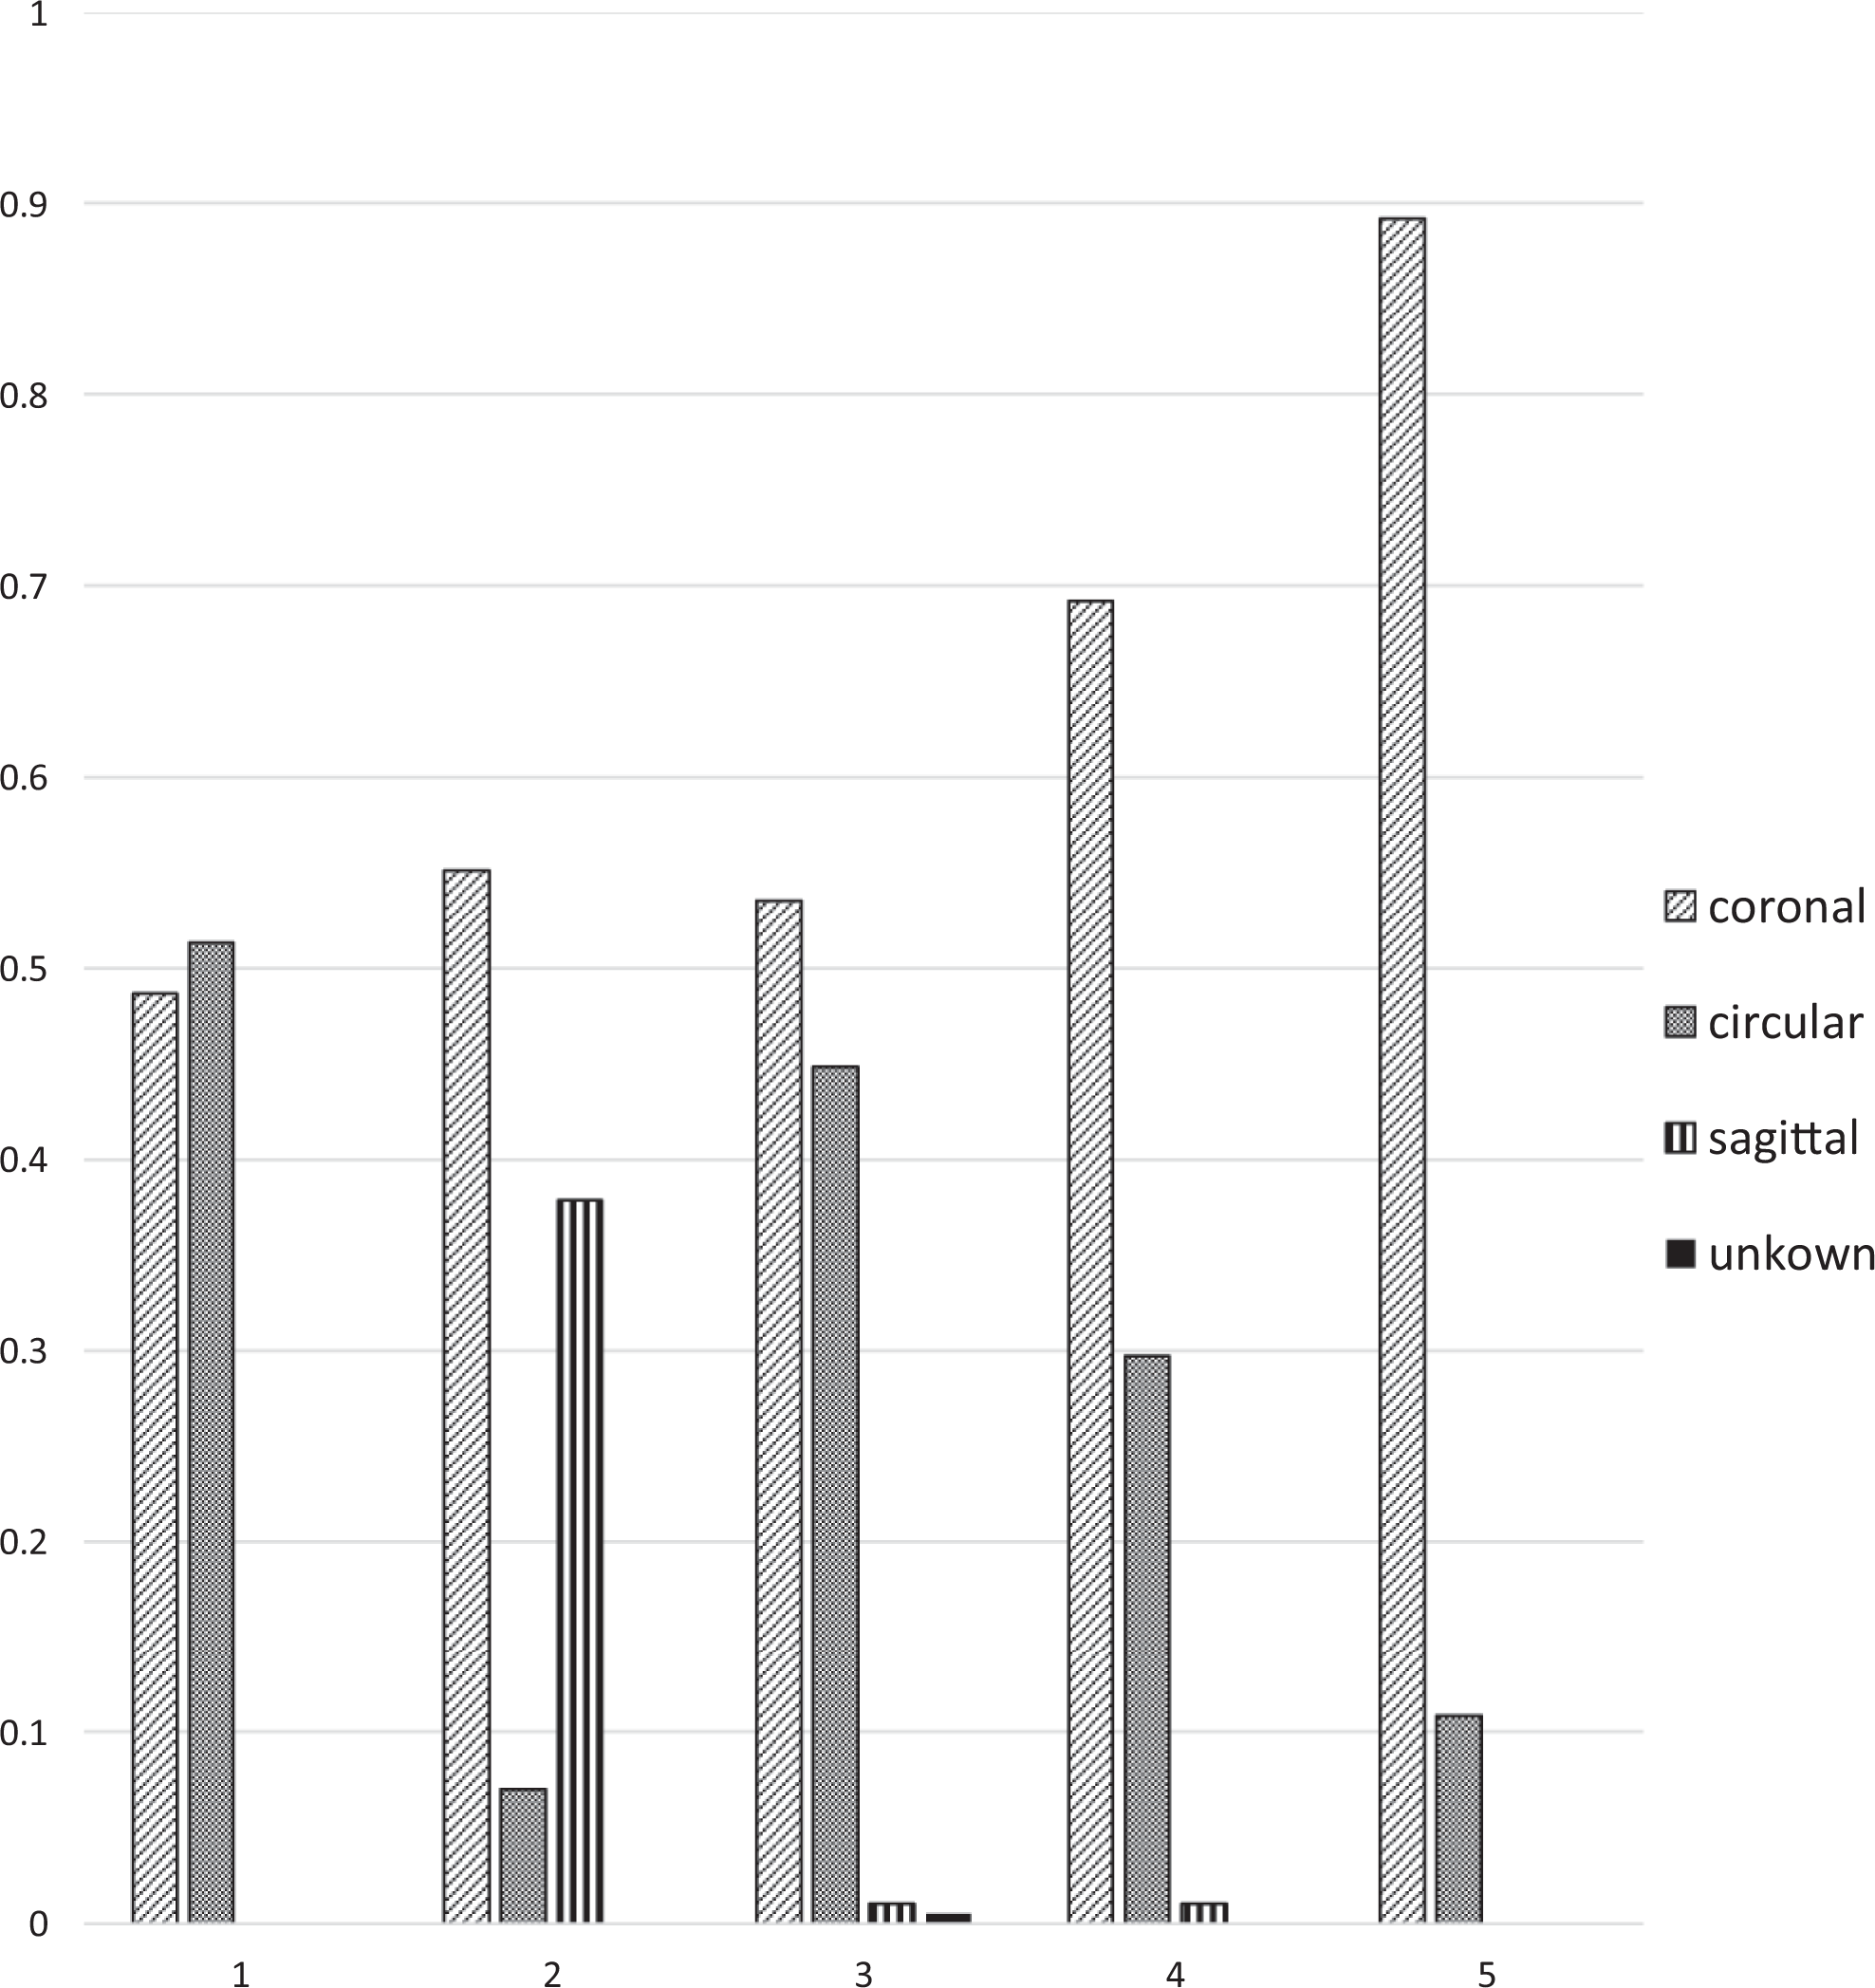
Rater perceptions of patterns. Percent of ratings in each pattern category, by rater (patients only; first ratings).
Fixed effects regressions were estimated for the control and patient groups using first ratings only. The dependent variables represented the degree of opening (using the 0-100 point scale) and the presence of coronal and circular patterns. Regressions were not estimated for the location variables due to the reduction in sample size necessitated by the fact that location is only relevant when the opening is greater than 10%. Regressions were not estimated for the sagittal pattern due to the small number of ratings indicating this pattern.
The independent variables included in each regression equation include 2 sets of binary variables indicating the rater and the stimulus type. In each regression, it was necessary to omit one of the binary variables indicating raters and one of the binary variables indicating stimulus type, to avoid inclusion of redundant variables. Once 4 binary variables were included to indicate whether the rater was number 1, 2, 3, or 4, it was clear whether the rater was (or was not) number 5. It was not necessary, therefore, to include a fifth binary variable to indicate whether the rater was number 5. The same logic holds for binary variables indicating whether the stimulus was, or was not, sustained phonemes, repeated “puh,” words, or short phrases. The independent variables in the regression equations reported in Tables 2 and 3 included indicator variables for sustained phonemes, repeated “puh,” words, and phrases. Therefore, the coefficients reported in Tables 2 and 3 compare ratings recorded by raters 1 to 4 to those recorded by rater 5, and they compare ratings of speech samples generated using sustained phonemes, words, and phrases to those generated using repeated “puh.”
Impacts of Raters and Stimuli on Ratings for Controls.a,b
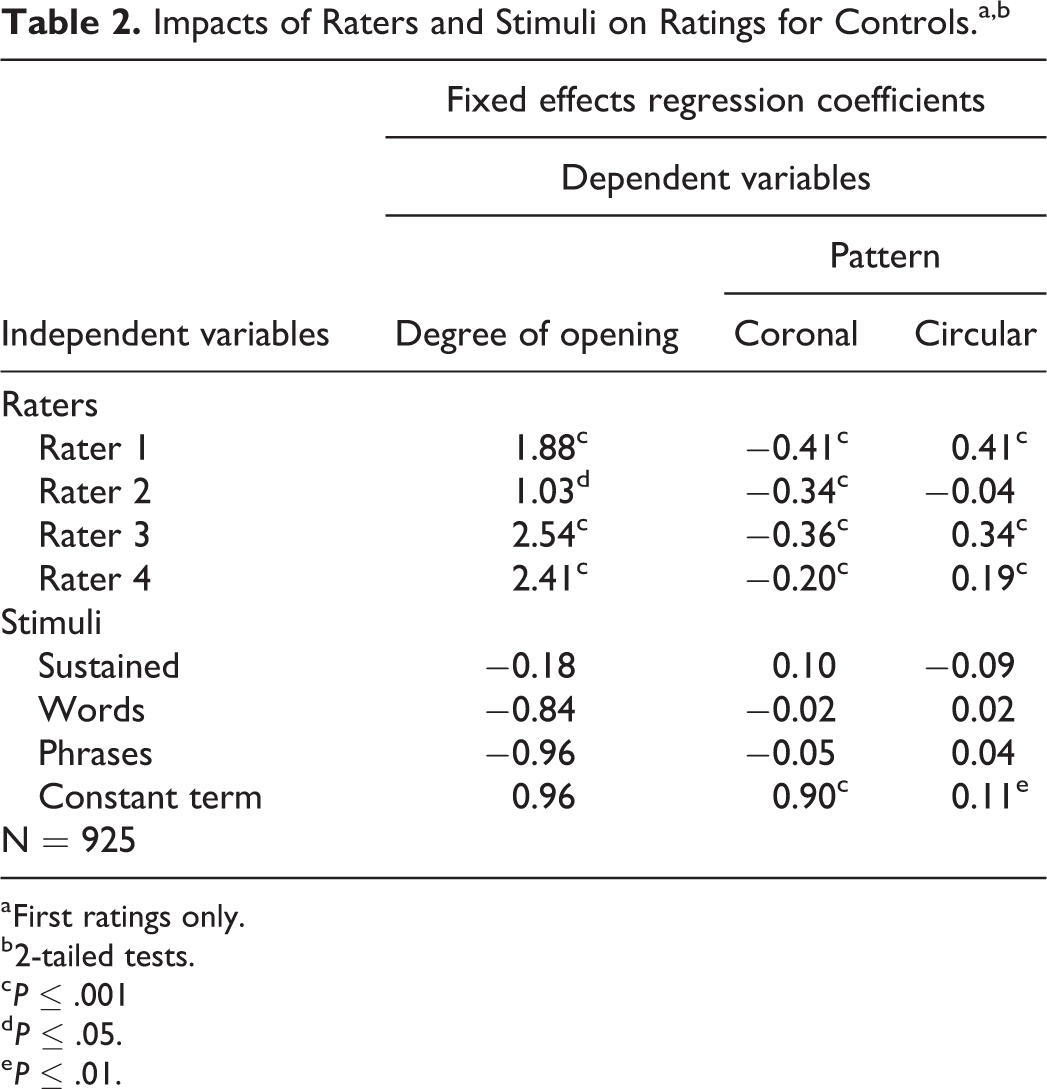
a First ratings only.
b 2-tailed tests.
c P ≤ .001
d P ≤ .05.
e P ≤ .01.
Impacts of Raters and Stimuli on Ratings for Patients.a,b
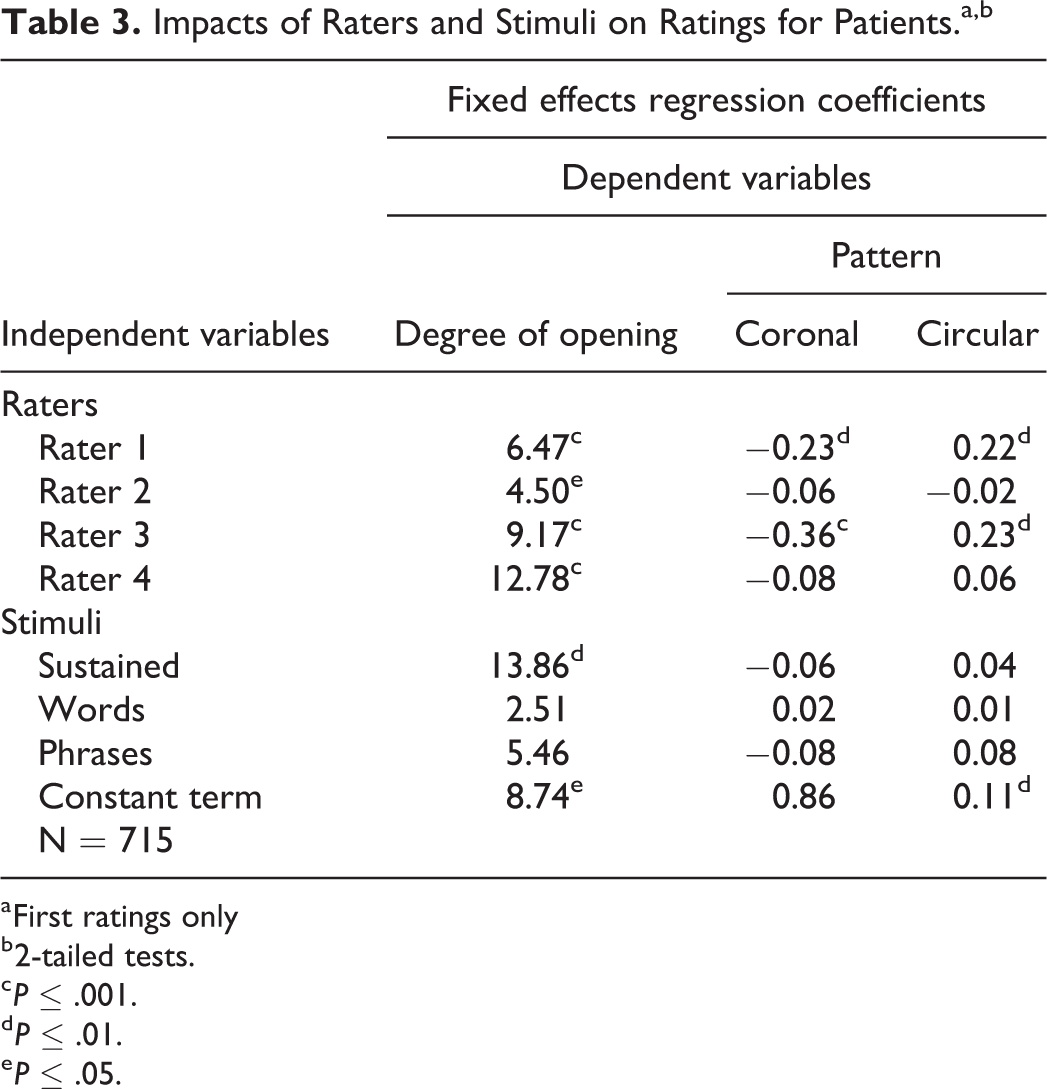
a First ratings only
b 2-tailed tests.
c P ≤ .001.
d P ≤ .01.
e P ≤ .05.
Tables 2 to 5 report FE regression results using first ratings only. Tables 2 and 3 report regression results for 3 dependent variables: the degree of opening (measured on the 0-100 point scale) and the probabilities that a rater would indicate the coronal and circular patterns. Each column in Tables 2 and 3 presents the estimation results for a regression with the dependent variable noted at the top of the column. The numbers in each column present coefficient estimates for the binary variables included in the regression equation. One or more asterisks on a coefficient indicate that the coefficient was significantly different from zero with P ≤ .05, P ≤ .01, or P ≤ .001. Table 2 reports results for controls and Table 3 reports results for patients. Probit estimation, without FE, generates comparable results for the regressions with binary dependent variables indicating observation of the 2 closure patterns.
For the control speech samples, the regression results reported in Table 2 indicate significant systematic variations in rater perceptions of the degree of opening and the pattern of VP movement (Table 2). Raters 1 to 4 indicated significantly larger degrees of opening than rater 5, and they were significantly less likely to indicate that the pattern was coronal compared to rater 5. Raters 1, 3, and 4 were significantly more likely to indicate that the pattern was circular.
In contrast, none of the binary variables indicating stimulus type are significant in any of the control regression equations (Table 2). For the control speakers, rater perceptions of the degree of opening and the pattern of VP movement were not significantly different for speech samples generated by repeated “puh” than for speech samples generated using sustained phonemes, words, or short phrases.
For the patient speech samples, the regression results indicated a similar pattern of systematic variations in rater perceptions of the degree of opening and the pattern of VP movement (Table 3). Raters 1 to 4 recorded significantly larger degrees of opening than rater 5. Raters 1 and 3 were significantly less likely to indicate that the pattern was coronal than rater 5, and they were significantly more likely to indicate that the pattern was circular than rater 5.
In contrast with the regressions for control speakers, the regression results for patients indicate a significant impact for stimulus type (Table 3). Compared with speech samples generated using repeated “puh,” raters recorded significantly greater degrees of opening when speakers articulated sustained phonemes.
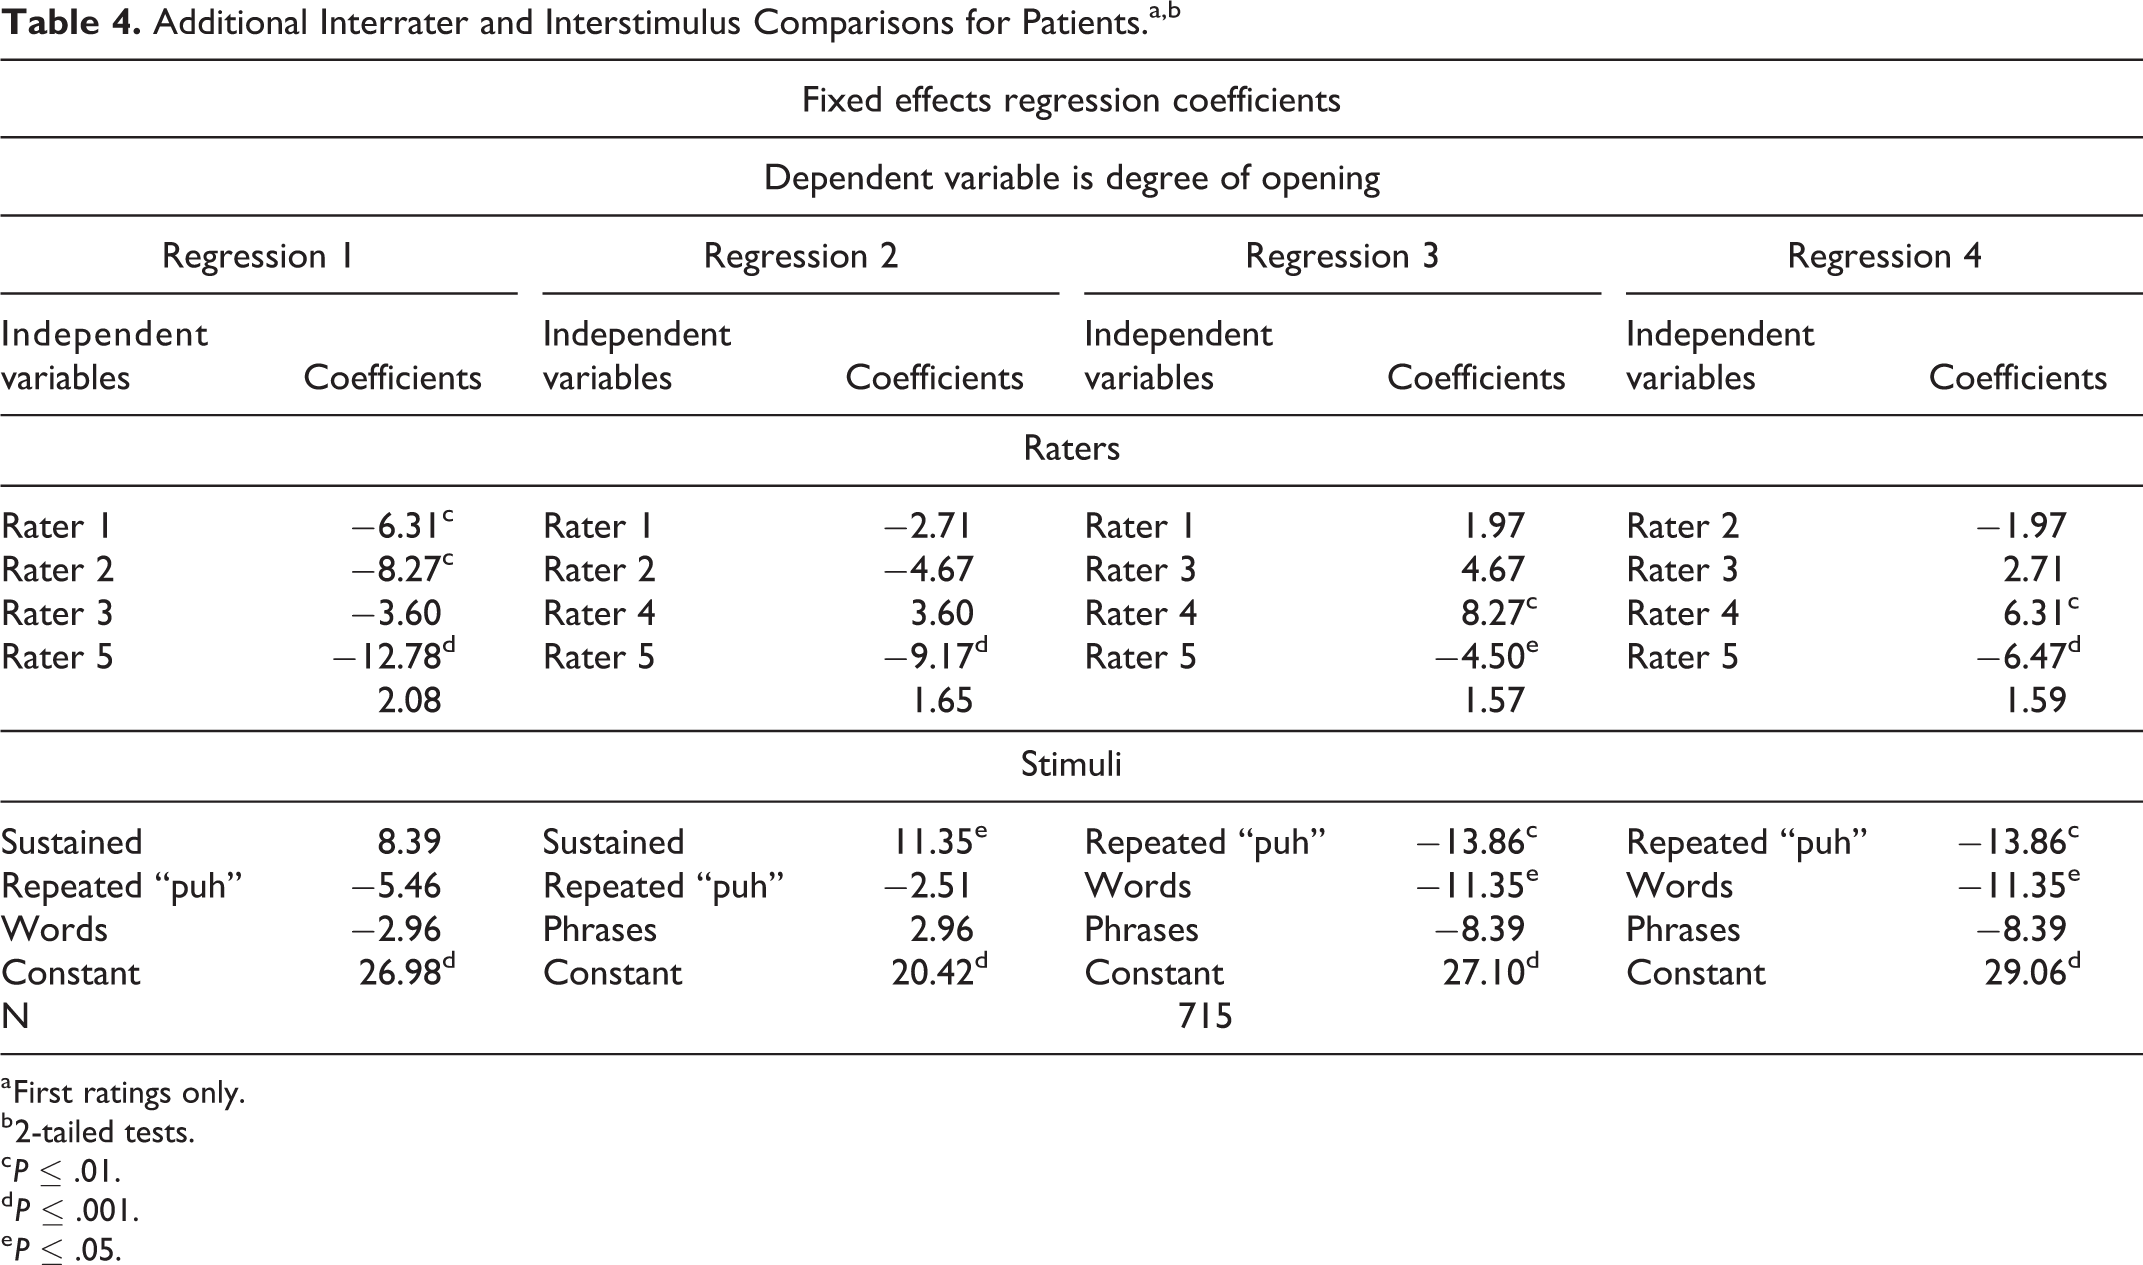
The results reported in Tables 2 and 3 compare raters 1 to 4 to rater 5 and they compare sustained phonemes, words, and short phrases to repeated “puh.” In Table 4, we report regression results for patients that test whether there were significant differences among raters 1, 2, 3, and 4 and among the speech stimuli sustained sounds, words, and short phrases. Each column of Table 4 reports estimation results for a regression that omits a different rater and or speech stimulus. To streamline the discussion, all 4 regressions reported in Table 4 utilize the degree of opening as the dependent variable.
Additional Interrater and Interstimulus Comparisons for Patients.a,b
a First ratings only.
b 2-tailed tests.
c P ≤ .01.
d P ≤ .001.
e P ≤ .05.
The results indicate that raters 1 and 2 recorded significantly smaller degrees of opening than rater 4, and the degrees of opening recorded for speech samples generated using sustained phonemes were significantly larger than degrees recorded for speech samples generated using repeated “puh” and single words.
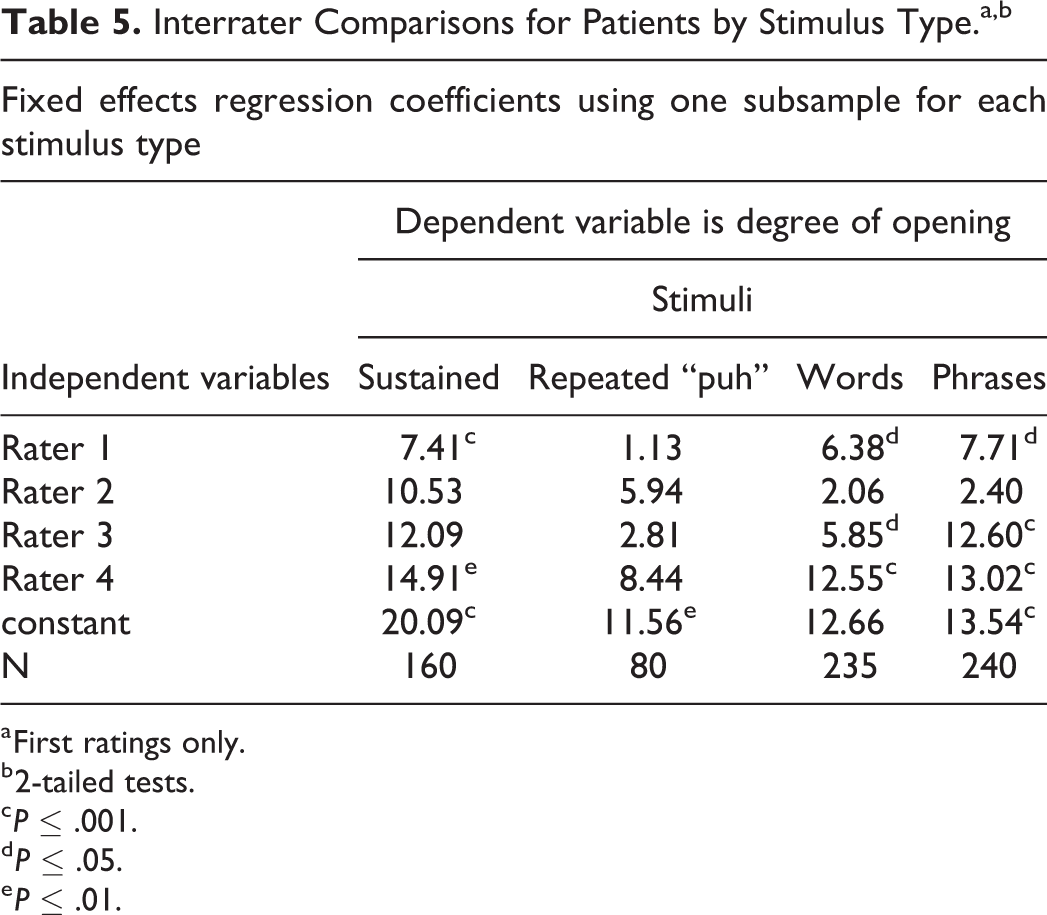
The results reported in Tables 2 to 4 do not address the possibility that interrater differences in the recorded degree of opening could be sensitive to the stimulus type used to generate the sample. We explore this possibility in Table 5, which reports results for 4 regressions for patients. Each regression utilized a data set with only one stimulus type: the regression reported in column 1 is based on a data set that included only speech samples generated using sustained phonemes; the regression reported in column 2 is based on a data set that included only speech samples generated using repeated “puh,” the regression reported in column 3 is based on a data set that included only speech samples generated using single words, and the regression reported in column 4 is based on a data set that included only speech samples generated using short phrases. Each regression included binary variables indicating raters 1 to 4. The dependent variable in each regression reported in Table 5 is the degree of opening.
Interrater Comparisons for Patients by Stimulus Type.a,b
a First ratings only.
b 2-tailed tests.
c P ≤ .001.
d P ≤ .05.
e P ≤ .01.
The results reported in Table 5 show that the magnitudes and significance of interrater variations were sensitive to the stimulus used to generate the speech samples. The results in Table 5 indicate that significant interrater differences occurred when the stimulus was sustained phonemes, words, or phrases, but there were no significant interrater differences when the stimulus was repeated “puh.” The significant differences between rater 5 and raters 1 to 4, reported in Table 3, utilized the full set of speech samples generated using all 4 types of stimuli.
Discussion
This study examined intrarater and interrater reliability for judgments of endoscopic images used in the evaluation of VP physiology for speech. Valid and reliable judgments are important in evaluation of VPD because these ratings are used in the process of determining the best course of treatment.
Intrarater Reliability
Before considering the findings of any rater reliability study, it is important to confirm good intrarater reliability. If individual raters do not agree with themselves, then further analysis is not meaningful. In this study, intrarater reliability was measured in 2 ways: percent exact agreement and logical consistency. Both measures indicated acceptable intrarater reliability. Percent exact agreement between each rater’s first and second ratings was acceptable for all metrics and all raters. Judgments by individual raters were also logically consistent across the 2 groups of speakers and all metrics. As would be expected, each rater indicated that “functional closure” occurred (opening ≤ 10%) for a significantly higher proportion of control video clips than for patient clips. In addition, the ratings exhibited a logical relationship between the degree of opening and the number of locations in the VP port in which the opening occurred. That is, the likelihood of selecting multiple locations increased as the rating for degree of opening increased. Previous studies have reported good intrarater reliability on individual metrics; however, the assessment of logical consistency in this study adds an additional level of confidence to intrarater reliability measurement. No previous study has presented this type of analysis (eg, D’Antonio et al., 1989; Yoon et al., 2006; Sie et al., 2008). This logical consistency across metrics and speakers indicates that the individual raters had logical internal systems for rating VP physiology, and they repeated their ratings with a high degree of consistency.
Interrater Reliability
The research questions addressed in this study focused on factors that affect interrater reliability.
Does Speech Stimulus Affect Rater Judgment and Rater Reliability?
The first research question was whether the speech stimulus affected the content of the ratings or the reliability of those ratings. We found that the speech stimuli affected rater perception of the degree of opening but they did not affect rater perceptions of the pattern of closure.
Degree of Opening
Control speakers did not usually have any opening for any speech stimulus, so the stimulus had no statistical effect for these speakers. For patients, however, the degree of opening was significantly larger by 13.86 scale points (0-100 point scale) for sustained phonemes compared to repeated “puh” (Table 3), and significantly larger by 11.35 scale points compared to single words (Table 4). This variation in the degree of opening may reflect what (Golding-Kushner et al., 1990, p. 338) referred to as “inconsistencies in VP valving…during the examination.” Presumably, this “inconsistency” occurs when the VP mechanism is changing the force of attempted closure to accommodate the articulatory requirements for a sequence of different phonemes, which in turn, causes the degree of opening to continually vary (Kuehn and Moon, 1998; Bell-Berti, 1976). When the degree of opening is variable, the rater is faced with the task of mentally averaging the degree of opening across the sequence of phonemes. Presumably, the degree of opening was perceived as greater for the sustained phonemes in this study because they do not include a sequence of different phonemes. Further research is needed to discern whether the openings for specific stimuli relate better to the speech and resonance symptoms than the openings for other stimuli.
Pattern of Closure
The speech stimulus itself did not affect ratings of closure pattern. Even though the raters did not display good agreement at labeling the pattern of closure, individual decisions were not influenced by the stimulus (Table 3). That is, raters did not identify one pattern of closure for sustained phonemes and a different one for connected speech. From a clinical viewpoint, it was reassuring to see that rater perception of the pattern of movement was not sensitive to the speech stimulus.
Is Inter-Rater Variability Random or Systematic for Rating the Degree of Opening and the Pattern of Closure?
The second research question asked whether interrater variability was random or systematic for rating the degree of opening and the pattern. We found systematic differences across raters in their perception of degree of opening and pattern of closure.
Degree of Opening
We tested whether the interrater variation in ratings for degree of opening on a 100-point scale had a systematic component. For patient-generated video clips, rater 5 recorded significantly smaller ratings for degree than the other raters (Table 3), and rater 4 recorded significantly larger ratings than raters 1 and 2 (Table 4). Rater variation on this metric has been reported previously. For example, Sie et al. (2008) lamented that raters in their study sometimes differed by as much as 80% in estimating degree of opening. It is encouraging, however, that raters 1, 2, and 3 generally recorded ratings of similar magnitudes even though judgments were made without a referent and were based solely on their experience.
Pattern of Closure
In this study, we used the 3 categories of closure described by Skolnick et al. (1973). Three previous endoscopic studies rated the movement of lateral and posterior pharyngeal movement toward closure on a scale. All 3 studies reported that the reliability of the ratings was only fair to moderate (D’Antonio et al., 1989; Yoon et al., 2006; Sie et al., 2008).
On the basis of our preliminary ratings, we hypothesized that the probability of obtaining reliable ratings would be better with only 3 choices. The data did not validate that hypothesis. Instead, we found substantial variation in perceptions of the closure pattern. For example, the proportion of clips rated as exhibiting a coronal pattern for speech samples generated by patients was 89% for rater 5, but only 53% for rater 3 (Figure 1). The substantial disagreement among raters identifying pattern of movement suggests that the 3 patterns may not provide a valid or distinctive description of movement toward VP closure. Instead, VP closure may be continuous rather than categorical, such that the visual distinctions between circular and coronal, or circular and sagittal are not clear.
Are Intra- and Intrarater Reliability Levels Similar for Patient Versus Control Groups?
The third research question asked whether ratings for control speakers are quantitatively and/or qualitatively different from ratings for patient speakers. That question was raised because it would be expected that certain kinds of ratings are more likely to occur in one population than the other. For example, it is well known that normal speakers have little or no opening in the VP port during speech that is devoid of normally nasal phonemes (Moll, 1962). Thus, for normal speakers, there should have been a disproportionately large number of ratings in the “very small” category for degree of opening versus the other categories. Data showed disproportionate distribution in the data. All 5 raters agreed that 89% (164/185) of the images for the control speakers fell into the “very Small” category (degree: 0%-10%; Table 1), but all 5 raters agreed that only 19% (27/143) of the images for the patients fell into the “very Small” category (Table 1). Despite the difference in the perception of ratings categorizing the degree of opening as “very Small,” the regression results for patients and controls exhibited similar interrater variation. For pattern of closure, ratings were not substantially different for controls versus patients (Tables 2 and 3). Thus, pattern of closure was not distinctive for either speaker group.
Conclusions and Limitations
As use of electronic medical records increases, there will be increased sharing of endoscopic images, and it will be increasingly important to ensure that image rating can be interpreted in a standard way. Our results suggest that 3 types of additional research are needed. First, the significant systematic interrater differences in perception of degree of opening and pattern of closing suggest that sharing information about ratings of diverse sets of video images could potentially help raters understand how their perceptions compare with ratings by their colleagues. Research is needed to assess the impacts of training strategies on reliability.
Second, the interrater differences in the use of pattern of closure raise questions about the usefulness of the (Skolnick et al., 1973) pattern categories. Previously, Sie et al. (2008) expressed concern about the reliability in rating pattern of VP movement using the (Golding-Kushner et al., 1990) scale. Further research is needed to test whether the 3 patterns are clinically useful, and whether raters can be trained to rate them reliably.
Third, our finding that speech stimuli affect rater estimates of the degree of opening for patients suggests that research is needed to determine which stimuli are most useful for supporting clinical decisions. The additional finding that speech stimuli significantly impact ratings of degree of opening for patients, but not for controls suggests that research should focus on patients.
One limitation of this line of research should be noted. In this study, the raters viewed each clip as a stand-alone piece of evidence. In a clinical setting, raters would see images generated by a set of stimuli as a “whole.” However, it is also not known how raters mentally assemble the multiple images to arrive at a diagnostic conclusion. Additional research is needed on the impact of multiple images from different stimuli on rater judgments; and research is needed to identify the optimal number and types of stimuli that should be used in an examination.
Footnotes
Authors’ Notes
1. This paper was presented, in part, as a poster at the 74th Annual Meeting of the American Cleft Palate-Craniofacial Association; March 2017; Colorado Springs, CO.
2. The authors gratefully acknowledge research assistance provided by Jace Gilbert and Troy Warne.
Declaration of Conflicting Interests
The author(s) declared no potential conflicts of interest with respect to the research, authorship, and/or publication of this article.
Funding
The author(s) received no financial support for the research, authorship, and/or publication of this article.