
Abstract
Objective:
To identify differences between asymptote- and rate-based methods for estimating age and size at growth cessation in linear craniofacial measurements.
Design:
This is a retrospective, longitudinal study. Five linear measurements were collected from lateral cephalograms as part of the Craniofacial Growth Consortium Study (CGCS). Four estimates of growth cessation, including 2 asymptote- (GCasym, GCerr) and 2 rate-based (GCabs, GC10%) methods, from double logistic models of craniofacial growth were compared.
Participants:
Cephalometric data from participants in 6 historic longitudinal growth studies were included in the CGCS. At least 1749 individuals (870 females, 879 males), unaffected by craniofacial anomalies, were included in all analyses. Individuals were represented by a median of 11 images between 2.5 and 31.3 years of age.
Results:
GCasym consistently occurred before GCerr and GCabs consistently occurred before GC10% within the rate-based approaches. The ordering of the asymptote-based methods compared to the rate-based methods was not consistent across measurements or between males and females. Across the 5 measurements, age at growth cessation ranged from 13.56 (females, nasion-basion, GCasym) to 24.39 (males, sella-gonion, GCerr).
Conclusions:
Adolescent growth cessation is an important milestone for treatment planning. Based on our findings, we recommend careful consideration of specific definitions of growth cessation in both clinical and research settings since the most appropriate estimation method may differ according to patients’ needs. The different methods presented here provide useful estimates of growth cessation that can be applied to raw data and to a variety of statistical models of craniofacial growth.
Introduction
Accurate estimation of a patient’s craniofacial growth status is of considerable importance to orthodontic, prosthodontic, and maxillofacial treatment planning and outcomes. Post-treatment craniofacial growth can contribute to deleterious changes or post-implantation infraocclusion, and thus treatment is often timed to coincide with skeletal maturation or to occur after cessation of growth. Studies of the timing of adolescent growth cessation have used a variety of definitions and methods to describe this milestone, yielding disparate results (Roche et al., 1977; Lewis & Roche, 1988; Bishara et al., 1994; Bishara & Jakobsen, 1998; Fudalej et al., 2007; Nahhas et al., 2014; Aarts et al., 2015). In this article, we present several methods for estimating adolescent growth cessation based on double logistic models of linear craniofacial measurements using a large and dense longitudinal sample.
Skeletal change can be conceptualized as occurring in 3 phases over the course of the life span. First is the growth phase. Growth is the process of increasing size and can be quantified through linear and volumetric measurements. Growth processes are often conflated with maturation because of their similar time scale and apparent interrelatedness. Maturation is the process of achieving adult status (Roche, 1986). During the growth phase, growth and maturation are defined by separate trajectories (Nahhas et al., 2013; Boeyer et al., 2020) that converge until skeletal maturity is achieved and active growth ceases (Marshall, 1974; Mellion et al., 2013).
Second is the adaptive phase. The adaptive phase can include small-scale changes in gross skeletal morphology that occur as the bone adapts to a relatively stable hormonal and mechanical environment (Dempster, 2002). In the craniofacial complex, these changes include thickening of the cranial bones, expansion of paranasal sinuses, and increased rugosity and enlargement of muscular attachments, such as the mastoid and nuchal crests (Israel, 1973). Although these changes may result in small incremental increases or decreases in some dimensions, they result from a fundamentally different process and are much smaller in magnitude than the rapid changes seen during the growth phase. The final phase, senescence, is characterized by erosive changes including regional areas of resorption, loss of bone mineral, and joint degeneration.
In this conceptual framework, we consider the biological definition of growth cessation as the point of transition between the growth phase and the adaptive phase. This transition point is characterized by hormonal and physiological changes whose specific effects on bone can be difficult to identify. Regardless of the underlying physiology, transition points are useful to researchers and clinicians and can be estimated based on serial trait measurements. For many clinicians, the attainment of growth cessation means that treatment can be provided with minimal risk of relapse. For others, the goal may be knowing when to end treatment before growth has slowed too much to be effectively redirected.
Estimating growth cessation in the craniofacial complex is surprisingly challenging. In contrast to measurements such as overall stature, where the overall measurement is large and growth increments may be several centimeters in a matter of months so that a transition to near-zero increments is readily noticeable, craniofacial measures may only reach a few centimeters in total at adulthood. While a peak in growth velocity is clear in some craniofacial measures, the overall growth rate in the craniofacial complex is low and the transition toward cessation is less marked. Dimensional changes may continue to occur in the craniofacial complex past adolescence, and this can confound identification of the point of cessation. Estimates of the age of growth cessation, and variation therein, are best attained through longitudinal data from individuals over many years. As growth rates decrease, the magnitude of growth approaches the magnitude of measurement error introduced by multiple sources, including magnification and positioning of the subject during imaging and interassessor variation, making it extremely difficult to distinguish between growth and error near the time of growth cessation. Several definitions of growth cessation have been employed, and these can largely be divided in to those based on the rate of growth (Nahhas et al., 2014; Aarts et al., 2015) and those based on the relationship between the actual size and an expected adult size value (Roche et al., 1977).
Growth is often summarized using polynomial models fit to longitudinal or cross-sectional data (Buschang et al., 1986, 1988; Nahhas et al., 2014), yet these curvilinear models tend to diverge from the data at the extremes of the observed age ranges. Previous examinations of adolescent growth have used a variety of methods to identify important differences in the timing of growth cessation across regions of the skull. Roche et al. (1977) estimated cessation as the age at which 95% of the adult value is reached based on single logistic models and found that adolescent growth of measures of the cranial base ceases between 11.8 and 13.5 years of age in females and between 15.1 and 15.5 years of age in males, based on participants in the Fels Longitudinal Study. A subsequent study (Lewis & Roche, 1988), also utilizing the Fels Longitudinal Study sample, defined growth cessation as the age at which individuals reached their maximum value for a given trait and found that linear craniofacial growth ceased between 29 and 39 years of age on average across all traits in males and females.
The choice of an optimal estimator of growth cessation and what constitutes a conservative estimate will depend on the intended goal. For example, an orthodontist intending to redirect a patient’s growth prior to cessation might desire an early estimate of growth cessation that will ensure that the appropriate treatments are rendered before the end of the growth phase. In other cases, such as prosthodontic implantation, treatment is delayed until craniofacial growth has ceased. Craniofacial researchers can additionally benefit from the use of multiple, clearly defined growth cessation estimates that can be more readily compared among populations.
To address these challenges, the present study uses a large data set from the Craniofacial Growth Consortium Study (CGCS), representing longitudinal growth records from participants aged 3 to more than 27 years (Sherwood et al., 2020). Paired with nonlinear modeling techniques, this sample allows comparison of multiple definitions of growth cessation to determine which methods best suit the requirements of different situations. Specifically, we compare asymptote- and rate-based methods of growth cessation estimation.
Materials and Methods
Sample
The CGCS consists of lateral cephalograms collected over the course of 6 longitudinal growth studies conducted across North America from 1929 to 1984 (Sherwood et al., 2020). The 6 studies (the Denver Growth Study, the Iowa Growth Study, the Michigan Growth Study, the Fels Longitudinal Study, the Bolton-Brush Growth Study, and the Child Health Study at Oregon Health & Science University) sampled populations of primarily European ancestry in Colorado, Iowa, Michigan, Ohio, and Oregon. These studies were focused on characterizing unaffected growth and, therefore, did not include participants with craniofacial diagnoses (Sherwood et al., 2020). Two-dimensional coordinate data were collected from a set of standard cephalometric landmarks using eDigit (developed at the Craniofacial Research Instrumentation Laboratory [CRIL], Arthur A. Dugoni School of Dentistry; Baumrind & Miller, 1980). Each cephalogram was assessed by 3 independent assessors, and landmark coordinates were averaged using the CRIL-Avepic software program. In total, the CGCS contains data from more than 15000 cephalograms representing almost 2000 individuals.
Linear distances between landmarks were calculated for 5 linear measurements: anterior nasal spine to posterior nasal spine (ANS-PNS), gonion to pogonion (Go-Po), nasion to basion (N-B), nasion to menton (N-M), and sella turcica to gonion (S-Go; Table 1). These 5 measurements capture vertical and anteroposterior dimensions of multiple craniofacial regions that are expected to exhibit differing patterns of growth. Linear distances were corrected for radiographic enlargement (Sherwood et al., 2020). Statistical analyses were performed on linear measurements from individuals with at least 2 assessments, resulting in sample sizes of 870 to 871 females and 879 to 881 males, with the sample size varying by measurement. The median number of images per individual is 11 across all measurements in males and females. Ages range from 3.0 to 31.3 years in females and from 2.5 to 27.8 years in males.
Linear Dimensions Included in This Study, With Descriptions, Sample Sizes, and Associated Measurement Error in Females and Males, From the Full CGCS Data Set.
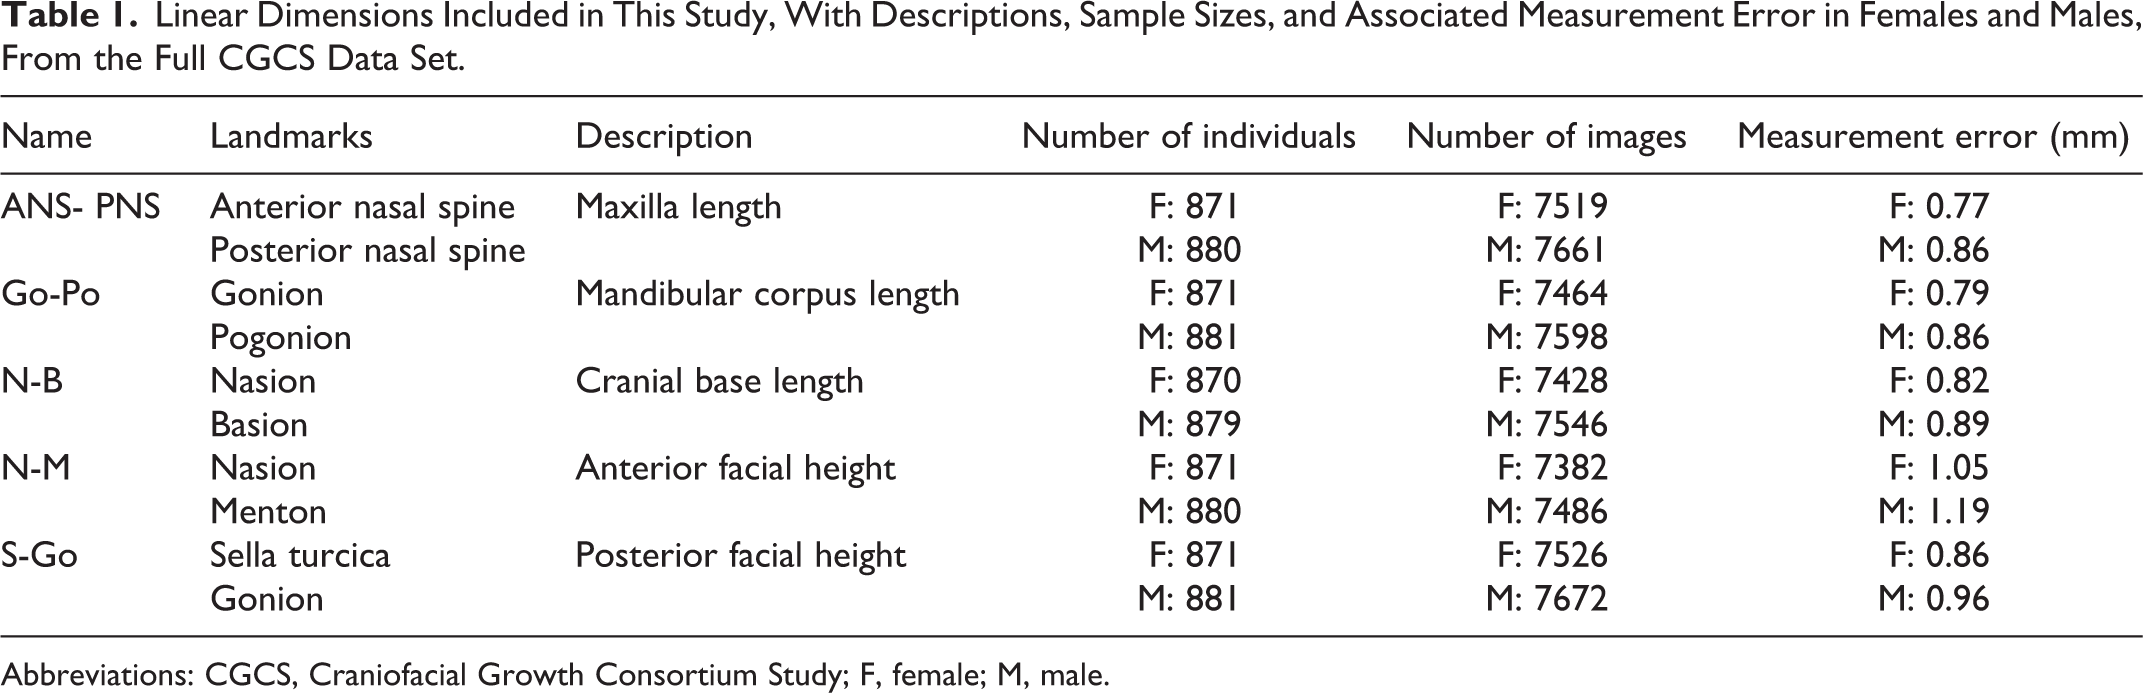
Abbreviations: CGCS, Craniofacial Growth Consortium Study; F, female; M, male.
Modeling
Each trait was fit separately with a multilevel double logistic model based on Bock et al. (1973). This model includes 2 terms, one describing the prepubertal growth stage and the other describing the adolescent growth spurt. Bayesian inference with Monte Carlo methods is performed here in the stan programming language (Gelman et al., 2015) via the rethinking package (McElreath, 2016) in R, version 3.6.2 (R Core Team, 2019). Details regarding the estimation of parameters and their starting values are provided by Sherwood et al. (2020).
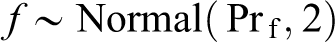
The full model specification with prior distributions (Pr) for parameters was:
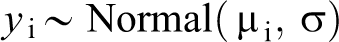
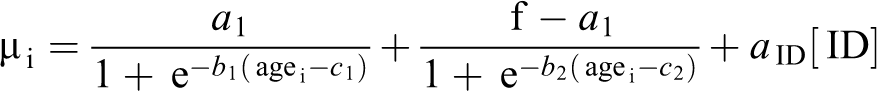


The ID effect (a
ID, j) adjusts the trait value across all ages for each individual (an individual-level intercept). Each model was run with 4 chains in parallel for 10000 iterations, yielding at least 4000 effective samples for the parameters of interest. Adequate sampling was assessed visually via rank histograms and
Estimating Growth Cessation
Peak growth velocity (PGV) and growth cessation were the 2 growth milestones estimated from the resulting models. Peak growth velocity was defined as the maximum rate of change occurring after 10 years of age to capture the adolescent growth spurt. Growth cessation can be estimated in many ways, and here we assessed 2 different classes of estimation, asymptote-based and rate-based.
Asymptote-based estimates
The adult size asymptote (f), which estimates the trait value that the model approaches asymptotically as age increases, was central to 2 definitions of growth cessation. The first, referred to as GCasym, defined growth cessation as the age at which the trait value reached 98% of f. The second, referred to as GCerr, defined growth cessation as the earliest age at which the trait size was within the expected measurement error of f. In the CGCS, measurement error was estimated using the multilevel model fitted above to obtain deviations of observations from predicted values for each individual (n > 870 per sex in the full CGCS dataset). The median of the mean prediction error across individuals was taken as an estimate of that measure’s expected error (Table 1).
Rate-based estimates
Two estimates of growth cessation were based on the rate of growth. The first, referred to as GCabs, estimated growth cessation as the age at which the growth rate reached an absolute value of less than 0.1 mm/yr. The second, referred to as GC10%, was the age at which the growth rate reached less than 10% of PGV.
The 2 asymptote-based methods, GCasym and GCerr, were intended to represent nearly adult size. The rate-based methods, GCabs and GC10%, represent ages of minimal growth. All 4 estimates of growth cessation are described within each trait and sex.
Results
Longitudinal growth in 5 linear measurements in males and females was modeled, and PGV and growth cessation parameters were estimated from the samples drawn from those models (Figure 1). Peak growth velocity occurs between 10.4 and 11.8 years of age in females and between 12.3 and 14.3 years of age in males across all 5 traits (Table 2). Cranial base length (N-B) achieves PGV earliest in females, but mandible length (Go-Po) reaches PGV earliest in males. In males and females, posterior facial height reaches PGV latest. The rate of growth at PGV varies by trait and sex, yet the 2 largest measurements analyzed, N-B and N-M (Table 3), do not have proportionately greater PGV than the other 3 traits.
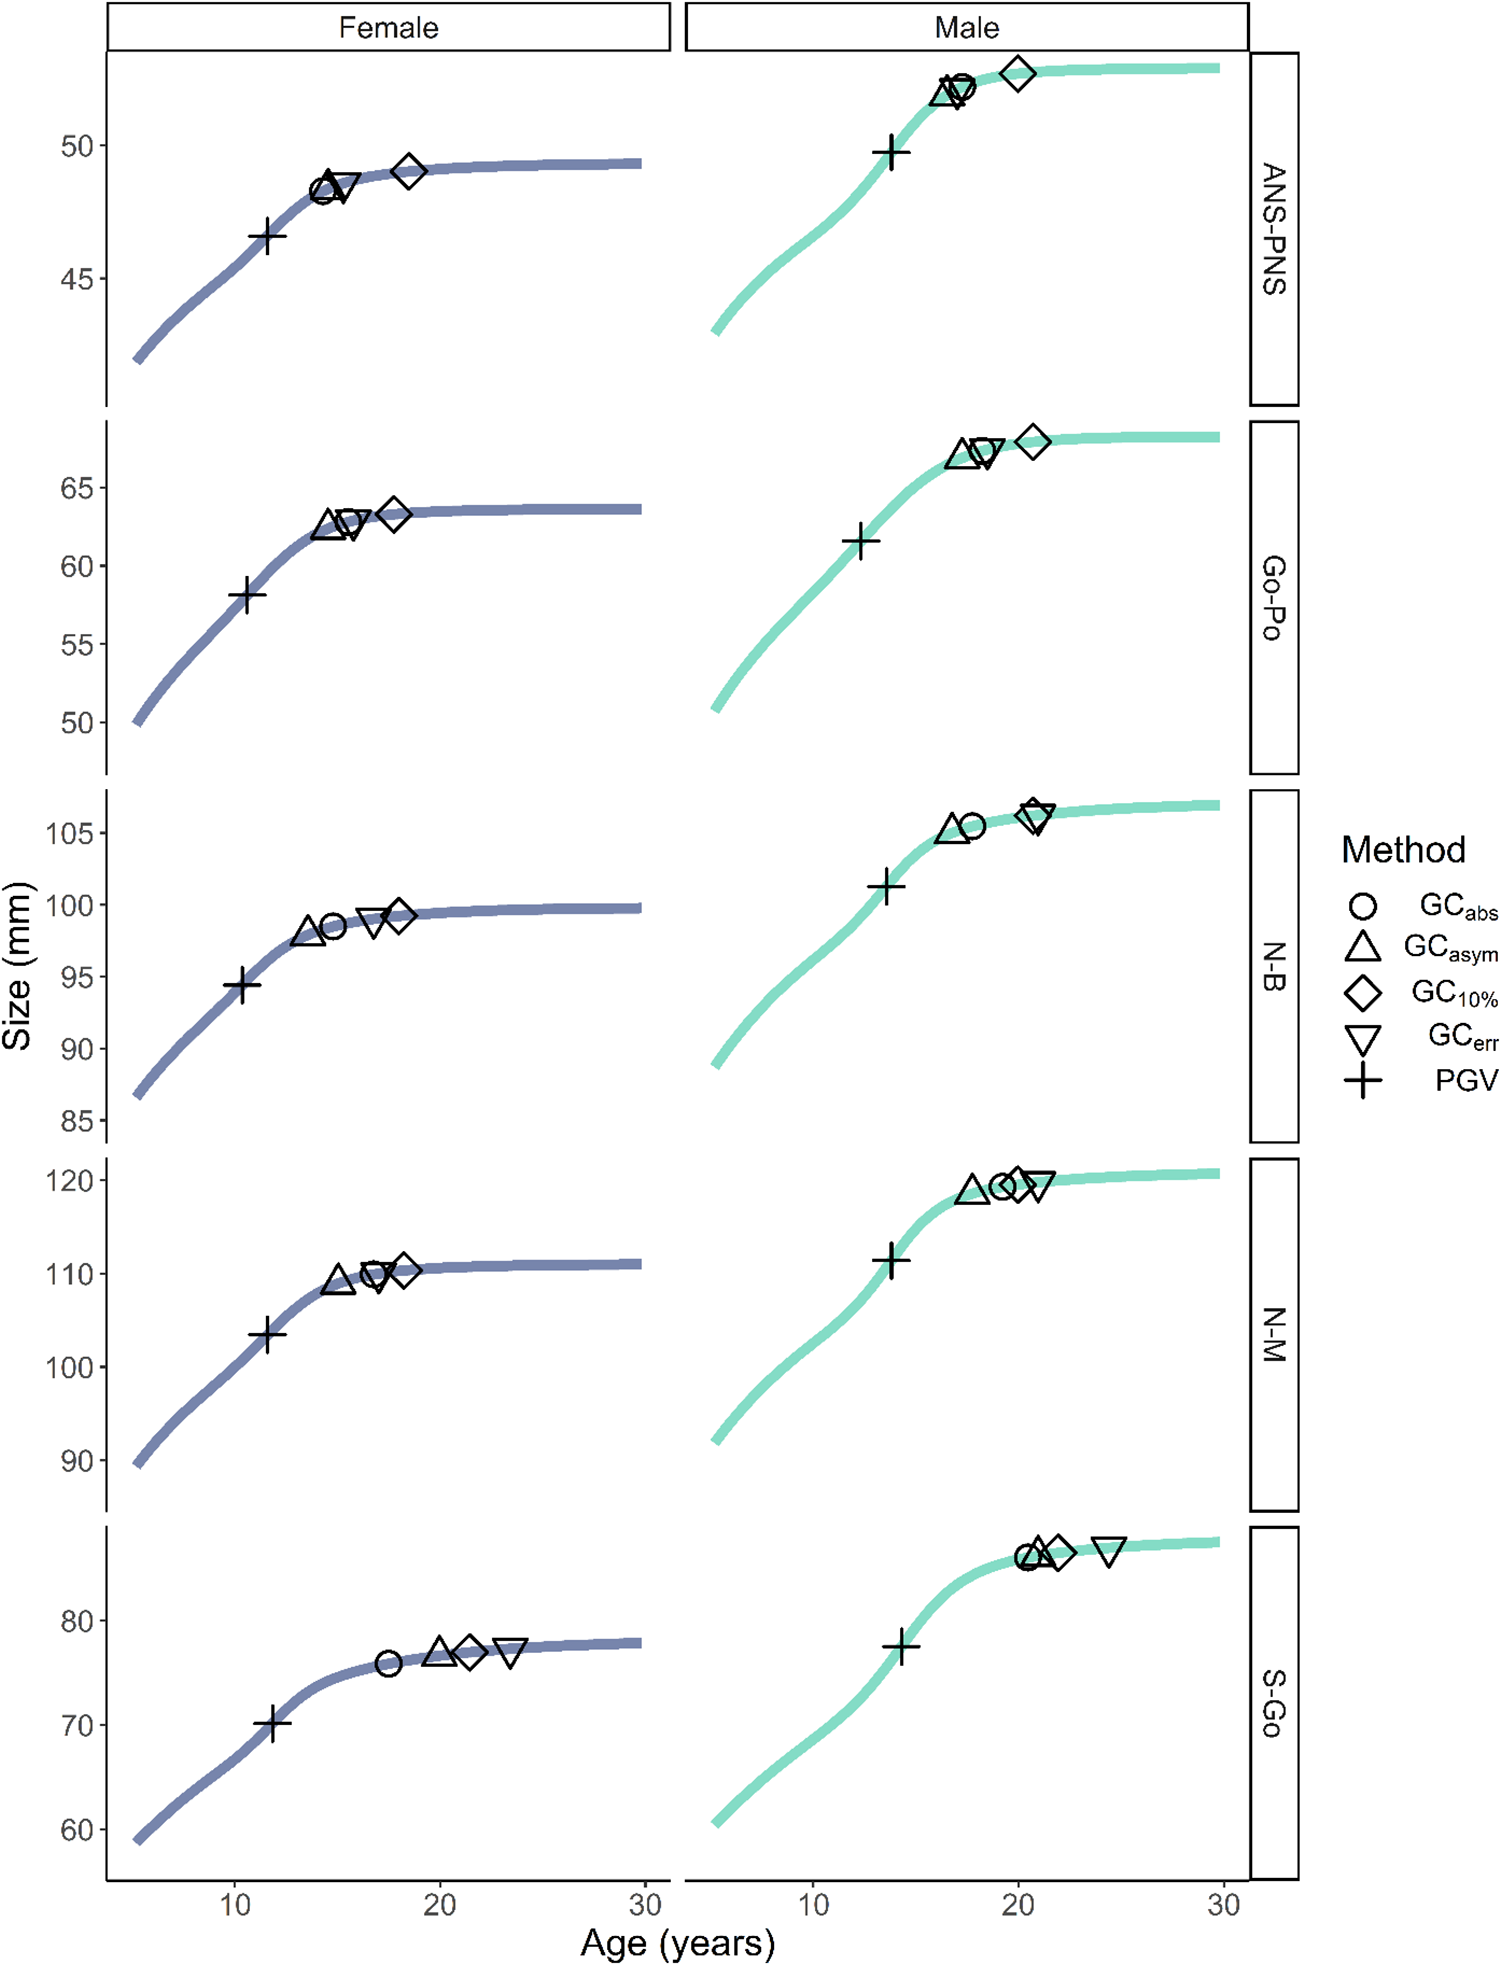
Growth curves and estimates of peak growth velocity and growth cessation (GCabs, GCasym, GC10%, GCerr) in females and males from 6 to 30 years of age.
Summary of Age at Peak Growth Velocity (aPGV), Peak Growth Velocity (PGV, mm/yr), and Age at Growth Cessation (aGC) Based on 4 Growth Cessation Estimation Methods, Including Asymptote- (aGCasym, aGCerr) and Rate-Based (aGCabs, aGC10%) Methods and the Range of the aGC Estimates (Range).
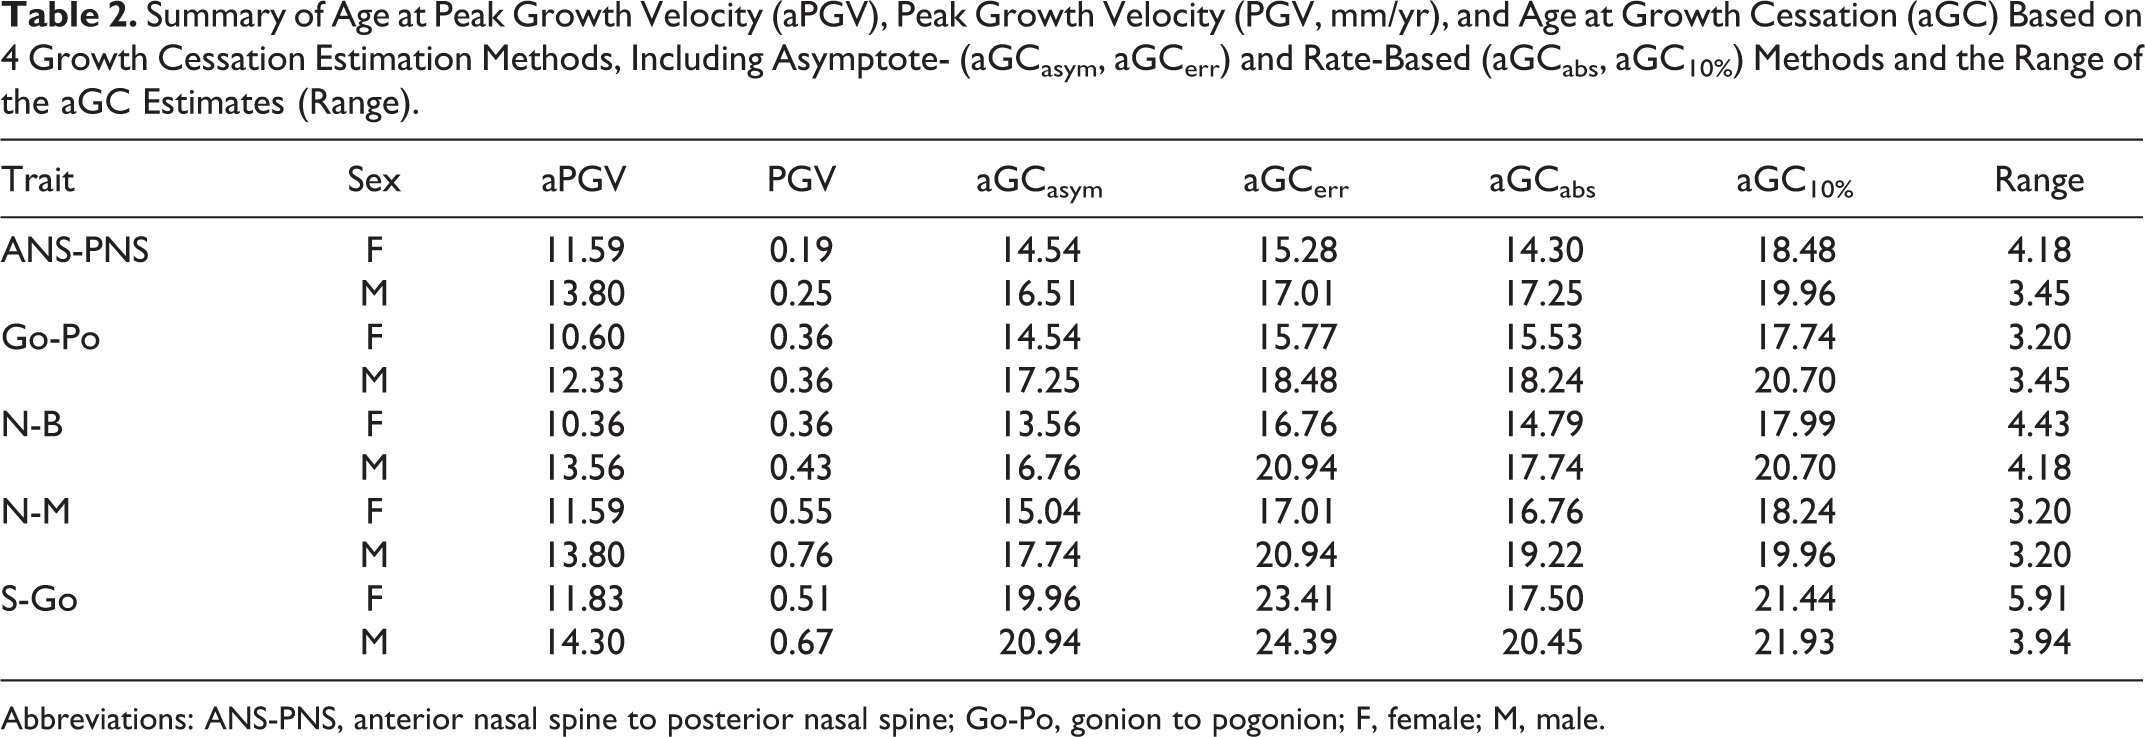
Abbreviations: ANS-PNS, anterior nasal spine to posterior nasal spine; Go-Po, gonion to pogonion; F, female; M, male.
Summary of Size at Peak Growth Velocity (sPGV) and Size at Growth Cessation (sGC) Based on 4 Growth Cessation Estimation Methods, Including Asymptote- (sGCasym, sGCerr) and Rate-Based (sGCabs, sGC10%) Methods, the Adult Size Parameter (f), and the Range of the sGC Estimates in Millimeters (range).
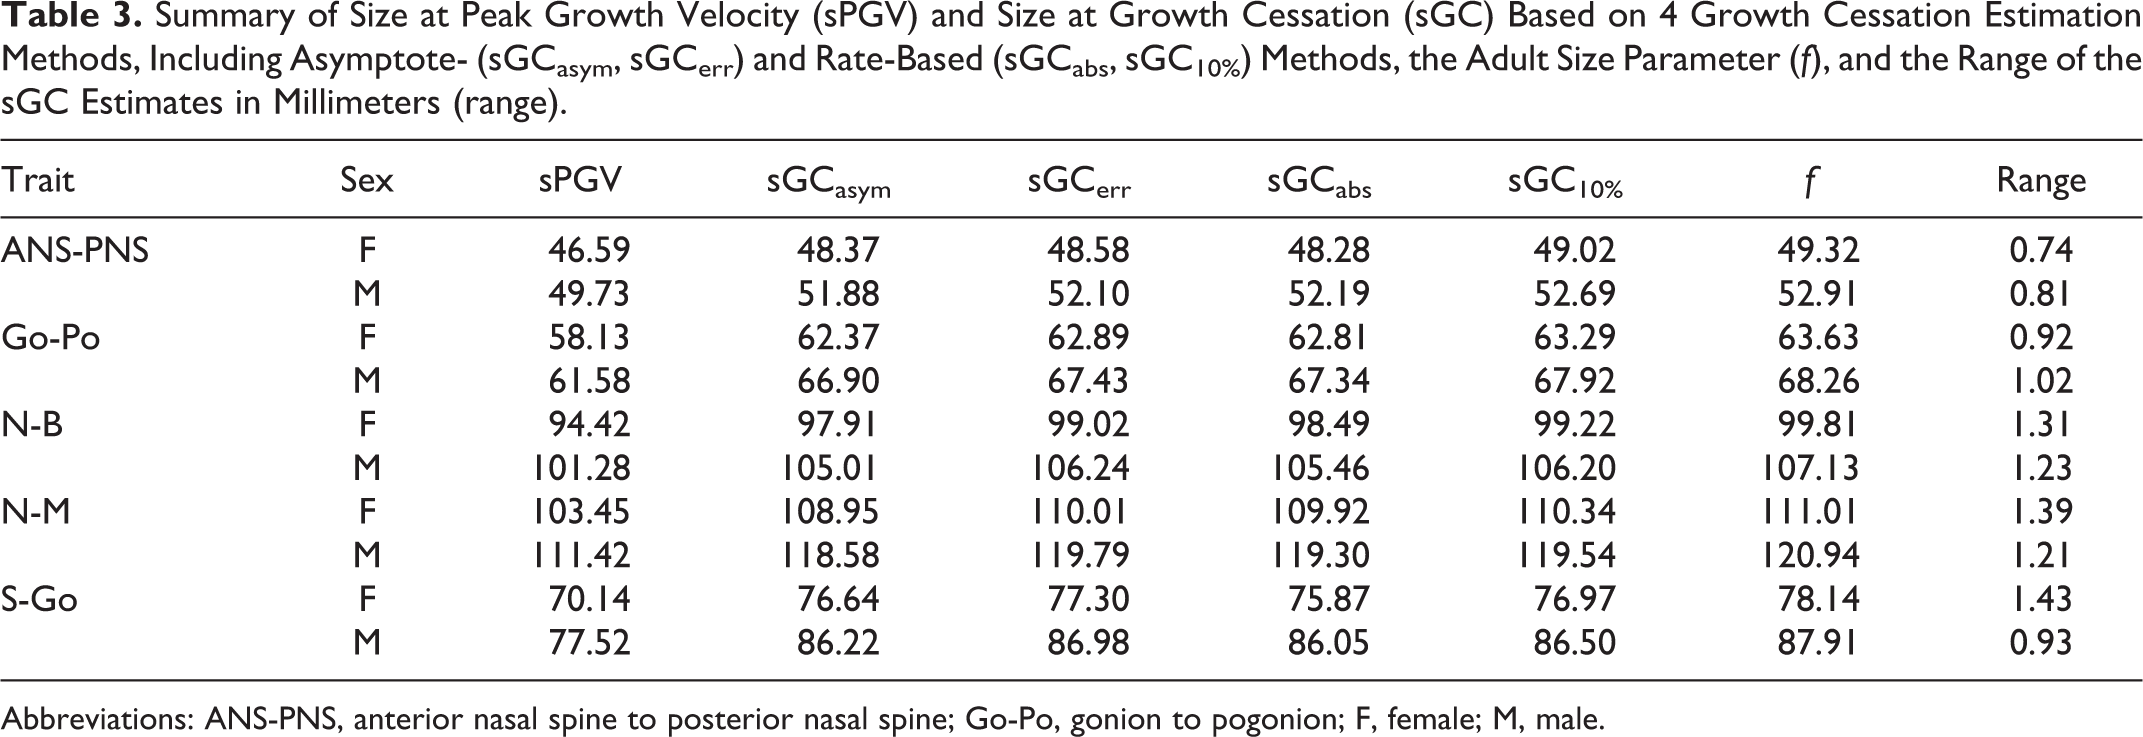
Abbreviations: ANS-PNS, anterior nasal spine to posterior nasal spine; Go-Po, gonion to pogonion; F, female; M, male.
The 2 asymptote-based estimates of growth cessation are consistently ordered for each measurement, with GCasym occurring before GCerr. GCasym occurs between 13.6 and 20.0 years of age in females and between 16.5 and 20.9 years of age in males. GCerr occurs between 15.3 and 23.4 years of age in females and between 17.0 and 24.4 years of age in males.
The 2 rate-based estimates of growth cessation are also consistently ordered, with GCabs occurring before GC10%. GCabs occurs between 14.3 and 17.5 years of age in females and between 17.3 and 20.5 years of age in males. GC10% occurs between 17.7 and 21.4 years of age in females and between 20.0 and 21.9 years of age in males.
Ordering is not consistent across all 4 estimates of growth cessation, however. GCasym or GCabs occurs first, although GCerr occurs nearly as early in ANS-PNS and Go-Po. GCerr occurs before GC10% for ANS-PNS, Go-Po, female N-B, and female N-M, and at nearly the same age as GC10% for male N-B and after GC10% for S-Go and male N-M.
Discussion
The present study provides estimates for age and size at growth cessation derived from 4 different methods. Craniofacial growth researchers have long recognized that the end of the growth phase should coincide with a period of minimal growth or the achievement of nearly adult size (Roche et al., 1977; Lewis & Roche, 1988; Fudalej et al., 2007; Nahhas et al., 2014; Aarts et al., 2015), but have not clearly distinguished between rate- and asymptote- or size-based estimation methods. By design, double logistic models identify an asymptote with a slope of 0 (ie, indicative of no growth), which, by definition, the model curves approach but never reach. In other words, double logistic models allow for a low level of change in measures of interest throughout the lifespan. In subjective examination of the growth curves, it is clear that growth velocity undergoes a visible reduction, and we equate this with the transition from the growth phase to the adaptive phase.
Multiple methods of growth cessation estimation were tested to provide alternatives for researchers and clinicians with different requirements and limitations. In some clinical situations, confidence that a patient has completed growth is needed, whereas in other situations, a coarser estimate that the patient is approaching completed growth is sufficient. The 4 estimates of age and size at growth cessation generated here provide options for each of these circumstances.
Comparison of the age and size estimates at cessation across the 4 methods is interesting. The largest difference between the minimum and maximum age estimates for cessation is 5.91 years (17.50-23.41 years) for S-Go in females; the smallest difference is 3.20 years for Go-Po in females (14.54-17.74 years), 3.20 years for N-M in females (15.04-18.24 years), and 3.20 years for N-M in males (17.74-20.94 years; Table 2). If one simply considers the range of age estimates, it would be difficult to say such an estimate is useful in a clinical situation.
Examination of the estimates for size at growth cessation paints a different picture. The largest absolute difference between the smallest and largest size estimates at cessation is 1.43 mm, 1.85% of the largest estimate (77.30 mm), for S-Go in females (Table 3). The smallest absolute difference of 0.74 mm, 1.51% of the largest estimate (49.02 mm), occurs in ANS-PNS in females. It is clear that, despite age estimates spanning several years, the amount of growth remaining after the earliest estimates of cessation is minimal.
Estimating Growth Cessation
Previous studies have defined growth cessation variably, including using asymptote-based estimates similar to GCasym but at 95% of the adult size (Roche et al., 1977), maximum values (Lewis & Roche, 1988), and rate- and acceleration-based estimates in which velocity or acceleration equals zero at growth cessation (Nahhas et al., 2014). Asymptote- or rate-based estimates are likely to yield more consistent results across individuals since measurement error could significantly impact when an individual’s maximum value is attained.
When asymptote- and rate-based estimates of growth cessation are estimated together, it becomes clear that the relationship between these 2 types of estimates varies by trait and sex. There is not a consistent percentage of adult size at which the rate of growth becomes inconsequential across traits. There is also no single trait that can represent growth of the overall skull. Instead, it is important to consider the precise clinical need for the estimate of growth cessation and on that basis apply the best-suited estimation method to all pertinent skeletal dimensions. Take, for example, the case of an 11-year-old female seeking orthodontic treatment for class II malocclusion secondary to maxillary dentoalveolar protrusion or mandibular retrognathia. To plan treatment and give the patient a possible timeline for each phase of treatment, the clinician would like to know how much growth to expect in this patient and when growth will cease. It might be preferable in this instance to utilize the earliest possible estimate of growth cessation, GCasym, to determine whether the required correction will be possible in the shortest potential timeline. In contrast, placement of a tooth implant is ideally performed after the cessation of facial growth (Aarts et al., 2015). Typically, serial head films would be taken 6 months or more apart and a negligible difference between the films would be taken as evidence of growth cessation. This process is similar, in effect, to the rate-based estimate of growth cessation GCabs. Clinicians using this protocol might, therefore, benefit from comparing patients to population-level estimates of GCabs to determine the possibility of unexpected growth after implantation.
Some definitions of growth cessation are better suited to specific model shapes than others (Table 4). For example, linear models like polynomials do not have the asymptotes necessary for estimating GCasym or GCerr. Likewise, models with asymptotes like the double logistic curve will not reach a rate of zero at the end of growth (ie, GC0). Asymptote-based methods can hypothetically be fit to raw patient data to predict future growth and growth milestones, but this prediction would be improved with knowledge of the patient’s past growth. This would require at least 2 sequential measurements of the patient at different appointments prior to growth prediction. Estimation of GC0 would also be challenging to apply in clinic because it would require measurements from 2 timepoints near the end of active growth. Slight differences between the measurements taken at those 2 timepoints, whether due to ongoing growth or error, would likely preclude those measurements being identical and would, therefore, be more similar to GCerr than to a true GC0.
Summary of the growth Cessation Estimation Methods Discussed and Potential Applications.
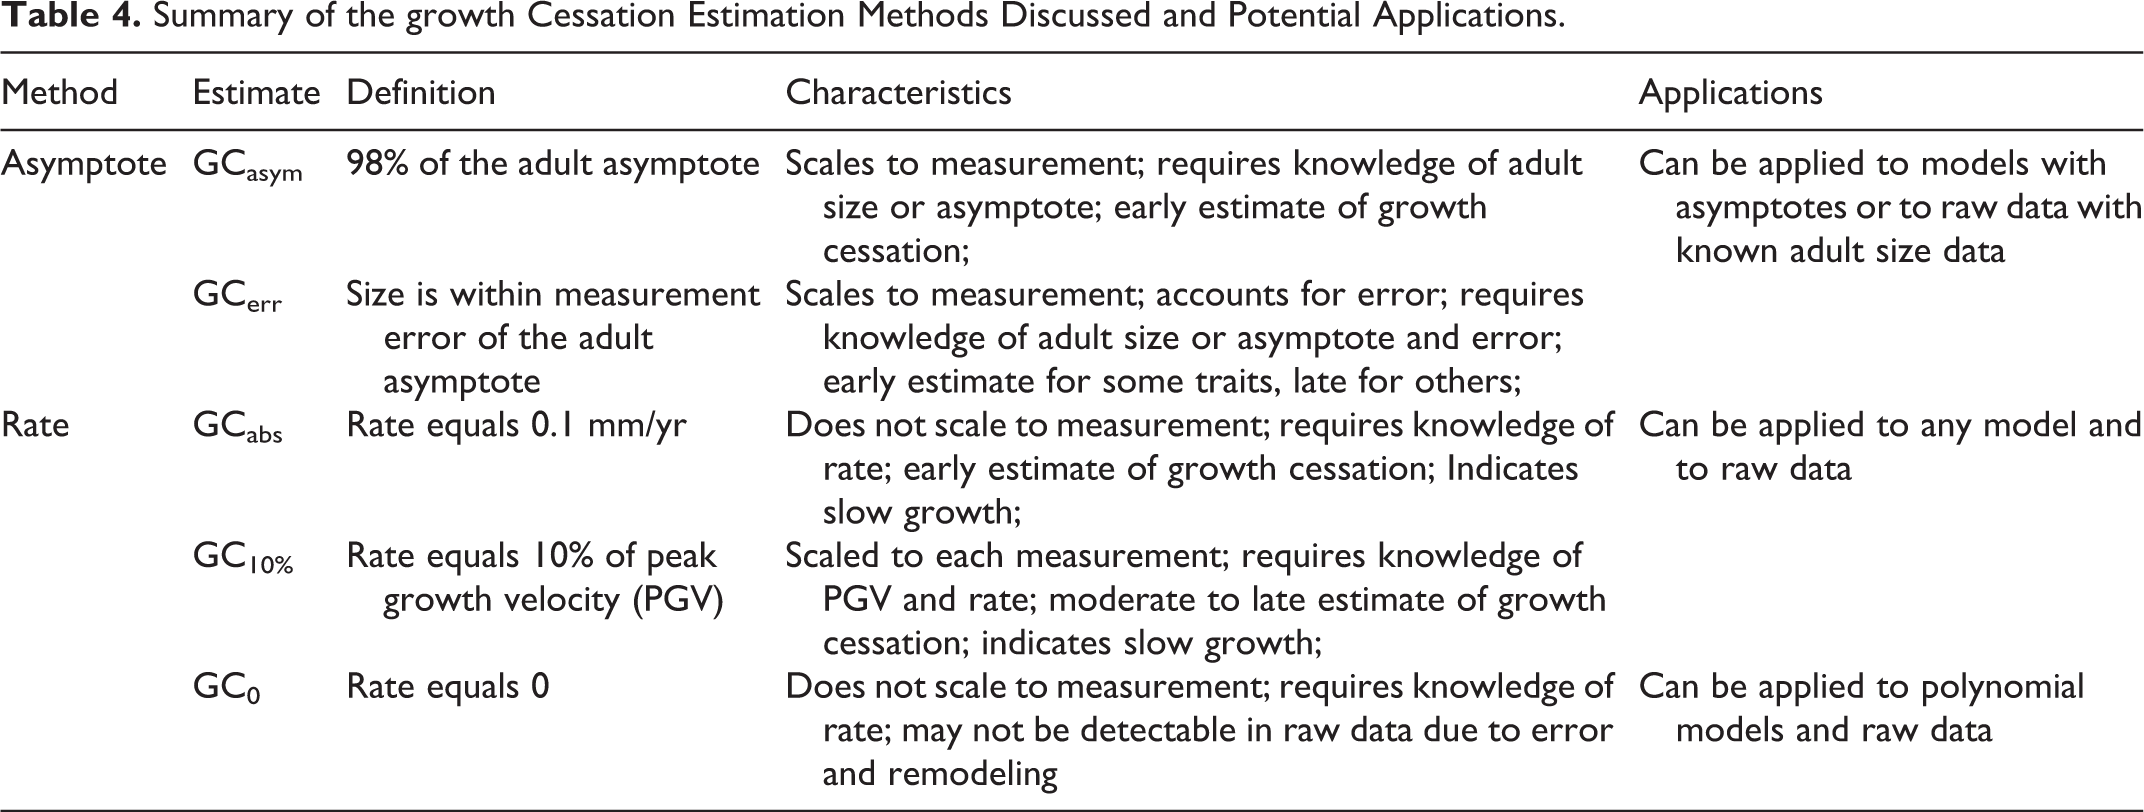
Alternative rate-based methods may be preferable for their applicability to linear and nonlinear models, as well as raw data. Based on our findings, an absolute rate threshold, as in GCabs, varies in its position relative to other GC estimates. The other rate-based method of GC estimation, GC10%, is less variable because the rate threshold is scaled to the size and rate of growth of the particular measurement. GC10% does require, however, knowledge of the PGV, although population-level data may provide an adequate estimate of the PGV for an individual patient.
Our findings in unaffected individuals are consistent with a previous study, showing that growth in the vertical dimensions persists later than growth in other craniofacial dimensions in patients with complete unilateral cleft lip and palate (CUCLP; Daskalogiannakis & Mehta, 2009). Although there was variation, roughly 48% of patients with CUCLP and 65% of patients with complete bilateral cleft lip and palate were deemed to require orthognathic surgery (Daskalogiannakis & Mehta, 2009). Since orthognathic surgery can have a significant effect on further facial growth and development in patients with cleft lip and palate, end-stage reconstruction should be considered when these patients have completed most of their facial growth. Most patients with cleft lip and palate also require reconstruction of congenitally missing teeth, including implants or bridges with comprehensive orthodontic treatment. In the present study, we used N-M (anterior facial height) to represent anterior vertical growth, combining maxillary and mandibular vertical growth. However, even a small change in either maxillary or mandibular dimensions over time could have significant clinical implications. Maxillary vertical growth, including tooth eruption, is critical in placing dental prosthetics, and surgical stability depends upon cessation of mandibular growth.
There are several potential applications of our findings. First, the ages and sizes at growth cessation estimated here (Tables 2 and 3) may be useful benchmarks for clinicians in the challenging position of deciding whether a patient has or has not ceased growth in the relevant measurements. More generally, our findings demonstrate and compare the strengths and weaknesses of 4 growth cessation estimates (Table 4). We would encourage researchers and clinicians to utilize the specific definitions of growth cessation most appropriate to their patient populations and to be conscious of and explicit about the challenges of estimating growth cessation in craniofacial growth data.
Adaptive Phase
Several studies have described postadolescent craniofacial change, although perspectives as to the clinical importance vary. Bishara et al. (1994) note several limitations of studies of postadolescent change, particularly the inclusion of research patients as young as 17 to 18 years of age for whom adolescent growth may be ongoing. Depending upon the definition of growth cessation used, the results of the present study indicate that posterior facial height growth ceases as early as 17.5 and 20.5 years of age in females and males, respectively, or as late as 25.6 and 25.4 years of age in females and males, respectively. These findings are consistent with previous studies demonstrating continued change past 18 years of age, including observation of posterior mandibular rotation by Forsberg from 24 to 34 years of age (Forsberg et al., 1991).
The amount of dimensional change observed after 25 years of age in previous studies tends to be subtle, falling in some cases within the range of measurement error. Forsberg found 1.6 mm of growth in anterior facial height from 25 to 45 years of age (Forsberg et al., 1991). In a semilongitudinal study of the adult craniofacial skeleton, Behrents (1985a, 1985b) collected most of the cephalometrics analyzed in the present study (Go-Po, N-B, N-M, S-Go) and found changes of −1.4 to 1.6 mm from 21 to 30 years of age in those 4 dimensions. Bishara et al. (1994) found small craniofacial dimension increases in females from 26 to 46 years of age and in males from 25 to 45 years of age; the greatest absolute change observed was a 2.0 mm increase in average male anterior facial height (N-M). Using linear regression models, Fudalej et al. (2007) predicted 0.6 and 0.7 mm of anterior facial growth from 24 to 40 years of age in males and females, respectively.
One benefit of the double logistic model is that it does allow for slow enlargement after the active phase has ceased, which may more accurately reflect morphological changes in the face during the adaptive phase. Bishara et al. (1994) described this period of gradual change as part of the normal maturational process. Because remodeling persists throughout the lifetime, there is no age at which the human skull becomes static and unchanging (Behrents, 1985b). Our assessments of growth cessation are, therefore, focused upon identifying the end of the phase in which growth can be usefully redirected or can interfere with or reverse treatment.
The asymptotic f values presented here may underestimate the maximum size attained for some dimensions during the lifetime because our sample only extends to 27 years of age and its sampling density is reduced after approximately 20 years of age (Sherwood et al., 2020). For this reason, we would emphasize that our findings apply to the transition from the growth phase to the adaptive phase and are not intended to imply that alterations to shape and size do not continue throughout the adaptive phase of the lifespan.
Future Directions
Growth cessation is one of several milestones whose estimation is crucial to developing precision medicine approaches to craniofacial treatment. Going forward, we will evaluate different aspects of maxillary and mandibular growth, including relationships between the anterior and posterior regions. Comparing early and late maturers and different facial types in the vertical dimension can further define minor changes in growth cessation at the individual level. Population-level models of growth are not necessarily adaptable to every patient, especially because sample populations often overrepresent people of European ancestry without capturing the full range of human variation in growth and maturation. The development of additional statistical methods, such as multiple methods for estimating growth cessation, broadens the applicability of existing data to diverse patients and their individual needs. Craniofacial research and treatment are increasingly accounting for the multivariate, 3-dimensional nature of craniofacial morphology, and we are utilizing the cessation methods described here in multivariate frameworks and in studies of growth based on data from 3-dimensional cone-beam computed tomography images.
Conclusions
Adolescent growth cessation is an important milestone for treatment planning, yet the approach to estimating this milestone may differ in accordance with the clinical needs of the patient. Growth cessation can be defined several ways, due in part to the diverse statistical methods used to approximate growth curves and in part to subtle morphological changes that extend beyond adolescence. Here we assess and discuss 4 methods of growth cessation estimation as applied to nonlinear models of growth in 5 craniofacial dimensions. We find that the order of estimates is consistent within rate- and asymptote-based methods, with variable overlap between the 2 methods. Ultimately, the ideal method of growth cessation estimation will depend upon the data and resources available to the clinician and the needs of the individual patient; we hope this presentation and discussion of the strengths and limitations of several growth cessation estimation methods can assist clinicians in treatment planning.
Supplemental Material
Supplemental Material, sj-r-1-cpc-10.1177_10556656211002675 - Estimating Craniofacial Growth Cessation: Comparison of Asymptote- and Rate-Based Methods
Supplemental Material, sj-r-1-cpc-10.1177_10556656211002675 for Estimating Craniofacial Growth Cessation: Comparison of Asymptote- and Rate-Based Methods by Anna M. Hardin, Ryan P. Knigge, Hee Soo Oh, Manish Valiathan, Dana L. Duren, Kieran P. McNulty, Kevin M. Middleton and Richard J. Sherwood in The Cleft Palate-Craniofacial Journal
Supplemental Material
Supplemental Material, sj-r-2-cpc-10.1177_10556656211002675 - Estimating Craniofacial Growth Cessation: Comparison of Asymptote- and Rate-Based Methods
Supplemental Material, sj-r-2-cpc-10.1177_10556656211002675 for Estimating Craniofacial Growth Cessation: Comparison of Asymptote- and Rate-Based Methods by Anna M. Hardin, Ryan P. Knigge, Hee Soo Oh, Manish Valiathan, Dana L. Duren, Kieran P. McNulty, Kevin M. Middleton and Richard J. Sherwood in The Cleft Palate-Craniofacial Journal
Supplemental Material
Supplemental Material, sj-r-3-cpc-10.1177_10556656211002675 - Estimating Craniofacial Growth Cessation: Comparison of Asymptote- and Rate-Based Methods
Supplemental Material, sj-r-3-cpc-10.1177_10556656211002675 for Estimating Craniofacial Growth Cessation: Comparison of Asymptote- and Rate-Based Methods by Anna M. Hardin, Ryan P. Knigge, Hee Soo Oh, Manish Valiathan, Dana L. Duren, Kieran P. McNulty, Kevin M. Middleton and Richard J. Sherwood in The Cleft Palate-Craniofacial Journal
Supplemental Material
Supplemental Material, sj-r-4-cpc-10.1177_10556656211002675 - Estimating Craniofacial Growth Cessation: Comparison of Asymptote- and Rate-Based Methods
Supplemental Material, sj-r-4-cpc-10.1177_10556656211002675 for Estimating Craniofacial Growth Cessation: Comparison of Asymptote- and Rate-Based Methods by Anna M. Hardin, Ryan P. Knigge, Hee Soo Oh, Manish Valiathan, Dana L. Duren, Kieran P. McNulty, Kevin M. Middleton and Richard J. Sherwood in The Cleft Palate-Craniofacial Journal
Footnotes
Acknowledgments
The research program of the Craniofacial Growth Consortium is indebted to the numerous investigators, researchers, and staff who contributed their time and effort into the studies now combined into the CGCS. The authors thank Kim Lever, Christina Holzhauser, Nicole Odom, Heather Craig, Alice Walton, Nicole Dedrick, Lori Clark, Sheldon Baumrind, Chanyara Seng, Mona al Awadi, Risa Baumrind, Shiva Naicker, Tae Keong Kim, Sharon Lawrence, Torrey Taylor, and Beverly Barry. The authors also thank the American Association of Orthodontists Foundation (AAOF) Craniofacial Growth Legacy Collection for their support. The content is solely the responsibility of the authors and does not necessarily represent the official views of the National Institutes of Health. The authors thank the almost 2000 study participants who make up the overall study sample. These individuals have rightfully earned a place of honor in the history of human growth, development, and aging.
Declaration of Conflicting Interests
The author(s) declared no potential conflicts of interest with respect to the research, authorship, and/or publication of this article.
Funding
The author(s) disclosed receipt of the following financial support for the research, authorship, and/or publication of this article: This work was supported financially by the NIH award numbers provided. Those grant numbers are: F32DE029104 and R01DE024732.
Supplemental Material
Supplemental material for this article is available online.
References
Supplementary Material
Please find the following supplemental material available below.
For Open Access articles published under a Creative Commons License, all supplemental material carries the same license as the article it is associated with.
For non-Open Access articles published, all supplemental material carries a non-exclusive license, and permission requests for re-use of supplemental material or any part of supplemental material shall be sent directly to the copyright owner as specified in the copyright notice associated with the article.