
Abstract
Objective
Significant evidence links epigenetic processes governing the dynamics of DNA methylation and demethylation to an increased risk of syndromic and nonsyndromic cleft lip and/or cleft palate (CL/P). Previously, we characterized mesenchymal stem/stromal cells (MSCs) at different stages of osteogenic differentiation in the mouse incisor dental pulp. The main objective of this research was to characterize the transcriptional landscape of regulatory genes associated with DNA methylation and demethylation at a single-cell resolution.
Design
We used single-cell RNA sequencing (scRNA-seq) data to characterize transcriptome in individual subpopulations of MSCs in the mouse incisor dental pulp.
Settings
The biomedical research institution.
Patients/Participants
This study did not include patients.
Interventions
This study collected and analyzed data on the single-cell RNA expssion in the mouse incisor dental pulp.
Main outcome measure(s)
Molecular regulators of DNA methylation/demethylation exhibit differential transcriptional landscape in different subpopulations of osteogenic progenitor cells.
Results
scRNA-seq analysis revealed that genes encoding DNA methylation and demethylation enzymes (DNA methyltransferases and members of the ten-eleven translocation family of methylcytosine dioxygenases), methyl-DNA binding domain proteins, as well as transcription factors and chromatin remodeling proteins that cooperate with DNA methylation machinery are differentially expressed within distinct subpopulations of MSCs that undergo different stages of osteogenic differentiation.
Conclusions
These findings suggest some mechanistic insights into a potential link between epigenetic alterations and multifactorial causes of CL/P phenotypes.
Introduction
Cleft lip and/or palate (CL/P) remain one of the most prevalent craniofacial birth defects in humans. A growing body of evidence points to epigenetic factors as a primary contributor to CL/P. Research suggests that alterations in DNA methylation may play a role in the manifestation of cleft palate in mice. 1 DNA methylation at the 5-position of cytosine (5 mC) is one of the main epigenetic activities that causes chromatin modifications and changes in gene expression during development and cell differentiation. DNA methylation is catalyzed by the DNA methyltransferases (DNMT), DNMT1, DNMT3A and DNMT3B.2,3 Interestingly, the upregulation of Dnmt3a in mice induces global hypermethylation in fetal palate tissue, causing palate malformation. 4
Numerous studies have demonstrated the association of DNA methylation at specific genomic sites with both non-familial and familial nonsyndromic CL/P (NSCL/P). 5 For example, DNA methylation of developmental genes involved in the TGF-β, Notch and Wnt signaling pathways has been linked to the formation of NSCL/P. 6 Monozygotic twin studies have revealed that differential DNA methylation is one of the main contributors of NSCL/P.7,8 For instance, hypermethylation of WNT3A has been associated with risk of NSCL/P. 9 In mice, hypermethylation of Fgf16 and Tbx22 has been associated with decreased gene expression and developmental failure of palatal fusion, resulting in the formation of cleft palate. 10 Another study demonstrated that altered methylation in exon 5 of TBX22 correlates with the regulation of the palatal shelf fusion. 11 Seelan et al. reported that changes in DNA methylation of endogenous retroviral elements in the mouse branchial arch can trigger cleft palate. 12 This finding is consistent with another report suggesting that aberrant DNA methylation in LINE-1 and IRF6 can contribute to the development of NSCL/P. 13 Genetic variations in VAX1, LOC146880 and NTN1 have been proposed to increase risk of NSCL/P via changes in the methylome. 14
Differentially methylated DNA regions have been found in a number of developmental genes required for palate formation, including VTRNA2-1, WNT3A, WNT9B, MIR140, and LHX8.15,16 Differences in DNA methylation of the cis-acting regulatory elements correlate with the regulation of LINE-1, IRF6, HDAC4, SMAD3, PDGFRB, TCF7L2, and MID1, which could contribute to palatal fusion.17–20 Specifically, research suggest that DNA methylation of the enhancer regions of HDAC4 plays an important regulatory role during palate development (Shu et al., 2018). Sharp et al. reported differentially methylated genomic regions across the genes TBX1, COL11A2, HOXA2, and PDGFRA, which have been previously implicated in the development of orofacial clefts. 21
Conversely, the ten-eleven translocation (TET) family of dioxygenases is responsible for demethylating 5 mC on DNA by oxidizing the methyl group of 5 mC to 5-hydroxymethylcytosine (5 hmC).22–24 TET enzymes have important roles in cell lineage specification, differentiation and development. In addition to DNMTs and TETs, the establishment of the methylome requires epigenetic enzymes, transcription factors (TFs), and methyl-DNA binding domain (MBD) proteins. An increasing number of studies suggest that crosstalk among DNMTs, TET enzymes, MBD proteins, and chromatin remodeling is involved in a wide range of important developmental processes.25,26
A recent study reported that cells derived from the muscles of the soft palate have phenotypic characteristics similar to mesenchymal stem/stromal cells (MSCs) and may have clinical relevance in the surgical rehabilitation of patients with craniofacial anomalies including cleft palate. 27 The improved osteogenic differentiation of MSCs can potentially impact palatal bone regeneration, which would have immediate clinical applications. 28 Therefore, MSCs could play an increasingly important role in the surgical rehabilitation of patients with cleft palate. MSCs can be obtained from different sources, including bone marrow, adipose, and dental tissues. 29 Recent studies revealed that the dental pulp-derived MSCs are important for tissue regeneration.30–33 Our previous research identified several distinct subclasses of MSCs in the mouse incisor dental pulp.34,35 Here, we delineate this data to define the single-cell transcriptome of nuclear regulators associated with DNA methylation/demethylation.
Materials and Methods
Single-Cell RNA Sequencing (scRNA-seq) and Data Analysis
We prepared primary pulp from the incisors of 5- to 6-day-old C57BL/6 mice according to previously described procedures. 36 The incisor dental pulp was isolated from 25 pups of mixed sex. We assessed the viability of each single-cell suspension using a Countess II FL Automated Cell Counter (Thermo Fisher Scientific Inc., Waltham, MA). We loaded suspensions of dissociated cells onto independent single channels of a Chromium Controller (10 × Genomics, Pleasanton, CA) single-cell platform. Briefly, we loaded ∼8112 single cells for capture using a Chromium Single Cell 3′ Reagent kit, v2 Chemistry (10 × Genomics). Following capture and lysis, we synthesized and amplified (14 cycles) complementary DNA as per the 10 × Genomics protocol. We applied the amplified cDNA to construct an Illumina sequencing library and sequenced on a single lane of a HiSeq 4000 (Illumina). We filtered the dental pulp sample in three passes. During FASTQ generation, we excluded reads with more than one mismatch in the 8 bp i7 index. During alignment (using the STAR aligner), we retained only reads with mapping quality (MAPQ) scores greater than 255. We excluded reads containing bases with Q30 scores below 3. After alignment, cell barcodes were filtered (up to one mismatch) against a whitelist of 737 500 barcodes provided by 10 × Genomics. Then, we distinguished cell-associated barcodes from those associated with ambient mRNA using an adaptively computed unique molecular identifier threshold. After this filtering step, we generated a digital counts matrix for the pulp sample. We used the expression profiles of the incisor pulp cells for the 3500 most highly variable genes (as measured by dispersion)37,38 for neighborhood graph generation (using 30 nearest neighbors) and dimensionality reduction with uniform manifold approximation and projection (UMAP). 39 We performed clustering on this neighborhood graph using the Leiden community detection algorithm. 40 We also conducted ad hoc subclustering on a per-cluster basis to separate visually distinct cell subpopulations. We batch-corrected the neighborhood graph using the batch correction software batch balanced k-nearest neighbor (BBKNN). 41 For FASTQ generation and alignment, we converted Illumina base call files to FASTQs using 10xCell Ranger 3.0.2 and aligned FASTQ files to the mouse genome mm10.
Genome-Wide ATAC-seq, hMeDIP-seq and RNA-seq
Assay for Transposase-Accessible Chromatin using sequencing (ATAC-seq), hydroxymethylated DNA immunoprecipitation sequencing (hMeDIP-seq) and RNA-seq services were performed by Active Motif (Carlsbad, CA). RNA isolation was performed using the RNAeasy Mini/Midi kit (Qiagen, Germantown, MD). RNA-seq was performed using an Illumina NextSeq 500 to generate 42-nt paired-end sequences. For ATAC-seq and RNA-seq, the paired-end 42-bp sequencing reads generated by Illumina NextSeq 500 sequencing were mapped to the genome using the Burrows–Wheeler aligner (BWA) algorithm with default settings. For hMeDIP-seq, genomic DNA was isolated using the Monarch Genomic DNA Purification kit (New England Biolabs, Ipswich, MA) following the manufacturer's instructions. DNA was sonicated to ∼150–300 bp and Illumina adaptors were ligated to the DNA ends. To generate genome-wide maps of 5 hmC, Active Motif performed hMeDIP-seq experiments using the antibody AM39791 to 5 hmC. The input DNA was used as a control. Finally, immunoprecipitated DNA and input DNA that did not go through the immunoprecipitation step were processed into sequencing libraries and sequenced using the Illumina platform (NextSeq 500, 75-nt single-end).
Genomic regions with high levels of ATAC-seq transposition/tagging events were determined using the MACS2 peak-calling algorithm. 42 Since both reads (tags) from paired-end sequencing represent transposition events, both were used for peak-calling but were treated as single, independent reads. To determine the density of the transposition events along the genome, the genome was divided into 32-bp bins and the number of fragments in each bin was calculated. For this purpose, the reads were extended to 200 bp, which is close to the average length of the sequenced library inserts. In the default analysis, the tag number of all samples was reduced (by random sampling) to the number of tags present in the smallest sample. To compare peak metrics between two or more samples, overlapping intervals were grouped into “merged regions,” which were defined by the start coordinate of the most upstream interval and the end coordinate of the most downstream interval (to determine the union of overlapping intervals). In locations where only one sample had an interval, this interval defined the merged region. After defining the intervals and merged regions, their genomic locations along with their proximities to gene annotations and other genomic features were determined and presented in Excel spreadsheets.
hMeDIP-seq reads were mapped to the mm10 genome using the BWA algorithm with default settings. Alignment information for each read was stored in binary version of the Sequence Alignment Map (BAM) format. For the analysis, only uniquely mapped reads without duplicates were used, and tag numbers were normalized to the lowest number among the samples (by downsampling), which was 19.7 million. Methylated regions (peak intervals) were identified using the Model-based analysis of ChIP-seq (MACS) peak finding algorithm 42 with a default cutoff of p-value = 1e-7. The 5 hmC tag distributions around the genes were determined and presented as average plots (average of values for all target regions).
The RNA-seq fragments were mapped to the reference genome mm10 using the STAR aligner. 43 A fragment assignment step was carried out to count the number of fragments overlapping the genomic sequence. Only read pairs in which both ends aligned at the same chromosome and the same DNA strand were considered for subsequent analyses. Feature counts (fragment per kilobase per million mapped reads (FPKM) assignment to genes) were performed using the Subread package. 44 Gene annotations were originally from the NCBI RefSeq database and were adapted by merging the overlapping exons from the same gene to form a set of disjoint exons for each gene. After obtaining the same table containing the fragments (or reads) of genes, differential analysis was performed using DESeq2. 45
Results
Single-Cell Transcriptome Analysis of DNA Methyltransferases and TET Methylcytosine Dioxygenases
Our previous study revealed that the mouse incisor dental pulp is composed of 16 clusters of cells (Figure 1). 34 In the incisor dental pulp, Dnmt1 is mainly expressed in clusters 6 (ameloblasts), 9 (mitotic MSCs), 14 (Schwann cells), 15 (vascular endothelial cells) and 16 (immune cells), whereas Dnmt3a exhibited a broader expression pattern with enrichment in mesenchymal stromal cells (MSC) clusters 1, 2, 3, 4, 8, and 9, as well as in clusters 6, 11, 13, 14, and 16 (Figure 2, Supplemental Figure 1 and Supplemental Table 1). Conversely, Dnmt3b, Dnmt3c, and Dnmt3l displayed relatively weak or no expression in the incisor dental pulp. Additionally, we analyzed the expression pattern of genes encoding the TET family of dioxygenases. Tet1 is enriched in MSC clusters 1, 2, 3, 4, 8, and 9 and in cluster 14. Tet2 is enriched in MSC clusters 2, 3, 4, 8, and 9, as well as in clusters 6, 13, 15, and 16. Similarly, Tet3 is vigorously expressed in MSC clusters 1, 2, 3, 8, and 9, and in clusters 6, 13, 14, 15, and 16 (Figure 2 and Supplemental Figure 1).
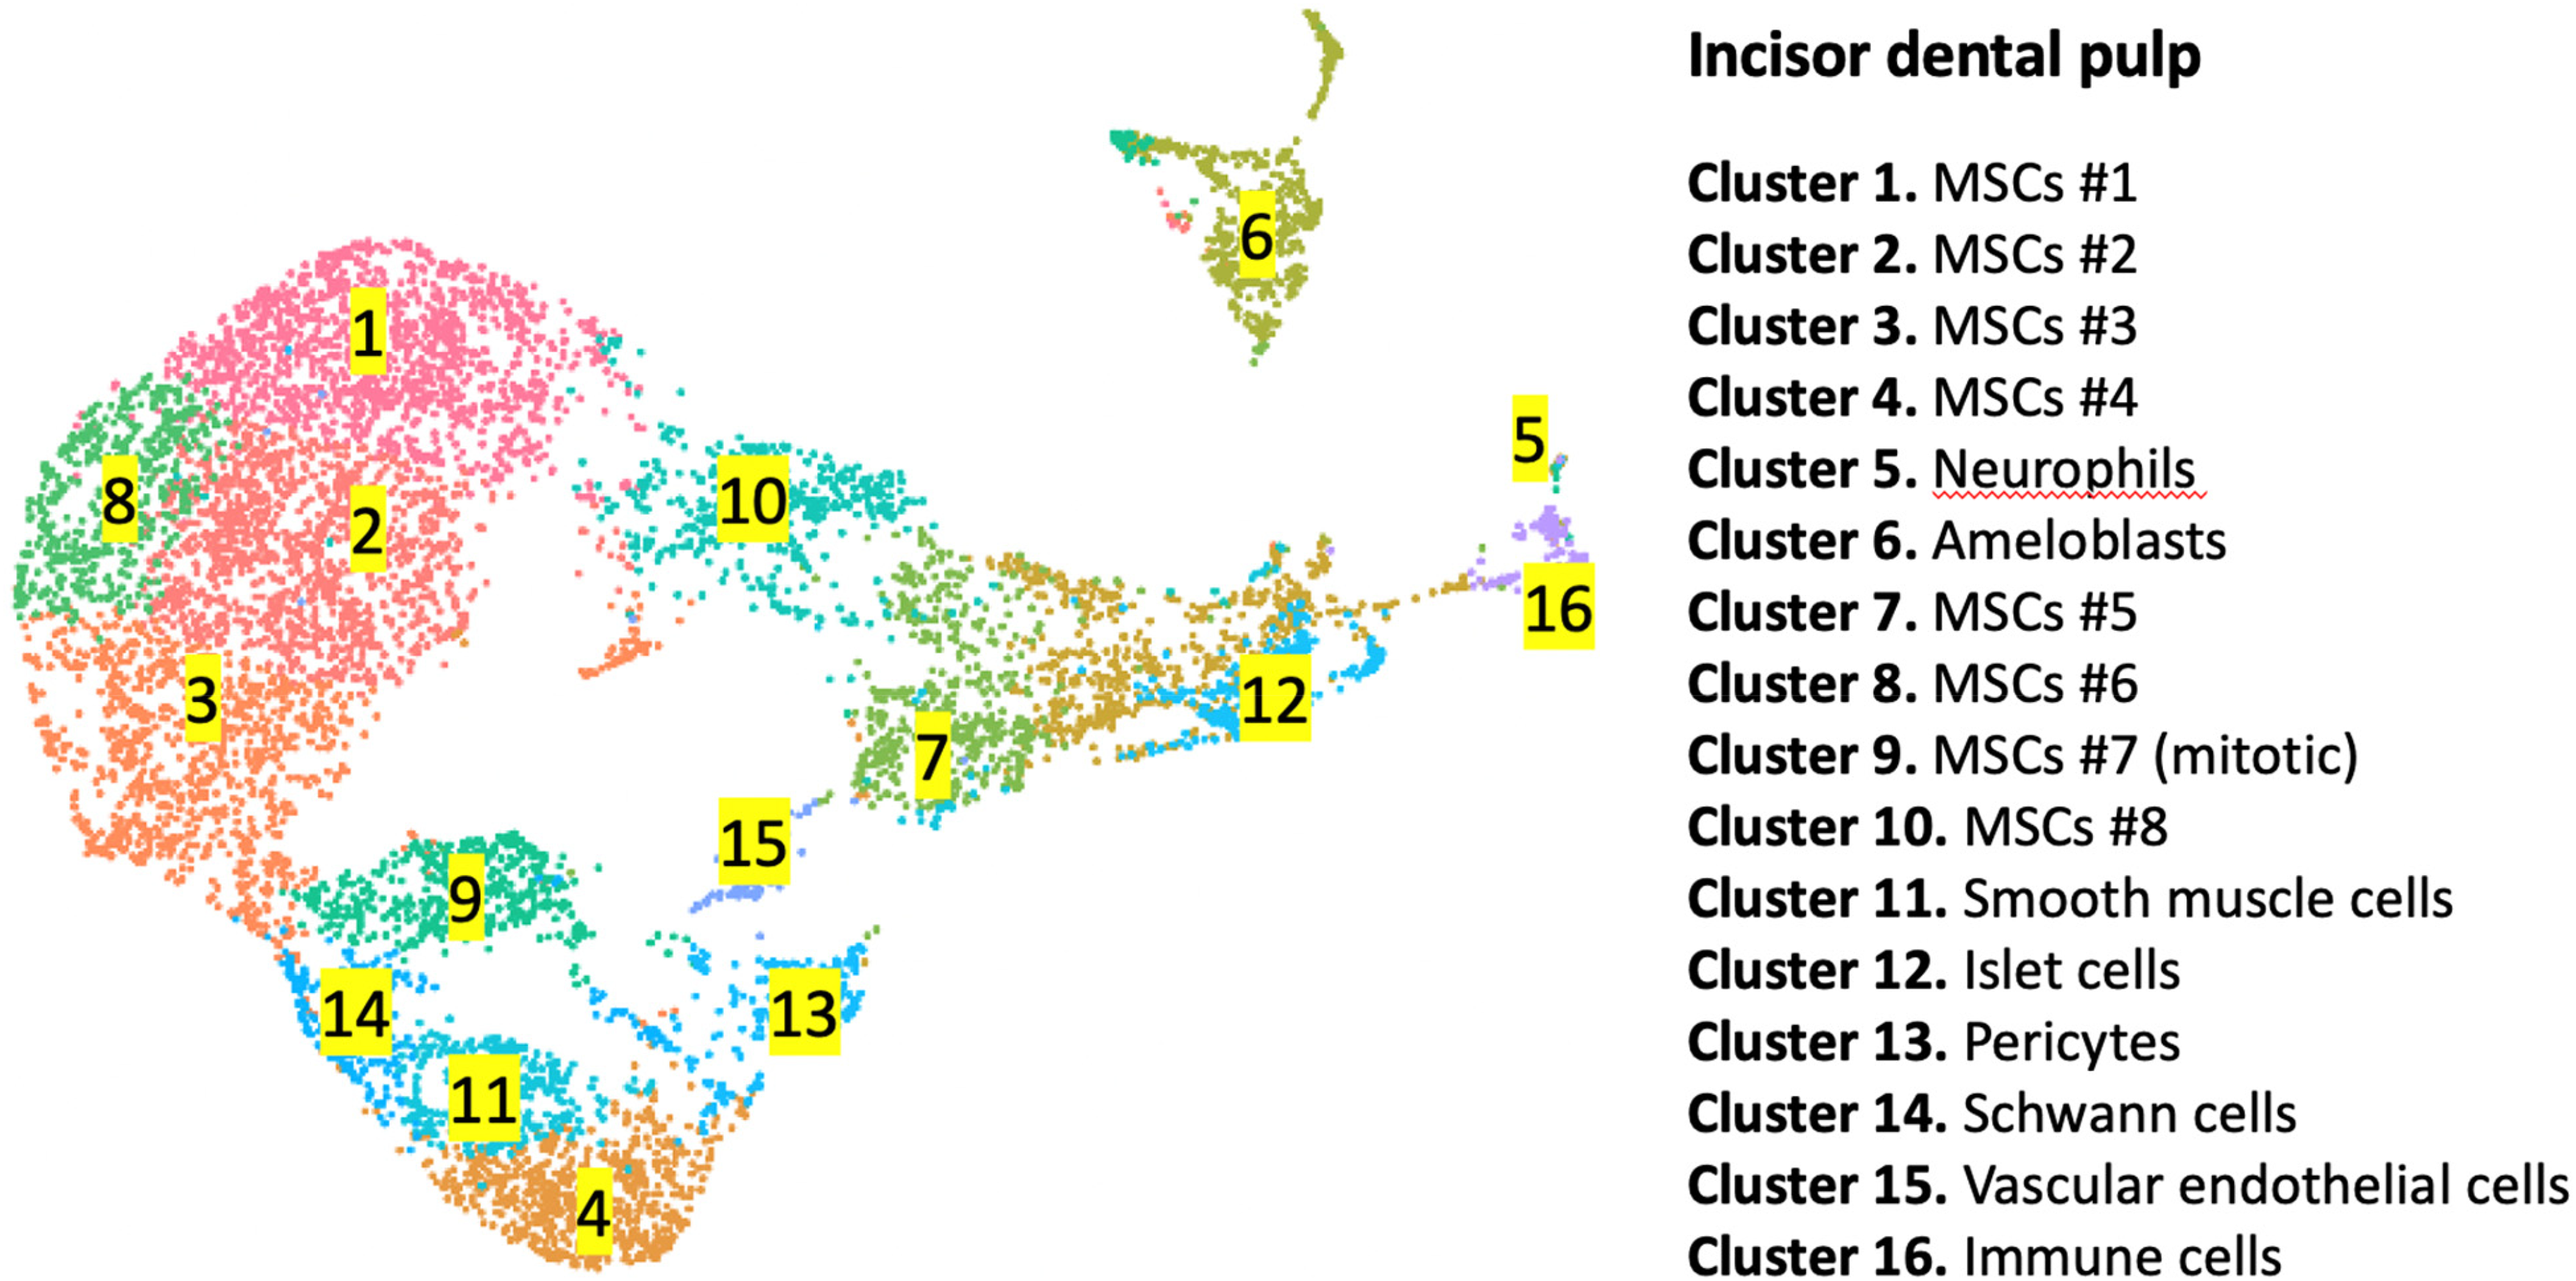
UMAP visualization depicts the single-cell RNA expression profile of 16 cell types in the incisor dental pulp.
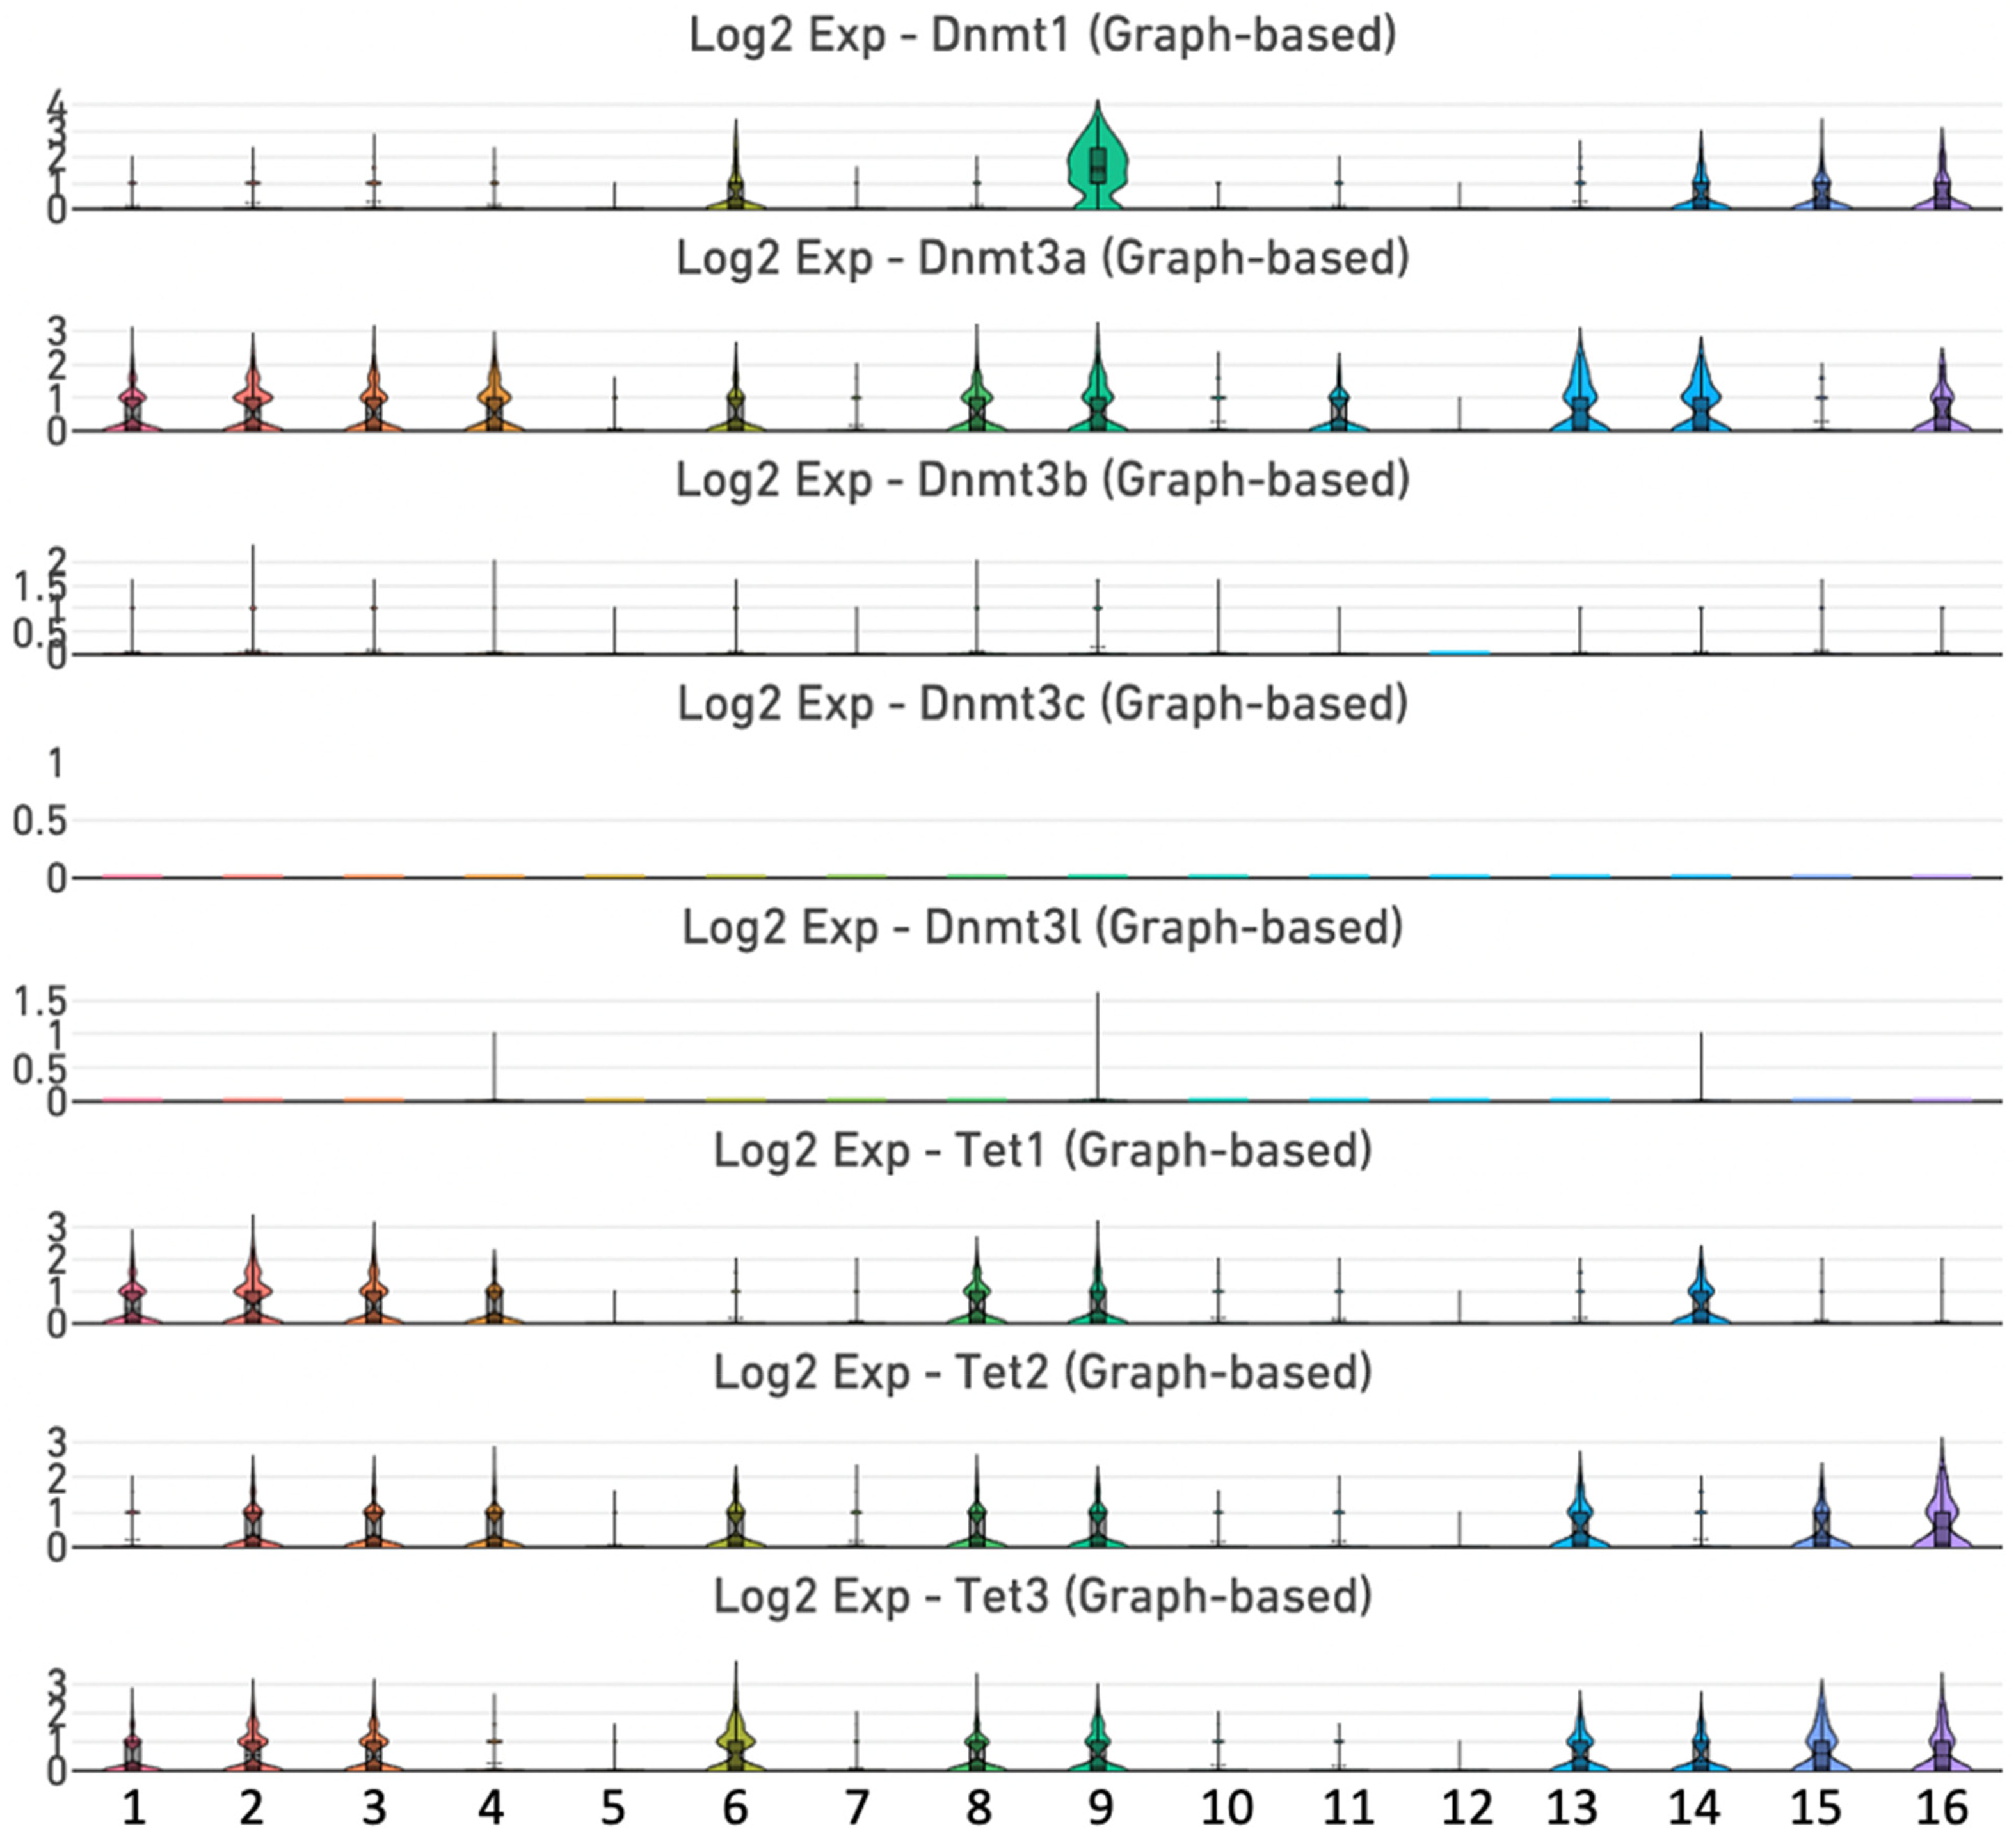
Expression of genes encoding DNA methylation and demethylation enzymes. Violin plots of Dnmt1, Dnmt3a, Dnmt3b, Dnmt3c, Dnmt3 l, Tet1, Tet2 and Tet3 genes.
Single-Cell Transcriptome Analysis of the Methyl-CpG Binding and SRA Domain Protein Families
In mammals, the methylome is specifically recognized by a diverse group of proteins known as methyl-CpG binding proteins, which comprise the MBD family of transcriptional repressors.46–48 MBD proteins coordinate crosstalk among DNA methylation, the chromatin architecture, and histone modifications to control the regulatory networks that govern gene expression. 25 In the mouse incisor dental pulp, we detected expression of Mecp2 in clusters 1, 2, 3, 4, 6, 8, 9, 13, 14, and 15 (Figure 3, Supplemental Figure 2 and Supplemental Table 2). By contrast, Mbd1 expression is limited to clusters 2, 8, and 9, while Mbd2 displayed broad expression in clusters 1, 2, 3, 4, 6, 8, 9, 11, 13, 14, 15, and 16. The expression profile of Mbd3 is similar to that of Mbd2, with additional enrichment in cluster 10. Interestingly, MBD3 is the only known member of the MBD family that binds to 5 hmC at CpG sites.48,49 The expression of Mbd4 is only detected in clusters 1 and 2, whereas the expression of Mbd5 is limited to cluster 2. Mbd6 is expressed in clusters 1, 2, 3, 4, 6, 8, 9 and 16.
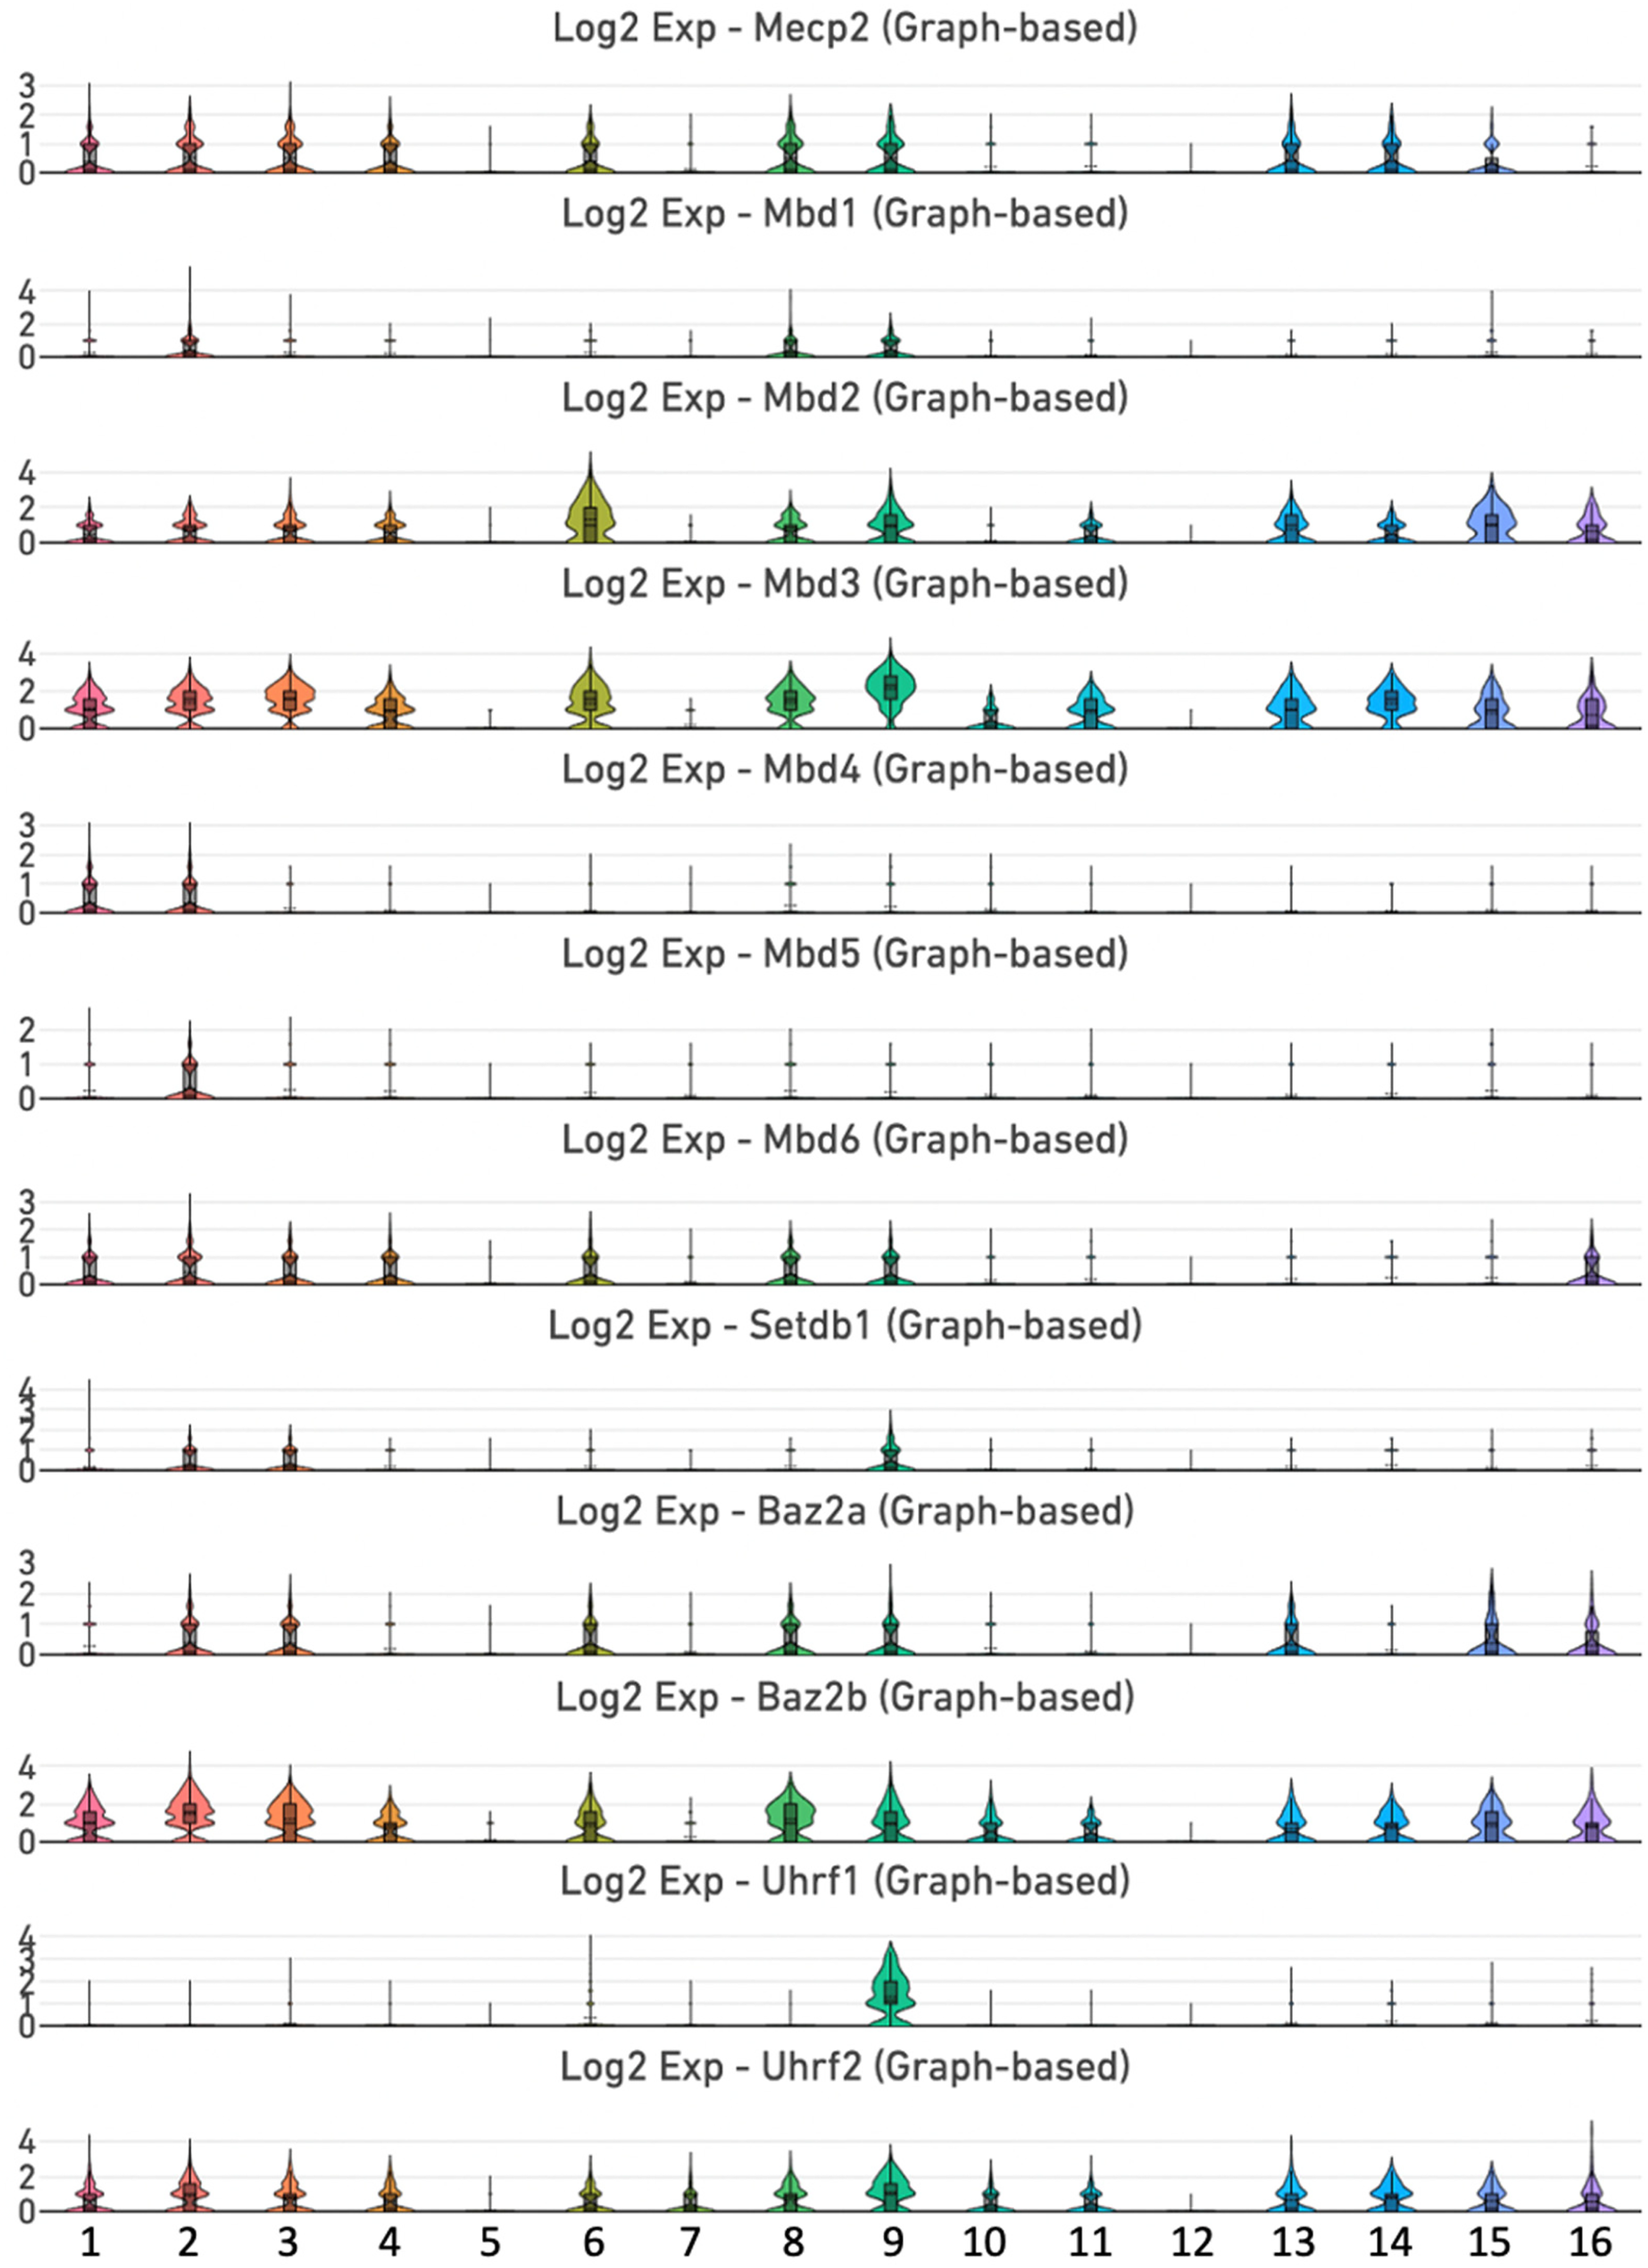
Expression of genes encoding members of the methyl-CpG binding and SRA domain family proteins. Violin plots of Mecp2, Mbd1, Mbd2, Mbd3, Mbd4, Mbd5, Mbd6, Setdb1, Baz2a, Baz2b, Uhrf1 and Uhrf2 genes.
SETDB1 (SET domain bifurcated histone lysine methyltransferase 1) and BAZ2A and BAZ2B (bromodomain adjacent to zinc finger domain protein 2A/B) contain MBD domains that are phylogenetically distinct from those of the core MBD family. 50 Setdb1 is relatively weakly expressed in clusters 2, 3, and 9, whereas Baz2a is enriched in clusters 2, 3, 6, 8, 9, 13, 15, and 16. Baz2b exhibits robust and broad expression in clusters 1, 2, 3, 4, 6, 8, 9, 10, 11, 13, 14, 15, and 16.
UHRF1 and UHRF2 (ubiquitin like with PHD and ring finger domain) are members of the SRA (SET- and RING-associated) domain family of methyl-CpG-binding nuclear regulators that recognize 5 hmC.46,48 The SRA domain is responsible for binding to hemi-methylated DNA. Uhrf1 showed limited expression in cluster 9, representing mitotic MSCs. Conversely, Uhrf2 exhibits a broad expression pattern with enrichment in clusters 1, 2, 3, 4, 6, 7, 8, 9, 10, 11, 13, 14, 15, and 16 (Figure 3 and Supplemental Figure 2).
Single-Cell Transcriptome Analysis of the Methyl-CpG Binding Zinc-Finger Proteins of the Kaiso Family and the Methylome-Binding TFs
We analyzed the transcriptional landscape of a group of TFs that associate with DNA methylation and demethylation.46–48 The ZBTB (zinc finger and broad, tramtrack and brick domain-containing protein) family comprises a large group of TFs that are critical for lineage commitment and differentiation.48,51,52 We detected expression of Zbtb4 in clusters 1, 2, 4 and 8 (Figure 4, Supplemental Figure 3 and Supplemental Table 1). By contrast, Zbtb33 is weakly expressed in all clusters, while Zbtb38 is vigorously expressed in clusters 1, 2, 3, 6, 8, 9, and 13. On the contrary, expression of Zfp57 is low in all clusters. KLF4, WT1, EGR1, and CCCTC-binding factor (CTCF) are other zinc finger-type TFs that bind to the methylome. 52 KLF4 (gut-enriched Kruppel-like factor) is a member of the Kruppel-like factor (KLF) family of zinc finger TFs. Klf4 is broadly enriched in clusters 1, 2, 3, 4, 6, 7, 8, 9, 10, 11, 13, 14, 15, and 16. WT1 is a TF that contains four zinc fingers motifs. The weak expression of Wt1 is restricted to clusters 2, 3, and 6. EGR1 is another zinc finger TF associated with diverse cellular functions. 52 Egr1 displays very broad and vigorous expression in the incisor dental pulp, with enrichment in clusters 1, 2, 3, 4, 5, 6, 7, 8, 9, 10, 11, 13, 14, 15, and 16. CTCF, a diverse nuclear regulator with chromatin insulator activity, contains 11 zinc finger motifs. 52 Ctcf exhibits broad expression in clusters 1, 2, 3, 4, 6, 8, 9, 10, 11, 13, 14, 15 and 16 (Figure 4 and Supplemental Figure 3).
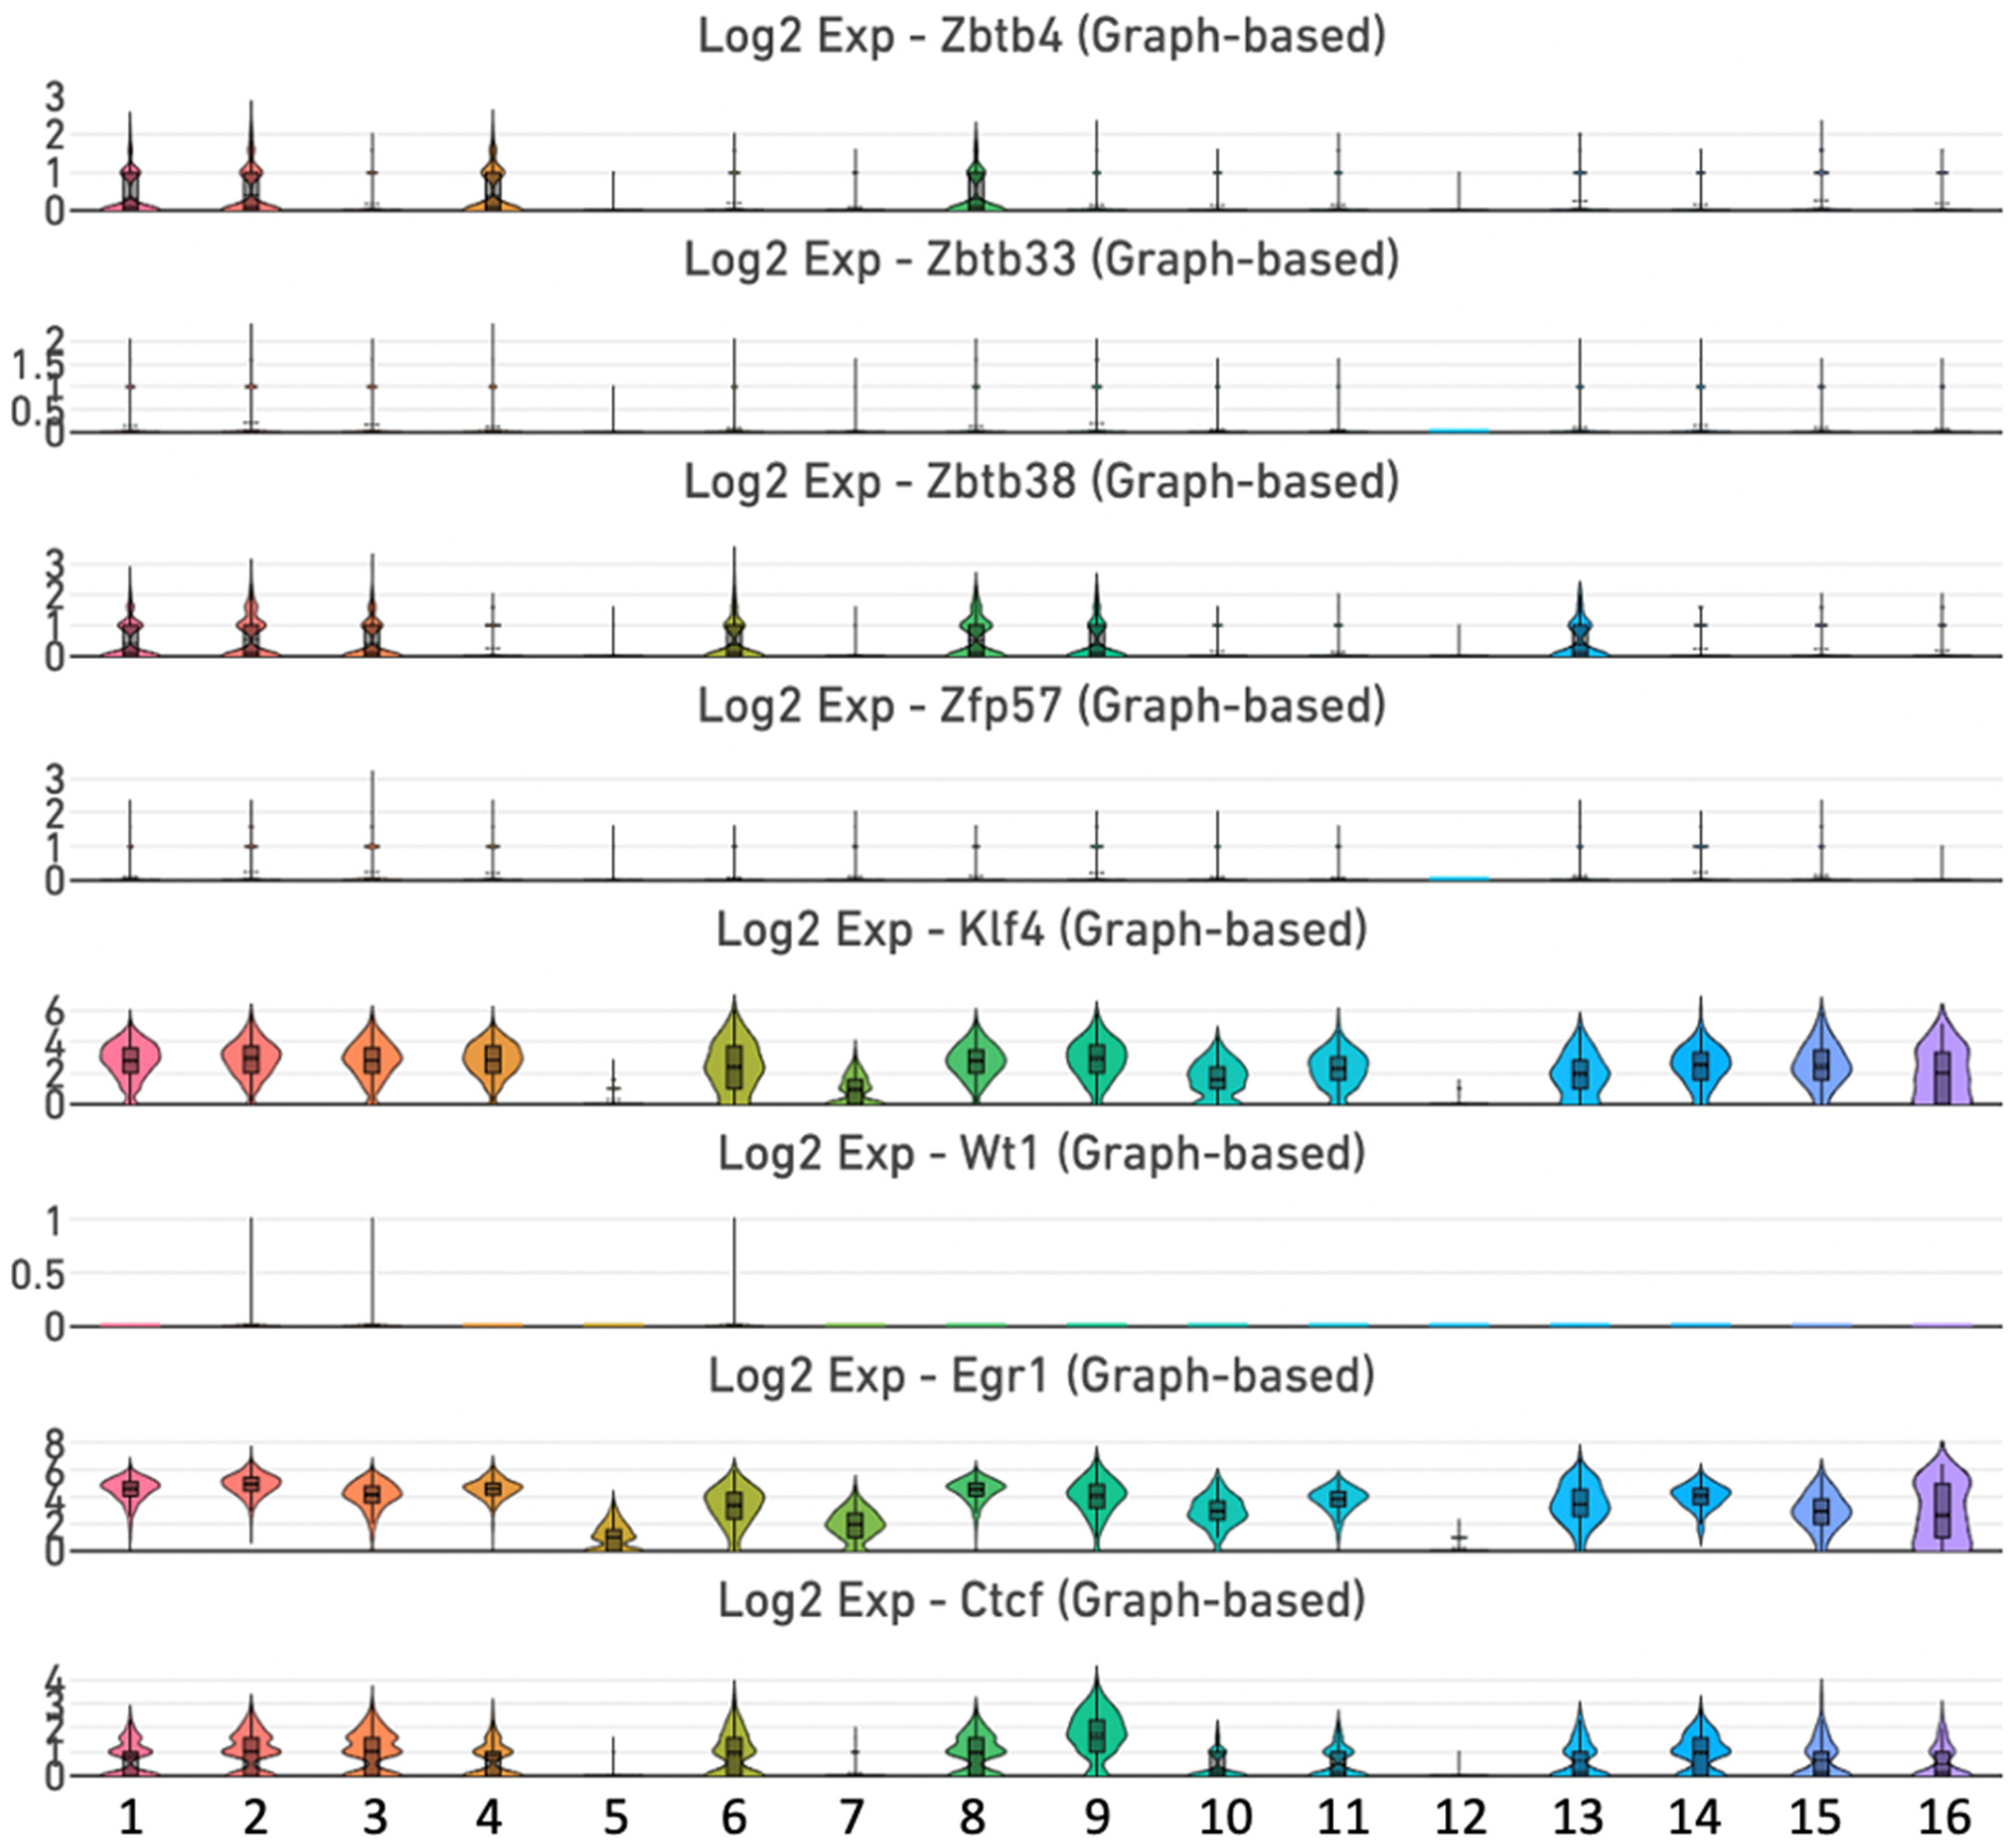
Expression of genes encoding methyl-CpG binding zinc-finger proteins of the Kaiso family and methylome-binding transcription factors. Violin plots of the Zbtb4, Zbtb33, Zbtb38, Zfp57, Klf4, Wt1, Egr1, and Ctcf genes.
Chromatin Accessibility of Methylome-Associated Factors
Genomic regions of actively transcribed genes retain open chromatin states. 53 Hence, we investigated the chromatin structure with ATAC-seq to demonstrate chromatin accessibility across DNA methylation/demethylation regulators. According to scRNA-seq and bulk RNA-seq, Dnmt3a, Tet1, and Mbd3 are vigorously expressed in the incisor dental pulp (Figures 2, 4 and 5). Moreover, the gene body regions of these genes, particularly the transcription start sites and promoter regions, displayed strong ATAC-seq peaks, a hallmark feature of open chromatin (Figure 5A to C). The enzymatic conversion of 5 mC to 5 hmC is an important regulatory mechanism associated with gene expression.22–24,46–50 5 hmC is associated with actively transcribed genes during lineage specification and differentiation.22–24 Using hMeDIP-seq, we observed that the gene bodies of Dnmt3a, Tet1 and Mbd3 are significantly enriched in 5 hmC. Conversely, scRNA-seq and bulk RNA-seq revealed that Dnmt3c, Dnmt3l, and Wt1 are not expressed in the dental pulp (Figures 2, 4 and 5). ATAC-seq analysis showed that chromatin remains in a closed state at the gene body regions (Figure 5D to F). This observation is consistent with the hMeDIP-seq results, which show low levels of 5 hmC at these genes. Collectively, our studies confirmed a significant correlation between gene expression and the chromatin organization of nuclear regulators associated with the methylome in the mouse incisor dental pulp.

Chromatin accessibility, 5hmC landscape and bulk RNA expression of methylome regulators in the mouse incisor dental pulp. (A) Strong ATAC-seq peaks are present at the transcription start site, promoter, and gene body of Dnmt3a. The 5hmC peaks are high across the genomic region of Dnmt3a, indicating that 5hmC is enriched in the Dot1L locus. The epigenetic landscape correlates with robust expression of Dnmt3a in the dental pulp. (B,C) Tet1 and Mbd3 are also highly expressed in dental pulp. We detected strong ATAC-seq and 5hmC peaks in the promoters and gene bodies of these genes. (D,E,F) Dnmt3c, Dnmt3 l, and Wt1 are not expressed in the dental pulp. We failed to detect significant ATAC-seq or 5hmC signals in the chromatin of these genes.
Single-Cell Transcriptome Analysis of Interacting Partners of DNMT3A and TET1
Previously, Gu et al. revealed that DNMT3A and TET1 cooperate to control the epigenetic landscape of non-coding regulatory regions in mouse embryonic stem cells (ESCs). 54 Another report demonstrated that DNMT3A and TET1 engage in competitive binding to establish the global DNA methylation pattern in human ESCs. 55 Both proteins cooperatively interact with a specific set of chromatin remodeling enzymes and TFs. 54 Hence, a system-level understanding of the epigenetic mechanisms mediated by DNMTs and TET enzymes is largely dependent on protein interactions. By analyzing the STRING interaction network (https://string-db.org), we discovered that DNMT3A and TET1 have a specific set of interacting partners. We identified SETDB1, EZH2, EHMT2, HDAC1, and CBX4 as interacting partners of DNMT3A, and SIN3A, OGT, TDG, and HIF1A as proteins that physically associate with TET1 (Figure 6A).
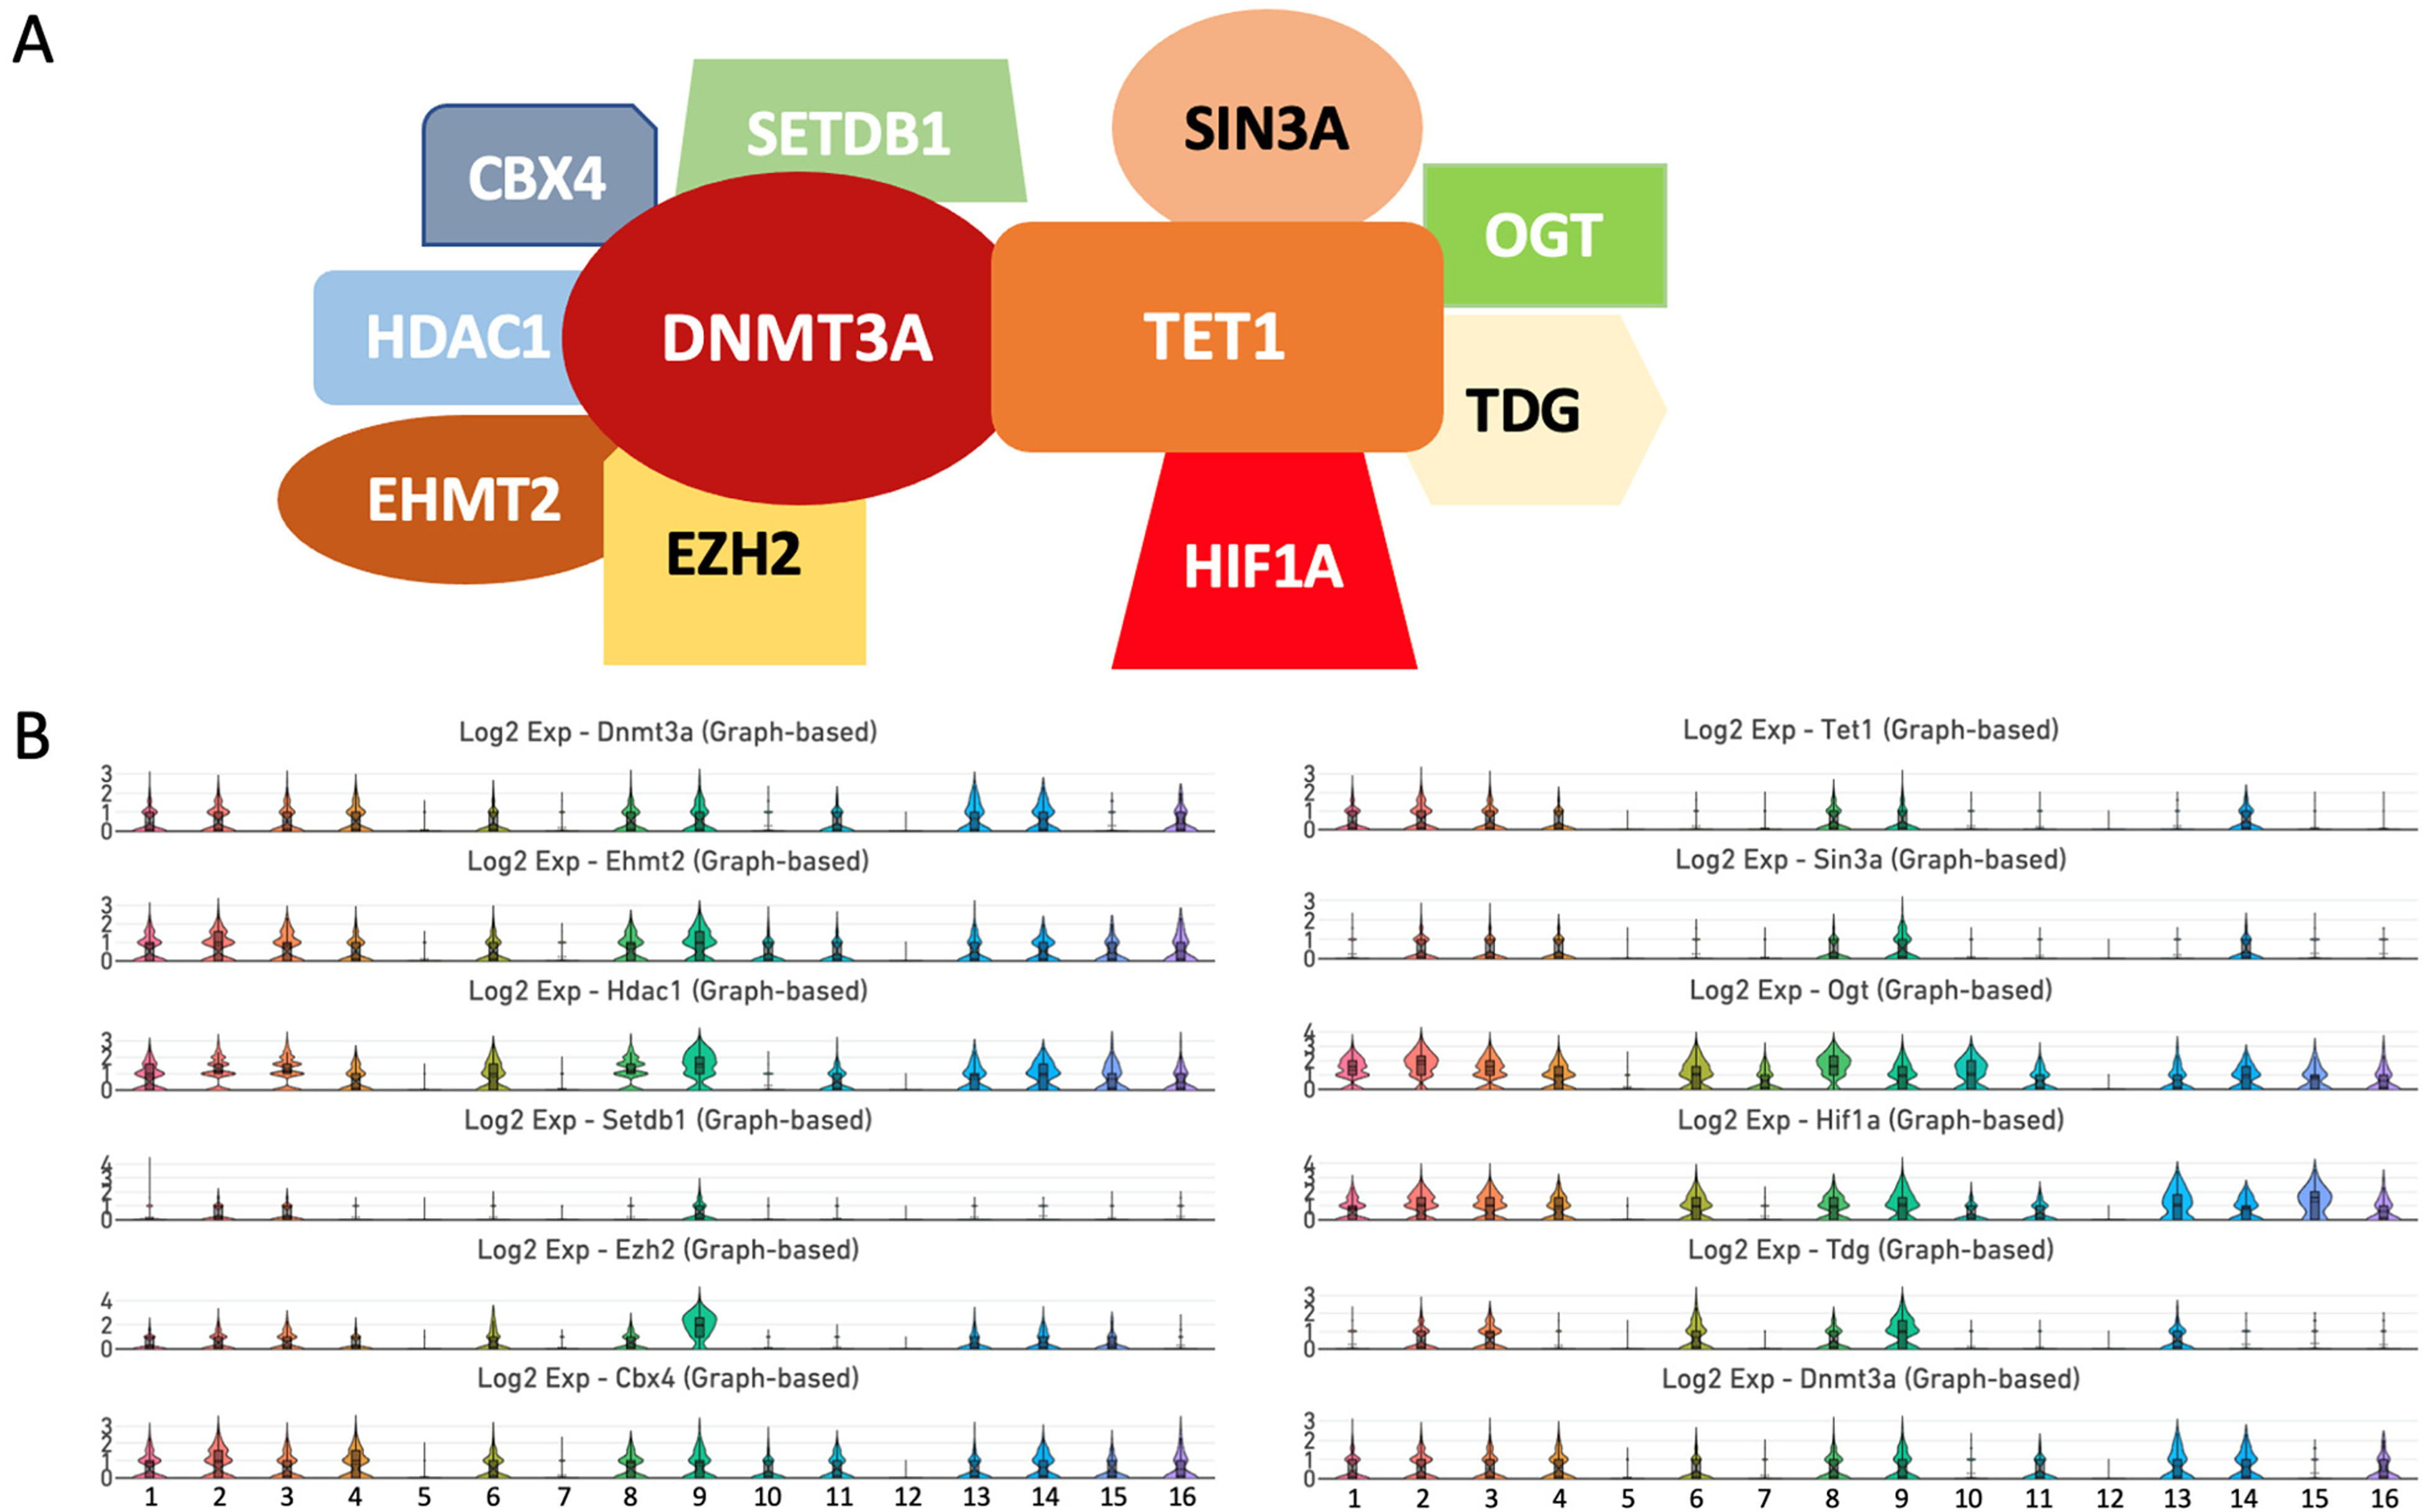
Protein partners of DNMT3A and TET1. (A) STRING interaction network analysis revealed that DNMT3A associates with SETDB1, CBX4, HDAC1, EZMT2, and EZH2. By contrast, TET1 binds to SIN3A, OGT, TDG, and HIF1A. DNMT3A and TET interact with each other as well. (B) Violin plots of the Ehmt2, Hdac1, Setdb1, Ezh2, Cbx4, Sin3a, Ogt, Hif1a, and Tdg genes.
Both Ehmt2 and Cbx4 are enriched in clusters 1, 2, 3, 4, 6, 8, 9, 10,11, 13, 14, 15, and 16 (Figure 6B and Supplemental Table 3). Hdac1 is mainly expressed in clusters 1, 2, 3, 4, 6, 8, 9, 11, 13, 14, 15, and 16, whereas Setdb1 displayed a more limited distribution with relatively weak expression in clusters 2, 3, and 9. Ezh2 is expressed in clusters 1, 2, 3, 4, 6, 8, 9, 13, 14, 15, and 16. Sin3a has limited expression and is mainly enriched in clusters 2, 3, 4, 8, 9, and 14 (Figure 6B). Ogt exhibits robust and wide expression in clusters 1, 2, 3, 4, 6, 7, 8, 9, 10, 11, 13, 14, 15, and 16. Hif1a is enriched in clusters 1, 2, 3, 4, 6, 8, 9, 10, 11, 13, 14, 15, and 16. The expression of Tdg is limited to clusters 2, 3, 6, 8, 9, and 13.
Discussion
Our research revealed that genes encoding DNMTs and TET enzymes exhibit distinct expression patterns within different subclasses of MSCs that represent osteogenic cells at different stages of differentiation in the mouse incisor dental pulp. For example, Dnmt1 is mainly expressed in mitotic MSCs, whereas Dnmt3a is broadly distributed in the majority of the MSC subpopulations. Contrary to DNMTs, all three members of the TET family display vigorous and wide expression in different subpopulations of MSCs.
We also observed that genes encoding proteins of the MBD family exhibit distinct expression patterns in MSCs. Whereas Mecp2, Mbd2, Mbd3, Mbd6, and Baz2a/b are broadly expressed in the most clusters of MSCs, expression of Mbd1, Mbd4, Mbd5, and Setdb1 is limited to a specific subset of MSCs. Interestingly, members of the SRA domain family also show distinct expression patterns in MSCs: Uhrf1 is mainly expressed in mitotic MSCs, whereas Uhrf2 is expressed in most subclasses of MSCs.
A large group of TFs participate in the establishment and maintenance of the mammalian methylome, including ZBTB4, ZBTB38, KLF4, EGR1, and CTCF. Our research showed that genes encoding these TFs exhibit a broad and consistent expression in MSCs. By contrast, Zbtb33, Zfp57, and Wt1 display either weak or a relatively restricted distribution in MSCs.
DNMT3A and TET1 interact with each other to define the DNA methylation pattern in the mammalian ESCs.54,55 Therefore, we also examined the expression profile of interaction partners of DNMT3A and TET1. DNMT3A binds directly to the H4K9 histone methyltransferase SETDB1, a critical component of the heterochromatin organization and transcriptional repression. 56 CBX4, a protein with repressive function, is involved in posttranslational modifications of DNMT3A. 57 A study by Han et al. showed that EHMT2, another H4K9 histone methyltransferase, forms a repressive complex with DNMT3A in pathologically stressed hearts. 58 Mechanistically, the ankyrin repeat domain of EHMT2 binds to both H3K9me2 and DNMT3A to facilitate de novo DNA methylation. 59 Among other DNMT3A partners, EZH2, the enzymatic component of the polycomb repressive complex 2, is sufficient to recruit DNMT3A to the H3K27me3-enriched chromatin. 60 Additionally, DNMT3A forms a complex with HDAC1 to suppress Oct4 expression in cervical cancer cells. 61
The interaction between TET1 and SIN3A plays significant role in somatic cell reprograming. 62 Moreover, the TET1–SIN3A interaction activates gene expression during mouse ESC pluripotency. 63 The nutrient-sensing enzyme OGT interacts with TET1 to alter gene expression in mouse ESCs. 64 Crosstalk between TET1 and thymine-DNA glycosylase (TDG) constitutes a basic mechanism for DNA demethylation and gene activation; the TET1-mediated formation of 5-carboxylcytosine from 5hmC is specifically recognized and excised by TDG. 65
Single-cell sequencing technologies provide a comprehensive high-resolution description of the various cell populations participating in fusion of the lip and primary palate. 66 Hence, the collected data can serve as a powerful resource for establishing the molecular insights into genomics of facial clefts. We believe that progress in detecting and characterizing risk factors of CL/P can also benefit those researchers and clinical investigators who study etiologies of other non-syndromic birth defects. Understanding the basic transcriptomic landscape of disease tissues is of paramount importance in designing the molecular targets for gene therapy, which will eventually lead to the optimal clinical outcomes.
In summary, our research revealed specific and distinct expression patterns of nuclear factors associated with the methylome in the mouse incisor dental pulp. DNA methylation is an essential contributor to gene repression and the heterochromatin organization, whereas DNA demethylation via the 5hmC modification pathway is linked to gene activation and chromatin de-repression. Using single-cell transcriptome analysis, we identified a selective group of genes encoding different nuclear factors that contribute to DNA methylation/demethylation. Many previous studies have employed bone marrow MSCs to achieve palatal bone regeneration, although resent research indicates that stem cells derived from dental tissues show promise for this application as well.30–33,67 Our research contributes to a better understanding of the molecular mechanisms underlying dental pulp-derived MSCs and their function in bone regeneration in cleft palate.
Supplemental Material
sj-docx-1-cpc-10.1177_10556656231172296 - Supplemental material for Single-cell Transcriptome Landscape of DNA Methylome Regulators Associated with Orofacial Clefts in the Mouse Dental Pulp
Supplemental material, sj-docx-1-cpc-10.1177_10556656231172296 for Single-cell Transcriptome Landscape of DNA Methylome Regulators Associated with Orofacial Clefts in the Mouse Dental Pulp by Badam Enkhmandakh, Pujan Joshi, Paul Robson, Anushree Vijaykumar, Mina Mina, Dong-Guk Shin and Dashzeveg Bayarsaihan in The Cleft Palate Craniofacial Journal
Supplemental Material
sj-docx-2-cpc-10.1177_10556656231172296 - Supplemental material for Single-cell Transcriptome Landscape of DNA Methylome Regulators Associated with Orofacial Clefts in the Mouse Dental Pulp
Supplemental material, sj-docx-2-cpc-10.1177_10556656231172296 for Single-cell Transcriptome Landscape of DNA Methylome Regulators Associated with Orofacial Clefts in the Mouse Dental Pulp by Badam Enkhmandakh, Pujan Joshi, Paul Robson, Anushree Vijaykumar, Mina Mina, Dong-Guk Shin and Dashzeveg Bayarsaihan in The Cleft Palate Craniofacial Journal
Footnotes
Declaration of Conflicting Interests
The author(s) declared no potential conflicts of interest with respect to the research, authorship, and/or publication of this article.
Funding
The author(s) received no financial support for the research, authorship, and/or publication of this article.
Supplemental Material
Supplemental material for this article is available online.
References
Supplementary Material
Please find the following supplemental material available below.
For Open Access articles published under a Creative Commons License, all supplemental material carries the same license as the article it is associated with.
For non-Open Access articles published, all supplemental material carries a non-exclusive license, and permission requests for re-use of supplemental material or any part of supplemental material shall be sent directly to the copyright owner as specified in the copyright notice associated with the article.