
Abstract
Objective
To test validity of 2D Standardized Way to Assess Grafts (SWAG) ratings to assess 3D outcomes of bone grafting (ABG).
Patients
43 patients (34 UCLP, 9 BCLP) with non-syndromic complete clefts, bone-grafted at mean age 9yrs/3mos, with available post-graft occlusal radiographs and cone beam computed tomography (CBCT) (taken mean 4yrs/9mos post-ABG).
Main Outcome Measures
2D occlusal radiographs rated twice using SWAG by 6 calibrated raters. 12 scores were averaged and converted to a percentage reflecting bone-fill. Weighted Kappas were assessed for SWAG reliability. 3D cleft-site bone volume was calculated by 1 rater using ITK-SNAP. 13 cleft sites were re-measured by the ‘one rater’ for 3D reliability using Intraclass Correlation Coefficient (ICC). 2D versus 3D ratings were compared using paired t-test, independent samples t-test, Bland-Altman and Linear Regression. Significance level was P = .5.
Results
2D reliability was 0.724 (intra-rater) and 0.546 (inter-rater). 3D reliability was 0.986. Bland-Altman plot comparing 2D vs 3D showed for 45 of 47 graft-sites were within 2 SD's. Mean % bone-fill was 64.11% with 2D and 69.06% with 3D (mean difference = 4.95%) that was a non-significant difference in both t-tests. Regression showed a statistically significant relation between the two methods (r2 = 0.46; P = .0001).
Conclusion
2D SWAG systematically and non-significantly underestimated bone-fill. There was a significant correlation between 2D/3D methods. Bland-Altman analysis illustrated the similarity of the two methods. For comparisons of group (cleft treatment Centers’) bone grafting outcomes, the 2D method may suffice as a proxy for the 3D method. However, with individual variation up to 40% in 2D estimates of actual 3D volume, 2D SWAG method cannot be used in place of 3D images.
Introduction
Alveolar clefts, with or without palatal involvement, remain one of the most common birth defects. An international collaborative spanning 30 countries including data on more than 7.5 million births reported a prevalence of cleft lip with or without cleft palate of 9.92 per 10 000. 1 The treatment of these congenital defects includes the attention of several medical, dental and auxiliary specialists, with care starting at birth and continuing through early adulthood. 2 One established procedure for these patients is secondary alveolar bone grafting (SABG) of the maxilla during the mixed dentition.3,4 The benefits of this intervention include added bony support for cleft-adjacent roots, support of the alar base, substrate for unerupted canines, foundation for gingival contour and the stabilization of maxillary segments. 3
There is no consensus regarding the specific methodology for bone grafting used by teams. In a 2005 survey, 5 only 14% of the teams surveyed reported that they radiographically evaluated repaired clefts post-graft. Also, only 7% used any systematic method to assess graft success. 5 A more recent survey concluded that factors related to timing of SABG and the management of orthodontic intervention prior to SABG also vary significantly amongst ACPA-approved (American Cleft Palate-Craniofacial Association) cleft teams. 6 Less than ideal graft volumes may result in repeated surgical procedures. 7 In an effort to objectively gauge treatment results and to establish a prognosis for future orthodontic and restorative treatments, it is imperative that providers standardize their protocols to include follow-up imaging and assessment.
Numerous approaches to gauge SABG success have been published. Two-dimensional (2D) methods include the Bergland, 8 Chelsea, 9 Enemark, 10 and Kindelan techniques. 11 Despite multiple validated methods to calculate presurgical cleft site volumes,12–14 there are few 3-dimensional (3D) methods that have been established to evaluate SABG results. One novel 3D technique has been described by Kamperos et al. 15
Despite efforts to design concise descriptive meters, all of the aforementioned methods present shortcomings. All of these have been tested for reliability and the results have been less than optimal. Nightingale et al. 16 tested the Bergland, Chelsea and Kindelan scales for reproducibility and none were found to be superior to the others. Kamperos’ method, while accurate in all dimensions and with clear definitions for successful SABG, is cumbersome, not easily performed and it does not factor bone coverage of cleft-adjacent teeth without a bony bridge. 15
To address the limitations with other methods, the Standardized Way to Assess Grafts (SWAG) scale was developed by the Americleft team. 17 The SWAG rating scale has been shown to have the highest reliability and user-friendly process to grade grafted cleft sites when compared to the aforementioned 2D methods (Figures 1 to 3). 7 Since its publication, the SWAG has been utilized for studies evaluating SABG protocols and outcomes between cleft treatment centers, and it has been used to test the timing of SABG to evaluate changes in grafted bone height over time and with changes in protocol.7,18,19 The SWAG scoring system is simple and nonparametric; it allows for a ranking of values to be assigned to interradicular thirds of repaired cleft space and accesses conditions for a successful regraft (if needed). However, despite its well-demonstrated reliability, the SWAG method has not been quantitatively investigated for its validity.
The advent of cone beam computed tomography (CBCT) imagery has improved cleft team members’ diagnosis and treatment planning of grafted cleft sites. With the visualization of three dimensions, major shortfalls of 2D imagery specific to clefts are alleviated. These include accurate volume analysis, depiction of buccolingual alveolar morphology and architecture, localization of unerupted teeth in relation to other teeth/structures, the option to produce anatomic models and the ability to perform segmentation. 20 Thus, methods to appraise SABG success remain inconsistent. Individual providers and cleft teams continue to use different approaches to determine the amount of post-graft bone-fill and its implications for future treatment.
The primary objective of this investigation was to determine the reliability of the SWAG method in rating 2D images of bone-grafted cleft sites and to assess the validity of the SWAG method by comparison to actual 3D volumes of secondarily grafted cleft sites. Moreover, if SWAG is shown to be valid, that method may be a reasonable proxy to assess true SABG success. This study thus further aimed to quantify the relationship between SWAG scores and alveolar bone-fill post-SABG using 3D CBCT imaging. The null hypotheses is that there is no difference between SWAG ratings of grafted clefts and 3D calculations of bone-fill.
Materials and Methods
This was a partially-blinded retrospective study of previously acquired diagnostic records of 43 consecutively grafted patients (34 UCLP, 9 BCLP, age range 7y 9m-19y 3m, 16 females and 27 males), with 47 cleft-sites. The study was approved by the Institutional Review Board of Rutgers University (ID: Pro2019001925) and the ongoing Americleft research series at the Lancaster Cleft Palate Clinic (LCPC Protocol Number 2008-183).
Inclusion criteria were patients with non-syndromic complete unilateral or bilateral cleft lip and palate in the mixed or permanent dentition, who had undergone SABG and whose records included both a useable 2D radiograph and 3D CBCT scan taken within 12 months of each other. Exclusion criteria were patients with cleft as part of a craniofacial syndrome, cleft palate-only, incomplete alveolar clefts or those without complete useable records.
All patient radiographs were acquired as part of the normal, prescribed diagnostic and planning stages for comprehensive orthodontic treatment. Periapical or occlusal radiographs (2D) were taken to evaluate SABG outcomes. Full skull CBCT scans were also taken for orthodontic treatment planning purposes. All scans were taken using the same machine and the same settings (iCAT FLX, Imaging Sciences International, Hatfield, PA), with a slice thickness (voxel size) of 0.400 mm3, voltage of 120 kVp, tube current of 5 mA, and an exposure time of 7 s. The mean age of the sample at the time of SABG was 111.1 months (9.3 years) and the mean age when post-graft radiographs were captured was 168.2 months (14.0 years), mean 4 years 9 months post SABG.
2D occlusal radiographs using standard radiographic techniques, were saved as JPEG images. Foreshortening/elongation of images was minimized by technique used by experienced radiological technicians but not critical, inasmuch as the SWAG score is unaffected by angulation. SWAG scores were determined by 6 Americleft Team members, including 4 orthodontists, one oral and maxillofacial surgeon, and one orthodontic postgraduate resident. All Team members were calibrated to the SWAG rating method 7 by the rater with the most experience and familiarity with its protocol. As part of this training session, all raters were shown examples of 2D images of grafted clefts and were able to discuss the ratings they would give in an attempt to reach consensus.
Altogether, 76 separate 2D radiographs were rated twice, for a total of 152 ratings per rater. The total number of radiographs evaluated exceeded the actual sample size for the study and included a random selection of occlusal and periapical radiographs from patients with clefts. The purpose of this was to better evaluate the inter- and intra-rater reliabilities, from the remote training for SWAG ratings that was used for this study. A total of 76 radiographs were evaluated, but only 43 (the study sample) were included in the analysis.
3D Analysis
3D images were analyzed by one investigator (JBP) using ITK-SNAP.21,22 The investigator was blinded to patient identity and the results of the 2D SWAG analyses. Patient DICOM files were taken directly from the clinic's database and opened in ITK-SNAP software. Both manual and semi-automatic segmentation were used during 3D image analysis. To standardize measurements and to establish reproducibility protocols, the data collected from each 3D image included: apex limit, CEJ limit, and the lower and upper thresholds for image intensities. The sagittal limits were defined by the most anterior limit of the CEJ of the most anterior maxillary incisor and posteriorly as the most posterior apex of the most posterior maxillary incisor. The transverse limits are defined by the lateral most limits of the two roots in the coronal view. Auto-segmentation of the cleft volumes included establishing the upper and lower grayscale threshold limits from the selected area of interest. By setting the lower threshold at its lowest limit (typically −1000 on the Image Input Intensity or grayscale) and the upper threshold at +200, a reasonable separation between non-alveolus and alveolus could be made whereby the cortical plates of the alveolus were continuous. Auto-segmentation step size was set to 10 and the program performed between 1000-1500 iterations of segmentation, resulting in assignments of voxels in the ROI for subsequent labeling. Manual segmentation followed this process to more accurately differentiate alveolar bone from non-bone. Each axial slice, between 15-45 slices per cleft site, was manually examined for proper labeling of bone/no bone. Following initial 3D segmentation, the investigator remeasured 15 of the total sample (27.6%) 48 h after the initial measurement for intra-examiner reliability calculation (Figure 4).
Statistical Analysis
All statistical analysis was completed using MedCalc Software v19.7.2 for Windows (Acacialaan 22, 8400 Ostend, Belgium). A paired samples post-hoc power analysis with an alpha of 0.05 and beta of 0.20 produced a full power sample size of 59. Actual sample size was 47 radiographs. (G*Power version 3.1.9.4). 23 For each cleft site, SWAG scores were converted to percentage by dividing the average score by 6 (the maximum possible). The mean, standard deviation, and range were calculated for 2D and 3D bone volumes. The difference between each of these was computed. Quadratic Weighted Kappa statistics were used to calculate the intra and inter-rater reliabilities. 24 Reliability of the 3D method was determined with a recalculation of the bone fill in the cleft site for 13 randomly selected cases, 48 h after the initial analysis. The scores of percentage bone fill in the cleft site in those 13 cases were compared to the initial calculations using the intra-class correlation statistic (ICC).
3D volumes of non-alveolus (or, non-bone on 3D) and alveolus (bone on 3D) were summed for Total Cleft Area and also converted to a percentage.
The Bland-Altman analysis was selected to evaluate the agreement between the different instruments (2D SWAG score and 3D volume determination of percent bone volume) for measuring cleft bone fill in the same subject. Acceptable limits of agreement were set at ±1.96 SD's of the mean differences between the 2 methods.
Independent samples t-test and paired samples t-test were used to determine significance of the difference between the two methods. Both t-tests were used to determine the degree to which the 2D images could be used both for group comparison in comparative effectiveness research (independent samples t-test) as well as for treatment planning of individual cases (paired samples t-test). Linear regression was used to compare the percent of bone fill in the cleft site as calculated using the 2D SWAG scores vs actual 3D volume measurements. All significance levels were set to P = .05 prior testing. Confidence levels for all analyses were set to 95%.
Results
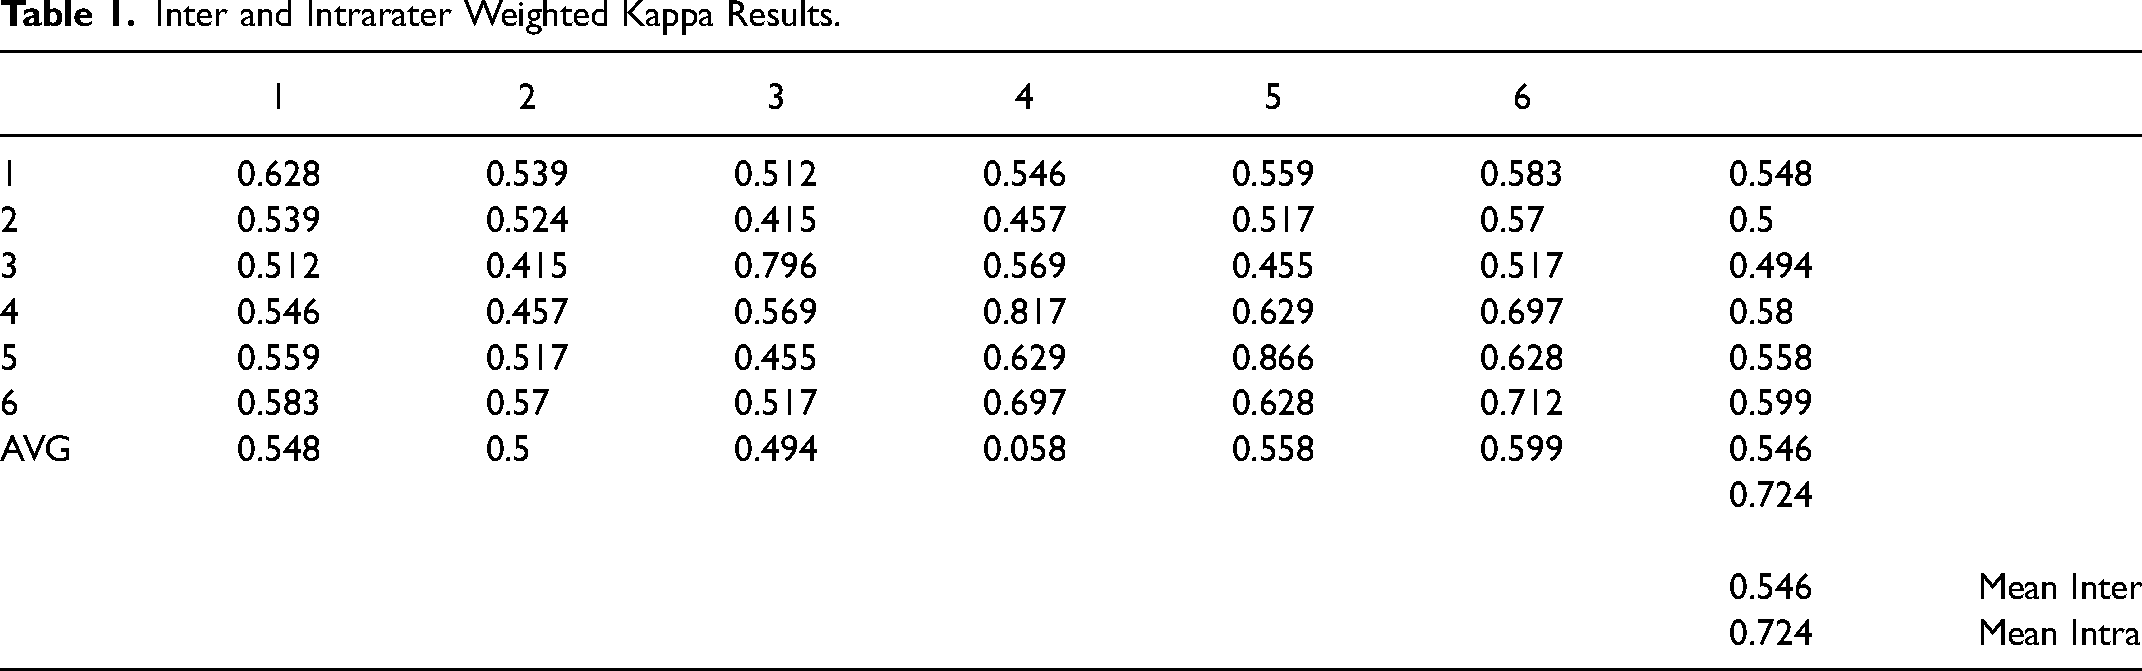
Reliability: For the 2D SWAG method, the mean intra-rater Weighted Kappa was 0.724 and the mean inter-rater Weighted Kappa was 0.546. For the 3D method, the ICC for intra-rater reliability was 0.9751 at a 95% confidence interval (0.930-0.992) (Table 1).
As a percentage value, the mean difference between 2D and 3D bone volume calculated for each patient was 4.95%, with SWAG scores underestimating bone volume. The standard deviation for SWAG was 24.90%, while for volumetric analysis was19.64%.
Bland-Altman analysis revealed good distribution of the data around the mean difference but with an indication of slight bias. The mean difference within a 95% confidence interval suggests that the 2D ratings underestimate the measured bone volumes. However, all but 3 of the total 47 mean differences were within 1.96 standard deviation. This indicates the two methods to assess bone-fill are in agreement, with a nonrandom, systematic relationship (Graph 1).
Intraclass Correlation Coefficient (ICC) was used to describe how the second round of 3D ratings compared to the initial round of 3D ratings for the randomly selected 13 cases. The ICC was 0.9751 with a 95% confidence interval of 0.9296-0.9915.
The independent t-test results were not significant. Comparing the means of the 2D and 3D assessments, the mean difference was 0.0696- and the 95% confidence interval was −0.0261-0.01645. The result was not statistically significant (P = .2884).
The paired t-test also did not show a significant difference between the means (P = .074) at a 95% confidence interval (0.01708 to 0.1222).
Linear regression analysis between mean 2D SWAG scores (independent variable) and 3D bone-fill percentages (dependent variable) resulted in a coefficient of determination (R2) of 0.0456 and r = 0.675 (Graph 2).
Validity Conclusion
2D SWAG scores were used to represent grafted alveolar cleft 3D volumes. The combination of independent t-test, paired t-test, and regression analysis provide an indication of how well 2D SWAG ratings act as proxies for 3D bone volumes on an individual basis and in groups. The non-statistical significance of the independent samples t-test, the correlation and significance of the regression analysis, and the comparability demonstrated by the Bland-Altman plot, all support the acceptance of the null hypothesis and suggest the acceptability of SWAG ratings of 2D images to serve as a proxy for volumetric calculations of bone-fill in grafted patients Certainly, these SWAG ratings for comparative effectiveness studies and comparisons between groups, is supported by these data. However, the nearly-significant paired t-test and especially the individual variability of attempting volumetric estimates based on 2D images, suggest that for individual treatment planning, 2D images can be misleading.
Discussion
The aim of this study was to investigate the validity of the SWAG method to assess bone grafts in 2D compared to measured 3D volumes, in order to establish if the former is a proxy for the latter. The t-tests and regression analyses objectively confirm its validity. Cumulative SWAG scores can thus be used as a proxy for 3D imagery when analyzing graft success, or lack thereof, for groups of patients. However, individual cases necessitate practitioners’ best judgment for diagnostic measures to establish the appropriate treatment plan. Chou et al. concluded that if a treatment facility has 3D imagery capabilities, using that for guided planning and surgery is necessary for patient-specific information. 25 This study further confirms this conclusion. Furthermore, the current study highlights the appreciable degree to which 2D imagery actually represents 3D volumetric appraisals of grafted cleft sites.
Our results indicate a strong relationship between 2D SWAG ratings and measured 3D bone-fill between cleft-adjacent roots. When averaged SWAG scores which had been converted to a percentage of total bone-fill possible, were compared to actual 3D volumetric measures, the SWAG ratings underestimated true bone fill by only 4.94% which was statistically not significant. Paired t-tests for the groups, however, while showing no statistically significant differences between the variables, nonetheless demonstrates the difference between statistical and clinical signficance. Specifically, with the wide range of variability obvious from the large standard deviation for the 2D estimates, SWAG scores cannot be used individually to represent 3D volumes.
Independent, two-sample t-test did not demonstrate statistical significance. This test was an evaluation of group comparability, and the resulting lack of significant difference demonstrates that aggregate SWAG scores can be used as a valid proxy when used for group comparisons. Given these outcomes, it can be stated that grouped 2D SWAG scores do represent actual bone measurements spanning repaired cleft sites.
These results are similar to those found by Rosenstein et al. in 1997. They compared periapical and occlusal radiographs with CAT scans of repaired alveolar clefts. Their paired t-test results demonstrated a mean difference of 7.3% with 2D images, under-representing measured 3D bone volumes but that difference was not statistically significant and the variation between the groups was random and not systematic. When the two groups were compared using the independent t-test, only a 1.8% difference was found and the results were also not statistically significant. 26 Thus our results are comparable to those found by Rosenstein et al. 24 years ago using different methods of 2D and 3D assessment.
In the current study the SWAG reliability measures were slightly lower than previously reported, 0.724 (intra-rater) and 0.546 (inter-rater), while the reliability of the 3D measurements was a very high 0.9751. The method employed in this study, using ITK-SNAP, has not been previously tested for alveolar cleft space, and thus no comparisons of intra- or inter-rater reliability for 3D analysis were possible. Our coefficient of determination, or R2, indicates that 46% of the variance in 3D bone volume is predictable from the independent variable (SWAG score). This indicates that ∼53% (more than half) of the variance is not explained by the regression results. Only one of 47 measurements fell outside of the 95% confidence interval for our regression analysis. Statistically, this regression analysis presents strong significance. However, any individual SWAG score should not be purported as an accurate representation of bone-fill for an individual case. Again, our recommendation remains that the SWAG scoring method is valid for comparing groups of repaired clefts but not for deciding the prognosis of any single repaired cleft site. For individual subjects, it should be kept in mind that 2D analysis tends to underestimate the bone fill compared to the 3D volume method.
Limitations
The relatively lower intra- and inter-rater reliabilities of this investigation are possibly due to the training and calibration of the evaluators; typically, the Americleft group meets in person for a multi-hour training session that includes a practice round of ratings with no time limit for questions and clarifications of methodology. The ratings were done on-site within 2 days from the training session. Due to travel restrictions, a remote, video-conference method was used and may have been detrimental to the rating results. An additional complication was that 2 of the 6 raters had less experience than most of the group. Reliability could have been improved with additional, experienced raters and more ratings and improved calibration of images.
ITK-SNAP has not been previously tested for evaluation of bone fill in an alveolar cleft space and no comparisons are available for reliability. One of the weaknesses of the methods was the single 3D image analyzer. Reliability may have differed with additional investigators measuring the same sample. The most significant challenges to accurate alveolus and non-alveolus measurements were the limitations of resolution and pixilation inherent to CBCT images. At a magnification where all boundaries to each voxel are visible, smooth delineations remains impossible and establishing borders between cleft and non-cleft sections of an image is stepwise. As a result, there are no fine lines between anatomic features. Unless cleft space is isolated, without nearby soft tissue or scatter, those areas will have some gray value. Increasing the radiation dosage and decreasing the voxel size would improve these limitations, but such changes are not favorable for patient exposure and are unlikely to affect volume calculations nor change diagnostic quality of the images.
Another aspect of the 3D method that could have affected the measurement accuracy was the pre-segmentation stage of the semi-automatic segmentation method. During this step, thresholds were selected based upon the user's ability to discern alveolus and non-alveolus. This is somewhat subjective, attributable to CBCT scan variability, localized tissue density, radiation absorption, patient characteristics and artifacts that could impact the investigator's landmark discrimination.
Anatomic features that defined the limits of the volumes were also not always easily discerned and thus the predetermined volume boundaries were limiting factors. At times, cleft-adjacent apices were not fully closed, roots with considerable resorption were present and the alveolar crest was not continuous even with the finest adjustment of the contrast during pre-segmentation. Vallaeys et al. 27 found similar problems with edge-based segmentation, where semi-automatic methods failed at boundaries between different image intensities.
An a priori power analysis in this study was not possible given that this was a convenience/availability sample and therefore the moderate sample size is a limitation of the study. Given that this sample was of consecutively treated patients, from the same facility, using a similar surgical protocol and the same machines for image acquisition, it was impossible for additional subjects to have been included. As a result, some selection bias is inherent in the study design.
A further limitation was the partial blinding of investigators, which was possible only for the 2D analysis. To mitigate this problem the investigator performing the 3D analysis was blinded to the cumulative 2D data and results until after the 3D analysis was complete
Conclusions
The SWAG method is a valid proxy to appraise SABG success when using periapical or occlusal 2D imagery and to evaluate groups of repaired cleft sites. Some underestimation for total bone-fill between cleft-adjacent roots occurs.
The SWAG method is reliable, as a simple and quick means to quantify bone-fill and to estimate prognosis following SABG. Reliability is affected by raters’ experience with SWAG and limited, remote calibration negatively affects the reliability.
There are inherent limitations to measuring alveolar versus non-alveolar tissues, even on 3D images set to standard parameters. Manual segmentation remains the most accurate method to quantify bone volume, but significant limitations exist when measuring volumes on CBCT images.
Providers evaluating grafted cleft-sites should employ the least amount of radiation to establish their diagnostic information. Whenever possible, clinicians should minimize the field of view for assessing the cleft area with CBCT.
Based on the results of the study the null hypothesis is partially rejected; 2D SWAG scores are not a substitute for 3D volumes on an individual patient basis. However, based on the results of the independent samples t-test, the null hypothesis is confirmed for groups: SWAG scores are a valid proxy for accurately representing groups of grafted cleft sites and collective Team outcome assessments.
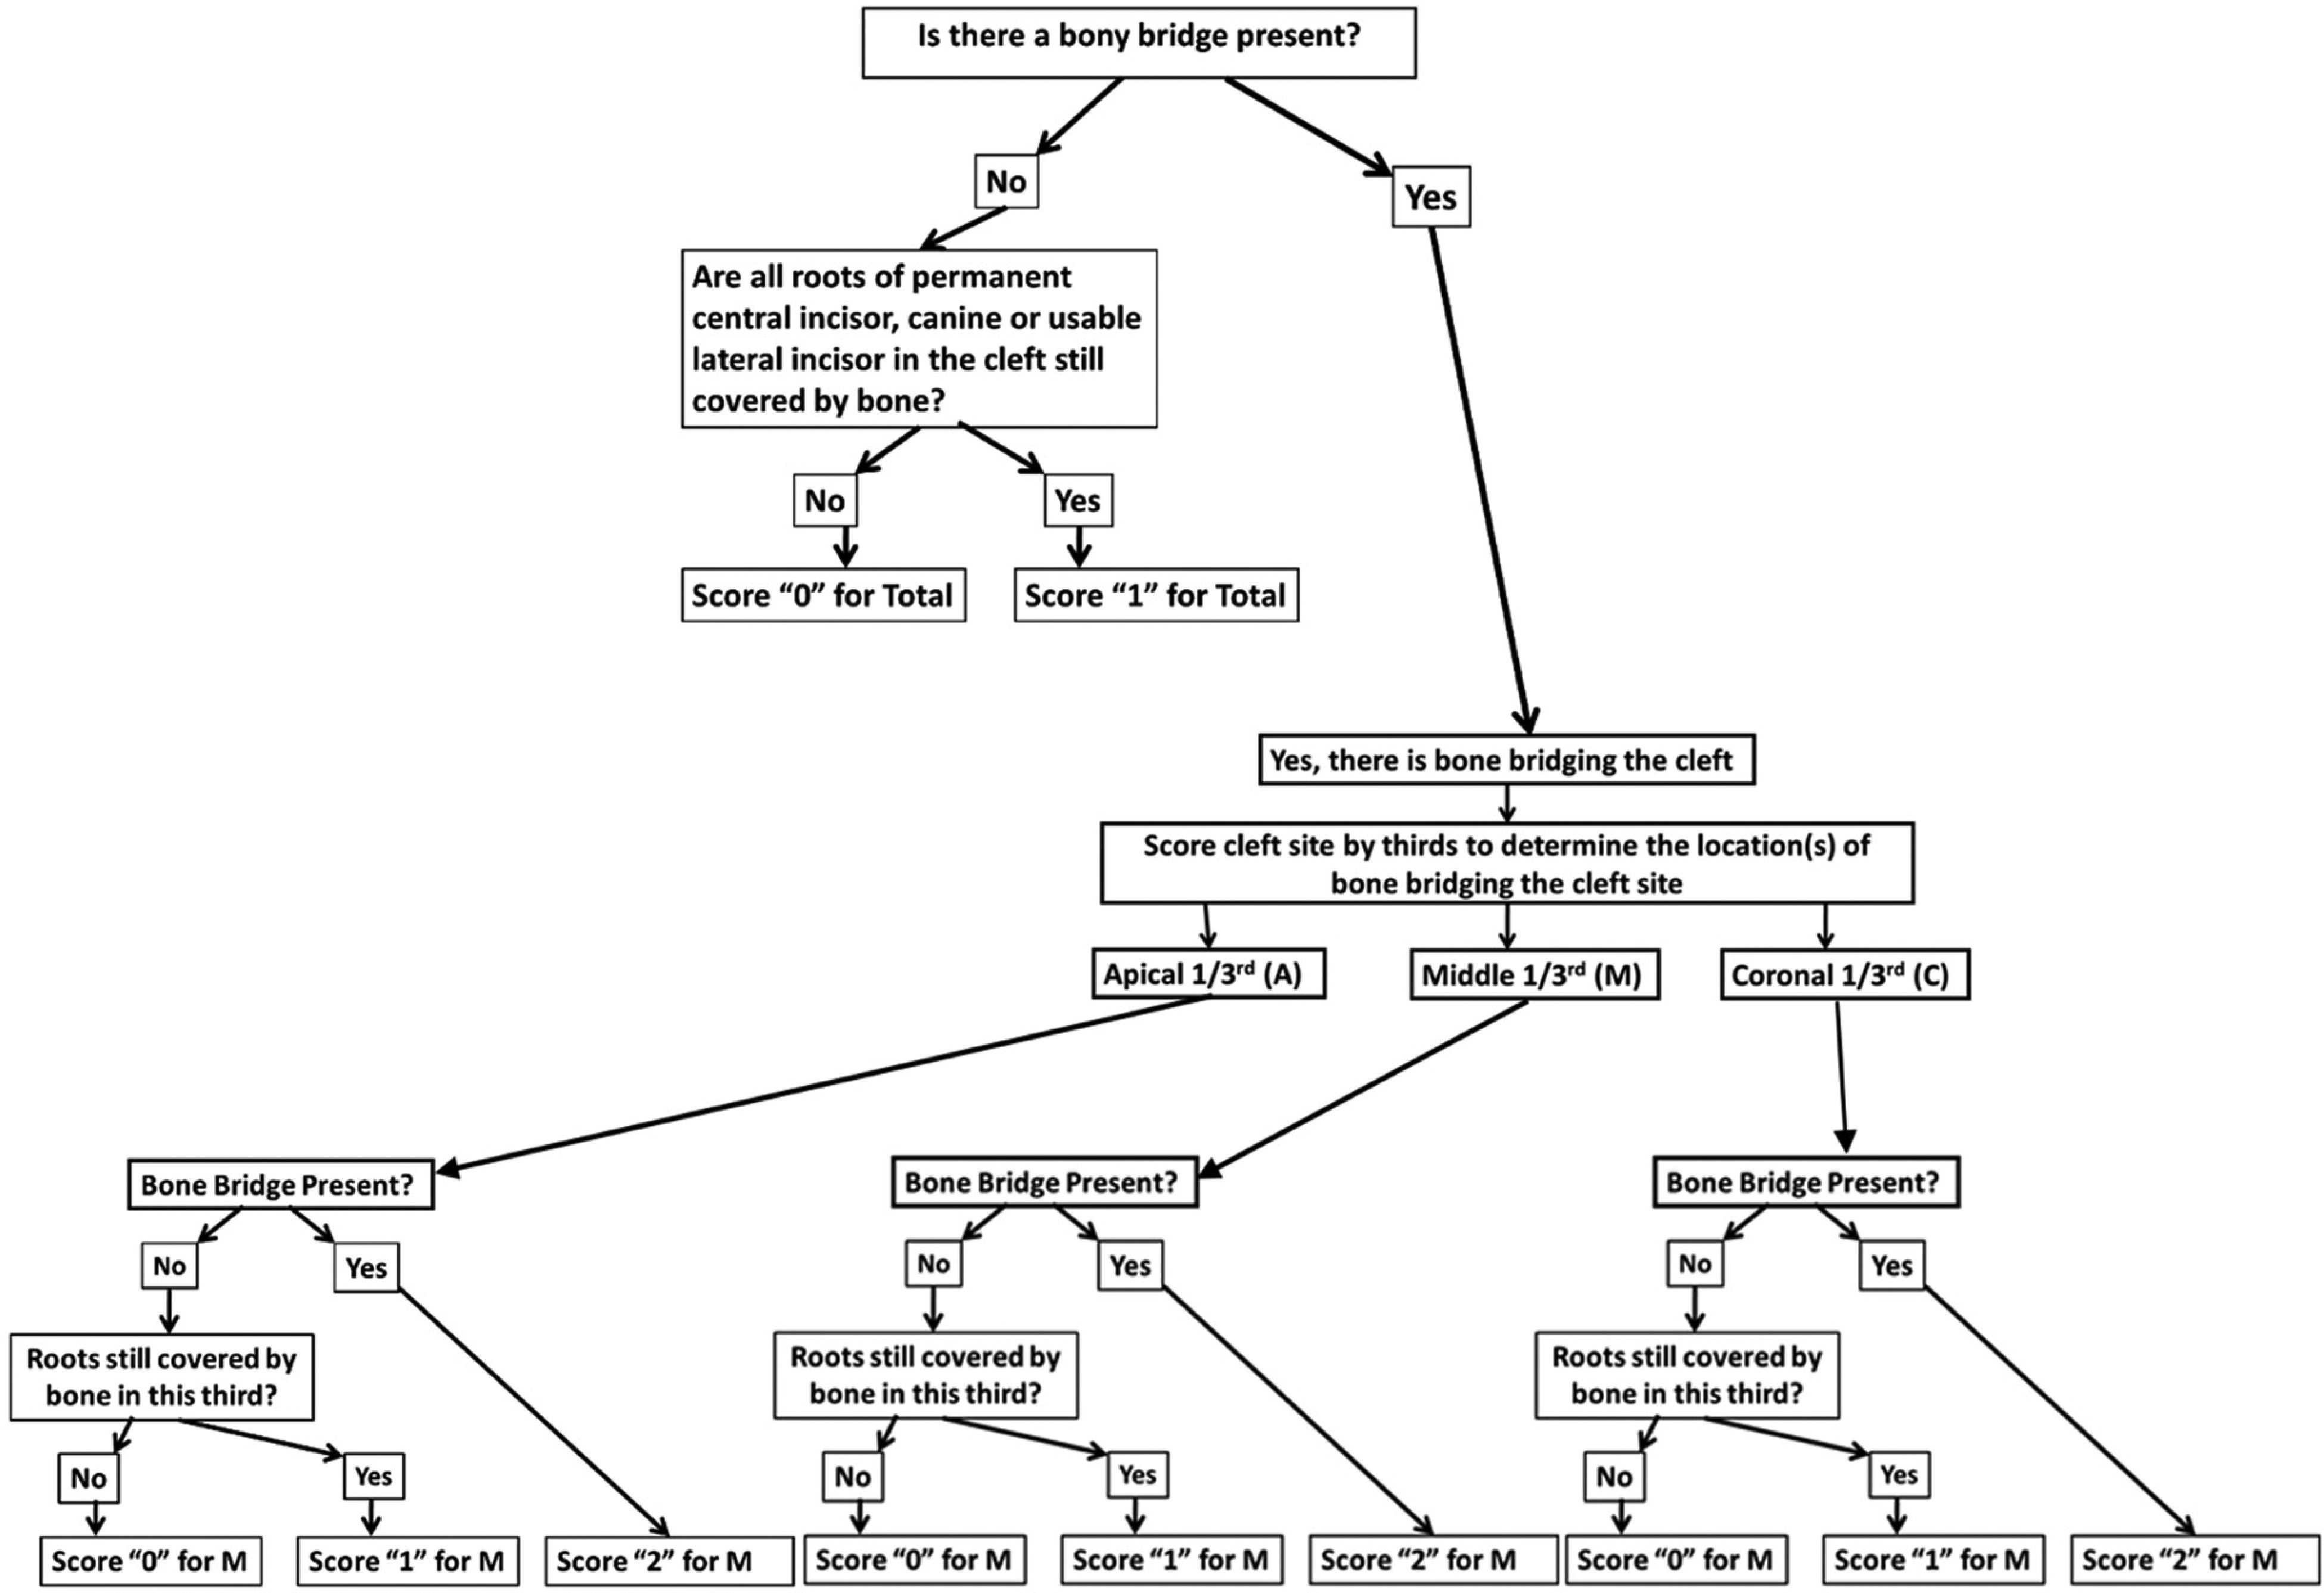
SWAG scoring algorithm.
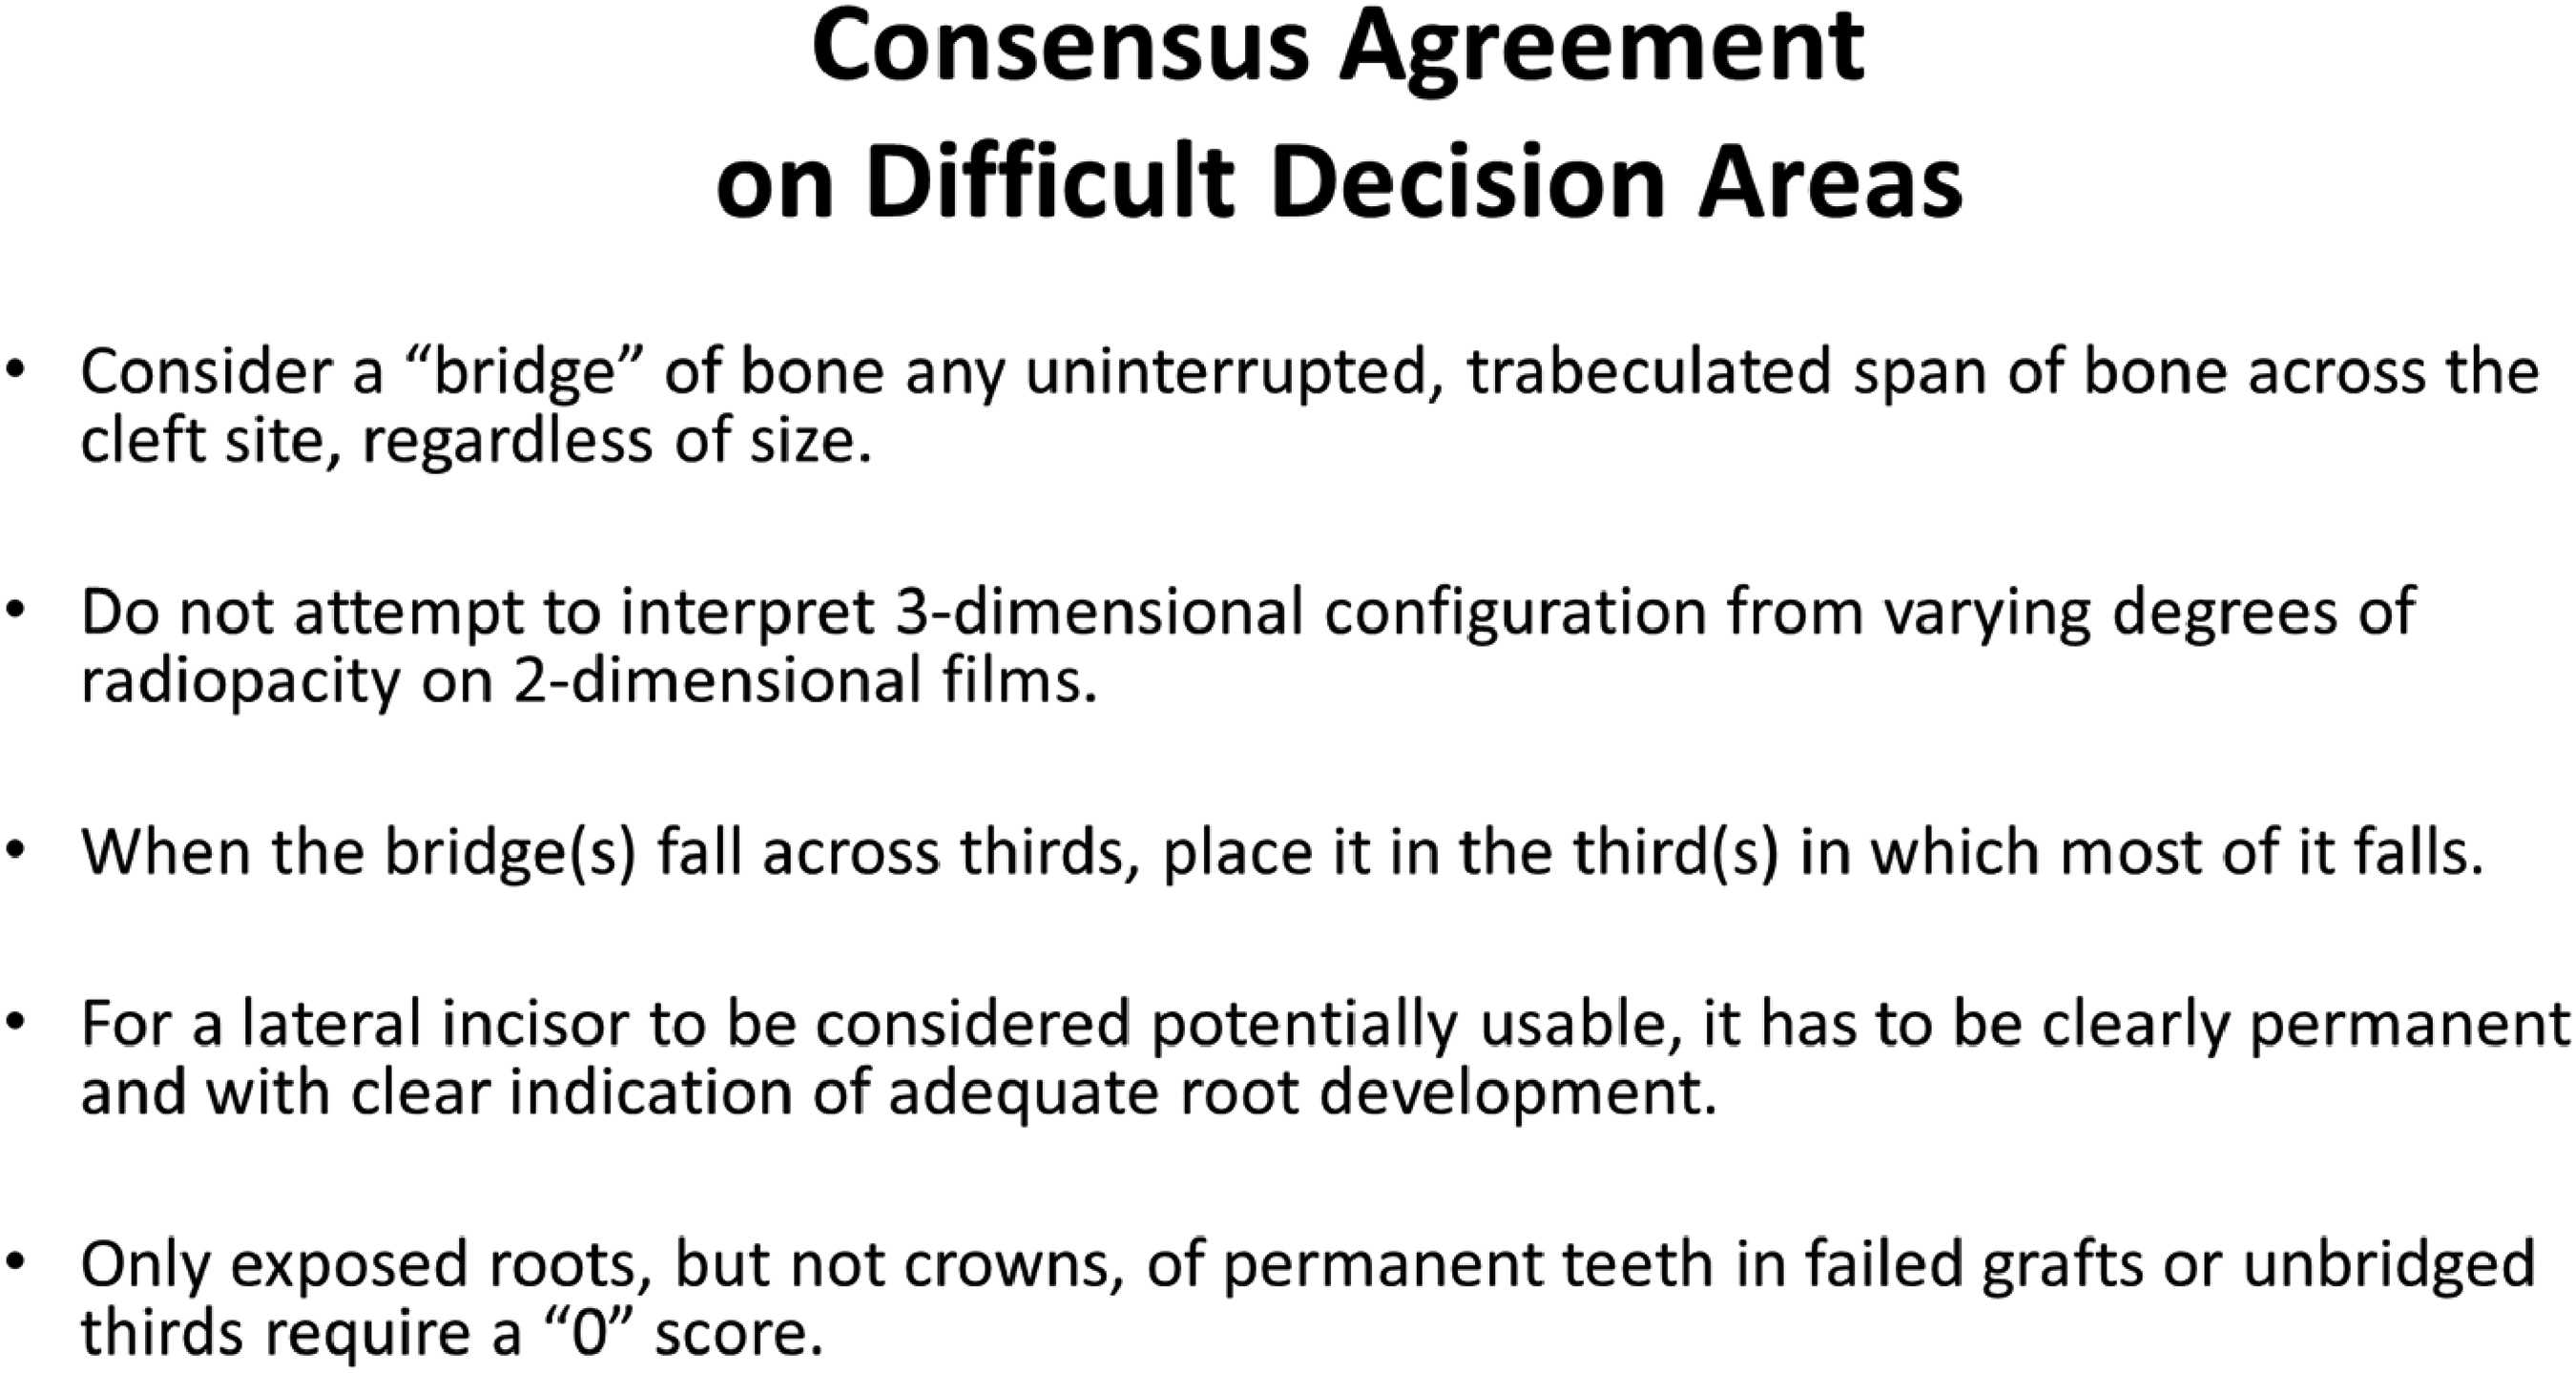
Consensus process for determining SWAG score in difficult cases.
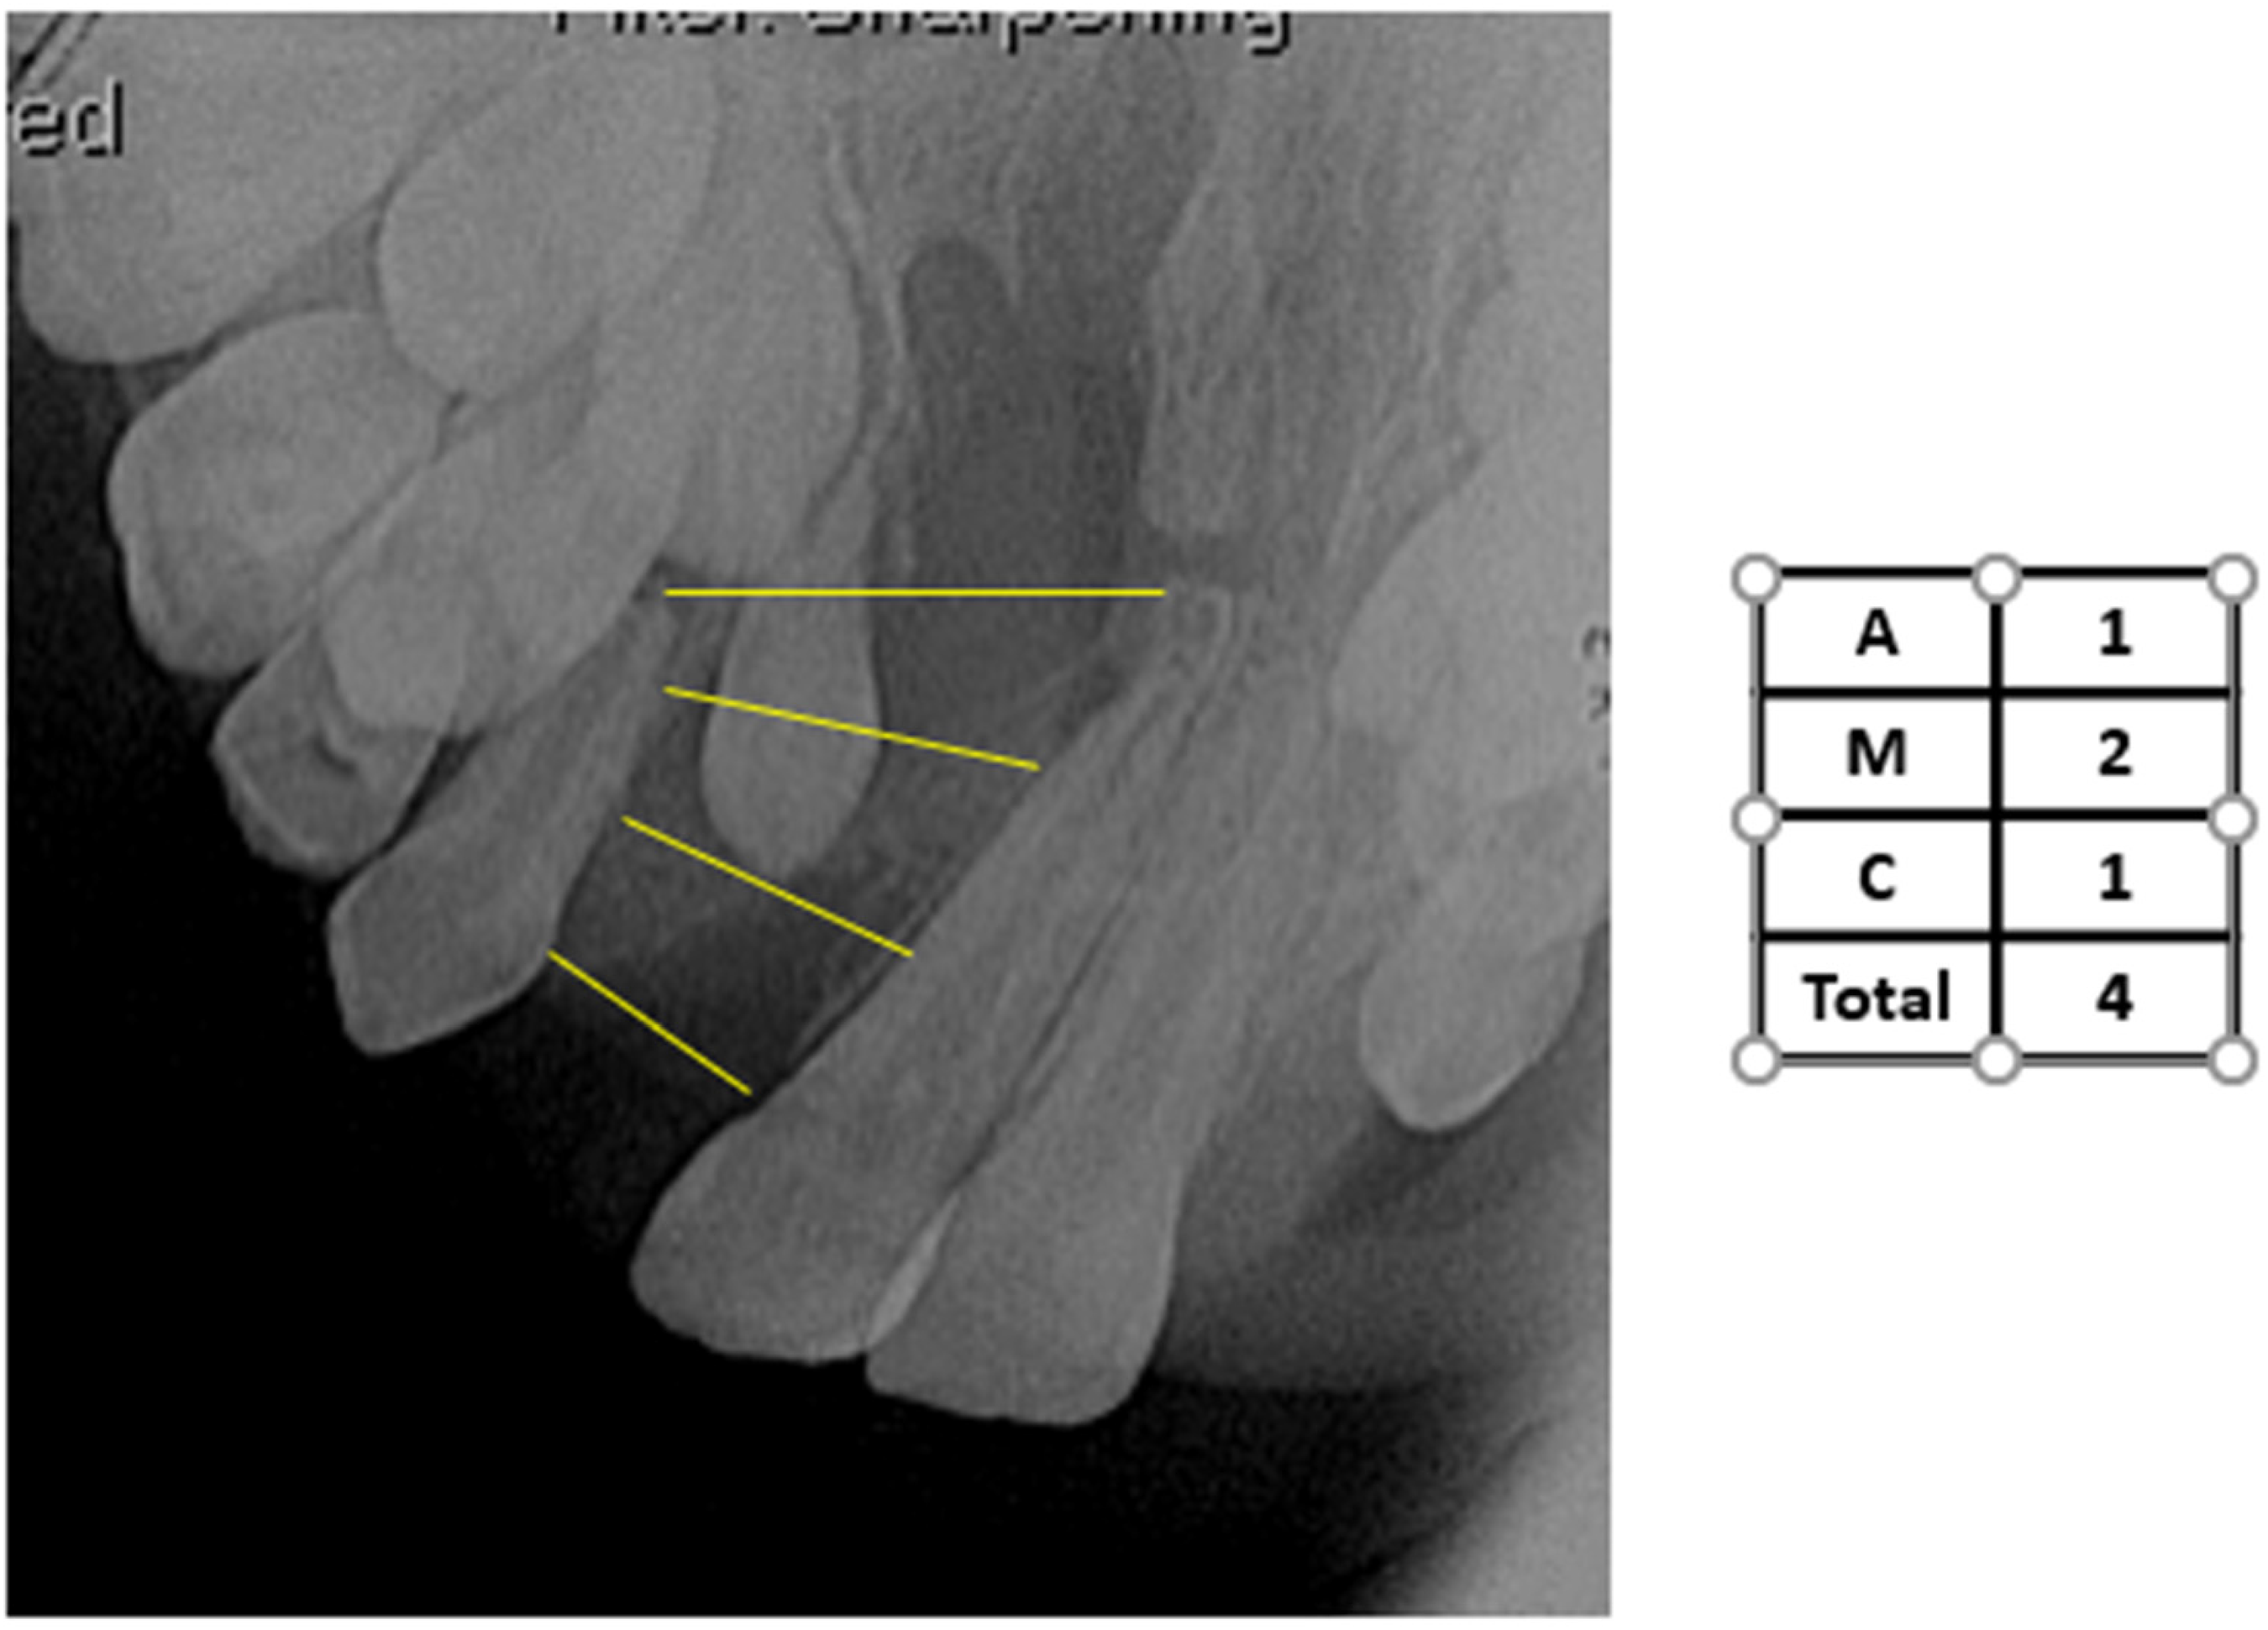
Example SWAG rating where “A”= apical third, “M” = middle third, and “C” = coronal third of a cleft site. Total is the sum of the scores of the three individual segments.
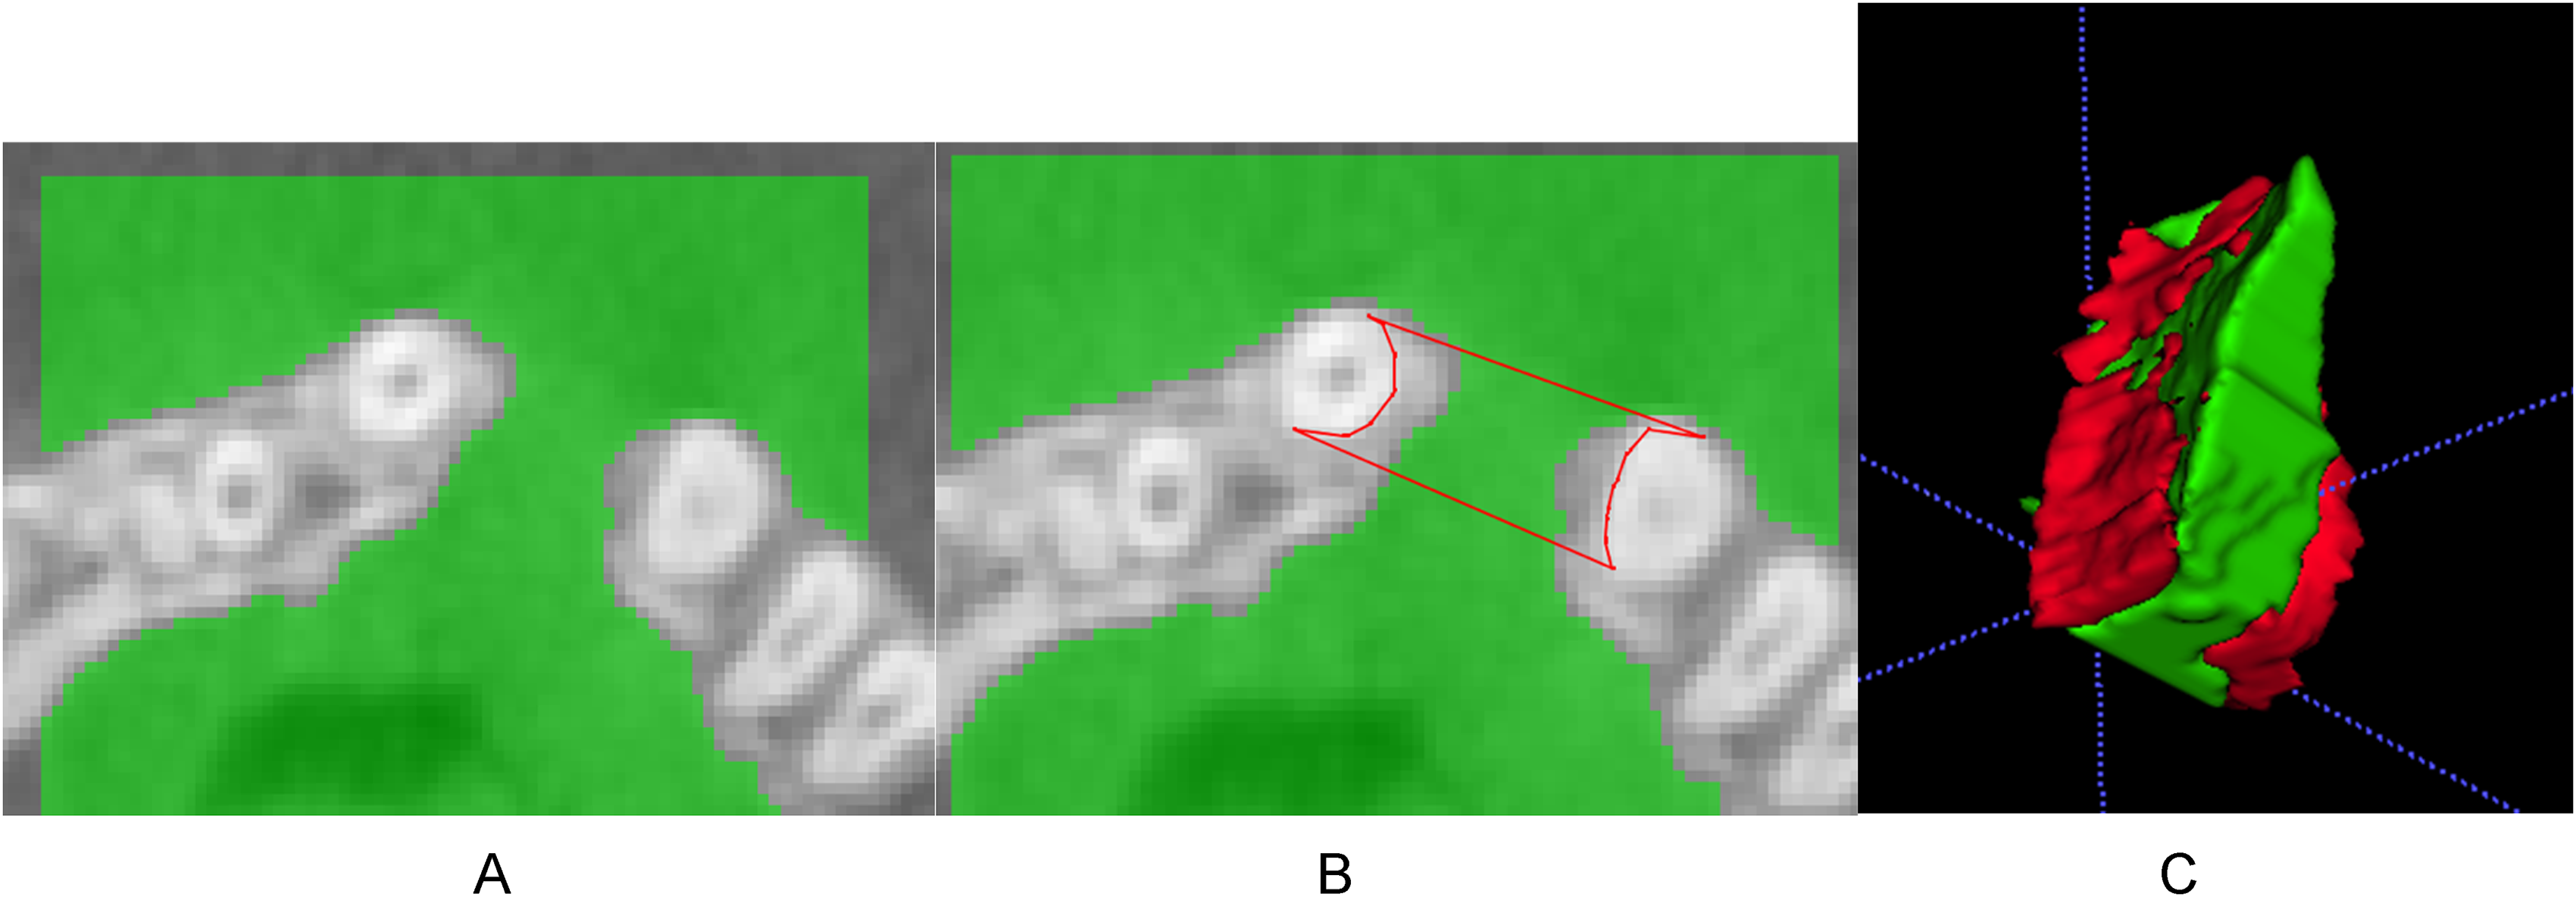
Images from ITK_SNAP. A, completed presegmentation: B, revision of autosegmentation with manual segmentation: C, Updated 3D volume of alveolus and non-alveolus areas.
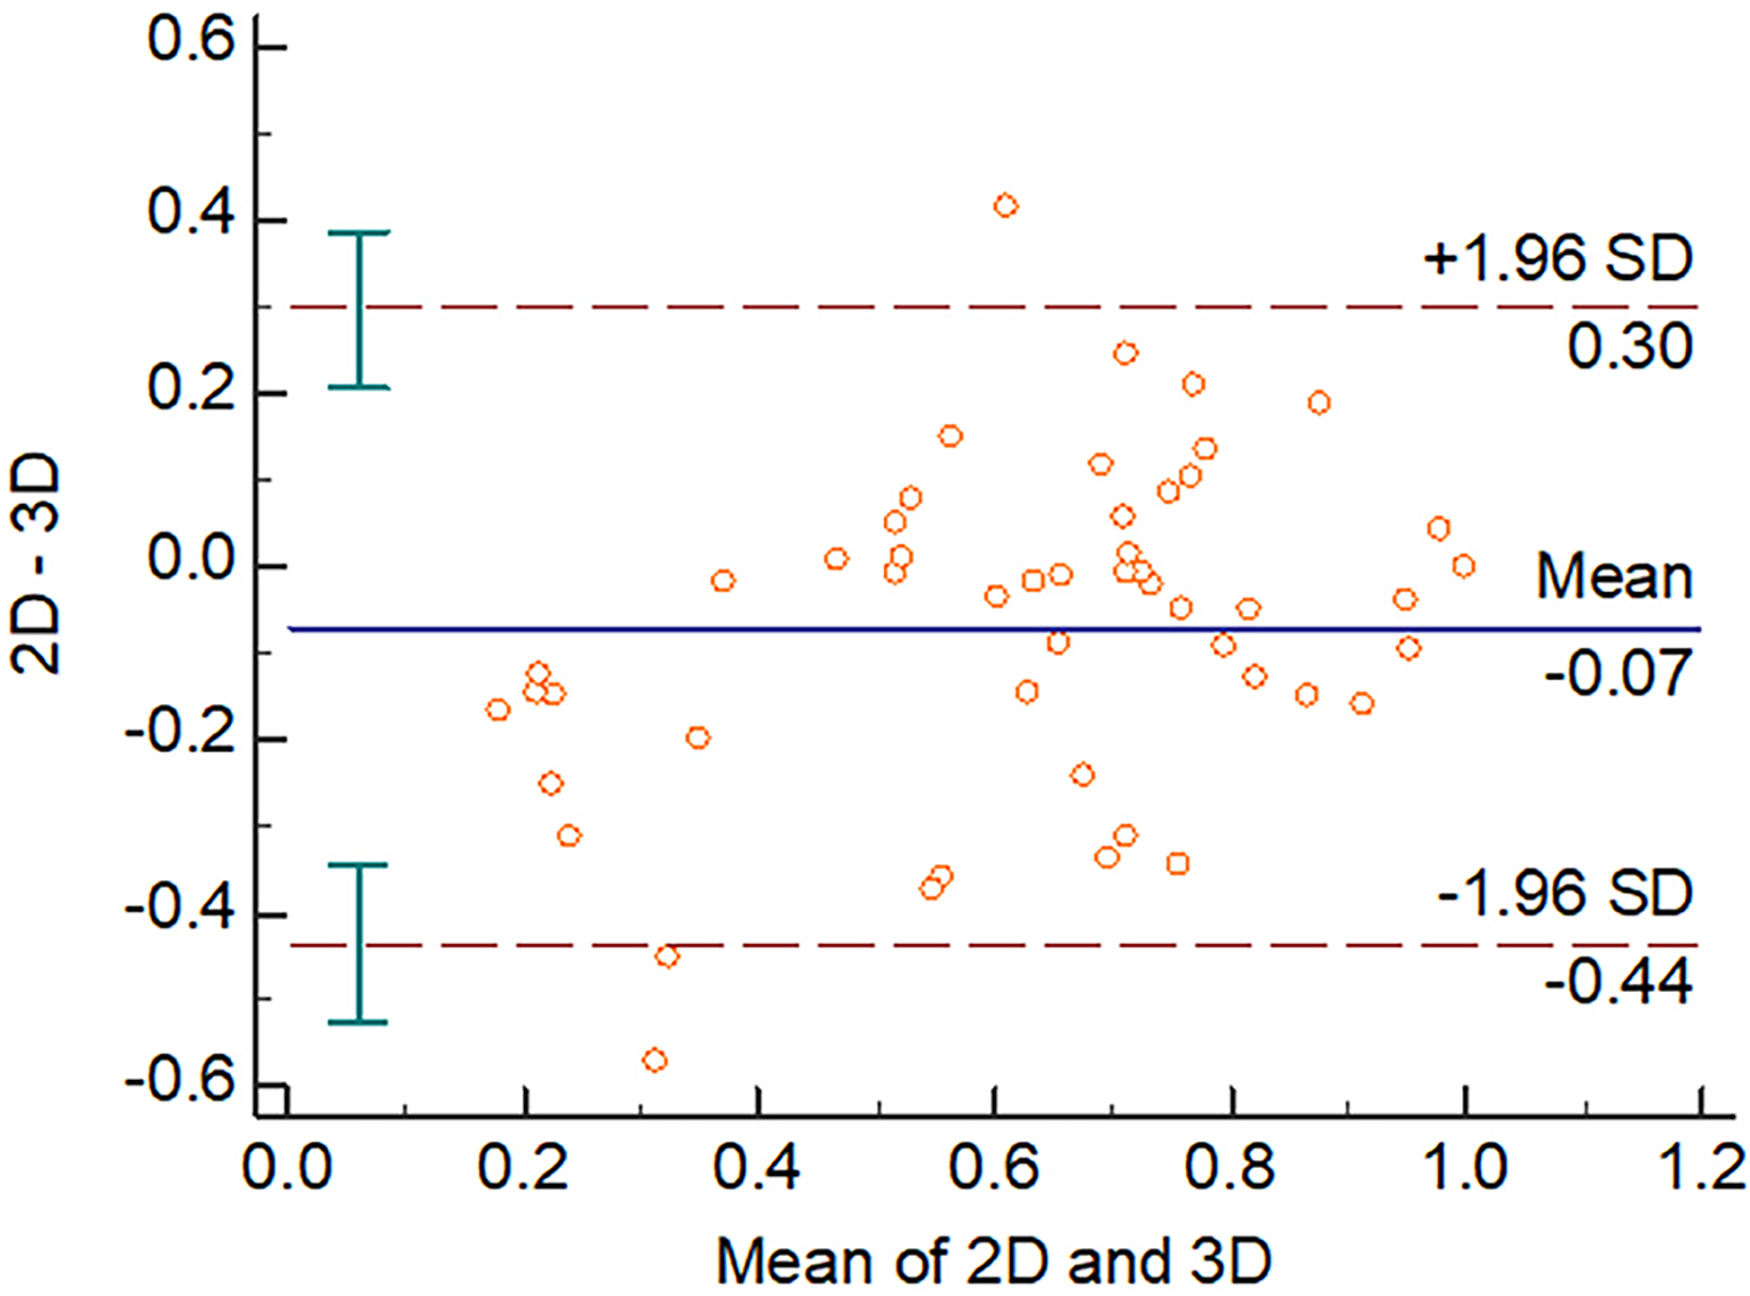
Bland-Altman plot of data distribution.
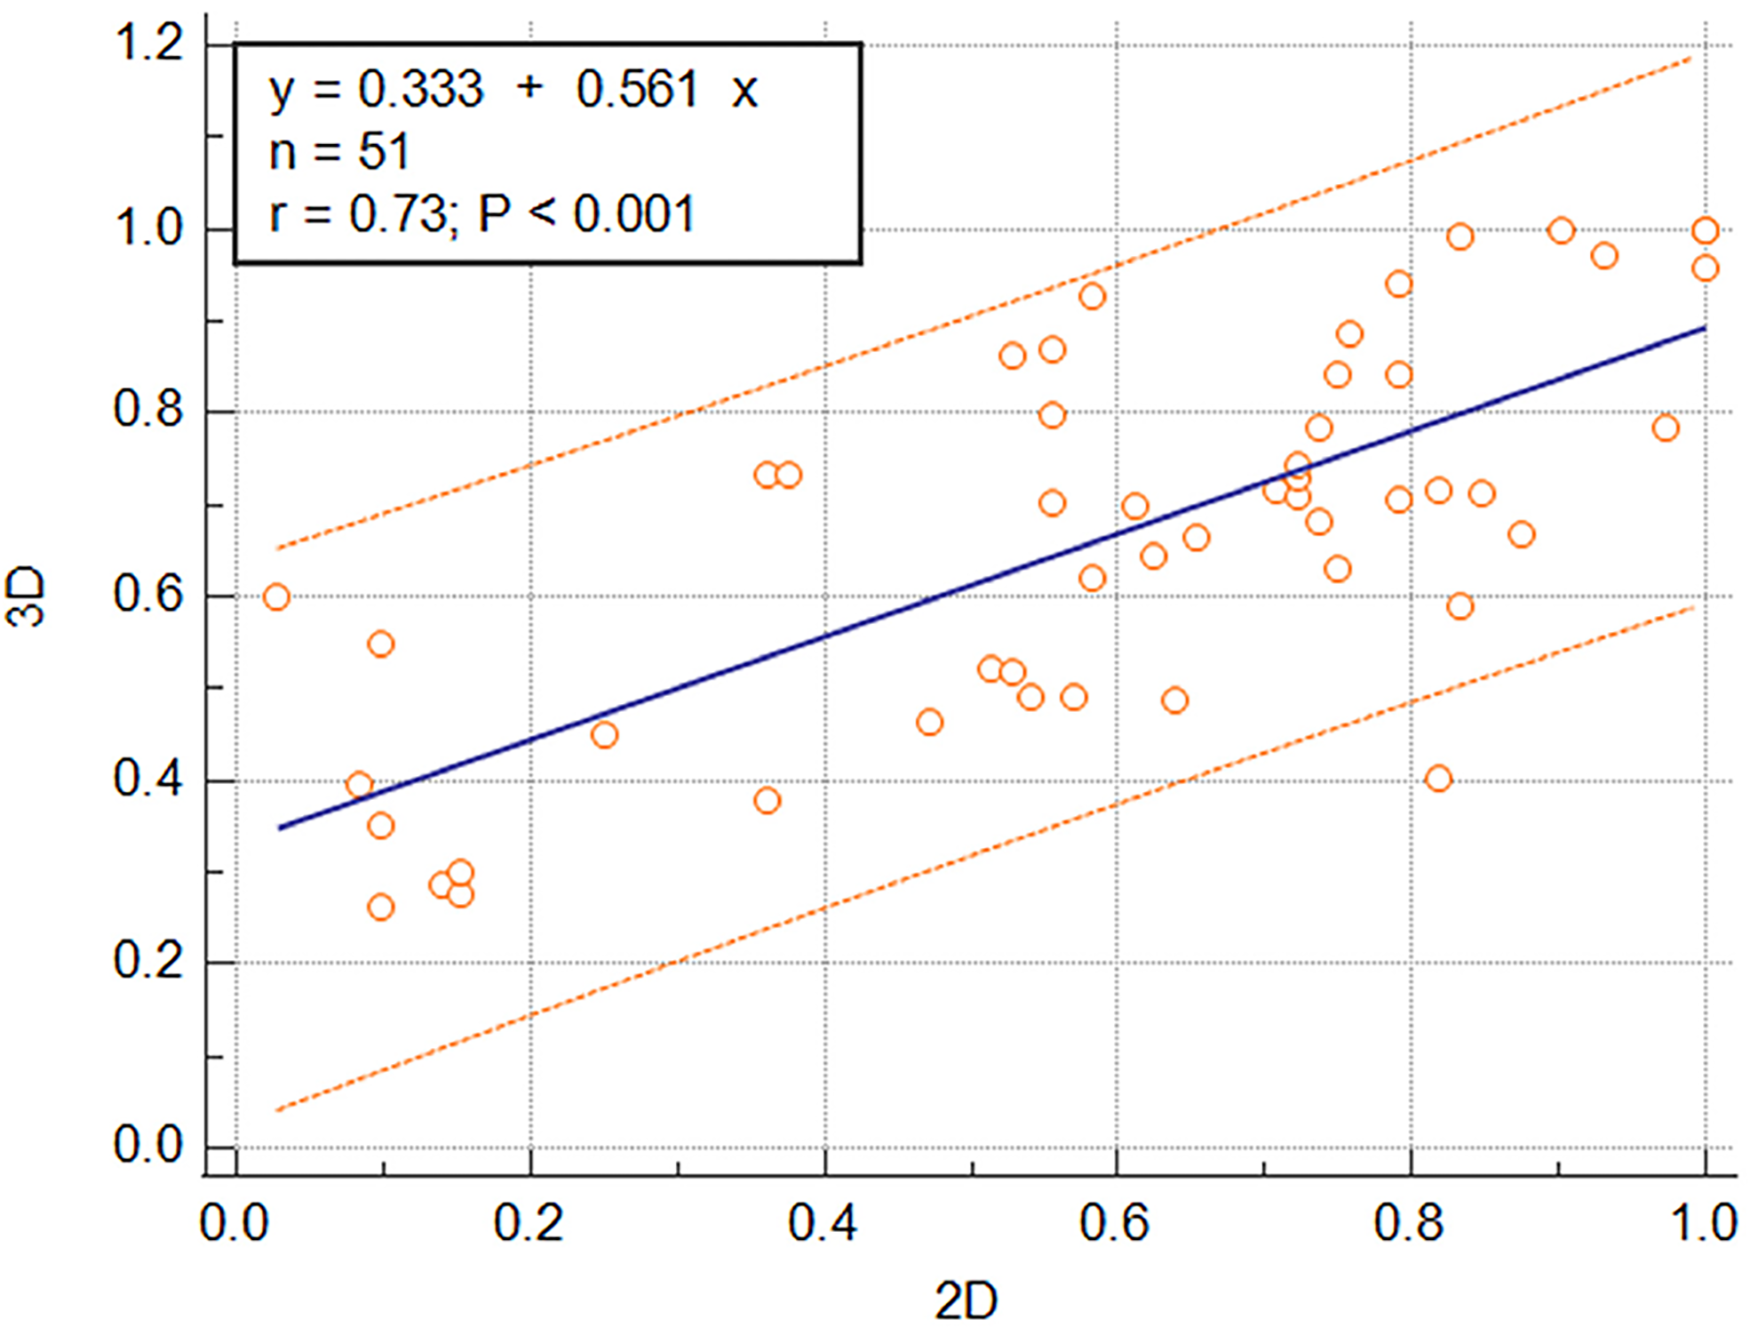
Plot of least-squares regression between mean 2D SWAG (independent variable)) and 3D bone-fill percentages (dependent variable).
Inter and Intrarater Weighted Kappa Results.
Footnotes
Declaration of Conflicting Interests
The authors declared no potential conflicts of interest with respect to the research, authorship, and/or publication of this article.
Funding
The authors received no financial support for the research, authorship, and/or publication of this article.