
Abstract
Objective
This study synthesized and described the prevalence and incidence of cleft lip and/or palate (CL/P) reported by different studies in Europe.
Design
A scoping review was designed according to the Joanna Briggs Institute methodology and an advanced search was conducted using MedLine, Science Direct, and Semantic Scholar without time or language restrictions. Two reviewers extracted data from the articles included.
Participants
The extracted data included specific details on the type of orofacial cleft, the European regions (Northern Europe, Western Europe, Eastern Europe, and Southern Europe).
Main Outcome Measure(s)
A meta-analysis was conducted with the data reported for the incidence and prevalence of CL/P.
Results
A total of 66 studies were obtained reporting from 29 European countries. According to what was obtained from the meta-analysis, a prevalence of cleft lip and palate (CLP) of 0.7/1000 95% CI: (0.6–0.7) births is reported in Europe, followed by cleft palate (CP) and cleft lip (CL) with 0.5/1000 95% CI: (0.4–0.5) and 0.3/1000 95% CI: (0.3–0.4), respectively. A total prevalence of CL/P in Europe is estimated at 1.1/1000 95% CI: (1.0–1.2) between 1950 and 2014. The incidence of CLP is reported to be 0.7/1000 95% CI: (0.6 to 0.8) followed by CP and CL with 0.5/1000 95% CI: (0.5–0.6) and 0.4/1000 95% CI: (0.3–0.4), respectively. The total incidence of CL/P in Europe is estimated at 1.6/1000 95% CI: (1.5–1.7) between 1948 and 2018.
Conclusion
This review provides a description of the status of the prevalence and incidence of CL/P in Europe and its regions, and can be considered as a guide for the development of promotion and prevention programs.
Introduction
Cleft lip and/or palate (CL/P) is considered one of the most frequent congenital orofacial clefts with an approximate prevalence of 1 in every 700 live births. However, estimates may vary depending on geographic location, group ethnicity, and socioeconomic level. 1 Literature shows that the risk of CL/P is greater when the mother is exposed to factors, such as tobacco use, use of medications during pregnancy, alcohol use, contaminated water consumption, exposure to chemicals, and folic acid deficiency. Furthermore, other factors, such as the mother's advanced age or a greater number of pregnancies, also have a negative influence. 2
Children with CL/P may have speech, nutrition, and hearing disorders as well as alterations in their general, mental, and social growth and development. Therefore, early and timely treatment and special care is essential for their rehabilitation. 3 CL/P's impact on healthcare services necessitates epidemiological monitoring of its behavior among the population through epidemiological incidence and prevalence indices in order to plan ways to meet the treatment needs of these individuals. 4
Many reports have been published on the prevalence/incidence of CL/P in different regions. However, these studies do not consider all European countries and their regions and, in many cases, the sample sizes or the lack of information about the inclusion criteria hinders data analysis and application. Indiscriminate use of the terms “incidence” and “prevalence,” lack of standardization in reports that fail to describe whether the estimates are reported based on 1000 or 10,000 individuals, and some study results lacking clarification of whether they are estimated at an institutional, national, local, or regional level results in high heterogeneity of study results, which makes it difficult to analyze data, monitor the event adequately and synthesize information to obtain more precise estimates on the frequency of the disease. 5
In 2022, Nader et al. reported a total prevalence of CL/P of 0.45/1000 live births as a result of a meta-analysis based on estimates from 55 studies. However, their analysis did not involve all European regions or countries. 6 Other studies, such as the one carried out by IPTDOC WORKING GROUP-2011, report data regarding the prevalence of CL/P in different regions worldwide. Few studies cover recent information from European countries based on observational studies. 7 These registries may have limitations in providing accurate information on the epidemiology of CL/P in all European regions, even though there are international registries, such as EUROCAT and ICBDSR, which collect hospital and population data from different countries. 8
This research is aimed at conducting a scoping review of the literature and a meta-analysis that allows for synthesizing, updating, and describing the incidence and prevalence of CL/P in Europe and its regions based on the evidence currently available in the literature as a complementary tool to the current population records of CL/P.
Methods
A scoping review was designed according to the Joanna Briggs Institute methodology. 9 The search strategy was aimed at locating published studies that reported epidemiological data on the prevalence, incidence, or frequencies of cleft lip (CL), cleft palate (CP), cleft lip and palate (CLP), or cleft lip and/or palate (CL/P) in European countries. Advanced searches were performed using MEDLINE (via PubMed), Science Direct (via Elsevier), and Semantic Scholar. The terms used during the search included: Prevalence OR Incidence + Europe* + Cleft lip OR Cleft palate. No time restrictions (publication, study development) were considered in this review for the inclusion of studies and all relevant studies were included without language restrictions.
After a pilot test, one reviewer independently evaluated the studies obtained through the search strategy, and studies were initially screened and preselected by title and abstract according to their suitability for inclusion. A full-text evaluation of the shortlisted group of articles was then conducted to make sure they reflected the objectives of this review.
Two independent reviewers extracted data from the articles included with a data extraction tool developed by them. The extracted data included specific details about participants, such as cleft type, context, European region, study methods, and relevant epidemiological findings.
Data regarding the incidence and prevalence of CL/P were taken from the included articles. For articles that did not report these CL/P indicators but did report the total number of cases and births according to the period evaluated, the prevalence and incidence were obtained individually using the formula (x = number of cases/total of births × 1000). Finally, the results were described as frequency distribution for articles that did not provide incidence and/or prevalence of CL/P or total number of births but did report the number of cases of CL/P for each sex.
A narrative approach was used when reporting the results of the studies and conducting a thematic analysis of the findings. Results were structured sequentially according to the indicator, as they were reported: prevalence, incidence, or frequency distribution in patients with CL/P. Considering this, prevalence and incidence rates were reported according to the country's geographic location (Northern, Western, Eastern, And Southern Europe). Mean estimates of CL, CP, CLP, and CL/P ratios were pooled by European regions for meta-analysis using the Stata software package, version 14, with the metaprop and metacommands. In addition, I2 was estimated to evaluate the proportion of variance due to heterogeneity.
For the assessment of publication bias, funnel plots were generated and Egger's test was applied using RStudio with the metafor and meta packages. The funnel plots, generated using the meta package, provided a visual assessment of the symmetry of the studies included in each subgroup. Egger's test, applied with the metafor package, quantified the asymmetry and evaluated the potential presence of publication bias in the data.
Results
A total of 494 articles were obtained through the advanced search. Out of these, 100 were selected during the screening process and, 66 full-text publications that reported some epidemiological indicator associated with CL, CP, CLP, or CL/P in Europe were included for the scoping review. The study selection process is presented in Supplementary Figure S1.
The evidence collected includes 29 countries: 5 reports from Germany,7,10–13 3 from Austria,7,12,13 2 from Belgium,7,12 4 from Croatia,7,12–14 9 from Denmark7,12,13,15–20 4 from Slovakia,7,21–23 1 from Slovenia, 24 5 from Spain,7,12,13,25,26 1 from Estonia, 27 4 from Finland,7,28–30 6 from France,7,12,13,31–33 5 from Hungary,7,34–37 4 from Ireland,4,12,38,39 1 from Iceland, 40 5 from Italy,7,12,13,41,42 1 from Lithuania, 13 2 from Malta,7,12 6 from Norway,42–48 9 from the Netherlands,7,12,13,49–54 4 from Poland,7,55–57 2 from Portugal,7,12 1 from the United Kingdom England, Wales, and Ireland, 58 5 from Scotland,12,58–61 5 from England,12,13,62–64 4 from the Czech Republic,7,65–67 4 from Sweden,68–71 3 from Switzerland,7,12,13 1 from Russia, 7 2 from Ukraine,7,13 and 2 from unspecified regions of Europe.6,72 Two studies reported data for the Europe without discriminating by country (Table 1).
Number of Reports Included in the Scoping Review, According to Europe's Area and Type of Indicator.
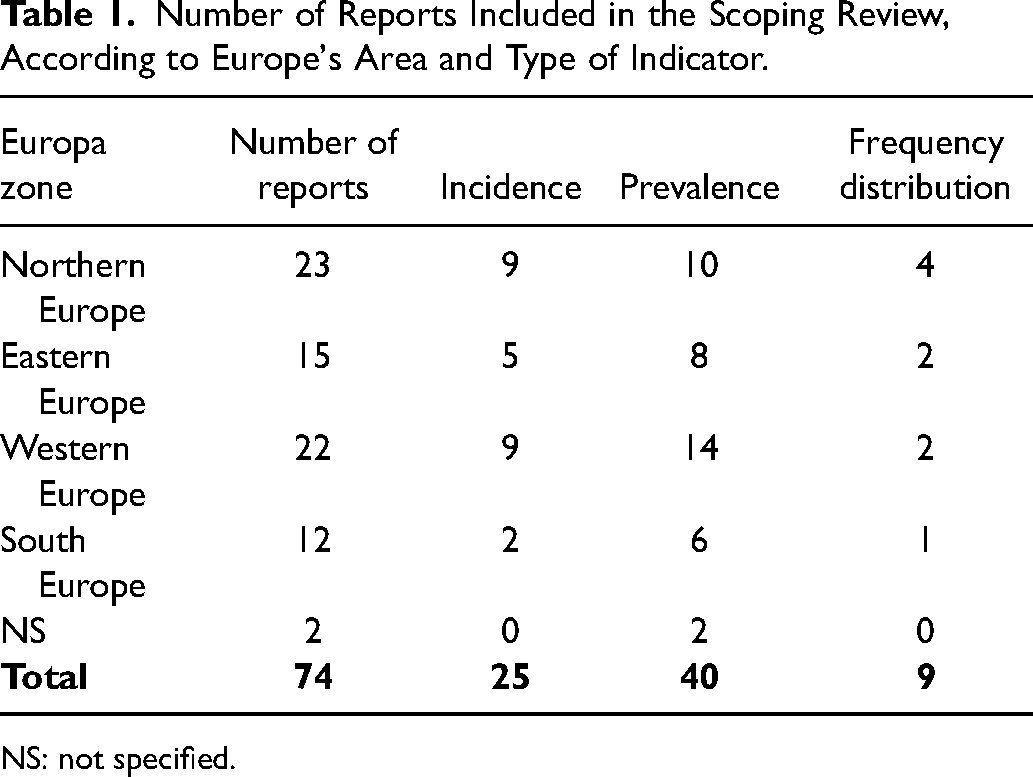
NS: not specified.
A total of 32 publications that analyzed prevalence were considered as cross-sectional studies and another 25 cohort studies reported indicators of CL/P incidence. Furthermore, 9 cross-sectional studies evaluating the sex frequency distribution of CL/P were included. The indices for each of the European regions are reported below.
Epidemiological Indicators of CL/P in European Regions
Northern Europe
A total of 10 prevalence and 9 incidence reports on CL/P were found in the literature search for Northern Europe. The highest CP prevalence in Northern Europe was reported in Denmark with 1.47/1000 live births, 15 followed by Scotland and Ireland with 0.81/1000 total births 59 and 0.78/1000 live births, 4 respectively. No CP prevalence estimates were found for Finland. The highest CL prevalence was also found in Denmark with 0.63/1000 total live births, 7 followed by England with 0.42/1000 total births. 62 The highest CLP estimate was reported in Denmark with 1.48/1000 live births,16,17 followed by England with 1.14/1000 total births, 13 and Lithuania with 1.05/1000 total births. 13 The country that reported the highest estimate of CL/P was Denmark with 2.43/1000 live births, 15 followed by Scotland and Ireland with 1.56/1000 total births 59 and 1.45/1000 live births, 4 respectively (Table 2).
Prevalence Estimates of CL, CP, CLP, and CL/P According to Country and European Region.
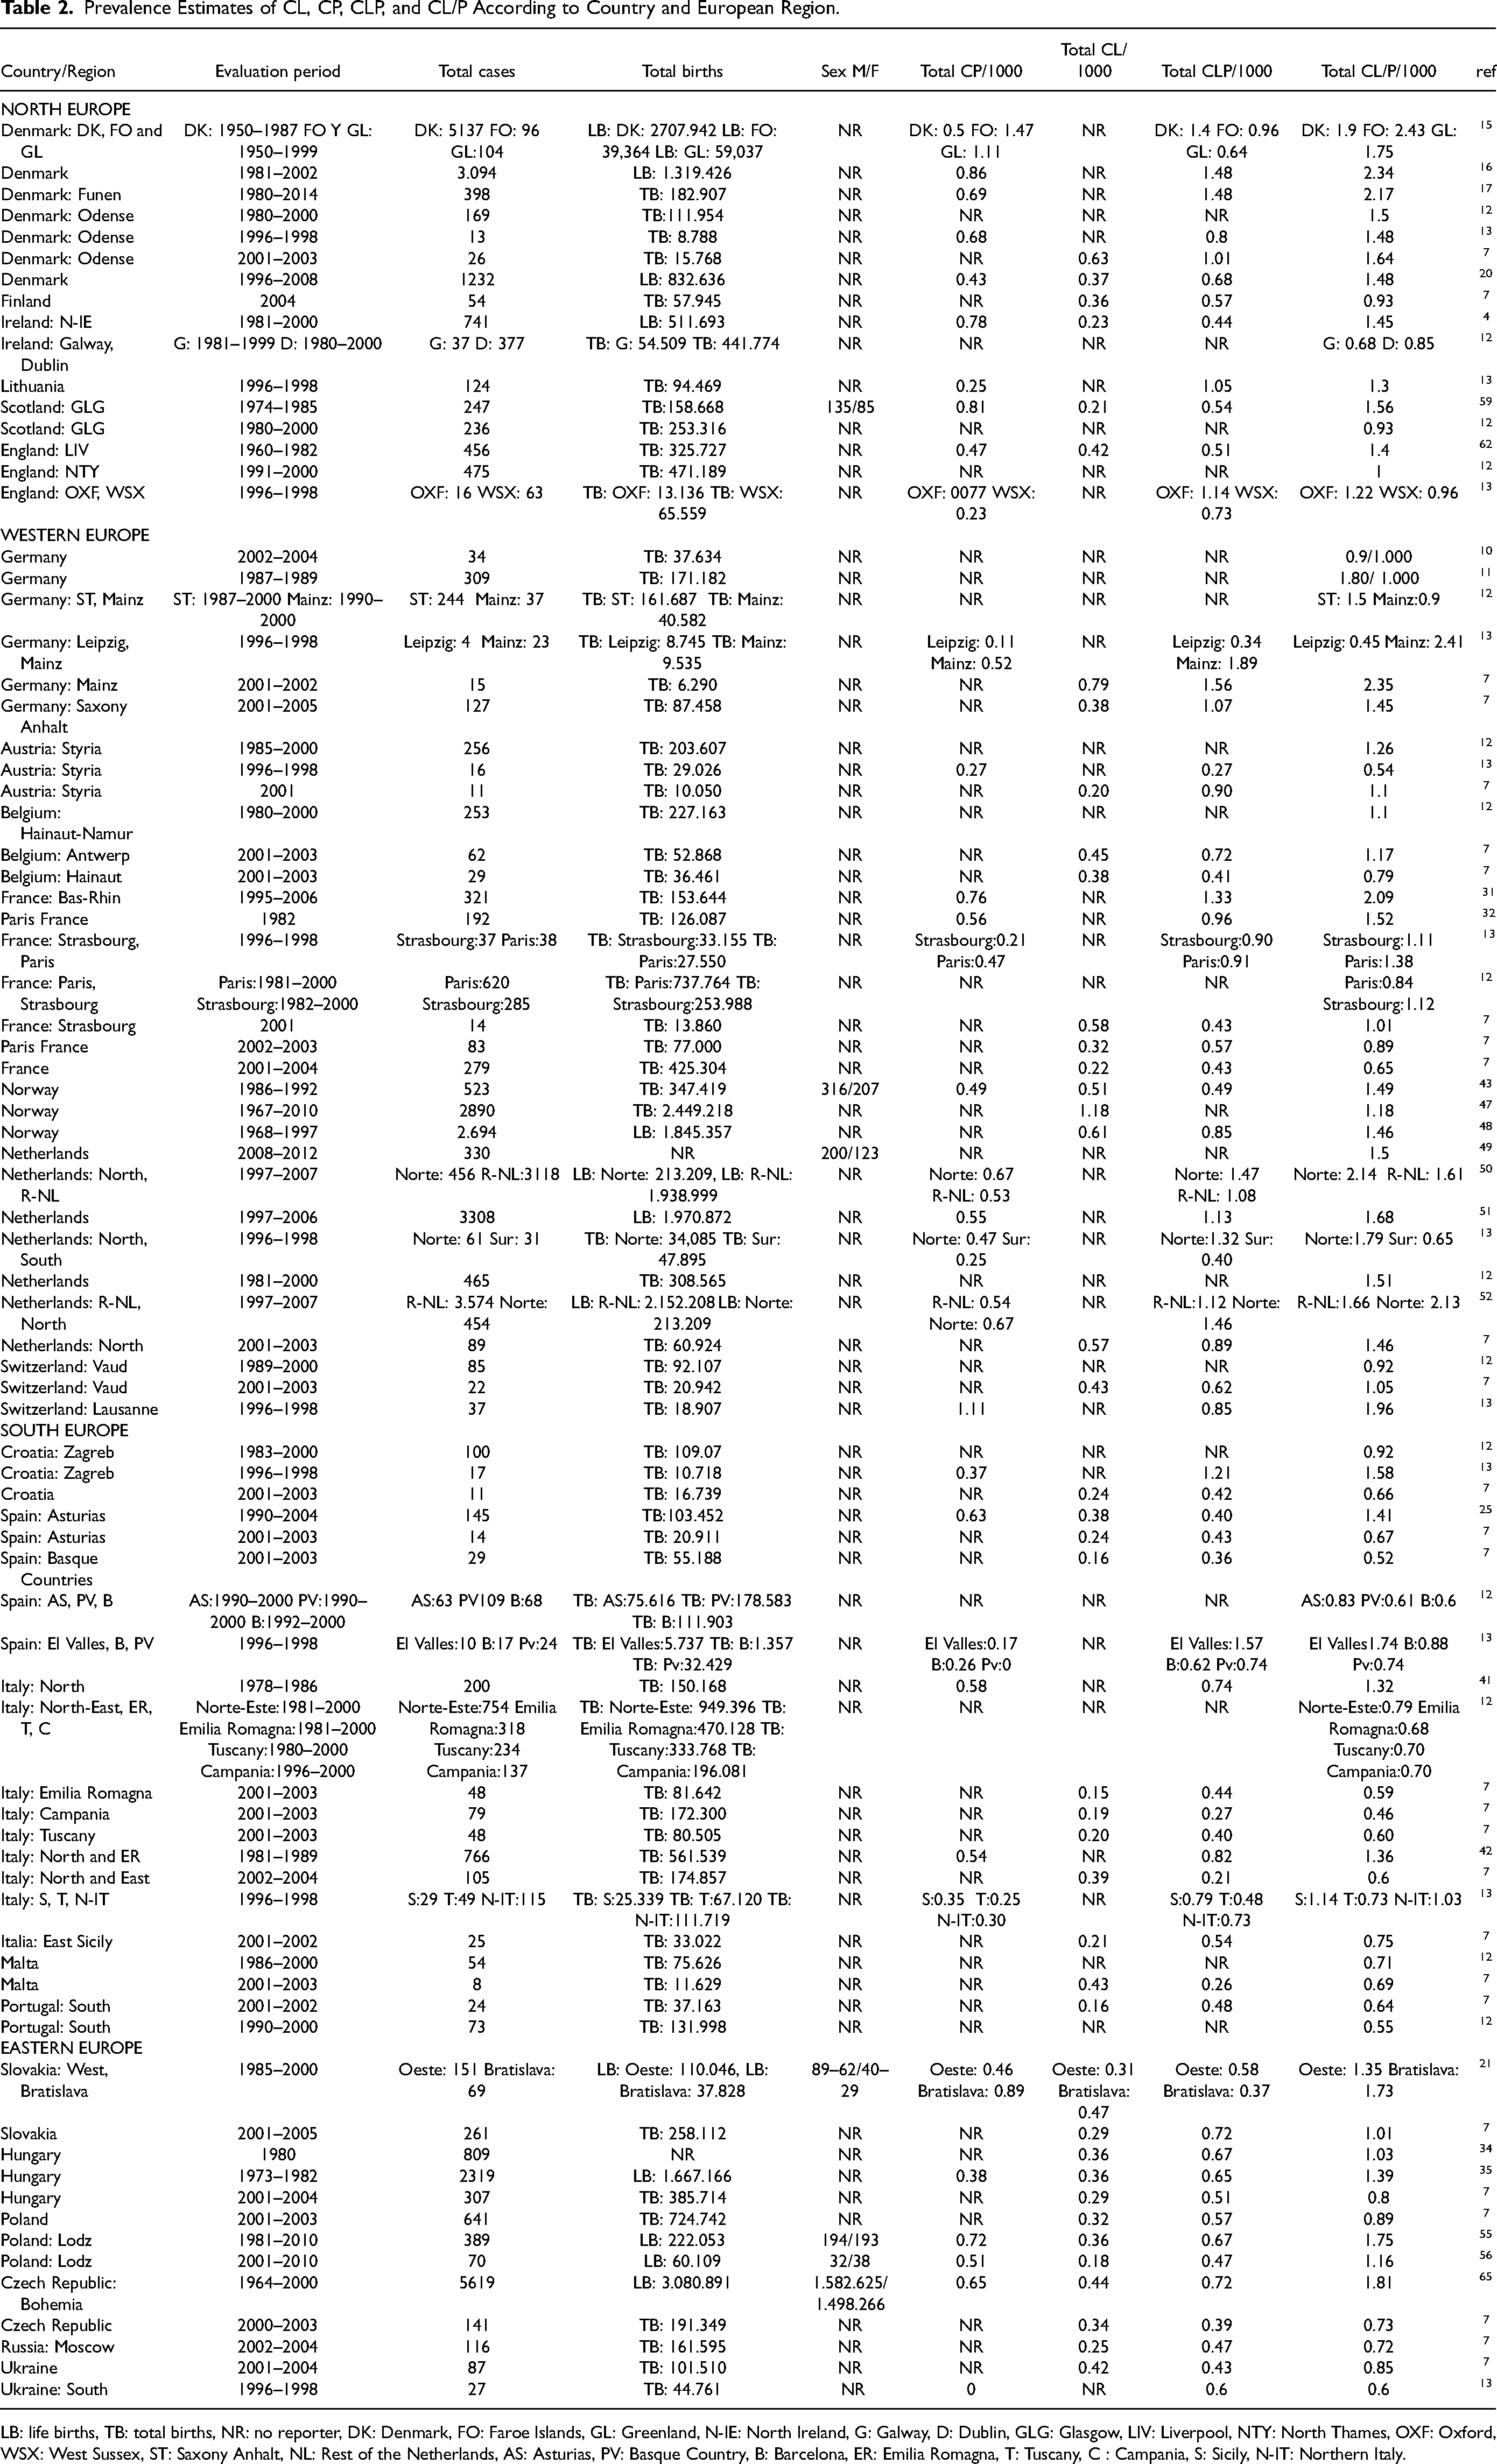
LB: life births, TB: total births, NR: no reporter, DK: Denmark, FO: Faroe Islands, GL: Greenland, N-IE: North Ireland, G: Galway, D: Dublin, GLG: Glasgow, LIV: Liverpool, NTY: North Thames, OXF: Oxford, WSX: West Sussex, ST: Saxony Anhalt, NL: Rest of the Netherlands, AS: Asturias, PV: Basque Country, B: Barcelona, ER: Emilia Romagna, T: Tuscany, C : Campania, S: Sicily, N-IT: Northern Italy.
According to the results of our meta-analysis, the estimated CL prevalence reported for Northern Europe was 0.3/1000 total births 95% CI (0.2–0.5) between 1960 and 2008 (Supplementary Figure S2). For CP, it was 0.6/1000 births 95% CI (0.4–0.8) between 1950 and 2014 (Supplementary Figure S3). For CLP, it was 0.8/1000 births 95% CI (0.6–0.10) between 1950 and 2014 (Supplementary Figure S4), and for CL/P it was 1.4/1000 births 95% CI (1.2–1.6) between 1950 and 2014 (Supplementary Figure S5).
According to the incidence data reported in Northern Europe, the country with the highest incidence of CP is Finland with 0.97/1000 live births, 29 followed by England with 0.7/1000 live births, 64 and Scotland with 0.64/1000 total births. 60 For CL, Denmark reported the highest incidence with 0.63/1000 live births, 18 followed by Scotland and Finland with 0.35/1000 total births 60 and 0.22/1000 total births, 28 respectively. The highest estimate for CLP was observed in England with 1.12/1000 live births, 64 followed by Scotland with 0.85/1000 live births, 58 and Finland with 0.77/1000 live births. 29 For CL/P, Denmark reported the highest estimate with 1.89/1000 live births, 18 followed by England with 1.82/1000 live births, 64 and Finland with 1.74/1000 live births 29 (Table 3).
Estimates of Incidence of CL, CP, CLP, and CL/P According to Country and European Region.
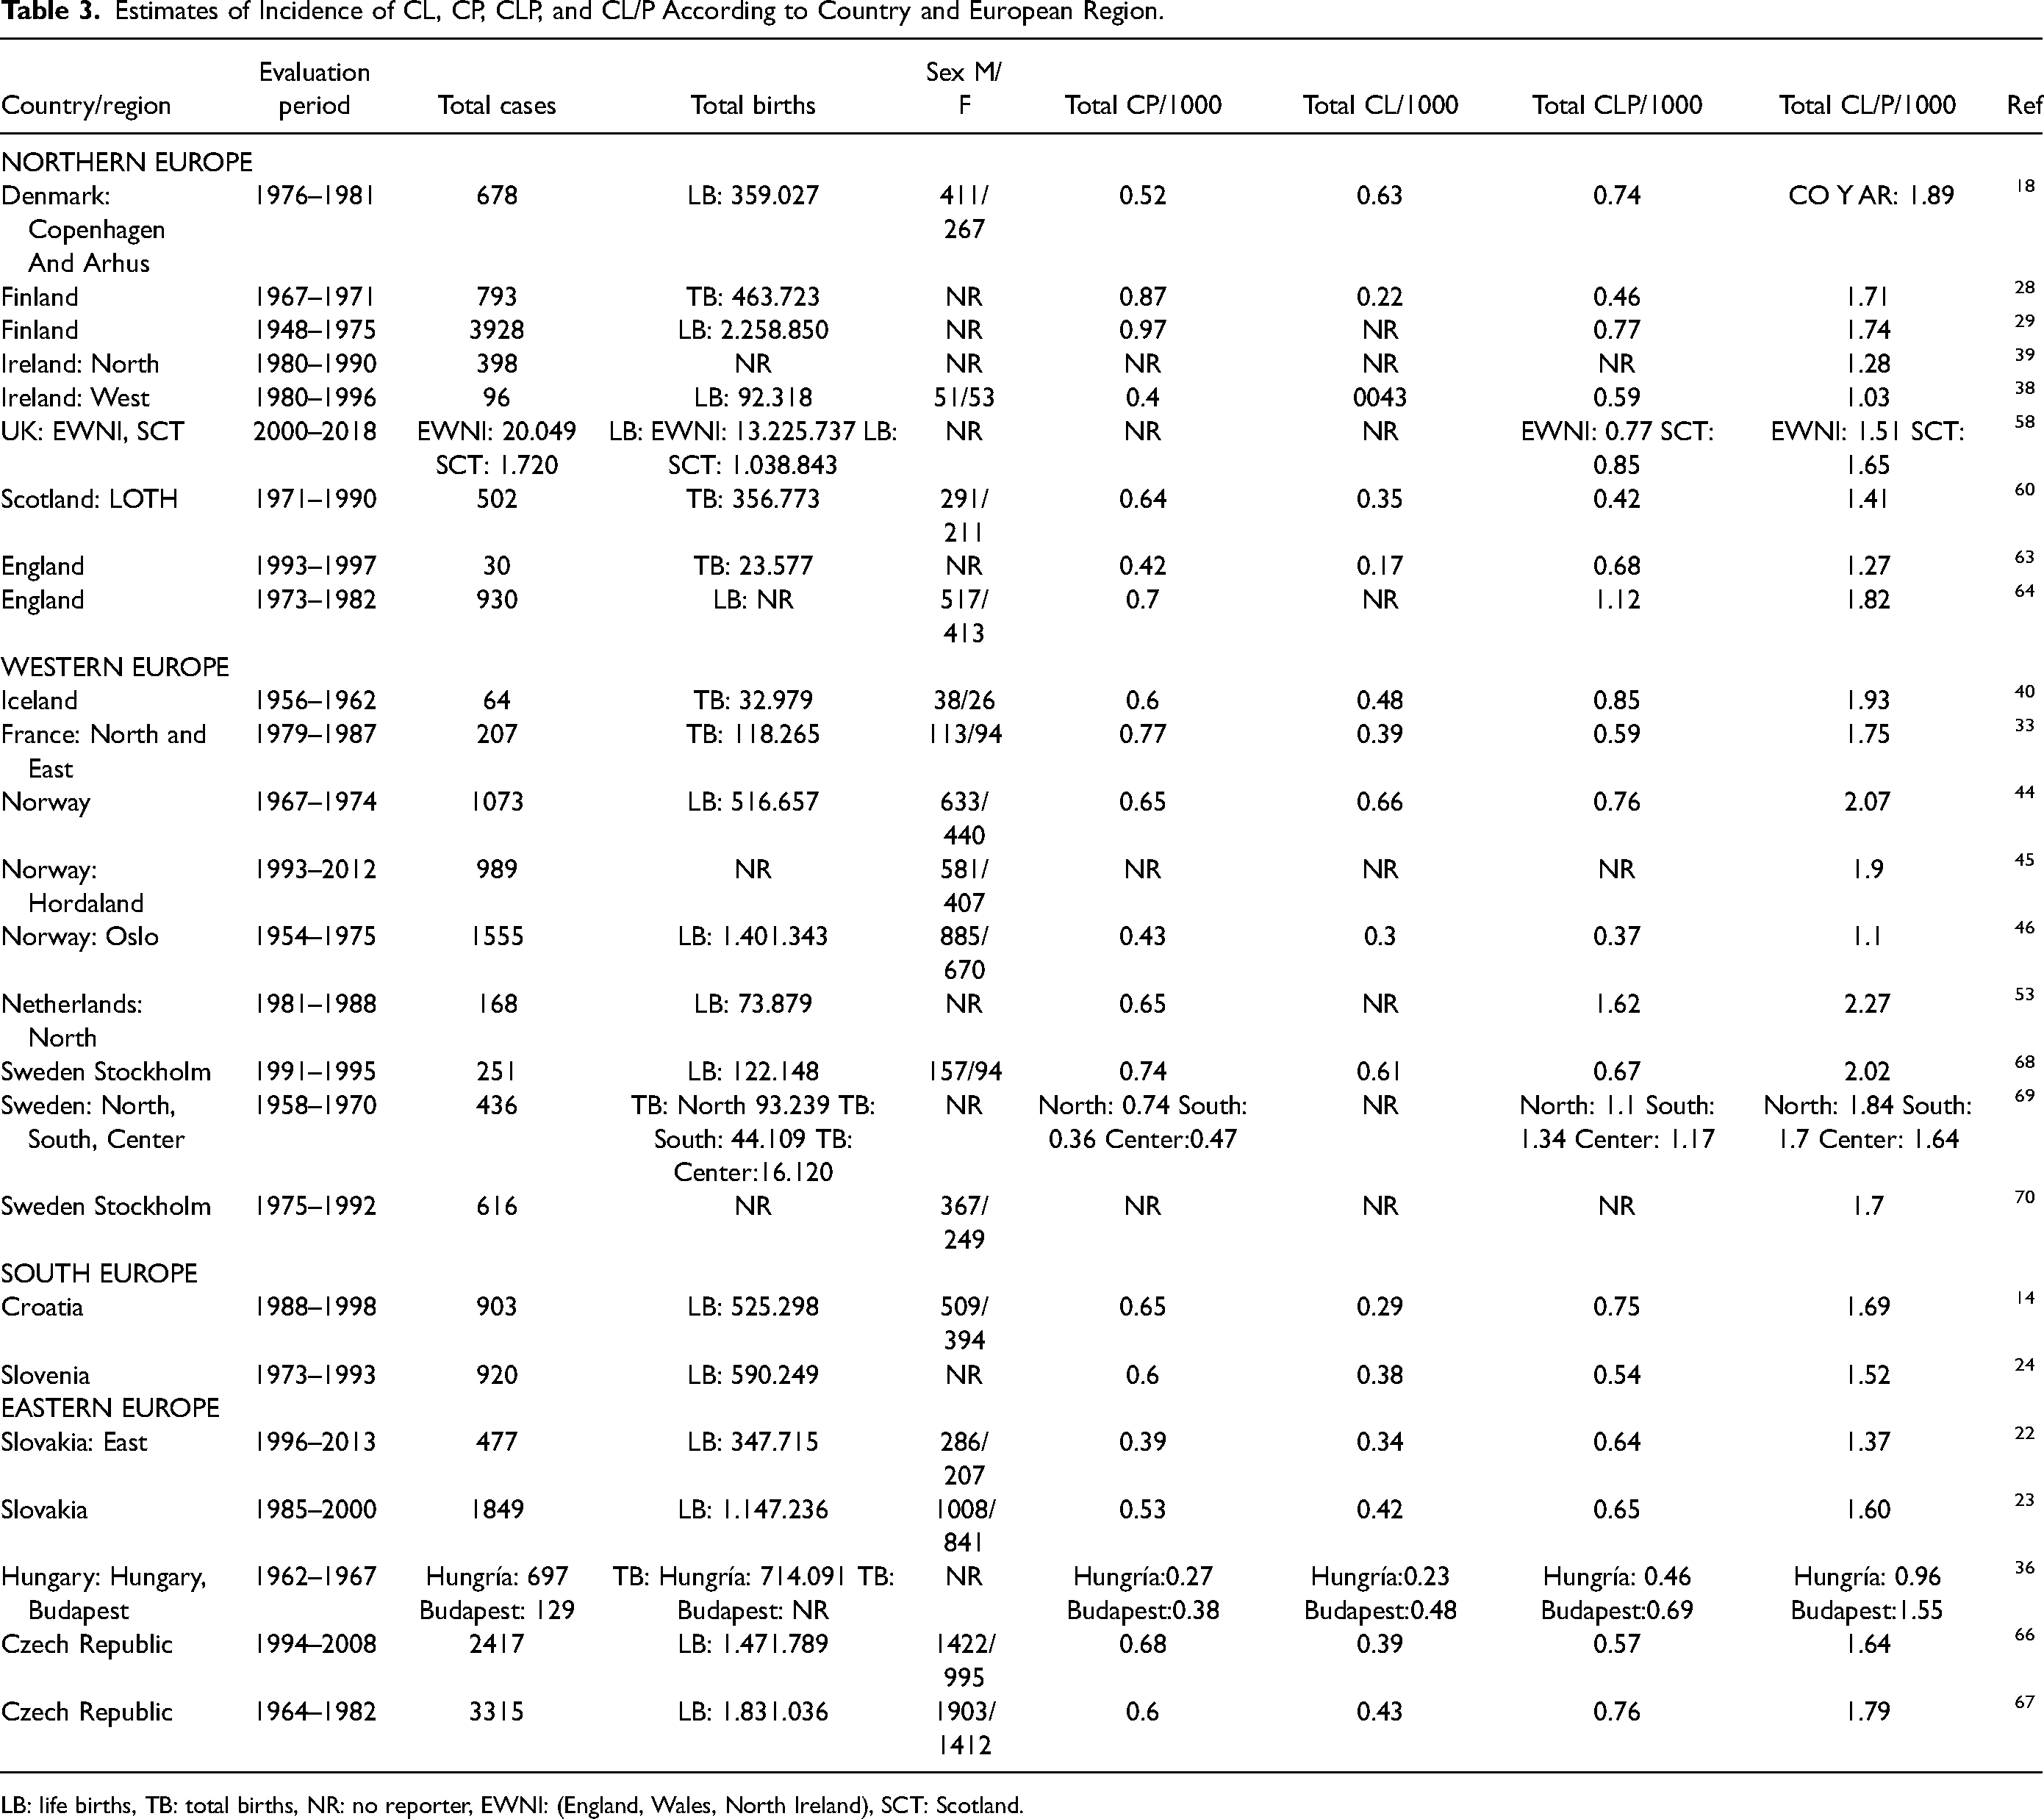
LB: life births, TB: total births, NR: no reporter, EWNI: (England, Wales, North Ireland), SCT: Scotland.
The results of the meta-analysis show an incidence of CL of 0.3/1000 births 95% CI (0.1–0.4) between 1967 and 1997 for Northern Europe (Supplementary Figure S6). For CP, it was 0.6/1000 births 95% CI (0.4–0.7) between 1948 and 1997 (Supplementary Figure S7). For CLP, it was 0.7/1000 births 95% CI (0.5–0.9) between 1948 and 2018 (Supplementary Figure S8), and for CL/P it was 1.5/1000 births 95% CI (1.3–1.7) between 1948 and 2018 (Supplementary Figure S9).
Eastern Europe
The literature search for Eastern Europe identified 8 prevalence reports and 5 incidence reports. The highest prevalence of CP in Eastern Europe was found in Slovakia with 0.89/1000 live births, 21 followed by Poland and the Czech Republic with 0.72/1000 live births 55 and 0.65/1000 live births, 65 respectively. The highest CL estimate was reported in Slovakia with 0.47/1000 live births, 21 followed by Czech Republic with 0.44/1000 live births, 65 and Ukraine with 0.42/1000 total births. 7 For CLP, the highest value was reported in Slovakia and Czech Republic with 0.72/1000 live births,7,65 followed by Poland with 0.67/1000 live births, 55 and Ukraine with 0.6/1000 total births. 13 The Czech Republic reported the highest estimate of CL/P with 1.81/1000 live births, 65 followed by Poland with 1.75/1000 live births, 55 and Slovakia with 1.73/1000 live births 21 (Table 2).
Our meta-analysis showed a CL prevalence of 0.3/1000 births 95% CI (0.2–0.4) between 1964 and 2005 for Eastern Europe (Supplementary Figure S2). For CP, an estimate of 0.6/1000 births 95% CI (0.3–0.8) between 1964 and 2010 was found (Supplementary Figure S3). For CLP, it was 0.5/1000 births 95% CI (0.4–0.7) between 1964 and 2010 (Supplementary Figure S4), and for CL/P, it was 1.1/1000 births 95% CI (0.9–1.3) between 1964 and 2010 (Supplementary Figure S5).
The country that showed the highest incidence value for CP in Eastern Europe was Czech Republic with 0.68/1000 live births, 66 followed by Slovakia and Hungary with 0.53/1000 live births 23 and 0.38/1000 total births, 36 respectively. For CL, the highest estimate was reported in Hungary with 0.48/1000 total births, 36 followed by Czech Republic with 0.43/1000 live births, 67 and Slovakia with 0.42/1000 live births. 23 For CLP, the highest incidence was reported in the Czech Republic with 0.76/1000 live births, 67 followed by Hungary with 0.69/1000 total births, 36 and Slovakia with 0.65/1000 live births. 23 The country with the highest estimate of CL/P was the Czech Republic with 1.79/1000 live births, 67 followed by Slovakia and Hungary with 1.60/1000 live births 23 and 1.55/1000 total births, 36 respectively (Table 3).
The results of our meta-analysis show an incidence of CL of 0.3/1000 births 95% CI (0.2–0.5) between 1962 and 2013 for Eastern Europe (Supplementary Figure S6). For CP, it was 0.4/1000 births 95% CI (0.3–0.6) between 1962 and 2013 (Supplementary Figure S7). For CLP, an estimate of 0.6/1000 95% CI (0.5–0.8) between 1962 and 2013 was found (Supplementary Figure S8) and, for CL/P, it was 1.5/1000 births 95% CI (1.2–1.7) between 1962 and 2013 (Supplementary Figure S9).
Western Europe
The literature reported 14 prevalence and 9 incidence reports for Western Europe.
The highest prevalence of CP in Western Europe was reported in Switzerland with 1.11/1000 total births, 13 followed by France with 0.76/1000 total births, 31 and the Netherlands with 0.67/1000 live births. 50 For CL, the highest rate was found in Norway with 1.18/1000 total births, 47 followed by Germany and France with 0.79/1000 and 0.58/1000 total births, 7 respectively. The highest estimate of CLP was reported in Germany with 1.89/1000 total births, 13 followed by the Netherlands with 1.47/1000 live births. 50 The country with the highest estimate of CL/P was Germany with 2.41/1000 total births, 13 followed by the Netherlands with 2.14/1000 live births 50 and France with 2.09/1000 total births 31 (Table 2).
The results of our meta-analysis show a prevalence of CL of 0.4/1000 births 95% CI (0.3–0.6) between 1967 and 2010 for Western Europe (Supplementary Figure S2). For CP, it was 0.5/1000 births 95% CI (0.3–0.6) between 1982 and 2007 (Supplementary Figure S3). For CLP, it was 0.8/1000 births 95% CI (0.7–1.0) between 1982 and 2007 (Supplementary Figure S4), and for CL/P it was 1.3/1000 births 95% CI (1.1–1.4) between 1967 and 2012 (Supplementary Figure S5).
The highest incidence of CP in Western Europe was observed in France with 0.77/1000 total births, 33 followed by Sweden with 0.74/1000 total births68,69 and Norway together with Netherlands with 0.65/1000 live births.44,53 For CL, the highest estimate was reported in Norway with 0.66/1000 live births, 44 followed by Sweden with 0.61/1000 live births, 68 and Iceland with 0.48/1000 total births. 40 The country with the highest incidence of CLP was the Netherlands with 1.62/1000 live births, 53 followed by Sweden with 1.34/1000 total births, 69 and Iceland with 0.85/1000 total births. 40 The Netherlands reported the highest estimate of CL/P with 2.27/1000 live births, 53 followed by Norway with 2.07/1000 live births, 44 and Sweden with 2.02/1000 live births 68 (Table 3).
The results of our meta-analysis show an incidence of CL of 0.5/1000 births 95% CI (0.3–0.6) between 1954 and 1995 for Western Europe (Supplementary Figure S6). For CP, it was 0.6/1000 births 95% CI (0.4–0.7) between 1954 and 1995 (Supplementary Figure S7). For CLP, it was 0.9/1000 births 95% CI (0.6–1.1) between 1954 and 1995 (Supplementary Figure S8), and for CL/P, it was 1.8/1000 births 95% CI (1.5–2.0) between 1954 and 2012 (Supplementary Figure S9).
Southern Europe
A total of 6 prevalence and 2 incidence reports were found for Southern Europe. The highest CP prevalence rate was found in Spain with 0.63/1000 total births, 25 followed by Italy and Croatia with 0.58/1000 total births 42 and 0.37/1000 total births, 13 respectively. For CL, the highest estimate was reported in Malta with 0.43/1000 total births, 7 followed by Italy with 0.39/1000 total births 7 and Spain with 0.38/1000 total births. 25 The highest prevalence rate for CLP was reported in Spain with 1.57/1000 total births, 13 followed by Croatia with 1.21/1000 total births, 13 and Italy with 0.82/1000 total births. 42 For CL/P, the highest estimate was found in Spain with 1.74/1000 live births, 13 followed by Croatia and Malta with 1.58/1000 total births 13 and 0.71/1000 total births, 12 respectively (Table 2).
According to the meta-analysis results, the prevalence showed an estimate of CL of 0.2/1000 births 95% CI (0.1–0.3) between 1990 and 2004 for Southern Europe (Supplementary Figure S3). For CP, it was 0.4/1000 births 95% CI (0.2–0.5) between 1978 and 2004 (Supplementary Figure S3). For CLP, it was 0.5/1000 births 95% CI (0.4–0.6) between 1978 and 2004 (Supplementary Figure S4) and, for CL/P, it was 0.8/1000 births 95% CI (0.7–0.9) between 1978 and 2004 (Supplementary Figure S5).
The country with the highest incidence of CP for Southern Europe is Croatia with 0.65/1000 live births, 14 followed by Slovenia with 0.60/1000 live births. 24 For CL, the highest estimate was found in Slovenia with 0.38/1000 live births, 24 followed by Croatia with 0.29/1000 live births. 14 For CLP, the highest estimate was seen in Croatia with 0.75/1000 live births, 14 followed by Slovenia with 0.54/1000 live births, 24 and for CL/P the highest incidence rate was reported in Croatia with 1.69/1000 live births, 14 followed by Slovenia with 1.52/1000 live births 24 (Table 3).
The results of our meta-analysis show an incidence of CL of 0.3/1000 births 95% CI (0.1–0.6) between 1973 and 1998 for Southern Europe (Supplementary Figure S6). For CP, it was 0.6/1000 births 95% CI (0.3–1.0) between 1973 and 1998 (Supplementary Figure S7). For CLP, it was 0.6/1000 births 95% CI (0.3–1.0) between 1973 and 1998 (Supplementary Figure S8) and, for CL/P, it was 1.6/1000 births 95% CI (1.1–2.1) between 1973 and 1998 (Supplementary Figure S9).
Europe
Two studies conducted in 2011 by Loane et al. in 2011 5 and Boyd et al., 69 analyzing the 1999–2008 and 2004–2008 periods, respectively, report a total prevalence of CL/P of 1.45 per 1000 births in Europe. However, these two studies do not report which European countries these prevalence rates belong to, nor the total number of births, which is why they were analyzed separately from the geographical regions of Europe
According to the results of our meta-analysis, CL prevalence was 0.3/1000 births 95% CI (0.3–0.4) between 1960 and 2010 for all of Europe (Supplementary Figure S2). For CP, it was 0.5/1000 births 95% CI (0.4–0.5) between 1950 and 2014 (Supplementary Figure S3). For CLP, it was 0.7/1000 births 95% CI (0.6–0.7) between 1950 and 2014 (Supplementary Figure S4), and for CL/P, it was 1.1/1000 births 95% CI (1.0–1.2) between 1950 and 2014 (Supplementary Figure S5).
The results of our meta-analysis showed an incidence of CL of 0.4/1000 births 95% CI (0.3–0.4) between 1954 and 2013 for all of Europe (Supplementary Figure S6). For CP, it was 0.5/1000 births 95% CI (0.5–0.6) between 1948 and 2013 (Supplementary Figure S7). For CLP, it was 0.7/1000 births 95% CI (0.6–0.8) between 1948 and 2018 (Supplementary Figure S8), for CL/P, it was 1.6/1000 births 95% CI (1.5–1.7) between 1948 and 2018 (Supplementary Figure S9).
Geographic distribution of the pooled incidence and prevalence of lip and/or palate in Europe per 1000 inhabitants are presented in Figures 1 and 2.
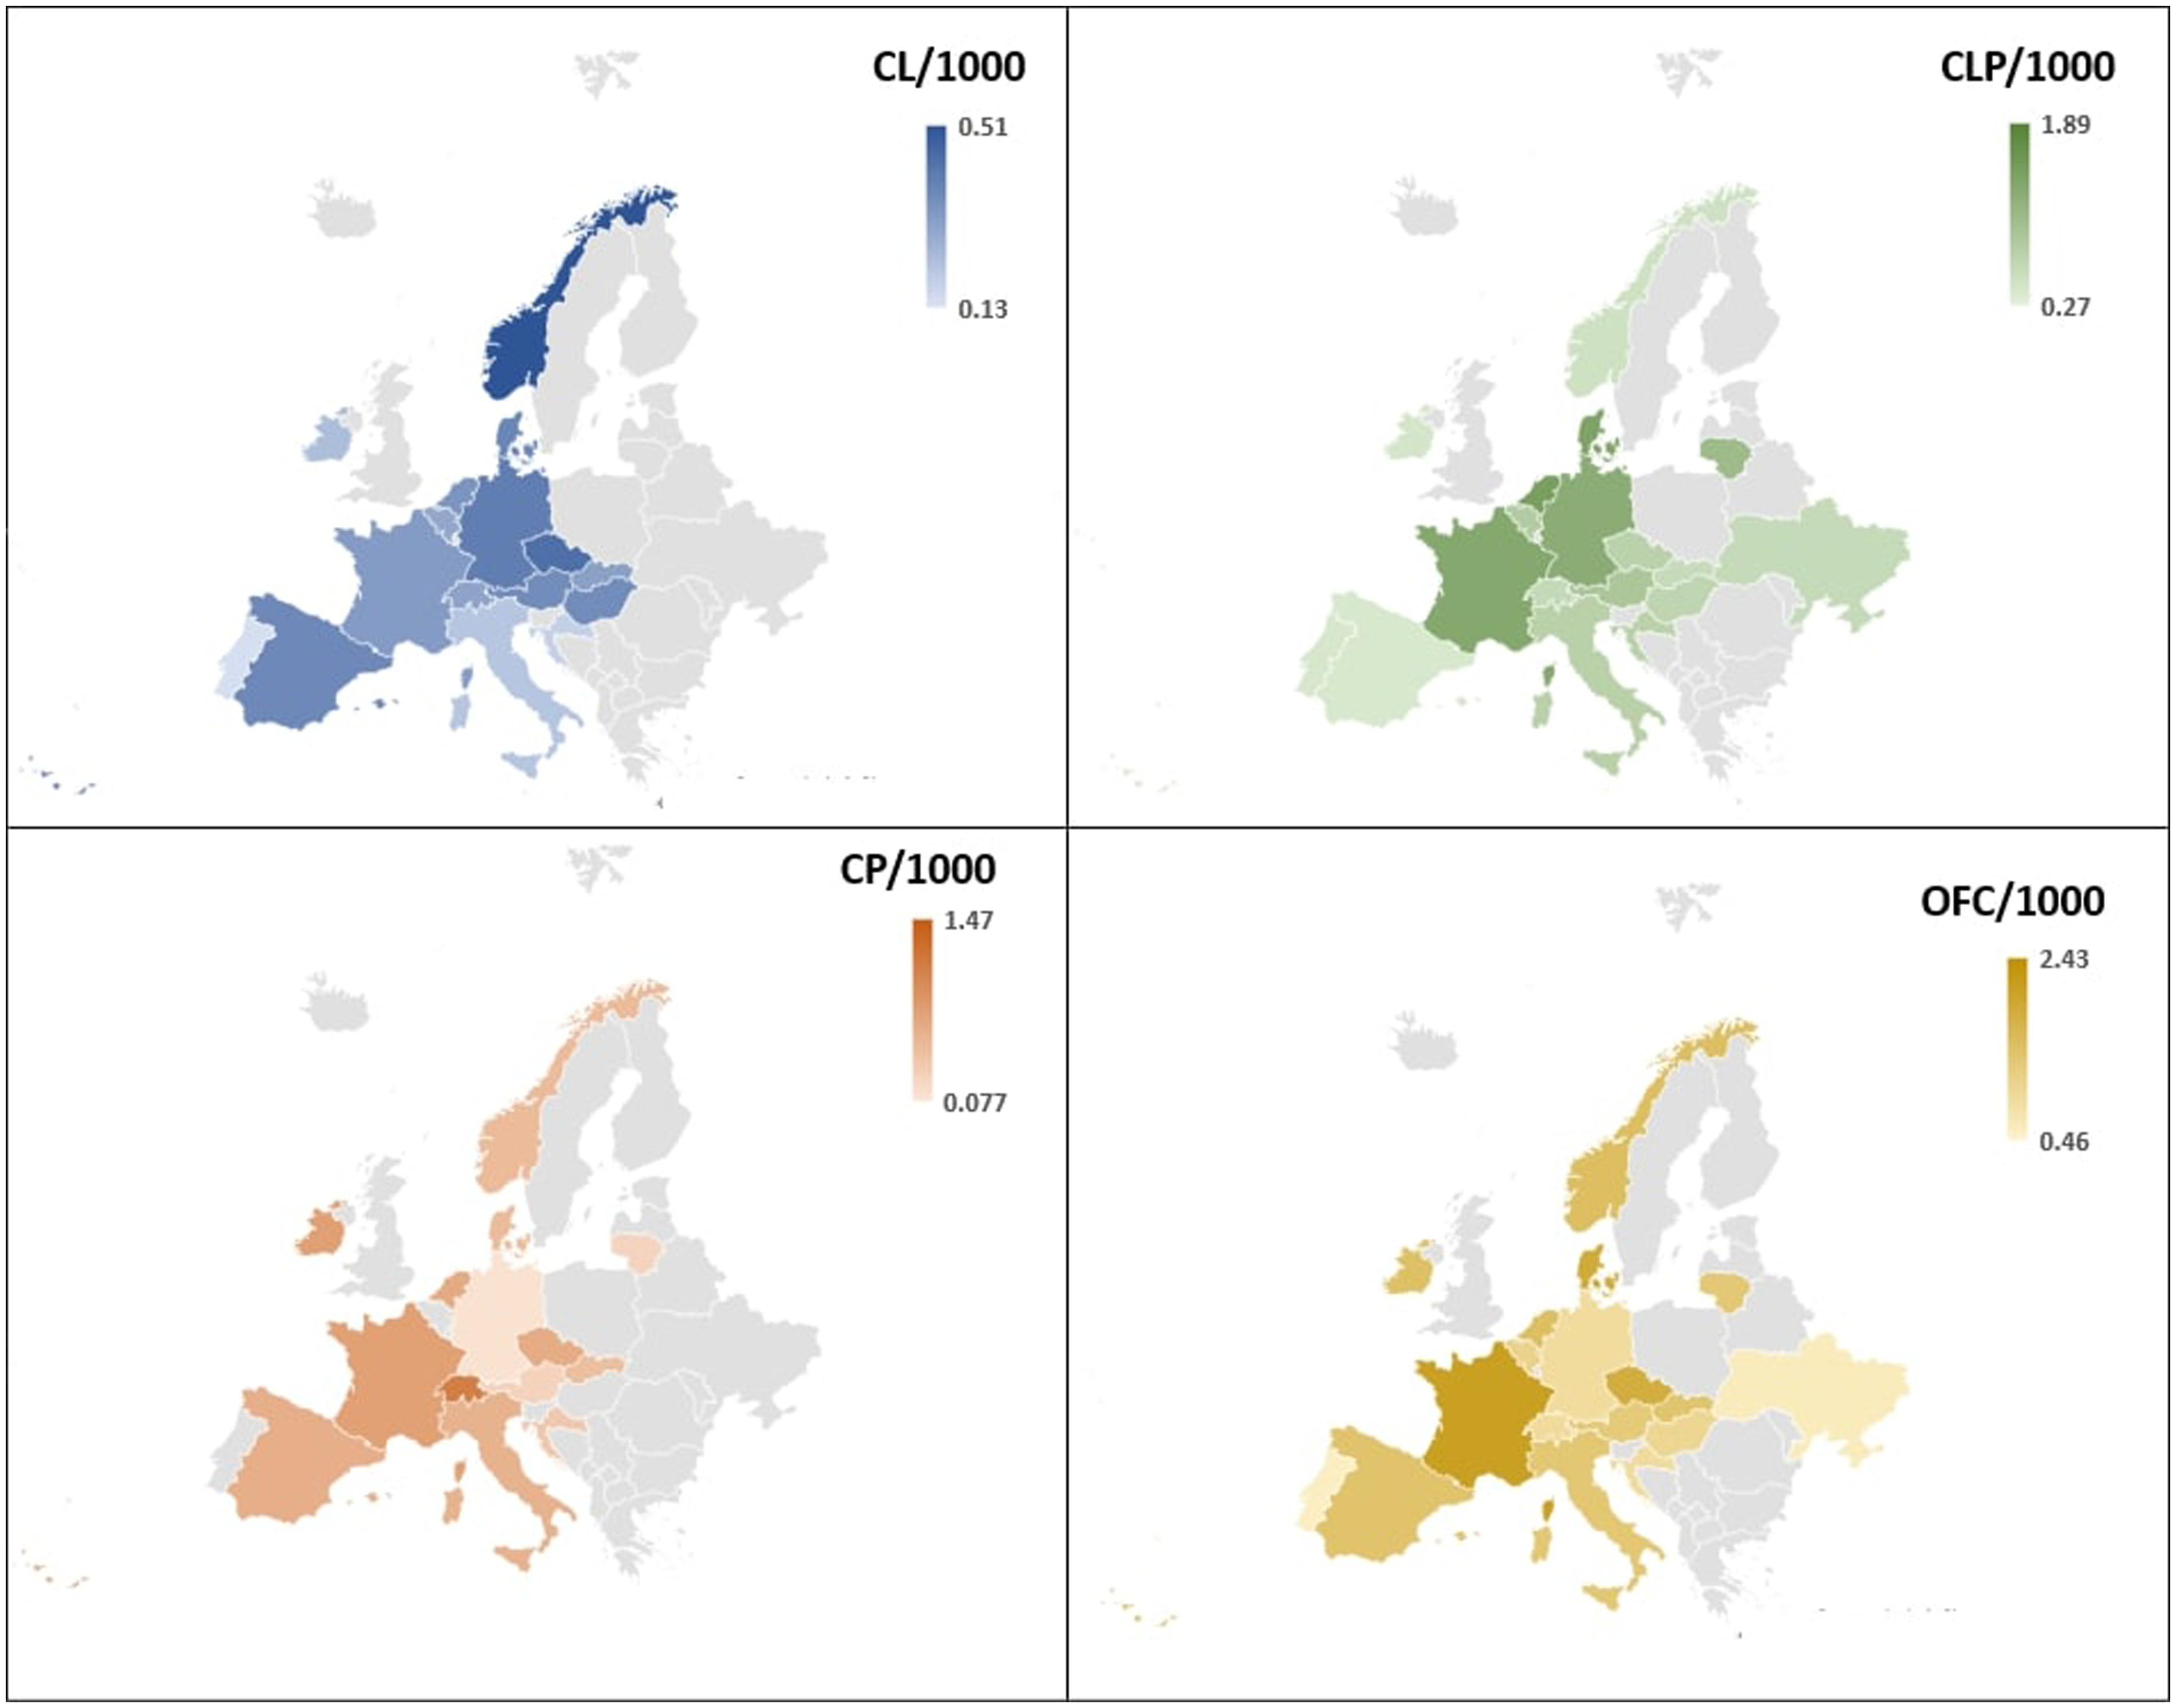
Geographic distribution of the pooled prevalence and prevalence of lip and/or palate in Europe per 1000 inhabitants.
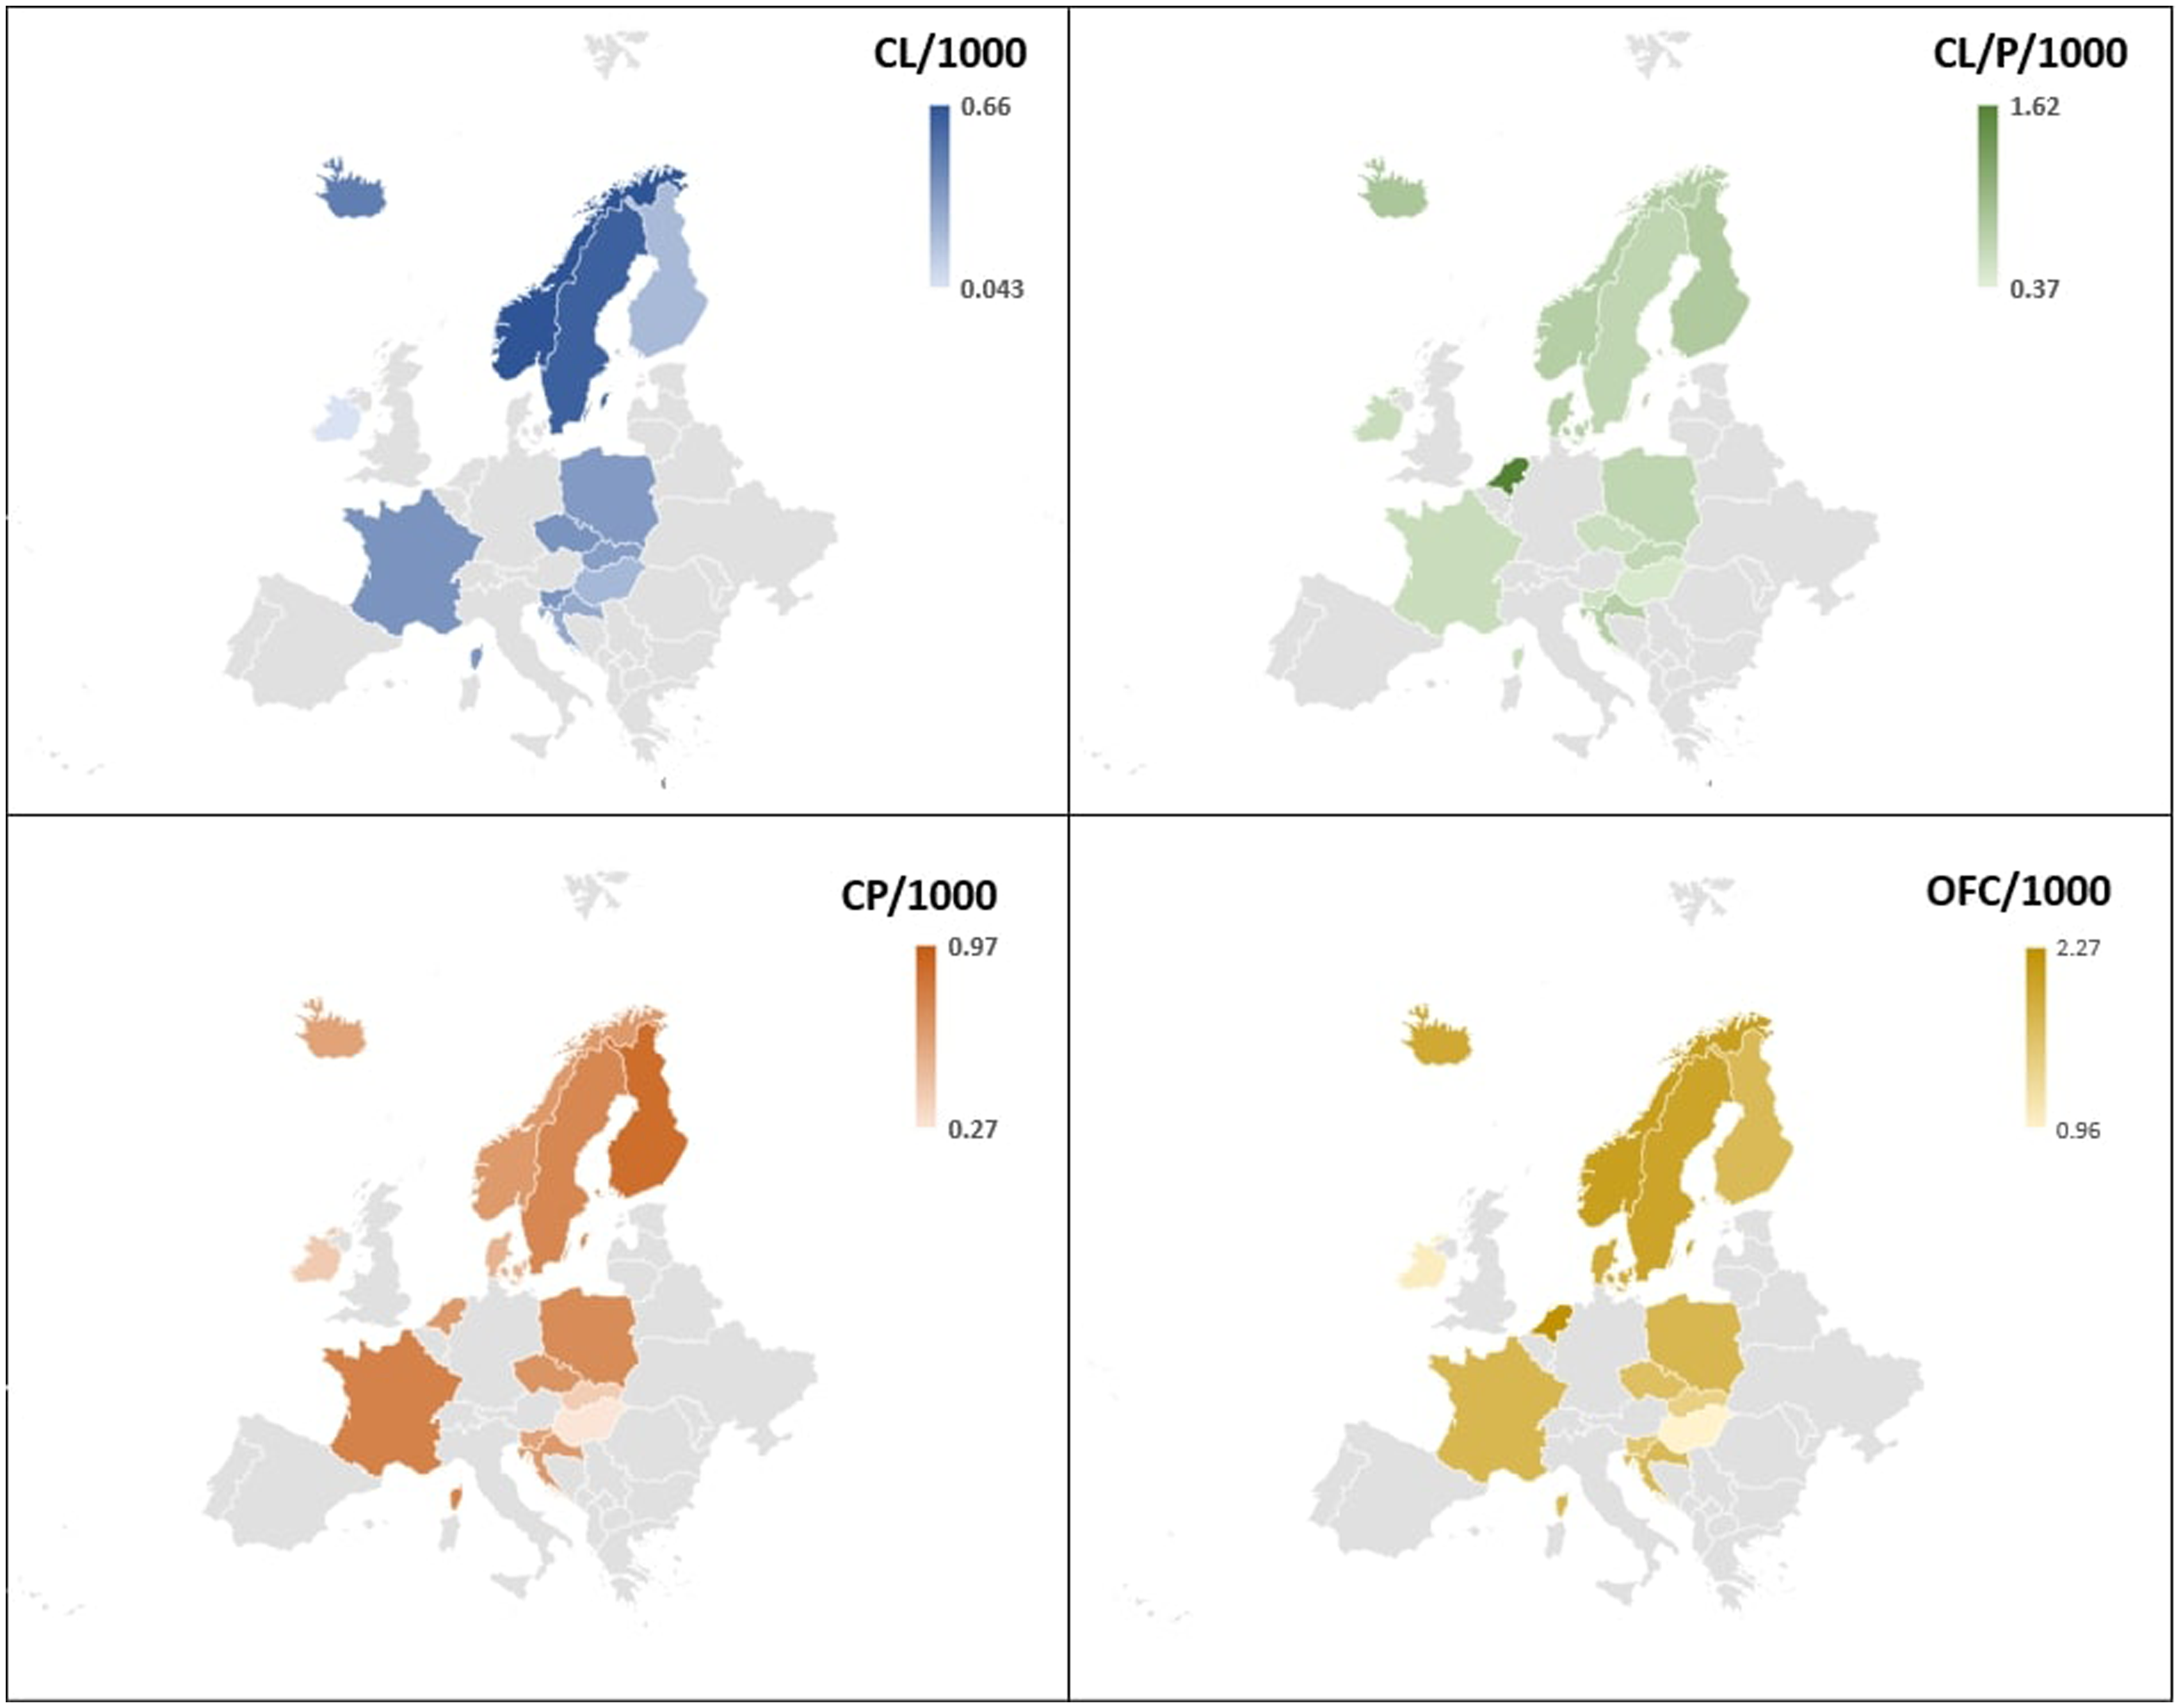
Geographic distribution of the pooled incidente and prevalence of lip and/or palate in Europe per 1000 inhabitants.
The funnel plots presented in the supplementary file (Figure S10) show significant asymmetry across all subgroups of analyzed conditions (CL, CP, CL/P, OFC) in both prevalence and incidence, according to Egger's test results (p < 0.0001). Bias estimates were highest in the prevalence and incidence of CL (160.43, SE = 4.28; 167.20, SE = 6.37) and CP (126.21, SE = 3.18; 101.96, SE = 1.38), and lowest in OFC (84.41, SE = 0.32; 80.96, SE = 0.11).
Frequency Distribution
We found 9 different studies that report total cases of CL/P according to the type of condition. In Northern, Southern, Eastern, and Western Europe, there is a greater number of CLP cases, followed by CP and CL, except for the studies carried out in Finland and Poland during 1998 to 2011 and 1981 to 2015, respectively, which report a greater number of CP cases, followed by CLP. Several studies in Scotland, Denmark, Sweden, the Netherlands, and Hungary did not determine the number of CL and/or CP cases. Furthermore, most reports present a greater number of cases in men than in women, and only one study carried out in Finland during 1998 to 2011 reported a greater number of cases in women than in men (Table 4).
Estimates of CL/P Frequency Distribution by Country and European Region.
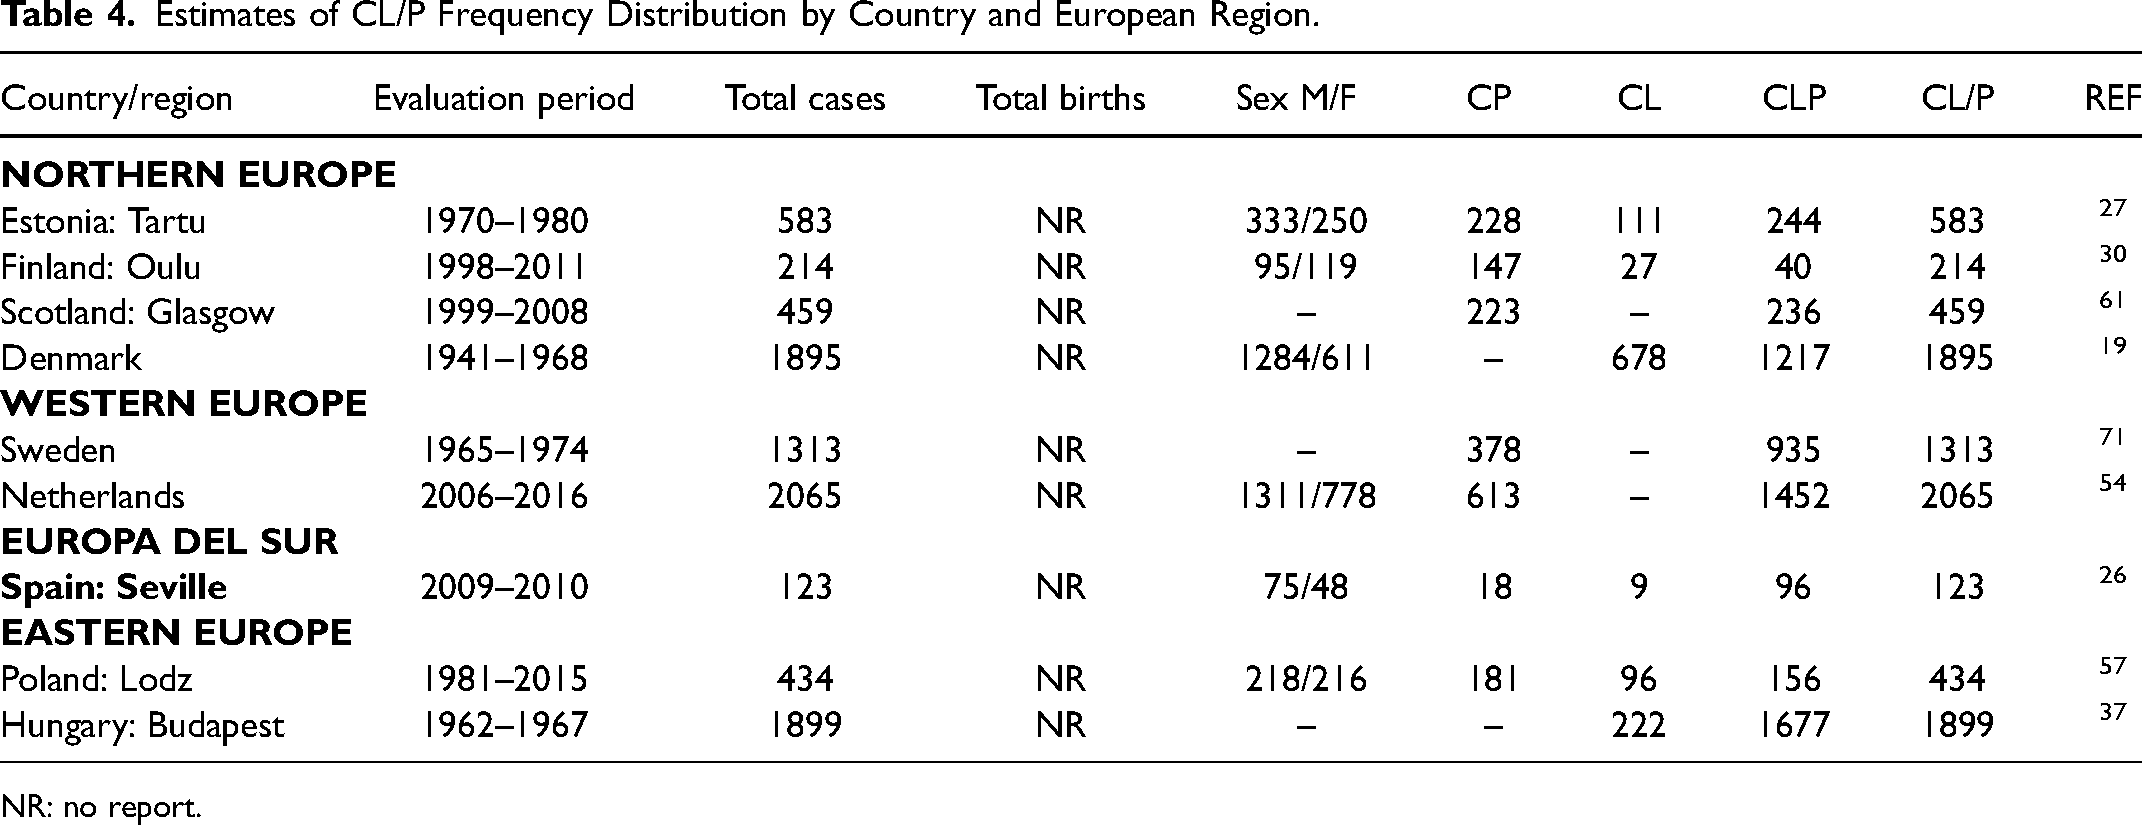
NR: no report.
Discussion
Our scoping review collected the information available in the main academic literature databases regarding the prevalence and incidence of CL/P in the different regions of Europe. The analysis integrated epidemiological prevalence and incidence rates from 29 countries without time restriction, and the total estimate of CL/P could be determined in the vast majority. The number of prevalence studies reported in different European regions was higher than the number of incidence studies. Estimates varied depending on the period and region evaluated. For example, when a longer period and a larger area were evaluated, more reliable and precise data could be obtained regarding the situation of a country or region.
Although there is a similarity in the prevalence of CL between European regions, the data obtained from the meta-analysis of proportions suggest that the Western region has the highest estimate of 0.4/1000 births, followed by the North and East regions of 0.3/1000 births and, to a lesser extent, the South regions of 0.2/1000 births. According to our meta-analysis, studies of LC incidence in Western Europe present the highest rate with 0.5/1000 total births, except for the Northern, Southern, and Eastern regions, which report equal but lower estimates, with 0.3/1000 total births.
The prevalence of CP suggests higher estimates in the Northern and Eastern regions with 0.6/1000 total births, whereas the Southern region has the lowest rate with 0.4/1000 total births, reporting the lowest number of studies with only 3 countries. Only 2 incidence and 6 prevalence studies were found in the Southern region, reporting the lowest number of epidemiological records at present, despite describing CP incidence estimates between regions. Our meta-analysis suggests that the two indicators evaluated for CLP vary depending on the European region analyzed. For example, the higher prevalence of CLP in the North and West (0.8/1000 total births), followed by the Southern and Eastern regions (0.5/1000 total births), may suggest patterns that may be related to risk factors specific to each region.
The results of our review suggest a total prevalence estimate of 1.1/1000 and an incidence of 0.9/1000 in Europe, which is higher than that reported by the IPTDOC GROUP in 2011 in the regions of Europe (0. 81/1000). Furthermore, this scoping review reports information regarding the number of CL/P cases, distribution by sex (male or female), and other phenotypic subgroups taken into account in the study —specifically CL, CP, CLP, and CL/P. 7 It also provides relevant information for public health care and decision-making in each subregion. Our findings can be complementary to the information held in European registries such as EUROCAT (European Network of Population Registries for the Epidemiological Surveillance of Congenital Anomalies).5,69
The scoping review, however, showed an indiscriminate use of the epidemiological terms “incidence” and “prevalence” for CL/P, and this high level of heterogeneity limits comparison between the different indicators. Although some authors argue that the number of births with malformations is seen and best described as a degree of prevalence due to their prenatal development—that is, long before birth, other authors suggest that this corresponds to a new event. 8
Information records, integration of data, and evidence of craniofacial malformations should be promoted in healthcare worldwide. Estimates of prevalence and incidence of congenital malformations, including CL/P, provide information about the behavior of the disease in different populations. This allows for the impact and value of interventions to be assessed, in the same way they support the planning of the resources necessary for prevention and care. It has been reported that 30% to 40% of infant mortality in Europe is due to congenital malformations, which is why new strategies are required for adequate prevention or treatment of this group of diseases that involve constant epidemiological monitoring and standardization of concepts.70,73
Efforts were made to control heterogeneity in clinical aspects by stratifying meta-analyses according to cleft type, population characteristics such as geographic location, and methodological aspects, including study design and indicators used (prevalence, incidence). However, the statistical analysis results displayed significant heterogeneity in some cases, as shown in the forest plot graphs (Supplementary File: Figures S2–S9), which may constitute a limitation of the study.
This heterogeneity may stem from factors such as differences in the time periods analyzed across studies, varying risk factors, population characteristics, or country-specific local differences, including the approach or implementation of the information systems from which reported data are derived. These factors may result in under- or overestimation of cases. Nonetheless, the heterogeneity's impact in certain grouped results appears minimal, as reflected by the precision of the confidence intervals, supporting the consistency of the results.
Additionally, the publication bias analysis showed significant asymmetry across all condition subgroups (CL, CP, CLP, OFC) evaluated in both prevalence and incidence, according to Egger's test (p < 0.0001). The highest bias estimates were observed in the CL and CP analyses, while OFC showed the lowest. These results suggest the presence of publication bias, which could influence the accuracy of overall estimates. However, when considering region-specific analyses, results remained consistent, indicating that although publication bias is a limitation, it does not substantially compromise the overall interpretation of the findings.
This research was limited to the databases MEDLINE (via PubMed), Science Direct (via Elsevier), and Semantic Scholar and, therefore, it may not cover all studies, especially those published in local non-indexed journals. Most studies reported only the prevalence and incidence rate of some phenotypic subgroup of CL/P, and a few others provide complete information on estimates of all subgroups, despite the extensive search of literature on CL/P epidemiology in Europe. This limits the possibility of establishing an ideal report of all types of CL/P on the European continent. Furthermore, the results of the meta-analysis may be influenced by incomplete reporting of the different phenotypic subgroups, in addition to the lack of precision of the authors in the description of the data.
Conclusion
This scoping review provides a broad overview of the status of the prevalence and incidence of CL/P in Europe and its different regions. The values of the epidemiological indices described in this study should be considered with caution and can be used as a guide for the development of programs for promoting, preventing, and treating individuals with CL/P, as well as the comparison of data with local, national, and global mean values.
Supplemental Material
sj-docx-1-cpc-10.1177_10556656241304210 - Supplemental material for Prevalence and Incidence of Cleft Lip and/or Palate in Europe: A Scoping Review and Meta-Analysis
Supplemental material, sj-docx-1-cpc-10.1177_10556656241304210 for Prevalence and Incidence of Cleft Lip and/or Palate in Europe: A Scoping Review and Meta-Analysis by Andrés Cornelis Pérez-Hettinga, María Clara González-Carrera, Erick Alexander Duque-García, Ingrid Isabel Mora-Diaz, Herney Alonso Rengifo-Reina and David Díaz-Báez in The Cleft Palate Craniofacial Journal
Footnotes
Acknowledgments
The authors thank to Universidad El Bosque, for their contribution to facilitate the present investigation.
Declaration of Conflicting Interests
The authors declared no potential conflicts of interest with respect to the research, authorship, and/or publication of this article.
Ethics Approval
Since the current study is an integrative study of secondary sources, involving no primary data collection from human subjects, approval from the institutional ethics committee was not required. The data analyzed were obtained from publicly available and previously published studies.
Funding
The authors received no financial support for the research, authorship, and/or publication of this article.
Supplemental Material
Supplemental material for this article is available online.
References
Supplementary Material
Please find the following supplemental material available below.
For Open Access articles published under a Creative Commons License, all supplemental material carries the same license as the article it is associated with.
For non-Open Access articles published, all supplemental material carries a non-exclusive license, and permission requests for re-use of supplemental material or any part of supplemental material shall be sent directly to the copyright owner as specified in the copyright notice associated with the article.