
Abstract
Objective
To evaluate the respiratory muscle strength in patients with cleft lip and palate (CLP) and correlate with airway dimensions.
Design
Cross-sectional.
Setting
The study was conducted at a Sri Ramachandra Dental College and hospital in India.
Participants
Adult patients were divided into three groups with eleven participants in each group. Group 1 comprised patients with CLP who had undergone alveolar bone grafting (ABG) but without maxillary expansion. Group 2 comprised patients with CLP, who had undergone ABG and maxillary expansion. Group 3 patients formed the control group which comprised non-CLP, Class I skeletal base patients.
Main Outcome
Spirometric tests were performed, and maximal inspiratory pressure (MIP) and maximal expiratory pressure (MEP) were measured.
Results
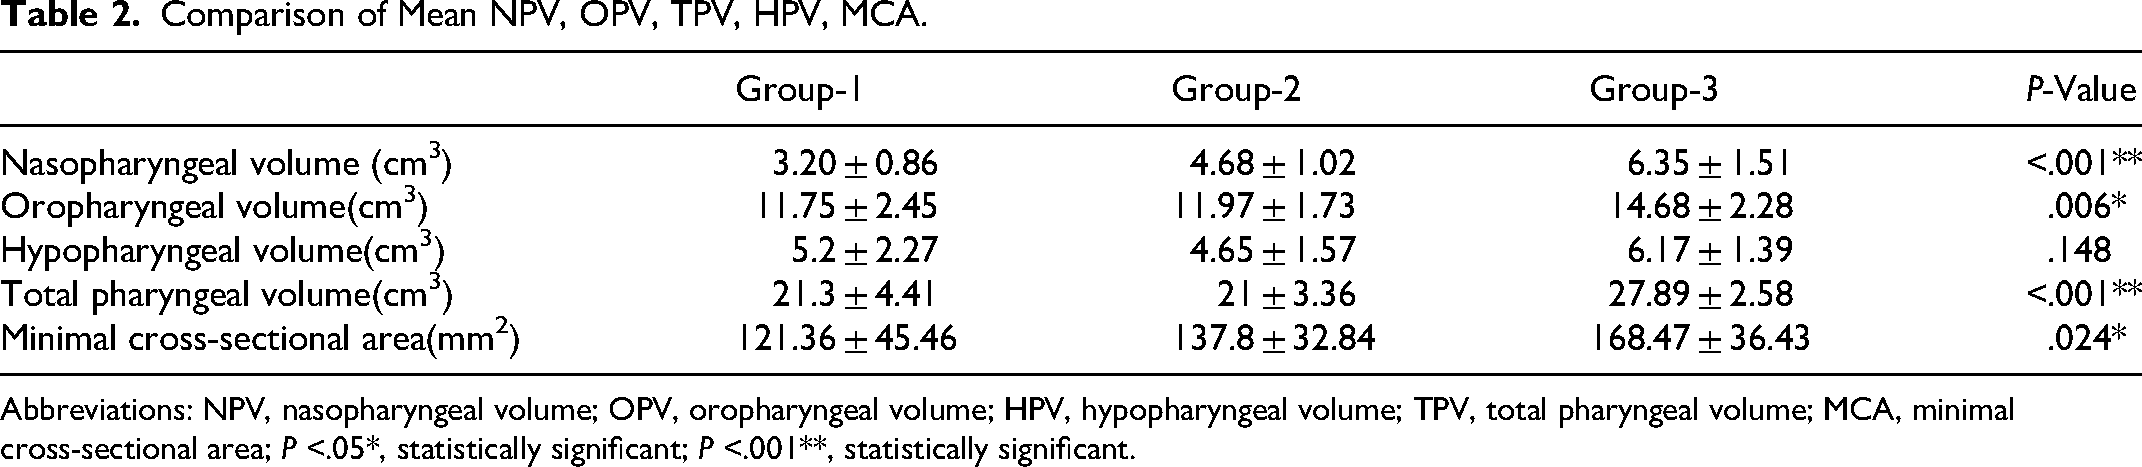
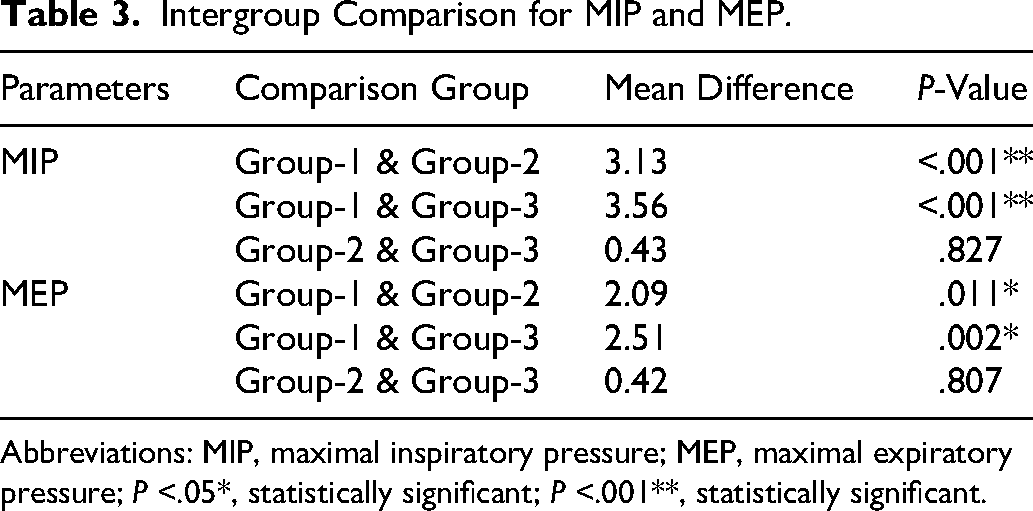
Mean MIP values for group 1, group 2, and group 3 were 2.5 ± 1.2 kPa, 5.6 ± 1.9 kPa, and 6.0 ± 1.9 kPa while MEP values were 4.1 ± 1.4 kPa, 6.2 ± 1.4 kPa, and 6.6 ± 1.9 kPa, respectively. Patients who had undergone ABG, but not maxillary expansion (Group 1) had statistically significant lesser MIP and MEP values (P <.001*). The mean peak expiratory flow and forced expiratory volume (FEV1) values were also decreased in group 1 but were not statistically significant (P >.05). Pharyngeal volume also decreased in patients with CLP. (P <.05). A positive, statistically significant correlation was found between nasopharyngeal volume (NPV) and MIP (R = 0.53) and NPV and MEP (R = 0.44) (P <.05*).
Conclusion
This research provides conclusive evidence that patients with CLP have respiratory muscle weakness. This may result in functional deficits. The interdisciplinary team should plan the treatment accordingly.
Keywords
Introduction:
Cleft lip and palate (CLP) is the most common congenital craniofacial malformation, with a prevalence of approximately 1 in 700 live births. 1 In addition to esthetic concerns, CLP is associated with significant functional impairments affecting speech, mastication, and respiration. Surgical repair, although essential, results in a scar formation and altered palatal muscle function, contributing to maxillary growth restriction and transverse maxillary deficiency (maxillary atresia).
Maxillary atresia is a common finding in patients with CLP and is characterized by a constricted maxillary arch and reduced nasal cavity width. This structural alteration may contribute to reduced upper airway dimensions and increased airway resistance. 2 In standard treatment protocols, maxillary expansion is typically performed prior to secondary alveolar bone grafting (ABG) to improve arch form and facilitate surgical outcomes. However, not all patients undergo comprehensive treatment, which may further impact airway morphology and function.
Airway function depends on both anatomical and physiological factors. A reduction in upper airway dimensions may increase airflow resistance, which can influence respiratory muscle performance.3,4 Respiratory muscle strength can be assessed using maximum inspiratory pressure (MIP) and maximum expiratory pressure (MEP), providing an indirect measure of ventilatory function. 5 Although MIP and MEP primarily reflect pulmonary muscle strength, they may be affected by increased airway resistance and altered airway patency.6,7
Previous studies have reported reduced pharyngeal airway volume in patients with CLP compared to non-cleft individuals,7,8 although conflicting findings have also been reported.9,10 Given the increased prevalence of airway-related problems and sleep-disordered breathing in this population, three-dimensional evaluation of the airway is clinically relevant. However, limited research has explored the relationship between airway dimensions and respiratory muscle strength in patients with CLP. 11
Therefore, the aim of this study is to evaluate respiratory muscle strength (MIP and MEP) in patients with CLP and to assess its relationship with upper airway dimensions using cone beam computed tomography (CBCT).
Materials and Methods
Study Design and Setting
This study complied with the Strengthening the Reporting of Observational Studies in Epidemiology standards 12 and was conducted at Sri Ramachandra Dental College and Hospital. The study was approved by the Institutional Review Board (CSP-III/24/SEP/11/413). Informed consent was obtained from all the participants.
Sample Size
The sample size was calculated based on data reported by Rangarajan H et al, 2024. 13 Assuming an effect size of 1, a significance level (α) of 0.05, and a statistical power (1-β) of 0.80, the required sample size was 33 participants in total, with 11 participants in each of the three groups.
Participants
Inclusion Criteria
Study Group
The study included participants aged between 17 and 35 years with a body mass index (BMI) < 35 kg/m2. This age range was selected to include skeletally mature individuals and to minimize the influence of active craniofacial growth on airway dimensions and respiratory parameters.
Study group 1 comprised patients with non-syndromic CLP who had undergone ABG without maxillary expansion, whereas study group 2 comprised patients with non-syndromic CLP who had undergone ABG and maxillary expansion. Maxillary expansion was included as a variable to evaluate its potential influence on airway dimensions and respiratory function. The expansion protocol used was tooth-borne rapid maxillary expansion.
Control Group
Group 3 was the control group which comprised patients without CLP (non-cleft) with class I skeletal pattern. (ANB between 2°and 4°).
Exclusion Criteria
Patients with respiratory function disorders, allergies, muscular dystrophy, or any muscle degenerative diseases were excluded from the study. Patients who had undergone orthodontic treatment involving growth modification (such as functional appliances or orthopedic interventions), orthognathic surgery, or fixed appliance therapy were also excluded. Growth modification was defined as any orthopedic intervention aimed at altering skeletal growth. Maxillary expansion was not considered under this exclusion criterion, as it was specifically evaluated as a study variable.
Sleep Assessment (STOP BANG Questionnaire)
The STOP BANG questionnaire was administered to all participants to assess the risk of obstructive sleep apnea. The questionnaire includes eight components (snoring, tiredness, observed apnea, high blood pressure, BMI, age, neck circumference, and gender), with higher scores indicating a greater risk of sleep-disordered breathing.
Measurement of Respiratory Muscle Strength and Peak Expiratory Flow
A pulmonary function test system (Medical equipment Europe, Germany) was utilized. An integrated electronic pressure sensor that produced graphical representations was connected to a computer. The participants were instructed to sit upright, with their feet flat on the floor and their upper body at a 90° angle to their hips. A customized mouthpiece was used based on the patient's height, and a nose clip was used. Prior to conducting a maximal inhalation from residual volume, patients were encouraged to take several normal breaths to measure MIP. They performed a maximal exhale starting from total lung capacity to quantify MEP. Each maneuver was done three times, with a 1-minute pause in between each attempt. Each effort was sustained for 2 seconds. The maximum reported statistics were the focus of the data analysis. Furthermore, peak expiratory flow rate (PEF) and forced expiratory volume in one second (FEV1) were measured as part of routine spirometry to evaluate lung function (Figure 1a).
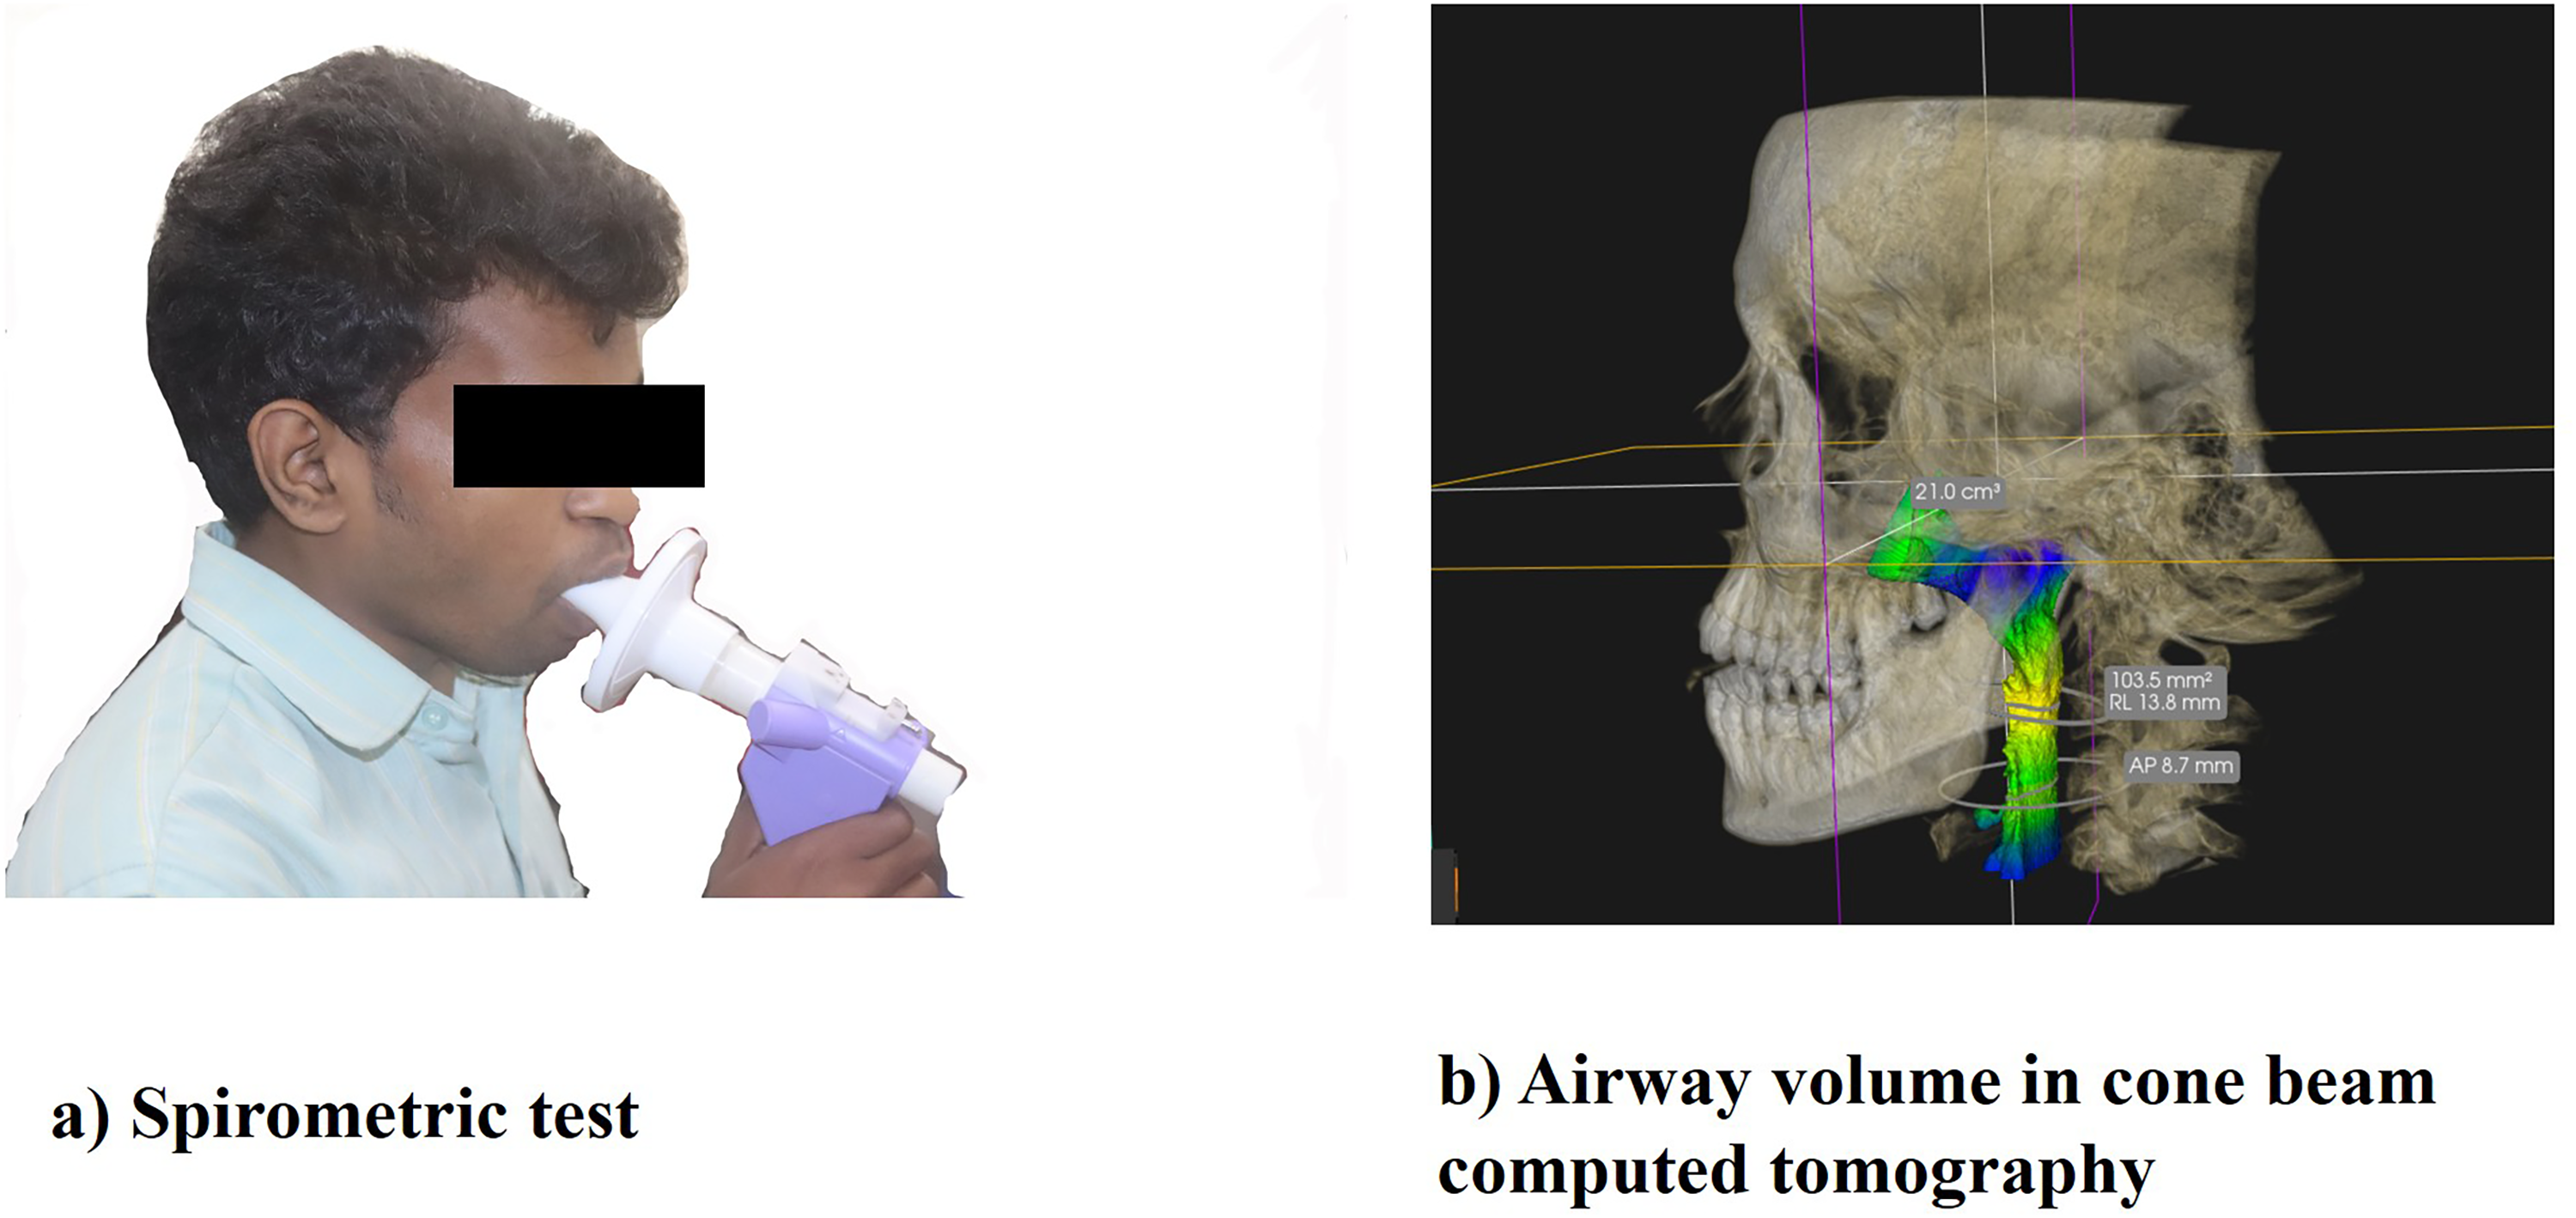
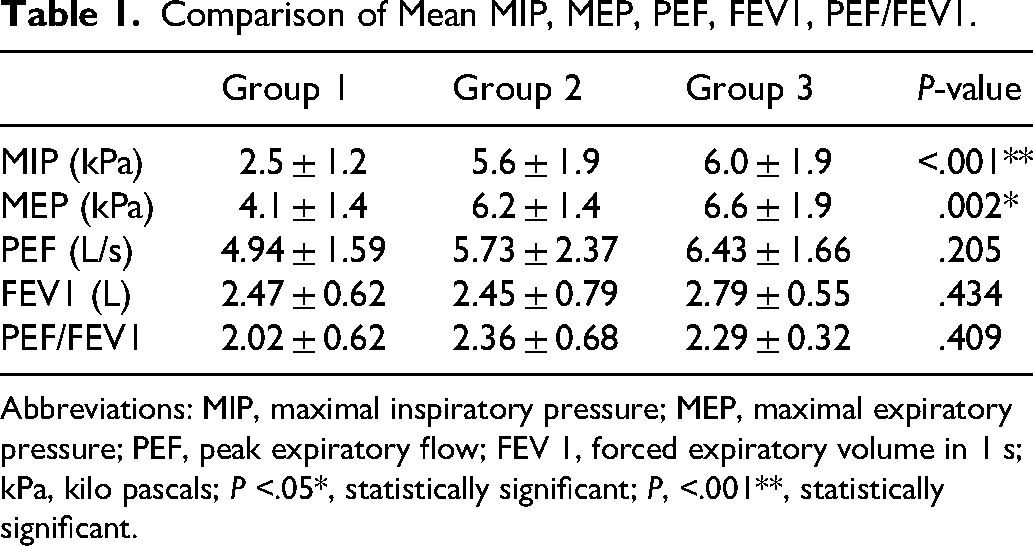
(a) Spirometric test; (b) airway volume.
Evaluation of Airway Dimension
CBCT scans (Carestream Dental CS 9600, Carestream Health, Atlanta, Georgia, USA) were performed with the orbital plane parallel to the ground. The patients were instructed to keep their lips naturally closed, tongue in contact with their palate, and to refrain from swallowing during the scan. At the conclusion of the exhale, the scan was performed. DICOM files were imported into the Carestream software (Carestream Health, Atlanta, Georgia, USA). Airway measurements were obtained after the image was aligned and threshold selection was completed. This was done using the airway analysis tool of the software. Following the selection of the area of interest, the airway's margins were automatically detected in three dimensions. The limits were established in accordance with a previous study. 14 The following parameters were measured: minimal cross-sectional area (MCA) at the oropharyngeal level (mm2), nasopharyngeal volume (NPV), oropharyngeal volume (OPV), hypopharyngeal volume (HPV), and total pharyngeal volume (TPV). (Figure 1b). The MCA was assessed at the oropharyngeal level, as this region is commonly associated with airway constriction.15,16
Statistical Analysis
IBM SPSS Statistics software Version 26 (IBM Corp., Armonk, NY, USA) was used to perform the statistics. One-way analysis of variance was done to detect the differences between the three groups. Post hoc Tukey test was utilized to make pairwise comparisons. Pearson correlation was used to correlate MIP, MEP, PEF, FEV1, PEF/FEV1 with pharyngeal volume and MCA.
Results
Patients in group 1 had a mean age of 21.9 ± 4.22 years with a BMI of 18.6 ± 2.50 Kg/m2, with a STOP Bang score of 3.78 ± 0.5. Patients in group 2 had a mean age of 19.1 ± 1.64 years, with a BMI of 21.3 ± 4.56 Kg/m2, with STOP Bang score of 2.65 ± 0.4. Patients in group 3 had a mean age of 25.5 ± 1.71 years with a BMI of 24.03 ± 3.31 Kg/m2, with a STOP Bang score of 0.78 ± 0.3.
Respiratory Function
Mean MIP values were lowest in Group 1 (2.5 ± 1.2 kPa), followed by Group 2 (5.6 ± 1.9 kPa) and Group 3 (6.0 ± 1.9 kPa), with statistically significant differences among groups (P < .001) (Table 1). Similarly, MEP values were significantly lower in Group 1 (4.1 ± 1.4 kPa) compared to Group 2 (6.2 ± 1.4 kPa) and Group 3 (6.6 ± 1.9 kPa) (P = .002) (Table 1).
Comparison of Mean MIP, MEP, PEF, FEV1, PEF/FEV1.
Abbreviations: MIP, maximal inspiratory pressure; MEP, maximal expiratory pressure; PEF, peak expiratory flow; FEV 1, forced expiratory volume in 1 s; kPa, kilo pascals; P <.05*, statistically significant; P, <.001**, statistically significant.
PEF and FEV1 values were lower in Groups 1 and 2 compared to Group 3; however, these differences were not statistically significant (P = .205 and P = .434, respectively). The PEF/FEV1 ratio also showed no significant difference among groups (P = .409) (Table 1).
Airway Dimensions
NPV, OPV, and TPV were significantly reduced in Groups 1 and 2 compared to Group 3 (P < .001, P = .006, and P < .001, respectively) (Table 2).
Comparison of Mean NPV, OPV, TPV, HPV, MCA.
Abbreviations: NPV, nasopharyngeal volume; OPV, oropharyngeal volume; HPV, hypopharyngeal volume; TPV, total pharyngeal volume; MCA, minimal cross-sectional area; P <.05*, statistically significant; P <.001**, statistically significant.
HPV was lower in Groups 1 and 2 compared to Group 3; however, the difference was not statistically significant (P = .148) (Table 2). MCA was also significantly lower in Group 1 compared to Group 3 (P = .020) (Table 2).
Intergroup Comparison
Pairwise comparisons demonstrated that Group 1 had significantly lower MIP and MEP values compared to both Group 2 and Group 3 (P < .05). No significant difference was observed between Groups 2 and 3 (Table 3).
Intergroup Comparison for MIP and MEP.
Abbreviations: MIP, maximal inspiratory pressure; MEP, maximal expiratory pressure; P <.05*, statistically significant; P <.001**, statistically significant.
For airway dimensions, both Groups 1 and 2 showed significantly lower NPV, OPV, and TPV compared to Group 3. However, differences between Groups 1 and 2 were not statistically significant for most parameters (Table 4).
Intergroup Comparison for NPV, OPV, TPV, MCA.
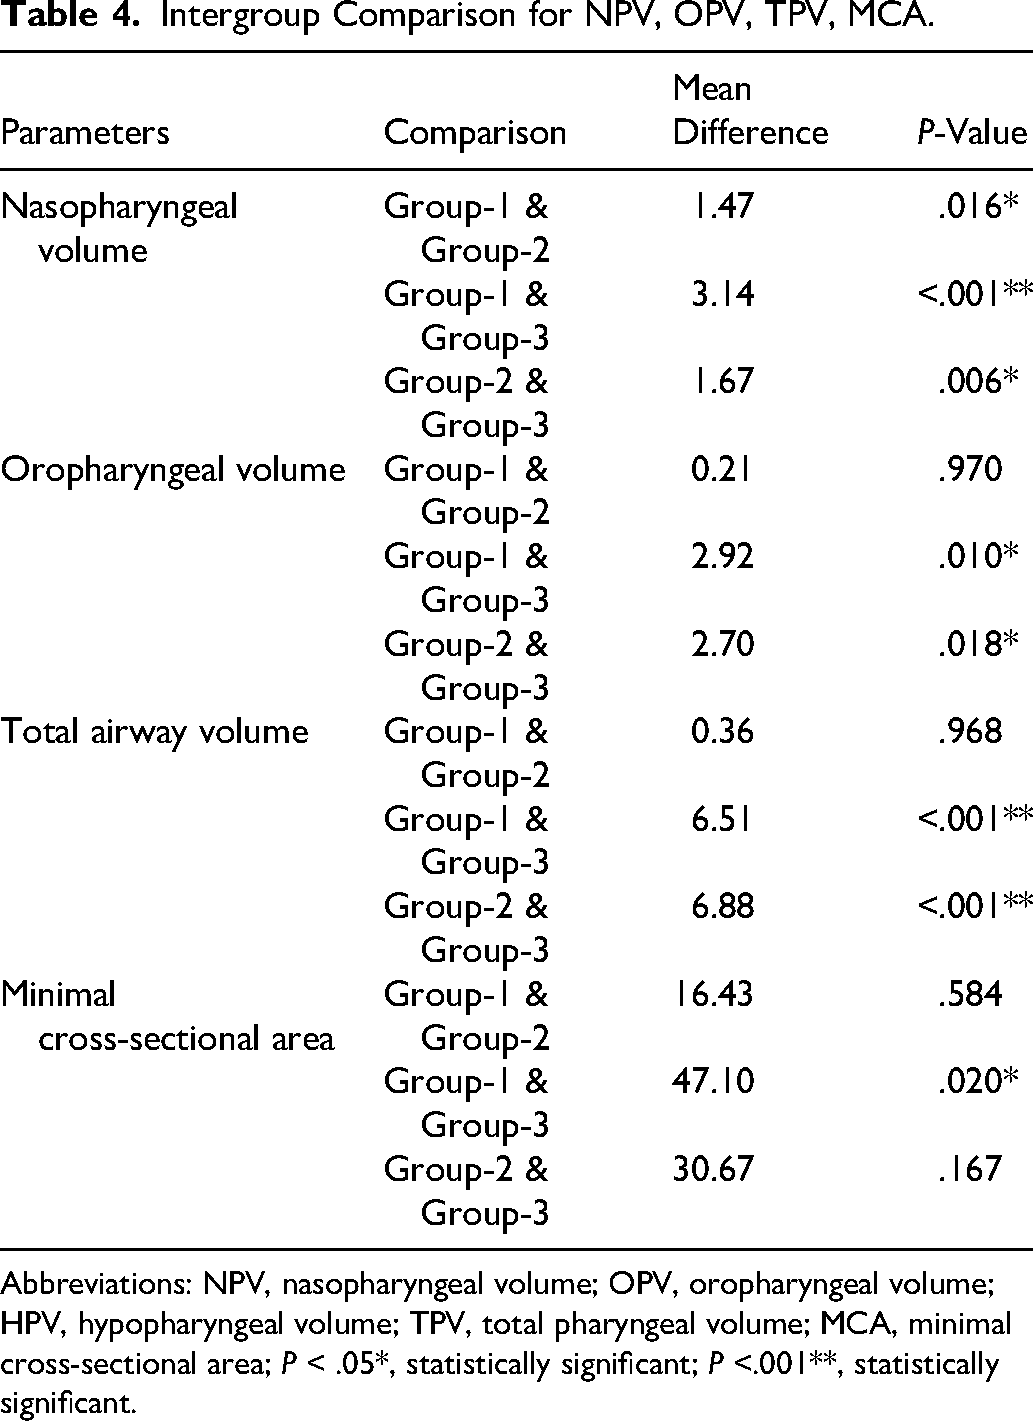
Abbreviations: NPV, nasopharyngeal volume; OPV, oropharyngeal volume; HPV, hypopharyngeal volume; TPV, total pharyngeal volume; MCA, minimal cross-sectional area; P < .05*, statistically significant; P <.001**, statistically significant.
Correlation Between Respiratory Function and Airway Dimensions
A moderate positive correlation was observed between NPV and MIP (r = 0.526, P = .002) and MEP (r = 0.444, P = .009). Weak positive correlations were observed between OPV, TPV, MCA, and respiratory parameters (MIP and MEP).
Discussion
In patients with craniofacial anomalies such as CLP, respiratory impairment is multifactorial in origin. Structural abnormalities of the maxilla and soft palate musculature, along with the effects of surgical repair, may contribute to compromised airway patency. Procedures such as palatoplasty and velopharyngeal insufficiency (VPI) correction can result in scar formation and narrowing of the airway at various levels, including the nasal cavity, nasopharynx, and oropharynx. 17 It is also important to consider the potential influence of VPI surgery on airway patency. 18 One of the main complications while treating VPI by pharyngeal flaps is the reduction of the cross-sectional area of the airway. 17 In the present study, all 22 patients of groups 1 and 2 had undergone VPI surgery, which may have contributed to airway narrowing and represents a potential confounding factor.
Maxillary atresia, a common feature in patients with CLP, results in transverse maxillary constriction and reduced nasal cavity dimensions, which may contribute to decreased upper airway volume and increased airway resistance. Previous studies have reported reduced airway dimensions in patients with CLP.7-9 However, findings are not entirely consistent across the literature. The present study extends these observations by evaluating both airway dimensions and respiratory muscle function.
MIP and MEP values were significantly reduced in patients with CLP compared to non-cleft controls, indicating compromised respiratory muscle performance. This reduction may be indirectly related to increased airway resistance and altered breathing patterns, such as mouth breathing, which is commonly observed in this population.19,20 In addition, the higher prevalence of sleep-related breathing disorders in patients with CLP may further contribute to reduced ventilatory efficiency. 21
The comparison between patients who underwent maxillary expansion and those who did not provides additional insight about the procedure. Patients who had undergone expansion demonstrated relatively improved MIP and MEP values, suggesting that increasing transverse maxillary dimensions may enhance airway patency and reduce airflow resistance. These findings are consistent with previous studies reporting improvements in respiratory parameters following rapid maxillary expansion, including miniscrew-assisted rapid palatal expansion.22,23 However, this relationship should be interpreted as associative rather than causal.
With respect to airway dimensions, nasopharyngeal, oropharyngeal, and TPVs, as well as MCA, were significantly reduced in patients with CLP compared to controls. These findings support the hypothesis that structural craniofacial alterations, including maxillary deficiency and altered hyoid bone position, may contribute to reduced airway space.24,25 One limitation of the present study is that the MCA was assessed only at the oropharyngeal level. Although this region is commonly associated with airway constriction, the narrowest segment of the airway may occur at other levels, such as the hypopharynx. Therefore, the present findings may not fully represent the site of maximum airway restriction. Future studies evaluating the entire pharyngeal airway may provide a more comprehensive understanding of airway dynamics in patients with CLP.
Conclusion
Respiratory muscle strength (as MIP and MEP) decreased in patients with CLP.
NPV, OPV, TPV, and MCA were decreased in patients with CLP.
Respiratory muscle weakening is evident in patients with CLP, which might lead to functional impairments. The interdisciplinary team should be aware of this while diagnosing the patient and plan the treatment accordingly.
Footnotes
Acknowledgement:
We authors gratefully acknowledge
Ethical Statement
The study was approved by the Institutional Review Board (Proposal No: CSP-III/24/SEP/11/413). Informed consent was obtained from all the participants.
Author Contributions
NSV contributed to conception, design, acquisition, analysis, interpretation, drafted the manuscript, critically revised the manuscript, gave final approval, and agreed to be accountable for all aspects of work ensuring integrity and accuracy. IIA contributed to conception, design, interpretation, drafted and critically revised the manuscript, drafted the manuscript, gave final approval, and agreed to be accountable for all aspects of work ensuring integrity and accuracy. VK contributed to the conception, design, analysis, interpretation, drafted and critically revised the manuscript, gave final approval, and agreed to be accountable for all aspects of work ensuring integrity and accuracy. CSS contributed to conception, design, acquisition, analysis, interpretation, drafted the manuscript, gave final approval, and agreed to be accountable for all aspects of work ensuring integrity and accuracy.
Funding
The authors received no financial support for the research, authorship, and/or publication of this article.
Declaration of Conflicting Interests
The authors declared no potential conflicts of interest with respect to the research, authorship, and/or publication of this article.