
Abstract
Objective
The purpose of this study was to examine the association between quality of life (QOL) as measured by the Velopharyngeal Insufficiency Effects on Life Outcomes-Parent Version (VELO-P), the intelligibility in context scale (ICS), percent consonants correct (PCC), nasalance scores, and ratings from the Cleft Audit Protocol for Speech-Augmented- Americleft Modification (CAPS-A-AM).
Design
Cross-sectional design.
Setting
Outpatient pediatric cleft-craniofacial clinic.
Participants
30 children, <8 years of age, diagnosed with cleft palate with or without cleft lip (CP ± L) and their parents.
Main Outcome Measure
The VELO-P was administered to 30 parents of children with CP ± L as part of their child's annual cleft team evaluation. The VELO-P was then correlated with the ICS, CAPS-A-AM ratings, PCC, and nasalance scores. Ratings were completed by 3 speech-language pathologists (SLPs). Reliability was completed by 2 SLPs. Linear regression identified predictors of the Emotional Impact domain of the VELO-P.
Results
The ICS had a strong correlation with the VELO-P total score (rs = 0.72, P < .001). As SLP ratings of speech acceptability decreased, there was an increase in the perceived QOL. The speech acceptability rating had a significant moderate correlation with the VELO-P total score (rs = -0.48, P = .01), Speech Limitations domain (rs = -0.46, P = .01), emotional impact (rs = -0.41, P = .03), and the Caregiver Impact domain (rs = -0.40, P = .04).
Conclusion
The correlations between VELO-P and ICS offer insight into how speech intelligibility impacts QOL, while the CAPS-A-AM ratings offer insight into the relationship between parent and SLP perceptions of speech. Future studies should expand samples and age ranges to further examine these correlations.
Introduction
Cleft palate with or without cleft lip (CP ± L) is a heterogeneous subcategory of craniofacial conditions that is caused by atypical embryological development due to genetic and/or environmental factors. 1 Cleft lip and palate occurs at a rate of 1 in 700 live births around the globe. 1 In the USA, surgical reconstruction of the palate is recommended to occur by 12 months of age. The goal of palate reconstruction is to restore normal anatomy and function for feeding and speech.2–4 Despite surgeons’ best efforts, children with a history of CP ± L may have residual speech sound disorders (SSD) and resonance difficulties. These resultant issues can negatively impact not only the quality of life (QOL) of the child with CP ± L, but also that of his/ her parents.5,6
The World Health Organization's International Classification of Functioning, Disability, and Health-Child and Youth version (ICF-CY) 7 is a framework that can be used to describe how well a child is able to participate within his/her environment. 7 This model includes components that capture how a child interfaces with his/her family particularly as it pertains to decision making and implementation of interventions. 7 This is particularly relevant to children with CP ± L and their families as prior to 18 years of age parents/ guardians function as the decision-makers for interventions and treatments. In the case of children with CP + L, a decision for intervention both of a therapeutic and surgical nature is preceded by a comprehensive speech and resonance evaluation that determines the status of the velopharyngeal insufficiency (VPI). This introduction explores how the components of a comprehensive speech and resonance evaluation can be used to predict the QOL experienced by children with CP ± L and their families.
Quality of Life
QOL refers to the sense of well-being that either a population or an individual experiences relative to both the positive and negative aspects of his or her life. 8 QOL also encompasses how well an individual's environment supports his or her ability to achieve goals, standards, address concerns, and provide hope. 9 Several studies have explored the impact of CP ± L on children and families; this article focuses specifically on how speech, VPI, and resonance affect children with CP ± L, influence family dynamics, and influence social-emotional well-being. This is being framed through the parts of a comprehensive speech and resonance evaluation for children with CP + L.
Speech Sound Disorders and Quality of Life
Children with a history of CP ± L present with a higher incidence of speech errors than their age-matched peers. 10 Non-oral compensatory articulations are typically associated with children with CP ± L and consist of glottal stops, pharyngeal fricatives, and nasal fricatives. These errors are typically associated with later palate repairs and the presence of resonance disorders. 11 Despite children with a history of CP ± L being predisposed to habituating the production of non-oral compensatory articulations, recent literature indicates that the most common errors are phonological errors, followed by anterior oral consonants, and then non-oral compensatory articulations. 12 This finding was also apparent in the study conducted by Baillie and Sell (2020), 13 who found that 57% of their participants utilized the phonological process of backing. Research has indicated that SSD can negatively impact the QOL experienced by children without a history of CP ± L and their families. Pedersen et al (2021) 14 studied how ratings of QOL of children with CP ± L and their parents aligned with those of speech-language pathologists (SLPs). The research team utilized SLP ratings from the Pittsburgh Weighted Scales to assess the speech and resonance of children with CP ± L. Results of the study indicated that parents of children with CP ± L and more severe SSDs reported lower QOL than those whose children had milder or no SSDs. 14
The findings from Pedersen et al (2021) 14 are in alignment with those of Simoni et al (2019) 15 who found that SSDs can have a negative impact on the interpersonal relationships and emotional state of children which can be apparent in their performance at school. Feelings of shyness, frustration, and isolation are also likely to manifest when children with SSDs experience new/ unfamiliar environments where their communication can impact their overall social interactions. Caregivers may also experience negative feelings due to their child's SSD. McCormack et al (2010) 16 interviewed 13 children with SSD and their caregivers to determine how SSD impacts the QOL of the children and their family. Results from the qualitative analysis indicated that preschool-aged children may not be able to truly reflect upon how their SSD impacts them nor their caregivers. In contrast, the caregivers reported frustration with not being able to understand their child and/or being expected to translate for the child. 16
In a broader context, the speech of children with CP ± L can be a source of distress. 17 Millard and Richman (2001) 18 found that children with a history of CP ± L were likely to report higher levels of anxiety and depression if their speech was impacted. Additionally, the more disordered the child's speech, the more likely they were to report a negative self-concept. These findings were similar to those of Wong Riff et al (2017) 17 who interviewed school-age children with a history of CP ± L about their appearance, their health-related QOL, and their facial function. Results from the interviews indicated that children with CP ± L can become distressed due to their speech. This distress typically stems from nervousness about speaking, being asked to repeat themselves, and the fear of being teased; 17 thus, creating a decrease in the perception of overall QOL.
Velopharyngeal Insufficiency and Quality of Life
In addition to non-oral compensatory articulations being considered one of the hallmark features of the speech of children with CP ± L, so too is VPI. VPI refers to the inability of the palate to contact the posterior pharyngeal wall. This lack of contact creates a coupling of the oral and nasal cavities which leads to the perceptual phenomenon of hypernasality.3,19 Hypernasality is the excessive flow of air and sound energy through the nose.3,19 VPI can have a myriad of negative effects on the overall speech and intelligibility of children with CP ± L. The literature has indicated that persistent VPI can lead to habituation of non-oral compensatory articulations.11,12,20 In addition to the production of non-oral compensatory articulations and the perception of hypernasality during speech, VPI can also lead to mixed resonance, cul-de-sac resonance, audible nasal air emission, and nasal turbulence. 21 While the gold standard for determining the severity of hypernasality is the ear of a trained SLP, nasometry is often included as an objective measure. This information is typically used to measure pre- and post-operative changes in the resonance of an individual undergoing surgical management for speech. 22 Additionally, SLPs on a cleft palate craniofacial team may also use nasometry to further enhance their subjective judgements of resonance during speech evaluations. 23
VPI can decrease the overall intelligibility and acceptability of the speech of children with CP ± L. 6 Barr et al (2007) 5 undertook a study to determine the overall impact of VPI on the QOL of children with VPI and their parents. Results from the study indicated that children with a history of VPI and their parents experience a more negative QOL in terms of speech limitations, swallowing problems, emotional impact, activity limitations, and perception by others in comparison with their non-affected peers. The researchers noted that the speech limitations domain was the most impacted. 5 This was also discussed by Bruneel et al (2019) 6 who attributed this to speech limitations encapsulating not only VPI but the resultant non-oral compensatory articulations and other manifestations of SSDs.
The perception of hypernasality during speech can also negatively impact the ability of a child with CP ± L to engage with his or her peers. Watterson et al (2013) 24 studied how same-aged peers of children with CP ± L perceived hypernasality. Results from the study indicated that when non-cleft peers perceived hypernasality, it created a negative social reaction. Participants in the study reported that the perception of hypernasality during speech would lead to teasing and overall decrease the child with hypernasality's ability to participate in peer interactions.17,24
Psychosocial Impact of Cleft Palate with or without Cleft Lip on Families
Bickham et al (2017) 25 sought to determine the relationship between speech intelligibility and QOL in children with CP ± L. The research team found that the severity ratings of the patients and their families did not align with those of the SLP. However, the ratings of the patients with CP ± L did align with those of the parents. Specifically, patients with CP ± L who presented with more severe ratings in terms of intelligibility and acceptability were likely to have a lower QOL in terms of feelings of anger, depression, and overall relationships with peers. The parents of these children were also likely to report feelings of anxiety, depression, and overall impaired relationships with peers. 25 Aslan et al (2018) 9 administered the Family Assessment Scale to parents of children with CP ± L and to parents of children who were deemed “normal.” Results indicated that parents of children with CP ± L were likely to experience a lower QOL in terms of psychological functioning, physical well-being, and social interactions. 9 The research team posited that this was due to the number of surgical interventions, medical appointments, and other psychosocial aspects involved in the care and management of children with CP ± L.
Assessing Quality of Life in Children with Cleft Palate with or without Cleft Lip and Their Parents
To assess the impact of VPI on children with CP ± L, Skirko et al (2013) 26 created the Velopharyngeal Insufficiency Effects on Life Outcomes-Parent Version (VELO-P) and the Velopharyngeal Insufficiency Effects on Life Outcomes-Youth Version (VELO-Y). These valid and reliable tools were developed as a patient-reported instrument to capture the impact of VPI and commensurate difficulties on the QOL of children with CP ± L and their parents. 26 Both the VELO-P 26 and the VELO-Y 26 were designed to be administered pre- and post-operatively for children with CP ± L undergoing surgical management for their speech. 27 The VELO-P 26 assesses QOL across 26 items and 6 domains, whereas the VELO-Y 26 assesses QOL across 23 items and 5 domains. The domains shared between the VELO-P and the VELO-Y 26 are Speech Limitations, Swallowing Problems, Situational Difficulty, Perception by Others, and Emotional Impact. The VELO-P 26 has an additional domain entitled Caregiver Impact. The VELO-Y 26 has only been validated for children who are at least 8 years of age. 26 When interpreting the results of the VELO-P, 26 it is important to note that the severity of the VPI was not a significant correlation among all subjects. Specifically, the VELO-P 26 was associated with VPI severity in children under 8 years of age, but not among older children. This was attributed to the children having undergone management of their VPI and subsequently having improved resonance which was reflected in the VELO-P scores.26,27
To assess overall intelligibility of children with SSDs, parents can complete the intelligibility in context scale (ICS). 28 This valid and reliable measure consists of 7 questions that ask parents to rate their child's intelligibility across different social contexts. The ICS 28 is most appropriate for preschoolers ranging in age from 3 to 5 years old. 28 However, Soriano et al (2023) 29 found that the ICS 28 can also be reliably administered to children ranging from 2 years; 6 months of age through 9 years; 11 months of age. There have been some studies that have used the ICS 28 to better understand the intelligibility of children with CP ± L across different social situations. Seifert et al (2021) 30 found that children with a history of CP ± L were most likely to be understood by their family and other individuals with whom they engage with regularly. Alighieri et al (2025) 31 had similar findings with their study. A difference with their study though is that they wanted to determine how non-oral compensatory misarticulations influenced the child's score on the ICS. 28 Results from their study indicated that anterior oral errors were more likely to negatively impact the intelligibility of children with CP ± L. 31
Speech-Language Pathologist Ratings of Speech
For SLPs to be able to adequately rate the speech and resonance of children with CP ± L, a speech sample must be collected. Speech samples described in the literature typically consist of a conversational speech sample, counting from 1 to 20 and a sentence repetition task.32–34 Currently, the sentence imitation task is completed using the American English Sentence Sample (AESS). 35 If time permits and concerns arise, it is also appropriate to administer a single word articulation test such as the Goldman-Fristoe Test of Articulation-3rd Edition (GFTA-3). 36
Ratings from SLPs are essential in determining speech outcomes in addition to QOL measures such as the VELO-P. 26 The previously mentioned literature did not show strong correlations between the SLP ratings of speech and resonance and severity measures of QOL of children with CP ± L and their parents. Despite this, the role of the SLP in the identification and management of VPI in children with CP ± L is critical. 37 The gold standard for rating the overall speech of children with CP ± L is the Cleft Audit Protocol for Speech-Augmented-Americleft Modification (CAPS-A-AM). 34 The CAPS-A-AM 34 allows SLPs to rate the speech of children with CP ± L in the areas of speech acceptability, voice, hypernasality, hyponasality, and audible nasal emission and/or nasal turbulence. Speech acceptability is a measure that is meant to capture how much the child with CP ± L's speech calls attention to itself within a conversational speech sample. 33 Hyponasality references the lack of nasal resonance on nasal consonants (eg, /m/, /n/, and /ŋ/). Audible nasal emission and/or nasal turbulence are two different perceptual phenomena that can occur in the speech of children with CP ± L and are rated under the same parameter on the CAPS-A-AM. 34 Audible nasal emission refers to audible escape of air through the nose during the production of high-pressure consonants. Nasal turbulence refers to the “snorting sound” that can be heard when an individual produces a high-pressure consonant. Voice is another parameter on the CAPS-A-AM, 34 as children with VPI and a history of CP ± L can sometimes exhibit abnormal vocal quality. Voice is rated as “normal” or “unusual or abnormal voice quality.” These vocal differences may also impact QOL for a child with CP ± L. 5
Purpose and Significance of the Study
While different components of a child with CP ± L's speech may lead to perceived lower QOL, there is a paucity of literature describing which components of a speech and resonance evaluation may be diagnostic and/or predictive of QOL. As such, the purpose of this study is to examine the relationships between the VELO-P
26
and domain scores with results of the ICS,
28
SLP ratings on the CAPS-A-AM,
34
percent consonant correct (PCC),
38
and nasalance scores captured using the NasometerTM II.
39
By examining these relationships, we hope to better understand the interplay between different instrumental assessments and patient-reported outcomes used within a comprehensive speech and resonance evaluation to better diagnose and/or predict the impact of speech and resonance on the QOL of children with CP ± L. We hypothesize that there will be a positive correlation between the VELO-P
26
and its domains with the ICS
28
and PCC.
38
We hypothesize that there will be negative correlations between the VELO-P
26
and its domains with the SLP ratings on the CAPS-A-AM,
34
PCC,
38
and nasalance scores. Specifically, as decrease on the VELO-P
26
and its domains (worse QOL), we anticipate an increase in the ratings and scores gathered from the perceptual and instrumental assessments. We asked six research questions to explore these relationships:
What is the relationship between the VELO-P
26
total score and its domain scores with parent-reported intelligibility on the ICS
28
and PCC
38
? What is the relationship between the VELO-P
26
and its domain scores and ratings from the CAPS-A-AM
34
made by 3 SLPs? What is the relationship between ratings from the CAPS-A-AM
34
made by 3 SLPs and PCC
38
? Do nasalance scores as captured by the NasometerTM39 correlate with parent-reported intelligibility on the ICS
28
and the VELO-P
26
total?
We also asked two additional questions to further analyze the interplay between the VELO-P
26
domain scores and PCC,
38
SLP ratings on the CAPS-A-AM
34
and nasalance scores. These questions are as follows:
What is the relationship between ratings on the CAPS-A-AM,
34
PCC,
38
and the VELO-P
26
subdomains of Perception by Others and Emotional Impact? Do nasalance scores and ratings of audible nasal air emission and/or nasal turbulence predict VELO-P
26
subdomain scores for “perception by others” and “emotional impact” better than SLP-rated hypernasality?
Method
The study was funded by a grant from the NIDCR (DC943360412) and was approved by the Institutional Review Board at Arizona State University. Informed consent procedures were conducted with the parents as a part of a larger study prior to collecting the speech samples. Data for this study was collected during the Summer and Fall of 2020.
Participants
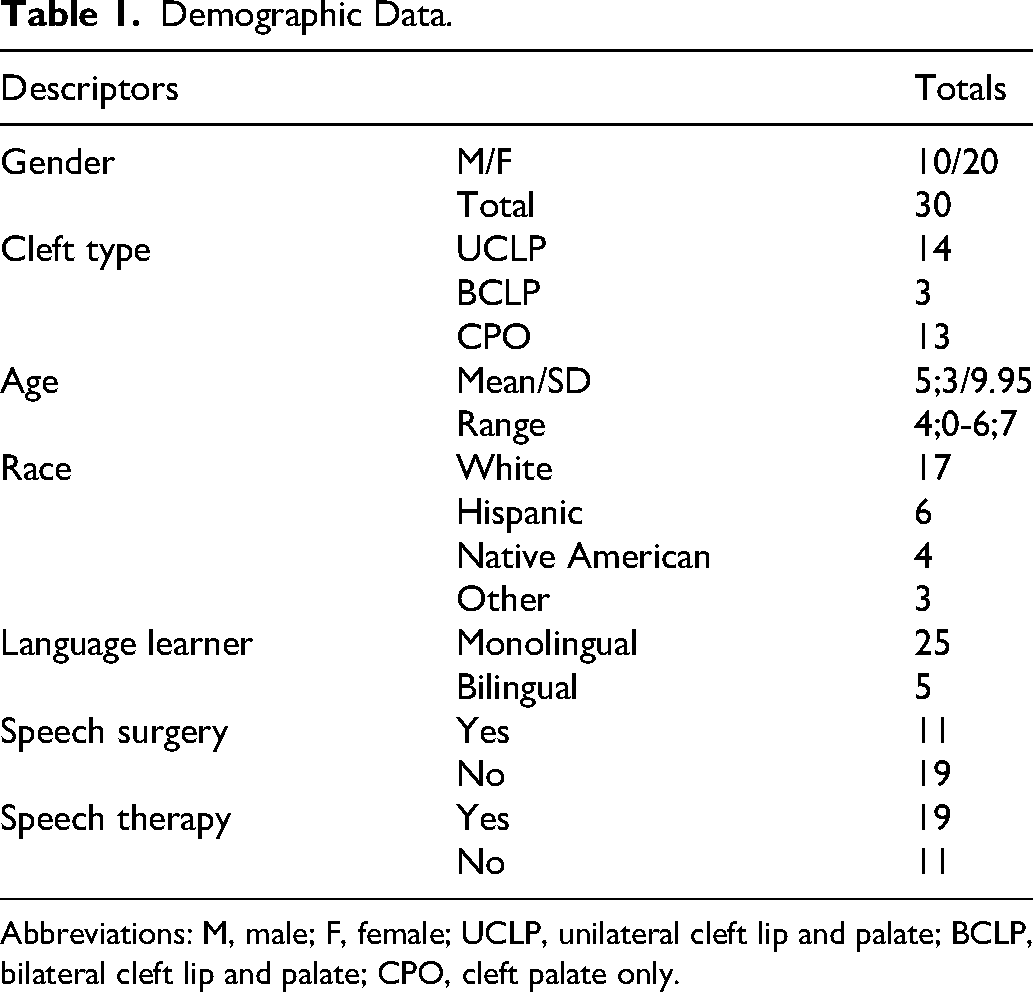
Thirty children with a history of repaired CP ± L and their parents were recruited from a large cleft-craniofacial center. All the children spoke English as their first language and ranged in age from 4 years old to 6 years; 7 months old (mean 5 years; 11 months of age). Twenty of our participants were female. The participants varied by cleft type including unilateral cleft lip and palate (UCLP; n = 14), bilateral cleft lip and palate (BCLP; n = 3), and cleft palate only (CPO; n = 13).
The participants for the study were selected based upon the following inclusionary/ exclusionary criteria for the children: (a) presence of a cleft palate with or without a cleft lip, (b) aged 4 years of age through 8 years of age, (c) spoke English as their primary language per parent report, and (d) did not have a genetic diagnosis. The inclusionary/ exclusionary criteria for the parents consisted of (a) over the age of 18, (b) able to provide consent for himself/ herself and his or her child, and (c) willing to complete the VELO-P 26 and the ICS (Table 1). 28
Data Collection
The following data was collected as part of each child's annual team evaluation: standardized speech sample, GFTA-3 36 from which PCC 38 was calculated, and nasalance scores from the NasometerTMII. 39 The following data was collected from the parents of the children during the annual team evaluation: VELO-P 26 and ICS. 28
Standardized Speech Sample. The standardized speech sample was collected according to the parameters set forth by Chapman et al (2016). 34 This consisted of a 2- to 3-min conversational speech sample, sentence imitation of the AESS, 35 counting from 1 to 20 and from 60 to 70. The speech samples were video recorded using a Zoom Q8 handy Video Recorder and an Audio-Technica Short-Shotgun Microphone on a boom stand within 6 inches of the child's mouth. 40
Speech Sound Production. Each participant was administered the GFTA-3. 36 The GFTA-3 36 is a norm-referenced, standardized assessment of articulation that can be administered to children as young as 2 years; 0 months of age through adults aged 21 years; 11 months of age. All participants were administered the Sounds-In-Words subtest of the GFTA-3. 36 This was scored according to published protocols. 36 This test was video and audio recorded.
PCC. PCC 38 was calculated from the Sounds-in-Words subtest of the GFTA-3. 36 Of note, PCC 38 was calculated using the metric set forth by Shriberg and Kwiatowski (1982). 38 Blends were counted as individual consonants, rather than as a single consonant. Additionally, consonants produced with the correct placement, manner, and voicing but with the perception of audible nasal air emission or nasal turbulence were counted as correct. This decision was made based upon the study conducted by Sell and Sweeney (2019). 41 The researchers noted that PCC 38 had initially been created as a severity measure used to capture pre- and post-speech therapy outcomes. 38 However, the authors argued that speech therapy will most likely not influence the perception of audible nasal air emission or nasal turbulence when the consonant in question is being produced with correct placement, manner, and voicing. 41
Nasometry. Nasometry is a computer-based instrument that is a non-invasive means for capturing information on the resonance of an individual. Nasometry was completed using the NasometerTM II 39 (6500). Nasalance scores were collected from the Picture-Cued Subtest. Nasalance scores are a ratio of the amount of acoustic energy contained in the nasal cavity relative to the amount of acoustic energy in the nasal and oral cavities. The Picture-Cued Subtest contains five passages that have phonetically homogenous sentences for bilabial plosives, alveolar plosives, velar plosives, sibilant fricatives, and nasal consonants. 22 Administration was conducted according to published protocols. 39
VELO-P. The VELO-P 26 is a 26-item questionnaire that focuses on assessing communication-related QOL from the perspective of parents of children with CP ± L. Parents are asked to respond to prompts based upon their experience from the last 4 weeks. The domains assessed are Speech Limitations, Swallowing Problems, Situational Difficulty, Emotional Impact, Perception by Others, and Caregiver Impact. Parents rate their responses using a 5-point Likert scale (0 = never, 1 = almost never, 2 = sometimes, 3 = often, 4 = always). Six subscores are generated, and these are used to calculate the VELO-P total score. These scores range from 0 to 100, where scores closer to 100 indicate a higher QOL. This was administered and scored according to published protocols.26,42
ICS. The ICS 28 is a 7-item questionnaire that the parents completed to describe the intelligibility of their children across different social settings. Parents were asked to respond to the prompts using the 5-point Likert scale (1 = never, 2 = rarely, 3 = sometimes, 4 = usually, 5 = always). Higher scores indicate better intelligibility across different social settings.
SLP Ratings. Ratings of the conversational speech sample and AESS 35 were completed by three SLPs using the CAPS-A-AM. 34 All three SLPs had been formally trained in the CAPS-A-AM 34 methodology and had more than 7 years of experience working with children with a history of CP ± L. All the SLPs completed the ratings independently.
Data Analysis
The data was uploaded to REDCap and a secure Dropbox for data analysis. All statistical analyses were performed using the IBM Statistical Package for Social Sciences (IBM SPSS) version 30.
Statistics
Descriptive statistics were calculated for all data. All data points were converted to z-scores prior to conducting correlations and linear regressions. Z-scores were utilized due to the data being compared consisting of ordinal data, criterion referenced data, normative data, and quantitative data. The associations between the VELO-P 26 and other assessments were analyzed using Spearman's rank-order correlation. This statistical measure was chosen due to the data being ordinal in nature and requiring a non-parametric approach. This measure is used when there is a need to determine the strength and direction of two variables. Linear regression was used to identify predictors from the CAPS-A-AM, PCC, ICS, and nasalance scores that should be included in the regression model for the Emotional Impact domain and the Perception by Others domain. Univariate analyses were performed, and only statistically significant factors associated with the domains were regressed onto the domains. For the Emotional Impact domain, the rating of speech acceptability, the rating of hyponasality, and ICS were significant predictors. There were no significant predictors for the Perception by Others domain.
Reliability
All three raters rated each speech sample (conversational speech and imitation of the AESS 35 ) for intra-rater reliability. Inter-rater reliability was calculated using Krippendorff's Alpha. Krippendorff's Alpha was chosen due to its ability to handle: (1) multiple raters, (2) data that is not mutually exclusive, and (3) missing data points. 43 A significant difference between Krippendorff's Alpha and other measurements of agreement is that it reports disagreement rather than agreement among raters. Values range from 0 to 1, where 0 indicates that there is perfect disagreement and 1 indicates that there is perfect agreement. The lowest acceptable value is ɑ≥0.667. 43 The three SLPs met as a group and came to consensus for the ratings in which there was no agreement between at least 2 of the SLPs. The final consensus ratings were used for analysis. Krippendorff's alpha was calculated for each of the parameters rated by the three SLPs using the K-Alpha Calculator, Krippendorff-alpha calculator. Please see Table 2 for more details.
Demographic Data.
Abbreviations: M, male; F, female; UCLP, unilateral cleft lip and palate; BCLP, bilateral cleft lip and palate; CPO, cleft palate only.
Reliability of the SLP Ratings of the CAPS-A-AM.
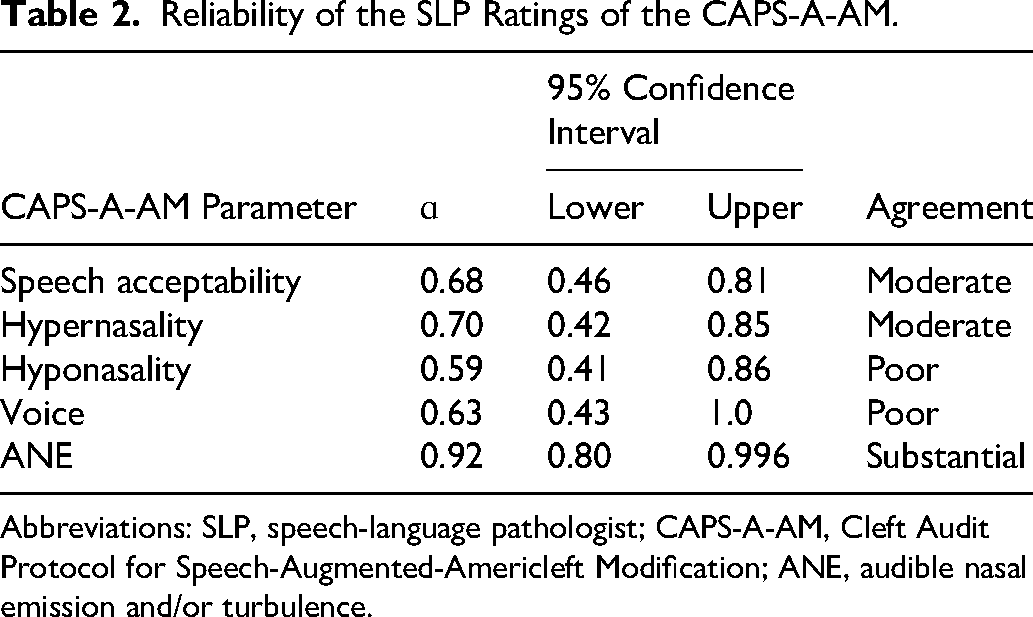
Abbreviations: SLP, speech-language pathologist; CAPS-A-AM, Cleft Audit Protocol for Speech-Augmented-Americleft Modification; ANE, audible nasal emission and/or turbulence.
Inter-rater reliability was established for the scoring of the GFTA-3 36 from which PCC 38 was calculated. Twenty percent (6/30) of the standardized assessments were rescored by two of the SLPs. The assessments chosen for reliability were selected using an online random number generator. Point-by-point agreement ranged from 81.1% to 99.89% between the raters.44,45
Results
Velopharyngeal Effects on Life Outcomes-Parent Version and Intelligibility in Context Scale
A Spearman's rank-order correlation was conducted to determine the relationship between the VELO-P 26 and the ICS. 28 There were positive correlations between the ICS 28 and the VELO-P total score (rs (29) = 0.72, P < .001), Speech Limitations domain (rs (29) = 0.71, P < .001), and the Situational Difficulty domain (rs (29) = 0.77, P < .001). There were positive correlations between the ICS 28 and the Emotional Impact domain (rs (29) = 0.55, P = .002) and the Caregiver Impact domain (rs (29) = 0.51, P = .005). Of note, parent ratings of intelligibility on the ICS 28 were predictive of the Speech Limitations domain of the VELO-P (β=0.66, t = 4.58, P < .001). Further information is available in Table 3.
VELO-P Correlations with the ICS and PCC.
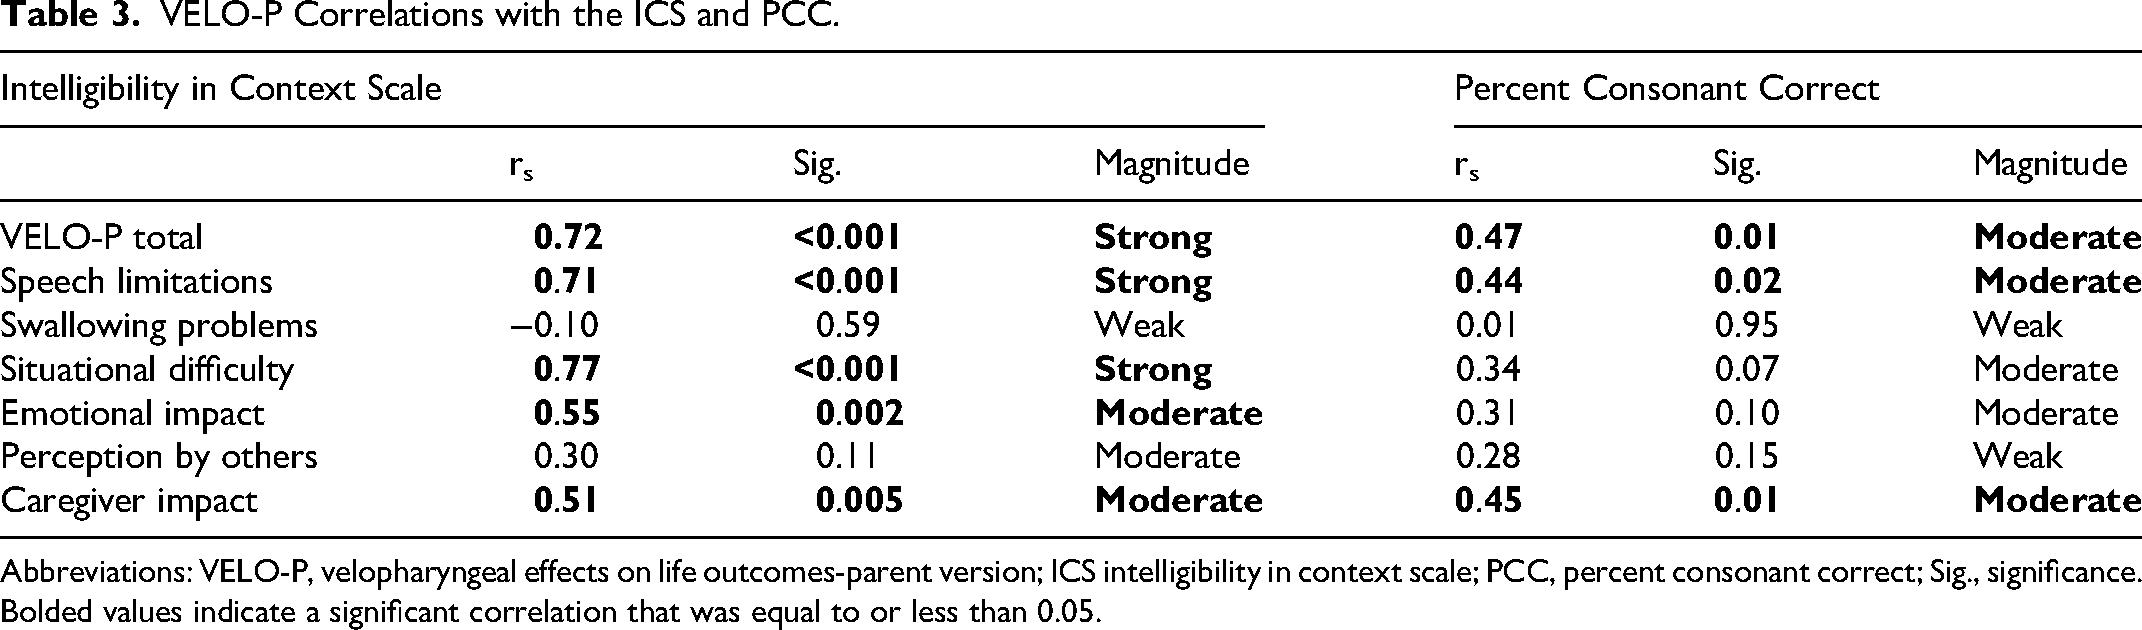
Abbreviations: VELO-P, velopharyngeal effects on life outcomes-parent version; ICS intelligibility in context scale; PCC, percent consonant correct; Sig., significance.
Bolded values indicate a significant correlation that was equal to or less than 0.05.
Velopharyngeal Effects on Life Outcomes-Parent Version and Percent Consonant Correct
A Spearman's rank-order correlation was conducted to determine the relationship between the VELO-P 26 and PCC. 38 There were positive correlations between PCC 38 and the VELO-P total score (rs (29) = 0.47, P = .01), Speech Limitations domain (rs (29) = 0.44, P = .02), and the Caregiver Impact domain (rs (29) = 0.45, P = .01). While not statistically significant, there were moderate positive correlations between PCC 38 and the Situational Difficulty domain (rs (29) = 0.34, P = .07), and the Emotional Impact domain (rs (29) = 0.31, P = .1). Further information is available in Table 2.
Velopharyngeal Effects on Life Outcomes-Parent Version and Cleft Audit Protocol for Speech-Augmented-Americleft Modification
Total Score
Spearman's rank-order correlation was conducted to analyze the association between the VELO-P 26 and the parameters rated on the CAPS-A-AM. 34 The VELO-P total score had a moderate negative correlation with the average rating of acceptability made by the 3 SLPs (rs(29)=-0.48, P = .01). There was also a moderate correlation between the VELO-P total score and the average rating of hyponasality made by the 3 SLPs (rs(29)=-0.41, P = .03). The full results are displayed in Table 4.
VELO-P Correlations with the CAPS-A-AM VELO-P Correlations with the ICS and PCC.
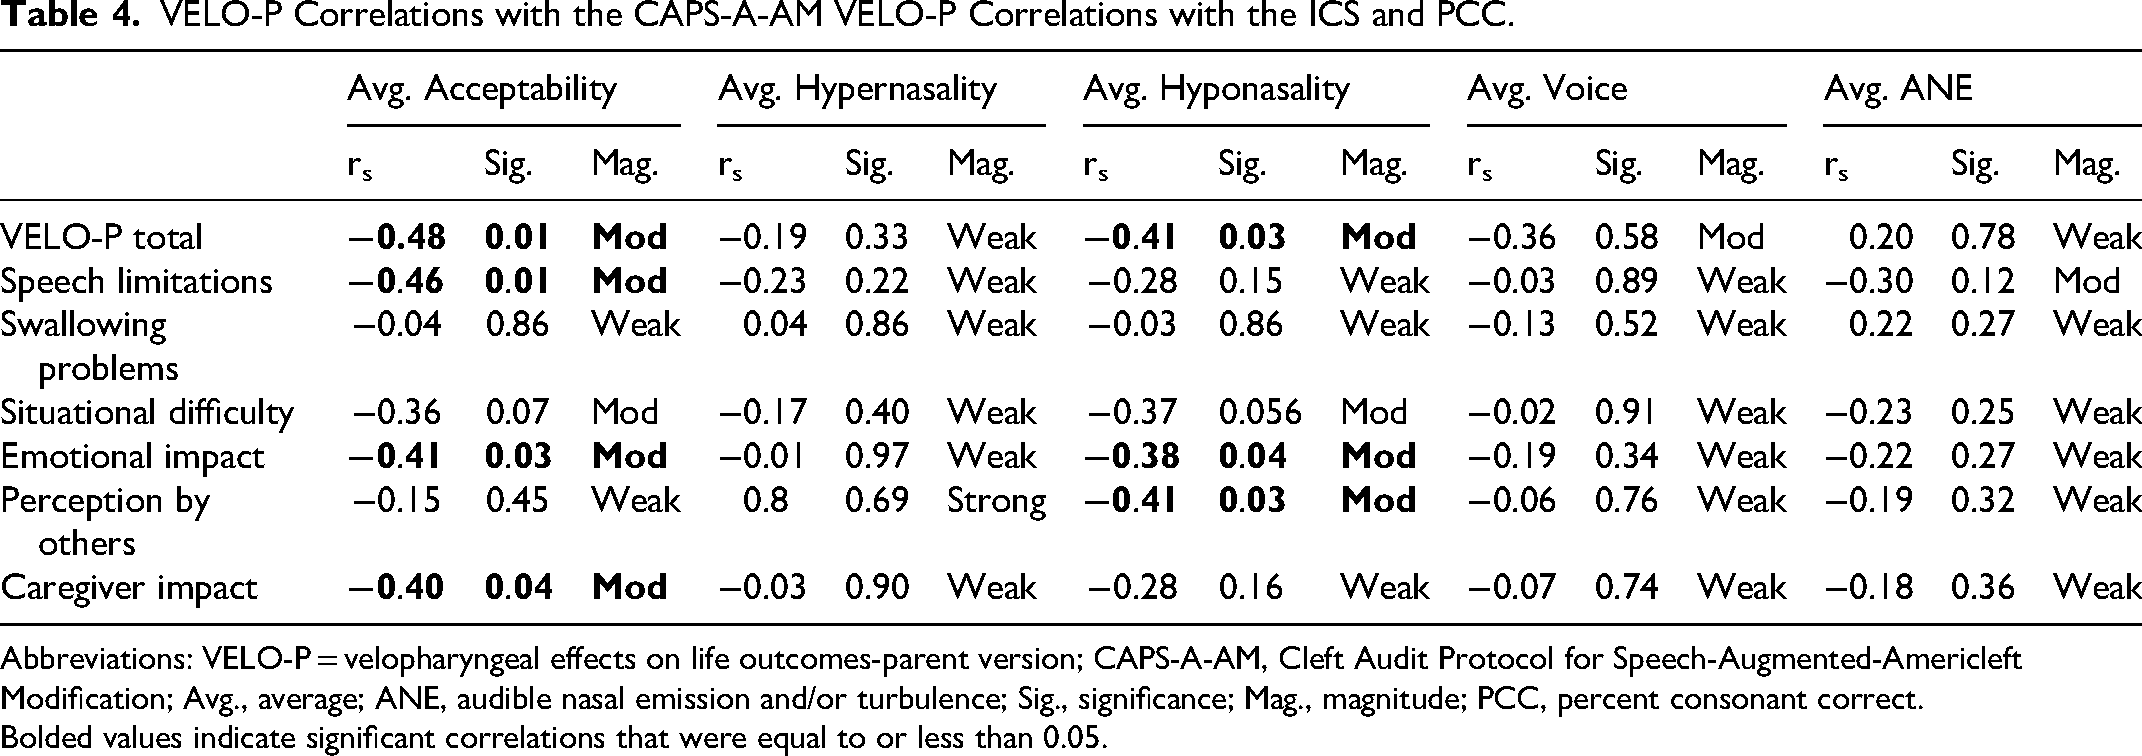
Abbreviations: VELO-P = velopharyngeal effects on life outcomes-parent version; CAPS-A-AM, Cleft Audit Protocol for Speech-Augmented-Americleft Modification; Avg., average; ANE, audible nasal emission and/or turbulence; Sig., significance; Mag., magnitude; PCC, percent consonant correct.
Bolded values indicate significant correlations that were equal to or less than 0.05.
Speech Limitations
Spearman's rank-order correlation was conducted to analyze the association between the Speech Limitations domain and the parameters rated on the CAPS-A-AM. 34 The Speech Limitations domain had a moderate negative correlation with the average rating of Acceptability (rs(29)=-0.46, P = .01). The full results are displayed in Table 4.
Swallowing Problems
Spearman's rank-order correlation was conducted to analyze the association between the Swallowing domain and the parameters rated on the CAPS-A-AM. 34 There were no significant correlations between the Swallowing domain and the CAPS-A-AM. 34 The full results are available in Table 4.
Situational Difficulty
Spearman's rank-order correlation was conducted to analyze the association between the Situational Difficulty domain and the parameters rated on the CAPS-A-AM. 34 There were no correlations for the Situational Difficulty domain and the CAPS-A-AM. 34 The full results are displayed in Table 4.
Emotional Impact
Spearman's rank-order correlation was conducted to analyze the association between the Emotional Impact domain and the parameters rated on the CAPS-A-AM. 34 The Emotional Impact domain had a moderate negative correlation with the average rating of Acceptability (rs(29)=-0.41, P = .03). There was also a moderate negative correlation with the average rating of Hyponasality (rs(29)=-0.38, P = .04). The full results are displayed in Table 4.
Perception by Others
Spearman's rank-order correlation was conducted to analyze the association between the Situational Difficulty domain and the parameters rated on the CAPS-A-AM. 34 The Perception by Others domain had a moderate negative correlation with the average rating of Hyponasality (rs(29)=-0.41, P = .03). The full results are displayed in Table 4.
Caregiver Impact
Spearman's rank-order correlation was conducted to analyze the association between the Caregiver Impact domain and the parameters rated on the CAPS-A-AM. 34 The Caregiver Impact domain had a moderate negative correlation with the average rating of Acceptability (rs (28)=-0.40, P = .04). The full results are displayed in Table 4.
CAPS-A-AM and PCC
Spearman's rank-order correlation was conducted to analyze the association between the CAPS-A-AM 34 and the PCC-total 38 calculated from the GFTA-3. 36 There was a strong negative correlation between the PCC 38 -total and the average rating of Acceptability (rs(29)=-0.79, P < .001). There was a moderate negative correlation between the PCC-total 38 and the average rating of hypernasality (rs (29)=-0.40, P = .03). Additionally, there was a moderate negative correlation between PCC 38 -total and the average rating of audible nasal emission (rs (29)=-0.44, P = .02). The full results are displayed in Table 5.
CAPS-A-AM Ratings with PCC.
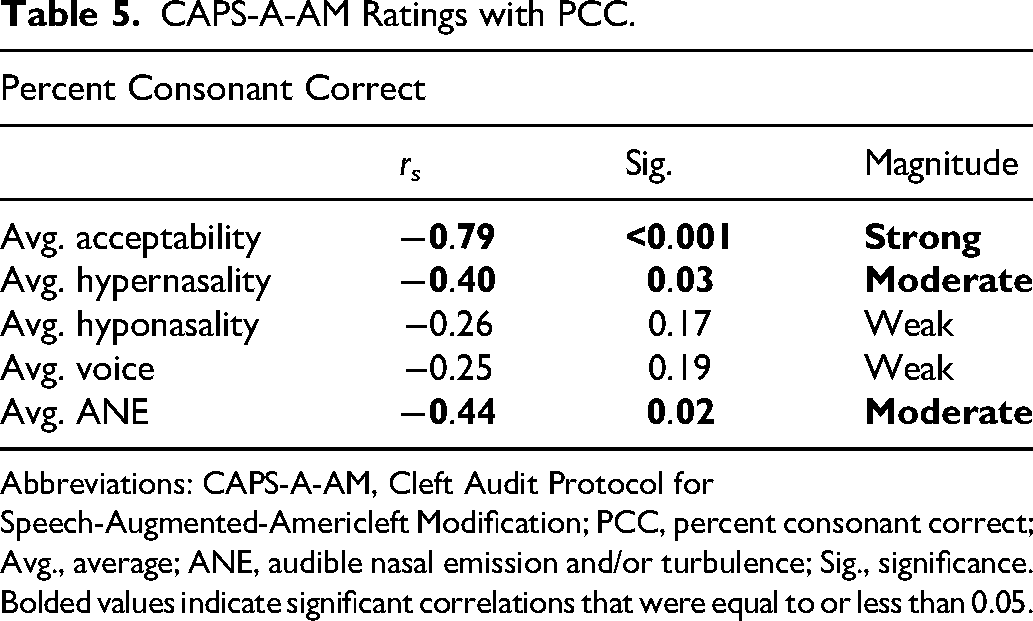
Abbreviations: CAPS-A-AM, Cleft Audit Protocol for Speech-Augmented-Americleft Modification; PCC, percent consonant correct; Avg., average; ANE, audible nasal emission and/or turbulence; Sig., significance.
Bolded values indicate significant correlations that were equal to or less than 0.05.
Nasometer Correlations with the Velopharyngeal Effects on Life Outcomes-Parent Version and Intelligibility in Context Scale
Total Score
Spearman's rank-order correlation was conducted to analyze the association between the total score of the VELO-P and nasalance scores from the NasometerTM II. 39 There were no significant correlations between the VELO-P total score and the average nasalance scores.
Speech Limitations
Spearman's rank-order correlation was conducted to analyze the association between the Speech Limitations domain and nasalance scores from the NasometerTM II. 39 The correlations were weak and not significant.
Swallowing
Spearman's rank-order correlation was conducted to analyze the association between the Swallowing domain and nasalance scores from the NasometerTM II. 39 All correlations were weak.
Situational Difficulty
Spearman's rank-order correlation was conducted to analyze the association between the Situational Difficulty domain and nasalance scores from the NasometerTM II. 39 The remaining correlations were weak.
Emotional Impact
Spearman's rank-order correlation was conducted to analyze the association between the Emotional Impact domain and nasalance scores from the NasometerTM II. 39 All correlations were weak for this domain.
Perception by Others
Spearman's rank-order correlation was conducted to analyze the association between the Perception by Others domain and nasalance scores from the NasometerTM II. 39 There were two moderate correlations. There was a moderate negative correlation between the Perception by Others domain and the average nasalance score for bilabials (rs(27)=-0.35, P = .07). There was also a moderate negative correlation between the Perception by Others domain and the average nasalance score for velars (rs(27)=-0.31, P = .1). All remaining correlations were weak for this domain.
Caregiver Impact
Spearman's rank-order correlation was conducted to analyze the association between the Caregiver Impact domain and nasalance scores from the NasometerTM II. 39 All correlations were weak for this domain.
Intelligibility in Context Scale
Spearman's rank-order correlation was conducted to analyze the association between the ICS and nasalance scores from the NasometerTM II. 39 All correlations were weak.
Predicting Emotional Impact Domain
A multiple linear regression was conducted to determine if SLP ratings of speech acceptability, SLP ratings of hyponasality, and scores from the ICS were predictive of parent ratings of the Emotional Impact domain on the VELO-P. 26 Regression model 2 accounted for 34% of the variability in the Emotional Impact domain (P = .006, r2 = 0.34) while adjusting for the other predictors. Significant predictors for the Emotional Impact domain were the average rating of acceptability from the CAPS-A-AM 34 (β=-0.43, t = -2.60, P = .02) and the average rating of hyponasality from the CAPS-A-AM 34 (β=-0.36, t = -2.22, P = .04). Please see Table 6 for more details.
Predictors of the Emotional Impact Domain Using Ratings of Speech Acceptability and Hyponasality with the ICS.
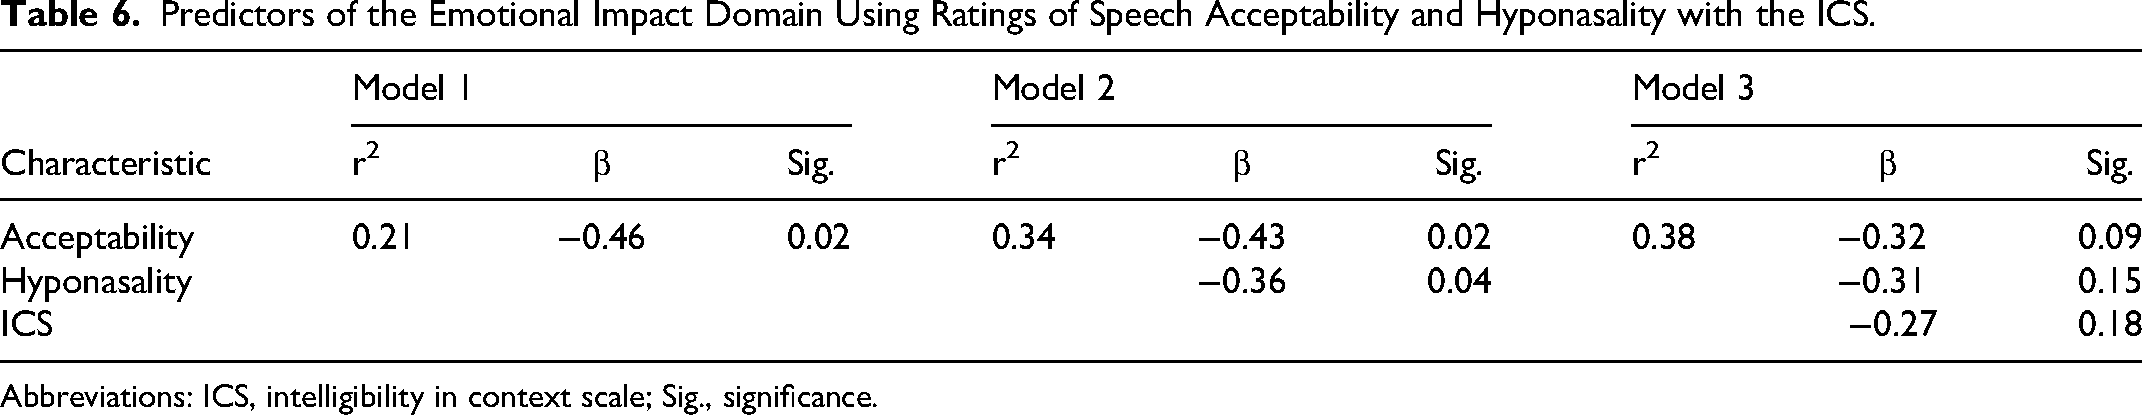
Abbreviations: ICS, intelligibility in context scale; Sig., significance.
Predicting the Perception by Others Domain
There were no statistically significant predictors from the ratings on the CAPS-A-AM, 34 the ICS, PCC, nor nasalance scores for the Perception by Others domain.
Discussion
Children with CP ± L have many factors that impact their QOL. This article explored several areas of communication that may contribute to perceived lower QOL, as measured through the VELO-P, 26 framed by the components of a speech and resonance evaluation, and parent-reported intelligibility. It was hypothesized that there would be positive correlations between the VELO-P 26 and the ICS. 28 This hypothesis was confirmed. Specifically, parents who reported higher perceived QOL on the VELO-P, 26 also reported high intelligibility within different social scenarios described on the ICS. 28 This was also true of the Speech Limitations domain, Situational Difficulty domain, Emotional Impact domain, and the Caregiver Impact domain. Interestingly, there was no a significant correlation with the Perception by Others domain. This may be due to parents never fully being able to predict a listener's ability to perceive and understand the speech of their children. We had also hypothesized that there would be a positive correlation between the VELO-P 26 and its domains with PCC. 38 This hypothesis was partially confirmed. We noted positive correlations with the VELO-P total score, the Speech Limitations domain, and the Caregiver Impact domain. This means that as children presented with more accurate articulation, this improved not only the perceived QOL of the child, but also that of the caregiver. This further confirms that the impact of SSDs on the QOL of the parents and child as discussed by McCormack et al, (2010), Simoni et al (2019), and Pedersen et al, (2021).
It was also hypothesized that there would be a negative correlation between the VELO-P 26 and its domain with the average ratings made by the SLPs on the CAPS-A-AM. 34 This hypothesis was partially confirmed. We found that the average rating of acceptability had a negative moderate correlation with the VELO-P 26 total score, the Speech Limitations domain, the Emotional Impact domain, and the Caregiver Impact domain. This indicated that as the SLPs reported more acceptable speech (lower scores) that the perceived QOL increased. Our finding of the correlations between the rating of speech acceptability and the VELO-P total score is similar to that of Bruneel et al, 2019. 6 Bruneel et al (2019) 6 conducted a similar study in which the VELO-P 26 was correlated with the Cleft Audit Protocol for Speech-Augmented (CAPS-A) and Velopharyngeal Composite Score Summary (VPC-Sum). 46 The authors conducted post-hoc analyses which also found significant negative correlations between the speech acceptability rating and the domains of Speech Limitations, Situational Difficulty, Emotional Impact, Perception by Others, and Caregiver Impact. Our study did not find a significant correlation with the Situation Difficulty domain nor the Perception by Others domain, we posit that this could be attributed to the age differences in the studies, the population size, the number of SLPs conducting the ratings, and differences between the CAPS-A and CAPS-A-AM. 34
We also found that VELO-P total score, the Emotional Impact domain, and the Perception by Others domain had negative correlations with the average rating of hyponasality. This indicated that as SLP ratings reported less hyponasal speech that the perceived QOL increased. This finding was different from that of Bruneel et al (2019) who found no significant correlations between hyponasality, the VELO-P, and the domains of the VELO-P.
The average rating of hypernasality made by the SLPs had no correlations with the VELO-P
26
nor its domains. We found this surprising due to hypernasality being well documented in the literature as having a negative impact on the QOL of children with CP
We hypothesized that there would be negative correlations between the CAPS-A-AM 34 ratings and the PCC. 38 This hypothesis was partially correct. We found a strong negative correlation between SLP ratings of speech acceptability and PCC, 38 and moderate negative correlations between SLP ratings of hypernasality and ANE. We did note several significant correlations between the SLP ratings on the CAPS-A-AM 34 and the calculated PCC. 38 The significant negative correlation between PCC 38 and the speech acceptability rating made by the SLPs can be likened to the findings of van Doornik et al, (2025). 48 The researchers noted that as PCC 38 decreased the ratings of severity made by the expert SLPs increased. While van Doornik et al (2025) 48 focused on speech intelligibility in their study, parallels can still be drawn since the rating of speech acceptability encompasses intelligibility, 32 although acceptability can be influenced by other factors common in the speech of children with CP ± L (eg, nasal emission, nasal turbulence, voice quality). Our finding of the significant negative correlation between PCC 38 and the rating of hypernasality is in alignment with those described by Chee-Williams et al, (2025). 49 In this study, the researchers noted the use of the American English Phrase Sample (AEPS) 40 could be used to reliably rate hypernasality among expert SLPs. Of note, the AEPS 40 is derived from the AESS, 35 which was designed to be phonetically balanced to allow cleft-craniofacial team SLPs the ability to simultaneously screen for articulation errors while also rating resonance.
We hypothesized that there would be negative correlations between nasalance scores collected during the Picture-Cued Subtest and the VELO-P total score and the domains. This hypothesis was incorrect. There were no correlations between the nasalance scores and the VELO-P total score and the domains. This finding was similar and different from that of Bruneel et al (2019). Similar to Bruneel et al (2019), we did not find a significant correlation between the nasalance scores calculated from the nasal sentences and the VELO-P total score and the domains. However, Bruneel et al (2019) did find a significant negative correlation between the nasalance scores and the oral texts on the NasometerTM II 6450, which differed from our finding. Reasons why these findings may be different are that different nasometers were used in the studies. Additionally, the children in the studies received different stimuli. This study gathered nasalance scores from the Picture-Cued Subtest, whereas Bruneel et al (2019) used the Dutch passages for the nasometer.
We hypothesized that ratings on the CAPS-A-AM 34 and PCC 38 would be predictive of the Emotional Impact domain and the Perception by Others domain. This hypothesis was partially correct, specifically, we found that the average rating of speech acceptability and the average rating of hyponasality were predictive of the Emotional Impact domain. These results indicated that as ratings of speech acceptability and ratings of hyponasality decreased (closer to within normal limits) the ratings of the Emotional Impact domain would increase (higher QOL). We did not find any other variables to be predictive. We also hypothesized that the SLP rating of ANE and the nasalance scores from the Picture-Cued Subtest would be predictive of the Emotional Impact domain and the Perception by Others domain. None of these parameters was predictive of either domain.
Limitations
This study had several limitations that future studies may wish to avoid. First, our sample is small and consists of participants from one large children's hospital in the Southwest portion of the USA. Future research may wish to expand not only the size of the sample studied but also include other areas of the USA. Second, the QOL measurements were only collected from the perspective of the parents of the children in this study. This is significant, considering McCormack et al (2010) 16 found that children and their parents have differing perspectives on how impacted the child is by his/her speech. Future researchers may wish to use an older population of children that are able to complete the VELO-Y. 26 This will further enhance our knowledge of how VPI status impacts the child and will be in alignment with the findings from van Doornik et al, (2025). 48 Additionally, incorporating the VELO-Y 26 could assist in understanding shared decision making (SDM) for VPI surgery.
Clinical Implications
This study did find significant correlations between ratings made by SLPs and the perceived QOL of parents of children with CP ± L. This further emphasizes that members of the cleft-craniofacial team need to work in tandem with parents and the children they serve when making medical decisions. While the NasometerTM II 39 is often used clinically to enhance the diagnosis of hypernasality and to track pre- and post-operative changes in resonance, there were no correlations between the nasalance scores with ratings made by SLPs and the perceived QOL of children with CP ± L within this study. This indicates that clinically, the NasometerTM II 39 should continue to be used to enhance the diagnosis of resonance disorders while also providing objective pre- and post-operative measurements for the SLPs and surgeons. The nasalance scores are not indicative of the overall ratings made by the SLPs nor are they predictive of the perceived QOL of parents of children with CP ± L.
It is essential to collect several viewpoints for a holistic and comprehensive assessment of VPI. Information on patients’ QOL is necessary to capture their day-to-day life with their communication, which is in line with the ICF-CY. 7 QOL measures capture the patient across different communication partners and situations, which need to be accounted for in clinical decision making. A challenge to QOL research is that the results of the measure may change from day to day. For example, if providing a QOL measure in the summertime when the child is off from school, they may be more confident with their speech being around family and friends versus giving the QOL measure in the middle of the school year when the child may be struggling with peer relations in the schools. An additional challenge with QOL measures is that the findings may change depending on the person completing the instrument. For example, a child's view of their speech and communication may differ from their caregivers’ views. These are clinical considerations that should be accounted for, and perhaps several administrations for the VELO-P 26 and when appropriate the VELO-Y 26 should be accounted for in cases where the patient is unsure about undergoing management of his/her VPI.
Conclusion
This study found correlations between the VELO-P
26
and its domains with the ICS
28
and PCC.
38
While all separate measures, these instruments contribute to a holistic viewpoint of the impact of speech and resonance on the child with CP ± L. Additionally, correlations between SLPs ratings and parents’ perceptions of QOL for children with CP ± L were also noted. This can be interpreted that parents’ are acutely aware of how speech impacts the QOL of their children. Additionally, SLP ratings can be predictive of how a child's speech impacts his/her parent. This study provides evidence that the VELO-P
26
is a useful tool to capture how a child with CP
Footnotes
Acknowledgement:
We would also like to acknowledge and thank Jessica Chee-Williams, MS, CCC-SLP, for her contribution to the ratings and reliability.
Ethical Statement
Ethical approval for this study was obtained from the Institutional Review Board at Arizona State University (STUDY00016321).
Author Contribution
All authors contributed equally to this work.
Funding
The authors disclosed receipt of the following financial support for the research, authorship, and/or publication of this article: This work was supported by the National Institute of Dental and Craniofacial Research (NIDCR) and the Office of the Director, National Institutes of Health (OD) under award DE031253. The content is solely the responsibility of the authors and does not necessarily represent the official views of the National Institutes of Health.
Declaration of Conflicting Interests
The authors declared no potential conflicts of interest with respect to the research, authorship, and/or publication of this article.