
Abstract
National efforts promoting high-quality cleft care rely on accreditation by the American Cleft Palate-Craniofacial Association (ACPA), though accreditation does not account for regional disease burden. Using U.S. natality and global health datasets (2014-2021), cleft incidence, prevalence, and disability-adjusted life years (DALYs) were compared with trends in ACPA accreditation. While births and cleft incidence declined nationally, accreditation expanded substantially. Conversely, prevalence and DALYs rose regionally without corresponding increases in accredited centers. Several states demonstrated discordant trends between burden and access. These findings suggest misalignment between accredited cleft care availability and evolving geographic disease burden, underscoring the need for data-driven resource planning.
Introduction
Orofacial clefts (OFC) affect approximately 1 in 700 live births and have a prevalence of 19.9 per 10,000 live births. 1 Management requires longitudinal, interdisciplinary and coordinate care spanning from infancy into adulthood.1–3 To promote quality and consistency, the American Cleft Palate-Craniofacial Association (ACPA) accredits teams that meet standards for interdisciplinary composition, evidence-based protocols, and continuity of care.3,4
The accreditation process outlined by the ACPA requires demonstration of interdisciplinary collaboration across defined core specialties. 5 Teams are required to renew accreditation every 5 years through submission of outcome data and team composition review. 5 As of 2024, approximately 180 cleft and craniofacial teams are accredited in the United States, making accreditation the predominant framework for organized multidisciplinary cleft care in the country.4,6 Accreditation provides centers with national recognition of adherence to best-practice standards, facilitating institutional support and referral pathways.
Although these accredited teams play a critical role in care delivery, their distribution across the United States is markedly varied. Studies have demonstrated that many ACPA centers are concentrated in urban and coastal regions, leaving large rural areas with limited or no proximate access.2,3 In certain regions, like the Mountain West and Midwest, the nearest accredited cleft team may be located more than 100 miles away, a distance that has been associated with prolonged travel time, increased financial burden, and a reduced likelihood of receiving timely surgical care.2,4,7,8 Longer travel distances increase cost and time burden, also reducing adherence to recommended treatment schedules. 9 These geographic barriers exacerbate existing socioeconomic disparities, including insurance coverage and language access, disproportionately affecting low-income and minority populations.3,10 In regions with the greatest travel burden, children are more likely to experience delays in primary OFC repair, decreased access to orthodontic treatments, and reduced adherence to recommended follow-up.3,10 These barriers underscore the critical importance of understanding how cleft care resources are distributed relative to patient need.
This study integrates national epidemiologic data on cleft incidence, prevalence, and Disability Adjusted Life Years (DALYs) over 8 years with annual distributions of ACPA-accredited centers. By comparing temporal and regional disease burden with spatial access trends, this study assesses whether center growth reflects regional cleft burden. This approach provides a novel, data-driven framework for aligning accredited multidisciplinary cleft care with the geographic and temporal clinical burden, informing targeted resource allocation and strategic center placement.
Methods
Birth and Population Data
Total U.S. live births and OFC births by state were obtained from the restricted-use National Center for Health Statistics (NCHS) natality files (2014-2021) under a data use agreement for cleft palate only and cleft lip with or without cleft palate, diagnostic fields. Incidence was recorded as the total number of new cases. Prevalence and disability-adjusted life years (DALYs) were extracted from the Institute for Health Metrics and Evaluation (IHME) Global Burden of Disease (GBD) database and reported as cases per 100,000 population and DALYs per 100,000 live births, respectively, as live births represent the at-risk denominator at the point of congenital disease onset. 11 DALYs represent the total health loss combining years of life lost (YLL) due to premature mortality and years lived with disability (YLD) (DALY = YLL + YLD), 11 capturing the long-term functional burden due to persistent disability, delayed care, or limited functional recovery.
Geographic Distribution of ACPA Centers
The ACPA provided all accredited cleft centers by state for each year of the study period (2014-2021). Centers were grouped by U.S. Census Bureau-defined regions: New England (CT, ME, MA, NH, RI, VT), Middle Atlantic (NJ, NY, PA), East North Central (IL, IN, MI, OH, WI), West North Central (IA, KS, MN, MO, NE, ND, SD), South Atlantic (DE, DC, FL, GA, MD, NC, SC, VA, WV), East South Central (AL, KY, MS, TN), West South Central (AR, LA, OK, TX), Mountain (AZ, CO, ID, MT, NV, NM, UT, WY), and Pacific (AK, CA, HI, OR, WA). 12 This aggregation ensured comparability with national demographic and epidemiologic datasets. Center counts were treated as discrete values without adjusting for patient volume.
Statistics
Linear regression was used to estimate annual slope values for burden metrics and accredited center counts at national, regional, and state levels. Pearson correlation identified associations between burden and center availability. Temporal effects were measured using multivariable regression models including year, incidence, prevalence, and DALYs as predictors of center counts, with year-adjusted residuals correlated separately with center counts. Given the multiyear nature of ACPA accreditation, year-adjusted analyses were used to differentiate temporal cotrends from geographic associations rather than to imply short-term responsiveness. All tests were 2-tailed with a significance threshold of α = 0.05. IBM SPSS Statistics (IBM Corp., Armonk, NY) and GraphPad Prism (GraphPad Software, San Diego, CA) were used for statistical analysis.
Results
National Trends
All 50 states and the District of Columbia (D.C.) reported natality and OFC data. Over the 8-year study period, national births declined 12% from 1256 to 1105 per 100,000 population (slope = −24.8 per year, P < .0001) with stable risk of OFC per birth (slope = −0.22 cases per 100,000 births per year, P = .44) (Supplemental Figure S1). The incidence of OFC decreased significantly by 9.5%, from 3560 to 3220 absolute cases (slope = −58.9 per year, P = .0007). The number of ACPA-accredited centers grew from 159 to 186, increasing 17.0% (slope = + 3.3 centers per year, P < .0001) (Figure 1). Prevalence rose 23.4% from 848.8 to 1047.6 per 100,000 population (slope = +30.7 per year, P = .003), and DALYs increased 52.3% from 75.7 to 115.3 per 100,000 births (slope = +6.23 per year, P = .0008) (Figure 1). Declining incidence was significantly correlated with expansion of ACPA centers (r = −0.87, 95% CI [−0.98 to −0.44], P = .0046). Prevalence demonstrated a strong positive correlation with centers (r = 0.91, 95% CI [0.56 to 0.98], P = .0019), as did DALYs (r = 0.94, 95% CI [0.71 to 0.99], P = .0004). Multivariate analysis including year explained nearly all the variation in center growth (R2 = 0.97, P = .012). However, after adjusting for year, incidence (r = 0.42, P = .30), prevalence (r = 0.35, P = .39), and DALYs (r = 0.37, P = .37) were no longer significantly correlated with center counts (Supplemental Figures S2-S4) with limited interpretation of independent effects due to substantial collinearity among predictors (all P > .2).
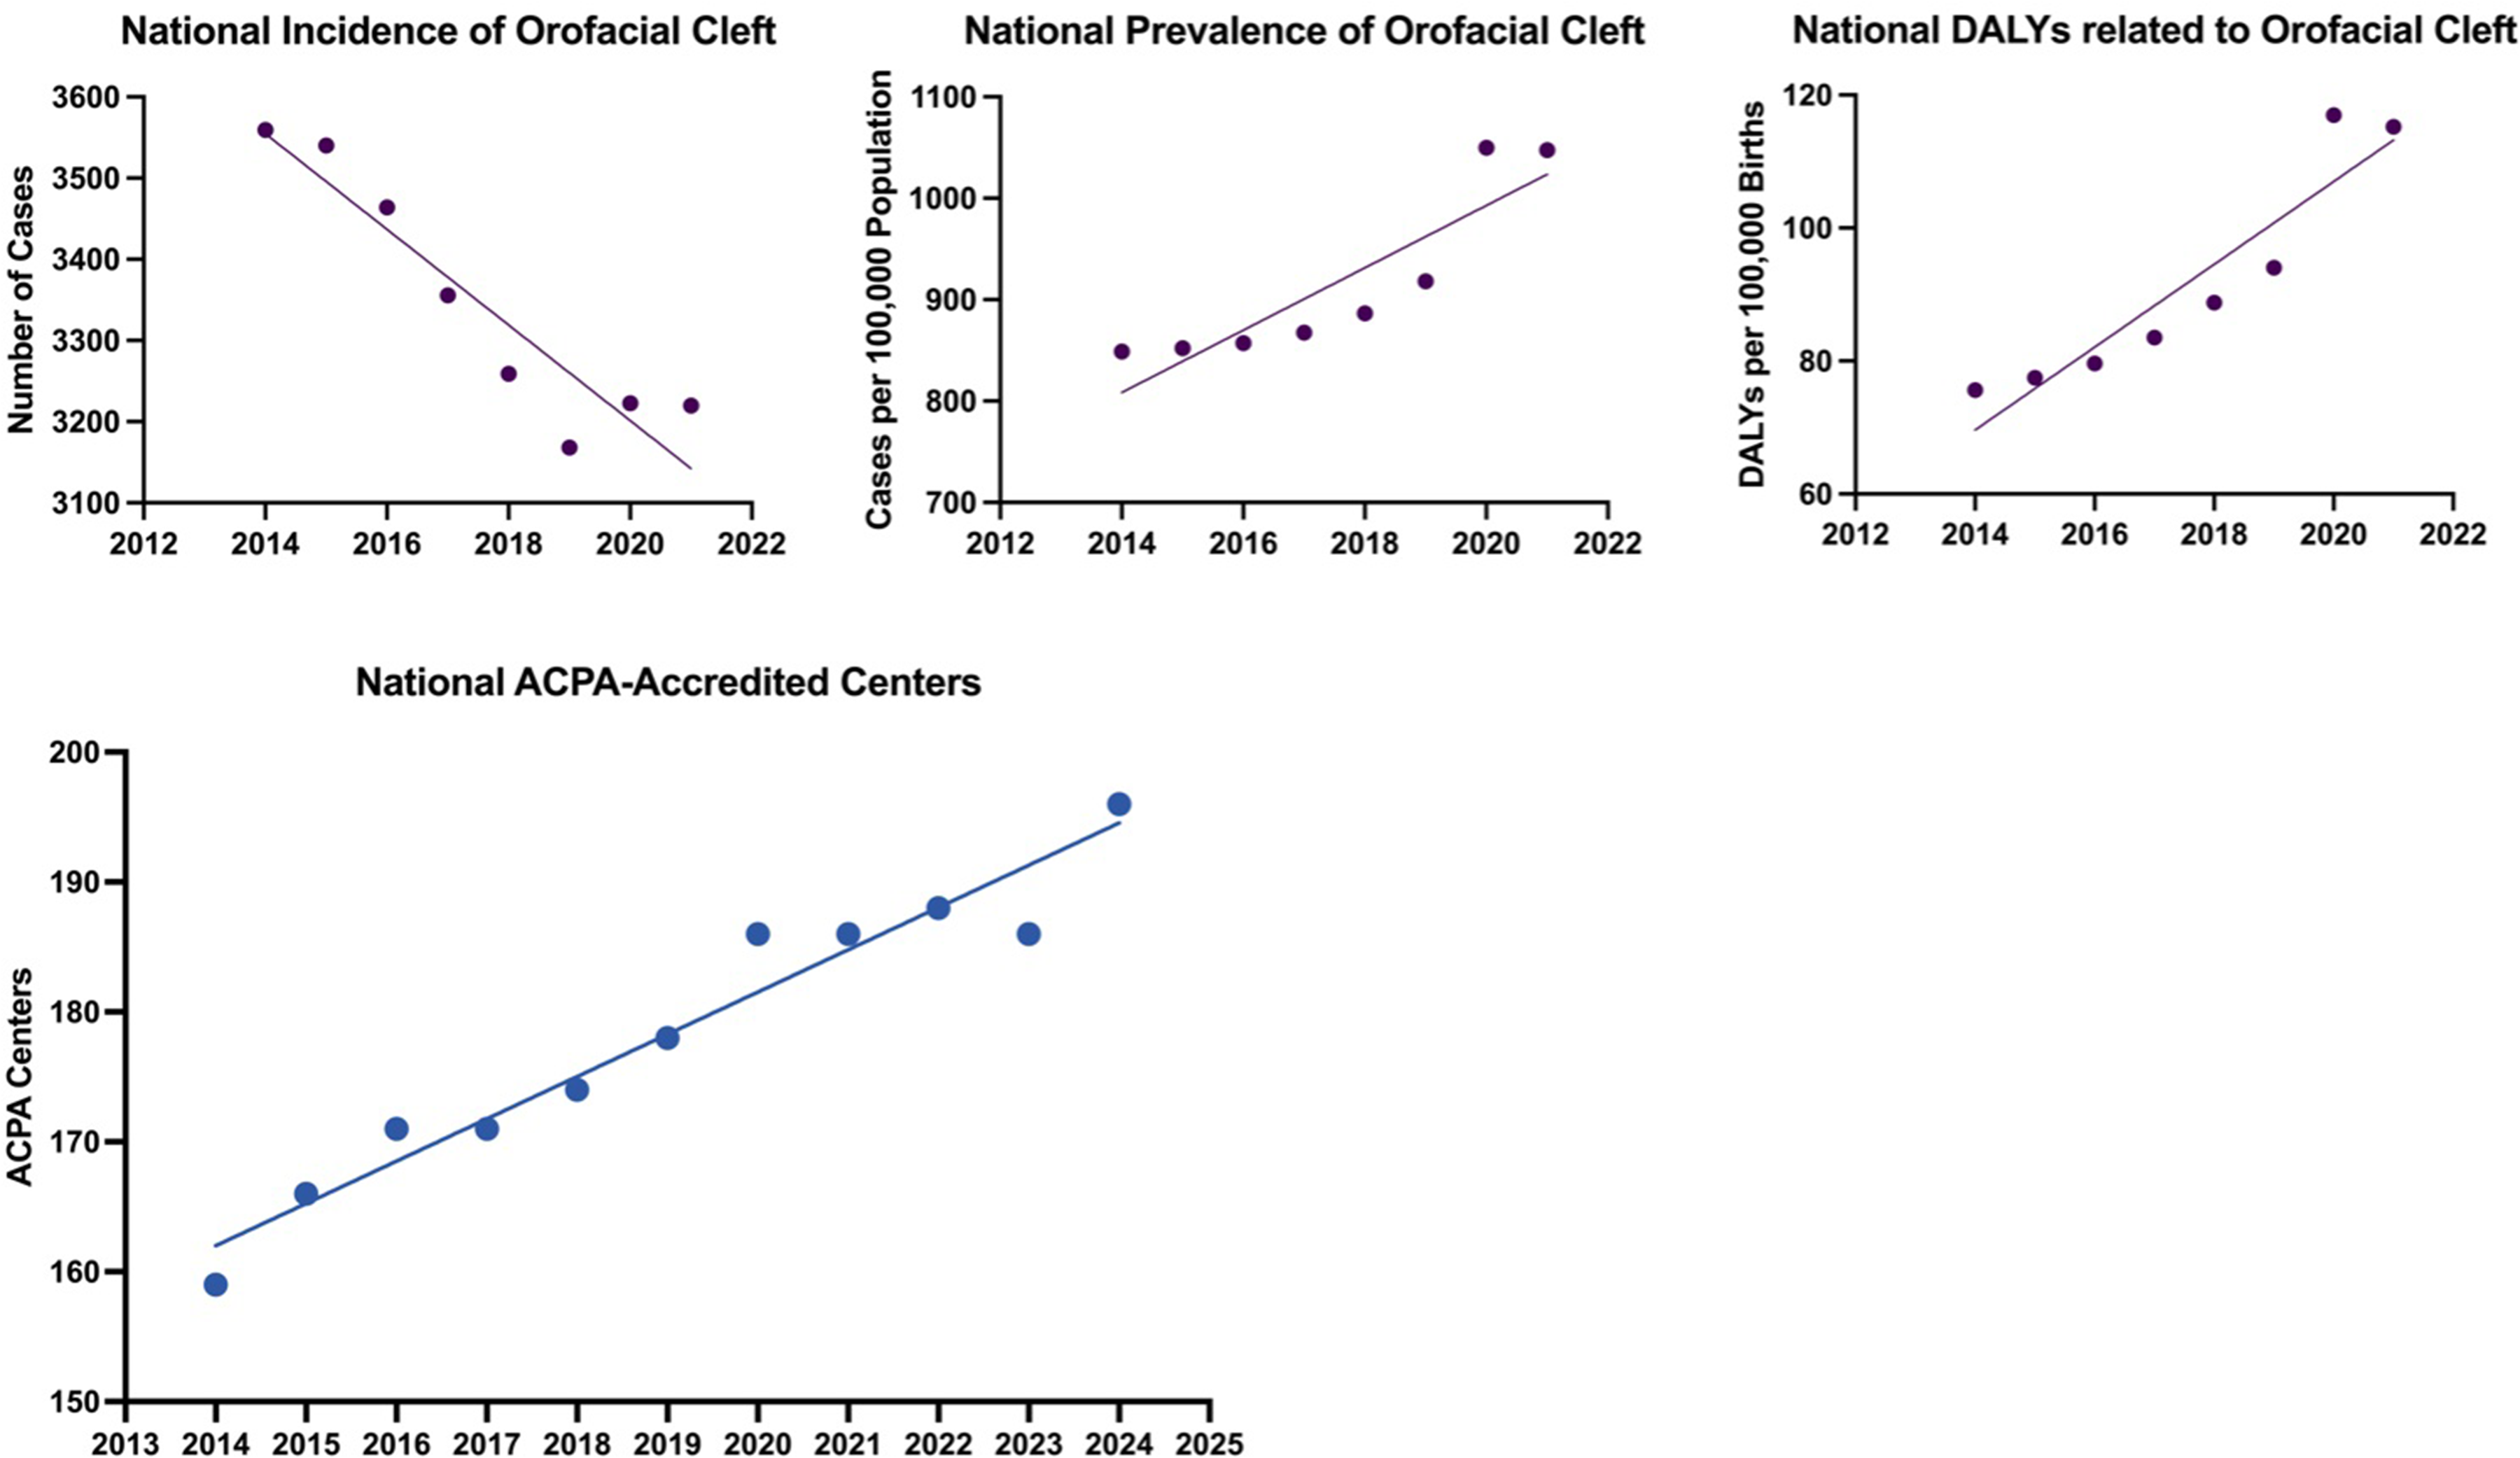
National trends in OFC burden and ACPA-accredited centers, 2014-2021. Scatterplots with fitted regression lines show (A) declining incidence of OFC (number of cases), (B) rising prevalence per 100,000 population, (C) increasing DALYs per 100,000 births, and (D) growth in the number of ACPA-accredited centers across the United States. Each point represents annual values; slopes are from linear regression models. The x-axis extends to 2013 and 2022 to provide temporal context; analyzed data spans 2014-2021 to correspond with available burden metrics.
Regional Trends
Between 2014 and 2021, cleft burden and ACPA-accredited center availability varied considerably across U.S. Census regions (Supplemental Table S1). In most regions, incidence declined significantly with slopes ranging from −13.7 (Mountain region) to −1.7 (East South Central) (all P < .05) except in the Middle Atlantic (slope = +0.1, P = .9044) (Supplemental Table S1). Center counts expanded significantly in this region from 17 to 24 (slope = +1.1, P < .0001), as well as in the East South Central region (slope = +0.72), New England (slope = +0.25), Pacific (slope = +0.79) (all P < .0001), and South Atlantic regions (slope = +0.69, P = .0013). The Mountain region experienced no change in ACPA centers (slope = +0.01, P = .9145) with a 23% decline in incidence from 343 to 263 cases (slope = −13.74, P < .0001) (Figure 2). The West North Central region had a decline in accredited centers from 17 to 15 (slope = −0.34, P = .0022) with significantly decreasing incidence (319 to 252 cases, slope = −11.1, P < .0001) (Figure 2). Prevalence rose significantly in all regions with slopes ranging from +0.4 to +1.1 (all P < .0021) and DALYs between +4.1 to +7.6 (all P < .0012) (Figure 2).
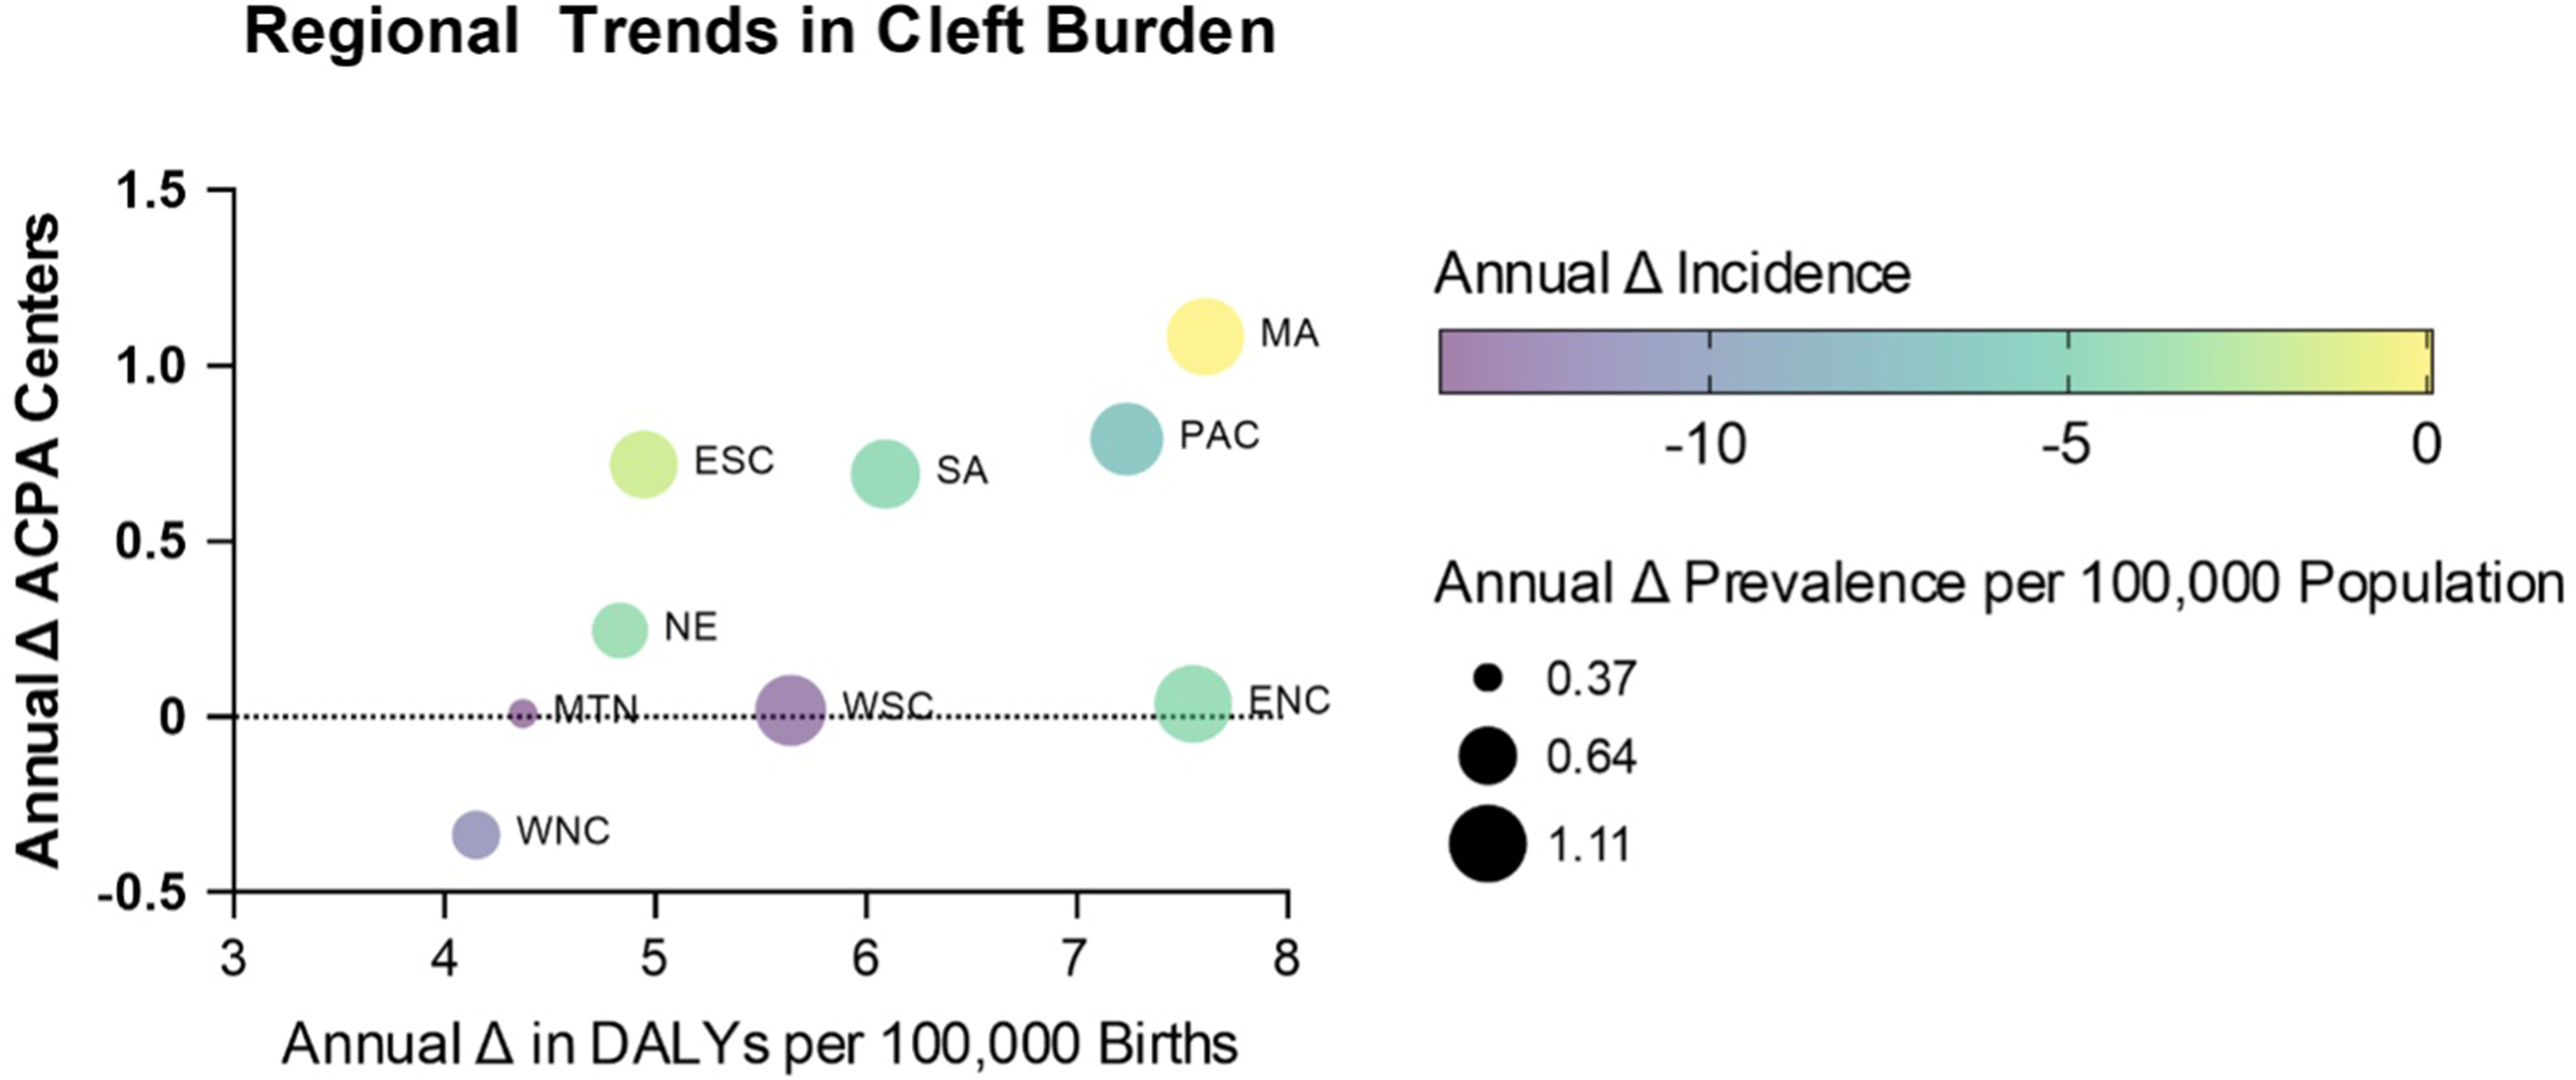
Regional trends in cleft burden and ACPA-accredited centers, 2014-2021. Bubble plot showing annual change (Δ) in ACPA centers relative to annual Δ in DALYs per 100,000 births across U.S. census regions. Bubble color represents annual Δ in incidence (number of cases), and bubble size represents annual Δ in prevalence (per 100,000 population). Notably, the MA region had the greatest growth in ACPA centers corresponding to an increase in both prevalence and DALYs and modest change in incidence. In contrast, the WNC region was the only region with a decline in ACPA centers with a corresponding decrease in incidence, despite a moderate increase in DALYs and prevalence.
There were no statistically significant associations between incidence and ACPA center trends in any region (P > .28). Strong positive correlations between prevalence and DALYs with center counts were identified in the Middle Atlantic, New England, and Pacific, though these became nonsignificant after adjusting for year, suggesting temporal co-trending rather than independent associations (Supplemental Table S1). The West North Central region demonstrated inverse trends for prevalence (r = −0.79, P = .0185) and DALYs (r = −0.73, P = .0399).
Trends by U.S. State
There was significant variability in cleft burden across states (Figure 3(A)-(D)). Most states had decreasing incidences except Florida, Georgia, Hawaii, North Carolina, New Jersey, New York, Ohio, and Tennessee; however the rise in incidence was not significant in any of these states (P > .14; Supplemental Table S1). Texas demonstrated the steepest decline in incidence (slope = −7.9 cases, P = .4809), while New York had +0.8 new cases annually (P = .1417). The trend remained downward for Texas when adjusting for birth rate (−2.5 cases per 100,000 births, P = .0054) and was inverted in New York (−0.6 cases per 100,000 births, P = .2178). Concurrently, both states had increases in ACPA centers, which was modest in Texas (12 to 13 centers, + 0.1, P = .1773) and highly significant in New York with a 75% increase from 8 to 14 centers (+0.89, P < .0001). Expansion in ACPA centers was not significantly correlated with changing incidence in either state (Texas r = −0.49, P = .2139; New York r = +0.65, P = .0792). Texas and New York had significantly increasing prevalence (+1.1, P = .0012 and +1.1, P = .0020, respectively) and DALYs (+6.219, P = .0005 and +7.582, P = .0019, respectively). This increase in prevalence and DALYs was only significantly correlated with change in ACPA centers in New York (prevalence r = 0.9645, P < .0001; DALYs r = 0.9647, P < .0001), but not in Texas (prevalence r = 0.66, P = .0733; DALYs r = 0.65, P = .0823) (Figure 3(E)-(F)).
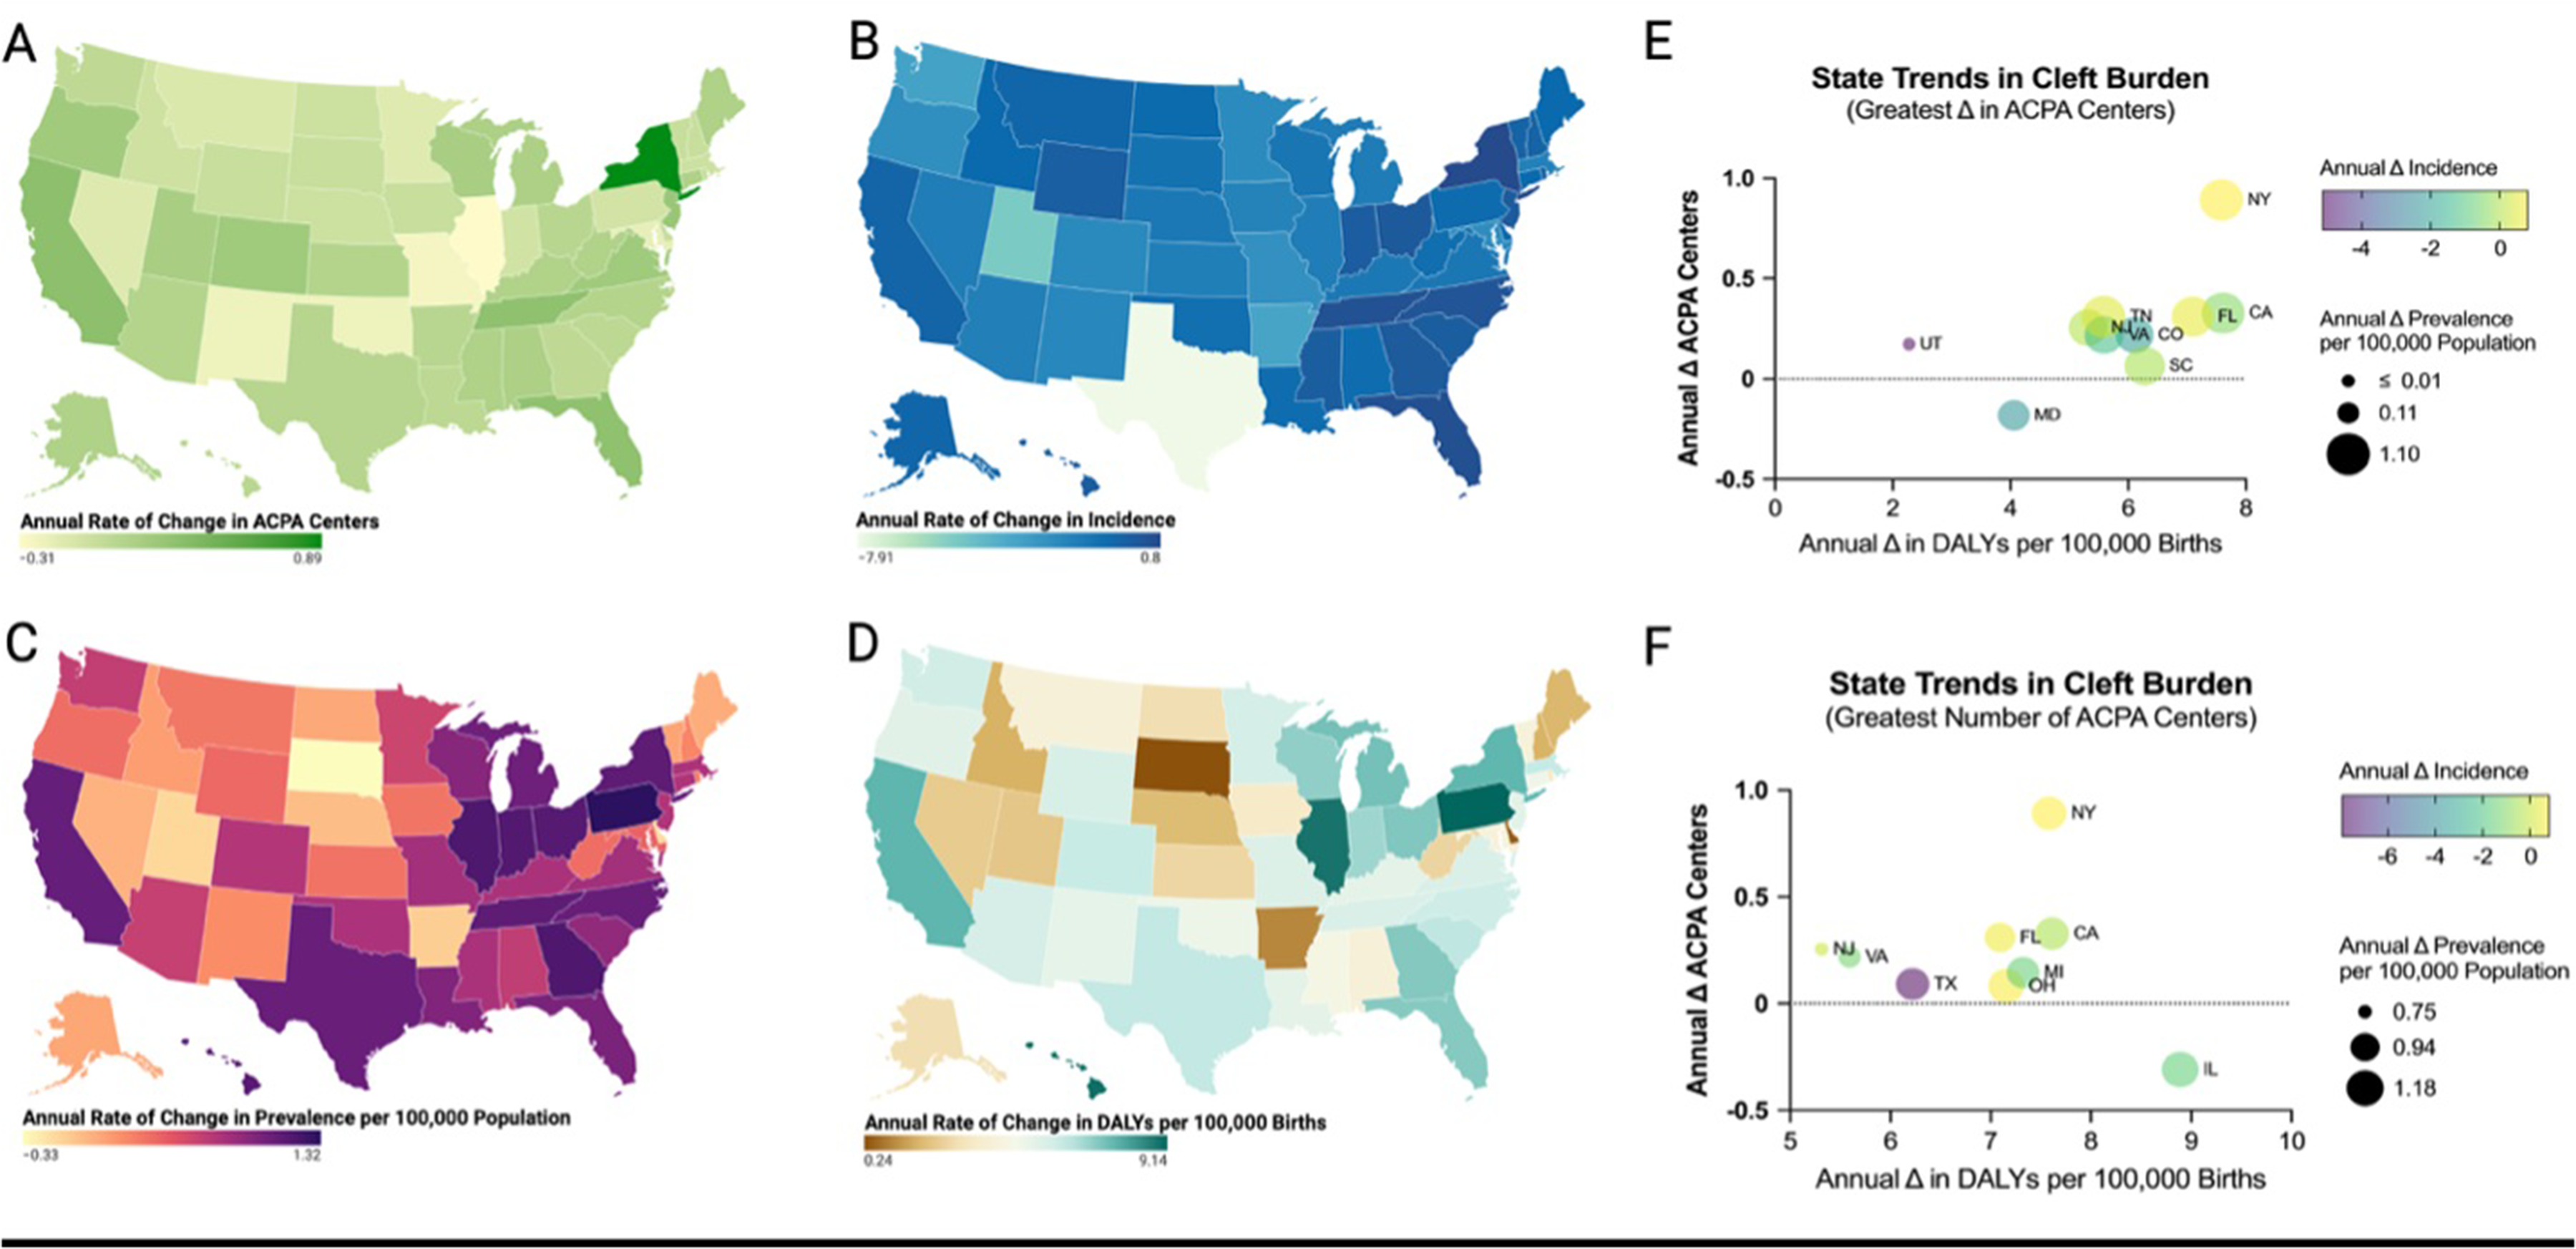
State-level trends in cleft burden and ACPA-accredited centers, 2014-2021. Chloropleth maps show annual rates of change in (A). Number of ACPA-accredited centers, (B) incidence of OFC (new cases annually), (C) prevalence per 100,000 population, and (D) DALYs per 100,000 births. (E) Bubble plot displays cleft burden versus center growth for states with the greatest relative increase in ACPA centers from 2014 to 2021 with rising incidence, prevalence, DALYs, and center accreditations versus Utah (UT) with modest increases in burden and a gain of accredited centers. (F) Bubble plot of states with the highest absolute number of centers in 2021 demonstrating divergent patterns. Despite burden, Illinois (IL) saw a decrease in accredited centers while Texas (TX) added new centers despite steeply declining incidence. Bubble color reflects annual change in incidence, and bubble size reflects annual change in prevalence per 100,000 population.
Other notable state-level trends are detailed in Supplemental Table S1. Pennsylvania had significant increases in prevalence and DALYs with stable center counts, while California saw center expansion alongside rising burden and declining incidence. South Dakota and Delaware experienced significant declines in prevalence with no change in centers. Illinois had significant increases in prevalence and DALYs alongside a significant decline in ACPA centers (−0.31, P = .0054) (Figure 3(E)-(F)).
Discussion
Access to high-quality, multidisciplinary OFC care in the United States is largely determined by geographic availability. Prior studies have documented the unequal distribution of ACPA-accredited teams and highlighted the disproportionate travel burden for families in rural or socioeconomically disadvantaged areas. 13 Large regional divisions of the country such as Mountain West, West North Central, and parts of the South, require families to travel over 100 miles for care, with these spatial gaps correlating with socioeconomic disadvantage, lower insurance coverage, and delayed surgical intervention.3,4,13,14 However, these analyses relied on static or cross-sectional epidemiological measures, providing important but time-limited snapshots of access. The burden of OFC disease is dynamic, with birth rates and treatment patterns evolving over time. Failure to account for these changes may result in resource allocation strategies that are misaligned with the true trajectory of need. Our study integrates longitudinal changes in OFC incidence, prevalence, and DALYs with the temporal expansion of ACPA-accredited centers, offering a dynamic framework for understanding how access evolves alongside population needs.
Across the study period, the number of national births and new OFC cases significantly declined. More specifically, the national incidence of OFC declined by 10%, while ACPA-accredited centers expanded by 17%. While we found a significant decrease in new cases nationally, regionally, and in most states, our analysis revealed overall incongruence between these trends and the creation of new ACPA centers. In states with the most additions—New York, California, and Florida—there were negligible changes in new cases over time. States such as Virginia and Oregon had significant declines in incidence, but with continued expansion in ACPA centers. Nearly all regions except for the West North Central division added ACPA centers despite statistically significant decreases in new cases. This trend also persisted nationally indicating that opportunities for surgical and clinical experience may become more limited as OFC incidence continue to decline. This raises concern that the current number of accredited OFC centers are outpacing local needs for primary reconstruction, limiting clinical exposure, and compromising outcomes. Planning for new center accreditation should therefore consider these state-wide and regional trends in incidence to ensure accurate alignment with patient needs.
In contrast to incidence, prevalence and DALYs rose significantly across national, regional, and state levels, reflecting an increasing cumulative burden of disease despite a declining number of new cases. This may indicate a greater decline in national birth rates than in OFC incidence, with an overall unchanged disease risk, resulting in a proportionally higher population prevalence and cumulative disease burden. Other potential explanations include improved overall survival and life expectancy, migration trends, persistent lack of access to health care in rural areas, or medical complexity delaying treatment and forming an accumulating cohort of individuals requiring ongoing multidisciplinary care.15–17 States like Pennsylvania, Indiana, and Georgia each had significantly increased prevalence and DALYs, yet unchanged center counts. Likewise, Illinois had increases in prevalence and DALYs, alongside a significant decline in centers. Regionally, the West North Central division had similarly rising prevalence and DALYs with concurrent declining incidence and center counts illustrating that decreasing incidence does not imply reduced need for ongoing care.
The overall rise in ACPA-accredited centers indicates that access capacity expanded nationally; however, this growth did not consistently mirror geographic patterns of disease burden. Center expansion therefore appears to have occurred alongside these epidemiologic changes but was not directly driven by them. Because ACPA accreditation is a multiyear process, the time-adjusted analyses suggest that these relationships reflect long-term temporal trends rather than rapid, year-to-year responses to shifting burden. While incidence can identify areas with evolving needs for new ACPA centers, the distribution of centers within those regions should also address the factors driving the enduring trends in prevalence and DALYs.
Disease burden was greatest in the East North Central and Middle Atlantic regions, where prevalence and DALYs rose with declining incidence. Expansion in the Middle Atlantic was primarily driven by New York where nearly 1 center was added annually, with the majority located in metropolitan areas. These expansions did not align with the higher burden in the rest of the Middle Atlantic, especially Pennsylvania where centers declined. In the state, 1 of 5 centers were located in rural areas in 2014 and 1 of 4 in 2021. Despite high prevalence, rural center representation also declined in Illinois (2 of 9 in 2014 to only 1 of 8 in 2021). Consistent with previous literature, these findings suggest that expansion has primarily reinforced existing urban hubs rather than improved geographic equity.3,13,14 Because the ACPA does not directly initiate or fund new centers, the institutional infrastructure required for accreditation may be limited in smaller or resource-constrained hospitals outside of urban centers. Conversely, teams may already provide valuable care without accreditation, contributing to apparent geographic gaps. Institutions may pursue accreditation to enhance reputation, support training and research missions, or meet internal mandates for comprehensive pediatric services. Once established, reports of patient volumes vary across centers and as accreditation expands despite declining incidence, ensuring adequate case volume is increasingly important to preserve trainee experience, procedural proficiency, and improve patient long-term outcomes.18–20 The reasons underlying loss of ACPA center status are likely multifactorial and beyond the scope of this study. The authors feel that, although the support for continued and re-accreditation should be provided by any accrediting organization, this process should be progressively informed by local and regional needs.
Similar mismatches between cleft care infrastructure and regional burden have been observed in other high-income countries. Following the 1998 Clinical Standards Advisory Group report, the United Kingdom consolidated cleft care from 57 centers to 11 centralized networks, with minimum surgical volume thresholds, resulting in measurable improvements in outcomes over the subsequent 15 years likely attributable to greater concentration of expertise in select national centers.21,22 Similar consolidation efforts have been undertaken in the Netherlands, Scandinavia, Hungary, and Poland. 23 These centralized models differ fundamentally from the U.S. voluntary accreditation framework, in which ACPA approval is institution-driven rather than nationally coordinated, limiting the direct applicability of European policy solutions to the U.S. context. Nevertheless, the principle of aligning care infrastructure with regional burden through structured oversight offers a framework that merits consideration in future U.S. cleft care policy discussions.
Limitations and Future Directions
This study is limited by state-level data potentially masking within-state disparities particularly among rural vs. urban counties. Our state-level analysis does not account for pre-existing access deficits or within-state travel distances, which may explain center expansion in geographically large states despite declining incidence. Regional aggregation into U.S. Census Bureau divisions, which vary in geographic size and population density, contribute to within-region heterogeneity. Our analyses were limited to ACPA-accredited centers and while accreditation represents a standardized framework, care quality is not currently quantified and many nonaccredited centers also deliver meaningful care that was not captured in our analysis. We did not stratify by OFC subtype or syndromic status, which could influence the intensity and duration of care required. Statistically, correlation and regression models were constrained by collinearity among disease burden metrics. Finally, DALYs and prevalence were reported using different denominators (live births and total population, respectively) limiting direct cross-metric comparison; the live-births denominator was chosen to reflect the congenital origin of OFC but departs from standard GBD reporting convention. Future work should integrate substate geospatial modeling with temporal trends to pinpoint underserved counties and incorporate patient-level outcomes to validate whether temporal-geospatial alignment improves care delivery and functional results.
Conclusion
National birth rate and OFC incidence are declining, however ACPA centers have increased with an incongruent geographic distribution to areas of increasing prevalence and DALYs. Long-term disease burden continues to rise highlighting that mismatches in the growth of accredited teams and care burden persist. Incorporating temporal trend analysis into OFC care planning may help ensure that multidisciplinary resources are deployed where and when they are most needed. Specifically, ACPA accreditation prioritization frameworks could incorporate regional prevalence and DALY trajectories alongside incidence trends, and accredited centers in underserved regions could be encouraged to establish periodic rural outreach clinics to better align care infrastructure with evolving disease burden.
Supplemental Material
sj-docx-1-cpc-10.1177_10556656261461715 - Supplemental material for Does American Cleft Palate Craniofacial Association Cleft Team Accreditation Address Cleft Burden? A National Analysis
Supplemental material, sj-docx-1-cpc-10.1177_10556656261461715 for Does American Cleft Palate Craniofacial Association Cleft Team Accreditation Address Cleft Burden? A National Analysis by Dominika Pullmann, Leya Groysman, Rami Kantar, Lucas Perez Rivera and Roberto L. Flores in The Cleft Palate Craniofacial Journal
Footnotes
Funding
The authors received no financial support for the research, authorship, and/or publication of this article.
Declaration of Conflicting Interests
The authors declared no potential conflicts of interest with respect to the research, authorship, and/or publication of this article.
Data Availability
The data are not publicly available due to data access restrictions and may be obtained through formal request and approval from the NCHS and the IHME.
Supplemental Material
Supplemental material for this article is available online.
References
Supplementary Material
Please find the following supplemental material available below.
For Open Access articles published under a Creative Commons License, all supplemental material carries the same license as the article it is associated with.
For non-Open Access articles published, all supplemental material carries a non-exclusive license, and permission requests for re-use of supplemental material or any part of supplemental material shall be sent directly to the copyright owner as specified in the copyright notice associated with the article.