
Abstract
Objective
To study craniofacial growth and hypodontia in individuals born with Van der Woude syndrome (VWS) and compare with matched controls with and without a cleft.
Design
A multicenter retrospective case-control study.
Setting
Individuals from three craniofacial centers in Sweden and from a historical archive of Swedish healthy children were included.
Patients
Sixty individuals, with VWS (n = 20), non-syndromic cleft lip and/or palate (NSCL/P) (n = 20), and healthy controls (CTR) (n = 20), matched for age, gender and cleft type.
Interventions
Two lateral cephalograms per individual, taken at 10 and 16 years of age, were analyzed. Orthopantomograms were used to evaluate hypodontia.
Main Outcome Measures
Craniofacial growth followed longitudinally, with the primary variables SNA, SNB, ANB, NL/ML, and maxillary length. Prevalence of hypodontia was also recorded.
Results
Maxillary length increased 0.3 mm in the VWS group during puberty, compared to 4 mm in the NSCL/P group and 5.5 mm in the CTR group. Both cleft groups had a retruded maxilla at 16 years of age. The change in vertical jaw relation from 10 to 16 years showed a statistically significant difference between the VWS and the CTR group, with a slightly more posteriorly inclined mandible in the VWS group at 16 years. A statistically significant difference in hypodontia is seen between the cleft groups. In the VWS group, 90% had hypodontia compared to 60% in the NSCL/P group.
Conclusion
Individuals born with VWS have reduced maxillary growth during puberty and a higher prevalence of hypodontia compared to matched controls in the studied population.
Introduction
Van der Woude syndrome (VWS) (OMIM #119300) is the most common orofacial cleft syndrome, accounting for two percent of all cleft lip and/or cleft palate (CL/P) cases. It is an autosomal dominant trait affecting 1 in 35 000-100 000 people with high penetrance and variable expressivity, where both cleft lip (CL) and cleft palate (CP) can segregate in the same family.1-3 In about 70% of affected individuals, mutations in the Interferon regulatory factor 6 (IRF6) gene, located on the chromosome 1 region 1q32, are found.4,5 Disease-causing mutations have also been found in the Grainy head-like 3 (GRHL3) gene, located on the chromosome 1 region 1p33-1p36, in families with VWS where no mutations in the IRF6 gene were found. 6 Peyrard et al have shown that both Irf6 and Grhl3 are important for the development of the periderm and the palate. 6
The main characteristics of VWS are lower lip pits and/or lip sinuses (80%), CL/P (50%) and hypodontia (25%).7-9
Lip pits were first described by Demarquay in 1845, and in 1954, Anne van der Woude reported their association with CL/P. 7 Most commonly two symmetrical lip pits in the lower lip vermillion are seen, but lip pits may be asymmetric or single, and centrally or laterally positioned in relation to the midline.7,8
Hypodontia is a common finding in individuals born with CL/P, with a reported prevalence ranging from 36 to 77%, and a significant association has been observed between the presence of orofacial clefts and tooth agenesis.10-12 This can be compared to the reported prevalence of hypodontia of 5.5% in a healthy European population. 13 For individuals born with VWS, the prevalence of hypodontia has been found to be even higher than in non-syndromic controls with a cleft, with a reported prevalence of 69% compared to 43%.14,15 Another study found that 50% of individuals born with VWS and isolated CP had hypodontia. 16 Awadh et al found in their study that the odds for hypodontia in the VWS group were approximately double compared to the NSCP group. 17
In a study by Jones et al, it was reported that individuals born with VWS seem to have more postsurgical complications and impaired wound healing after cleft repair compared to individuals born with NSCL/P. 18 It is also well known that operated patients born with CL/P have a restricted maxillary growth compared to individuals without a cleft. In a study by Good et al, it was found that the overall frequency of Le Fort I was 20.9% in patients born with CL/P. 19
Regarding craniofacial growth, it has been noticed that some individuals born with VWS have a more pronounced class III tendency compared to individuals with NSCL/P. To date, only a few clinical trials have studied the craniofacial growth in individuals born with VWS, with some conflicting results.16,20-22 The studies by Kane et al and Oberoi and Vargervik indicated a restricted maxillary growth in individuals born with VWS compared to individuals born with NSCL/P, but Heliövaara et al could not see such a difference in their sample.16,20,21 Estévez-Arroyo et al even found a skeletal class II tendency for their VWS group. 22 In addition to the few numbers of studies, the samples are rather small, and the individuals included are relatively young. For example, in the study by Kane et al, only 4 of the included individuals born with VWS had cephalograms taken at the age of 13 or older, and in the other three studies mentioned above, the age at the follow-ups was even younger.16,20-22
In Sweden, children born with a cleft are treated at 6 different craniofacial centers, which employ slightly different surgical protocols but follow a shared treatment philosophy. VWS is a rare condition, occasionally encountered in clinical practice. However, it is often associated with a substantial burden of care for both the individual patient and their family, particularly when multiple close relatives are affected.
The goal with this study was to longitudinally follow and investigate a group of individuals born with VWS during growth, including the pubertal growth spurt, to deepen understanding and improve care of this group.
The aim was to study craniofacial growth and prevalence of hypodontia in individuals born with VWS and to compare these with matched controls with and without a cleft. The null hypothesis was that there is no difference in craniofacial growth or in the prevalence of hypodontia in patients with VWS and matched controls.
Material/Methods
This retrospective case-control study included 20 individuals born with VWS (6 girls, 14 boys). All were clinically diagnosed, born between 1978 and 2006, had various types of clefts, and were or are being treated at the craniofacial centers in Stockholm, Gothenburg, or Malmö. Inclusion criteria required each individual to have at least one high-quality orthopantomogram and two high-quality lateral cephalograms, taken at two different ages during growth, preferably at 10 and 16 years of age.
For each individual born with VWS, one individual with NSCL/P (matched for age, sex, and cleft type) and one healthy control without a cleft (matched for age and sex) were recruited. The controls born with NSCL/P were obtained from the clinic at Karolinska University Hospital in Stockholm, and the healthy controls (CTR) were drawn from a historical archive of Swedish children and adolescents with normal occlusion and no history of orthodontic treatment.23,24
In each cleft group, bilateral CLP (BCLP) was observed in 8 individuals (40%), unilateral CLP (UCLP) in 6 individuals (30%), CP in 4 individuals (20%), cleft lip and alveolus (CLA) in 1 individual (5%), and cleft soft palate in 1 individual (5%). All individuals diagnosed with VWS had lip pits.
Cephalometric analysis was performed on the 13 triplets (VWS, NSCL/P, CTR) who had cephalograms taken at ages 10 (T0) and 16 (T1), to form a homogeneous group followed throughout pubertal growth. Triplets with cephalograms taken at other ages were excluded. The reference points used are defined by Solow and Tallgren and Legan and Burstone and shown in Figure 1.25,26 Skeletal and soft tissue angular and linear measurements were recorded, as detailed below and illustrated in Figure 1. Hard tissue measurements: NSBa, SNA, SNB, ANB, NSL/NL, NSL/ML, NL/ML, posterior facial height, gonial angle, maxillary and mandibular length; dentoalveolar measurements: Ils/NL, Ili/ML; soft tissue measurements: upper Lip-E, facial convexity. The program Viewbox 4.0.1.7 (dHAL Software, Kifissia, Greece) was used for the cephalometric analysis. All radiographs were taken using a standardized protocol with the patient in a natural head position. Different X-ray machines were used; compensation for magnification was applied. One experienced senior orthodontist (MV) traced all cephalograms, which were analyzed digitally under optimal lighting and with a workflow designed to reduce operator fatigue.
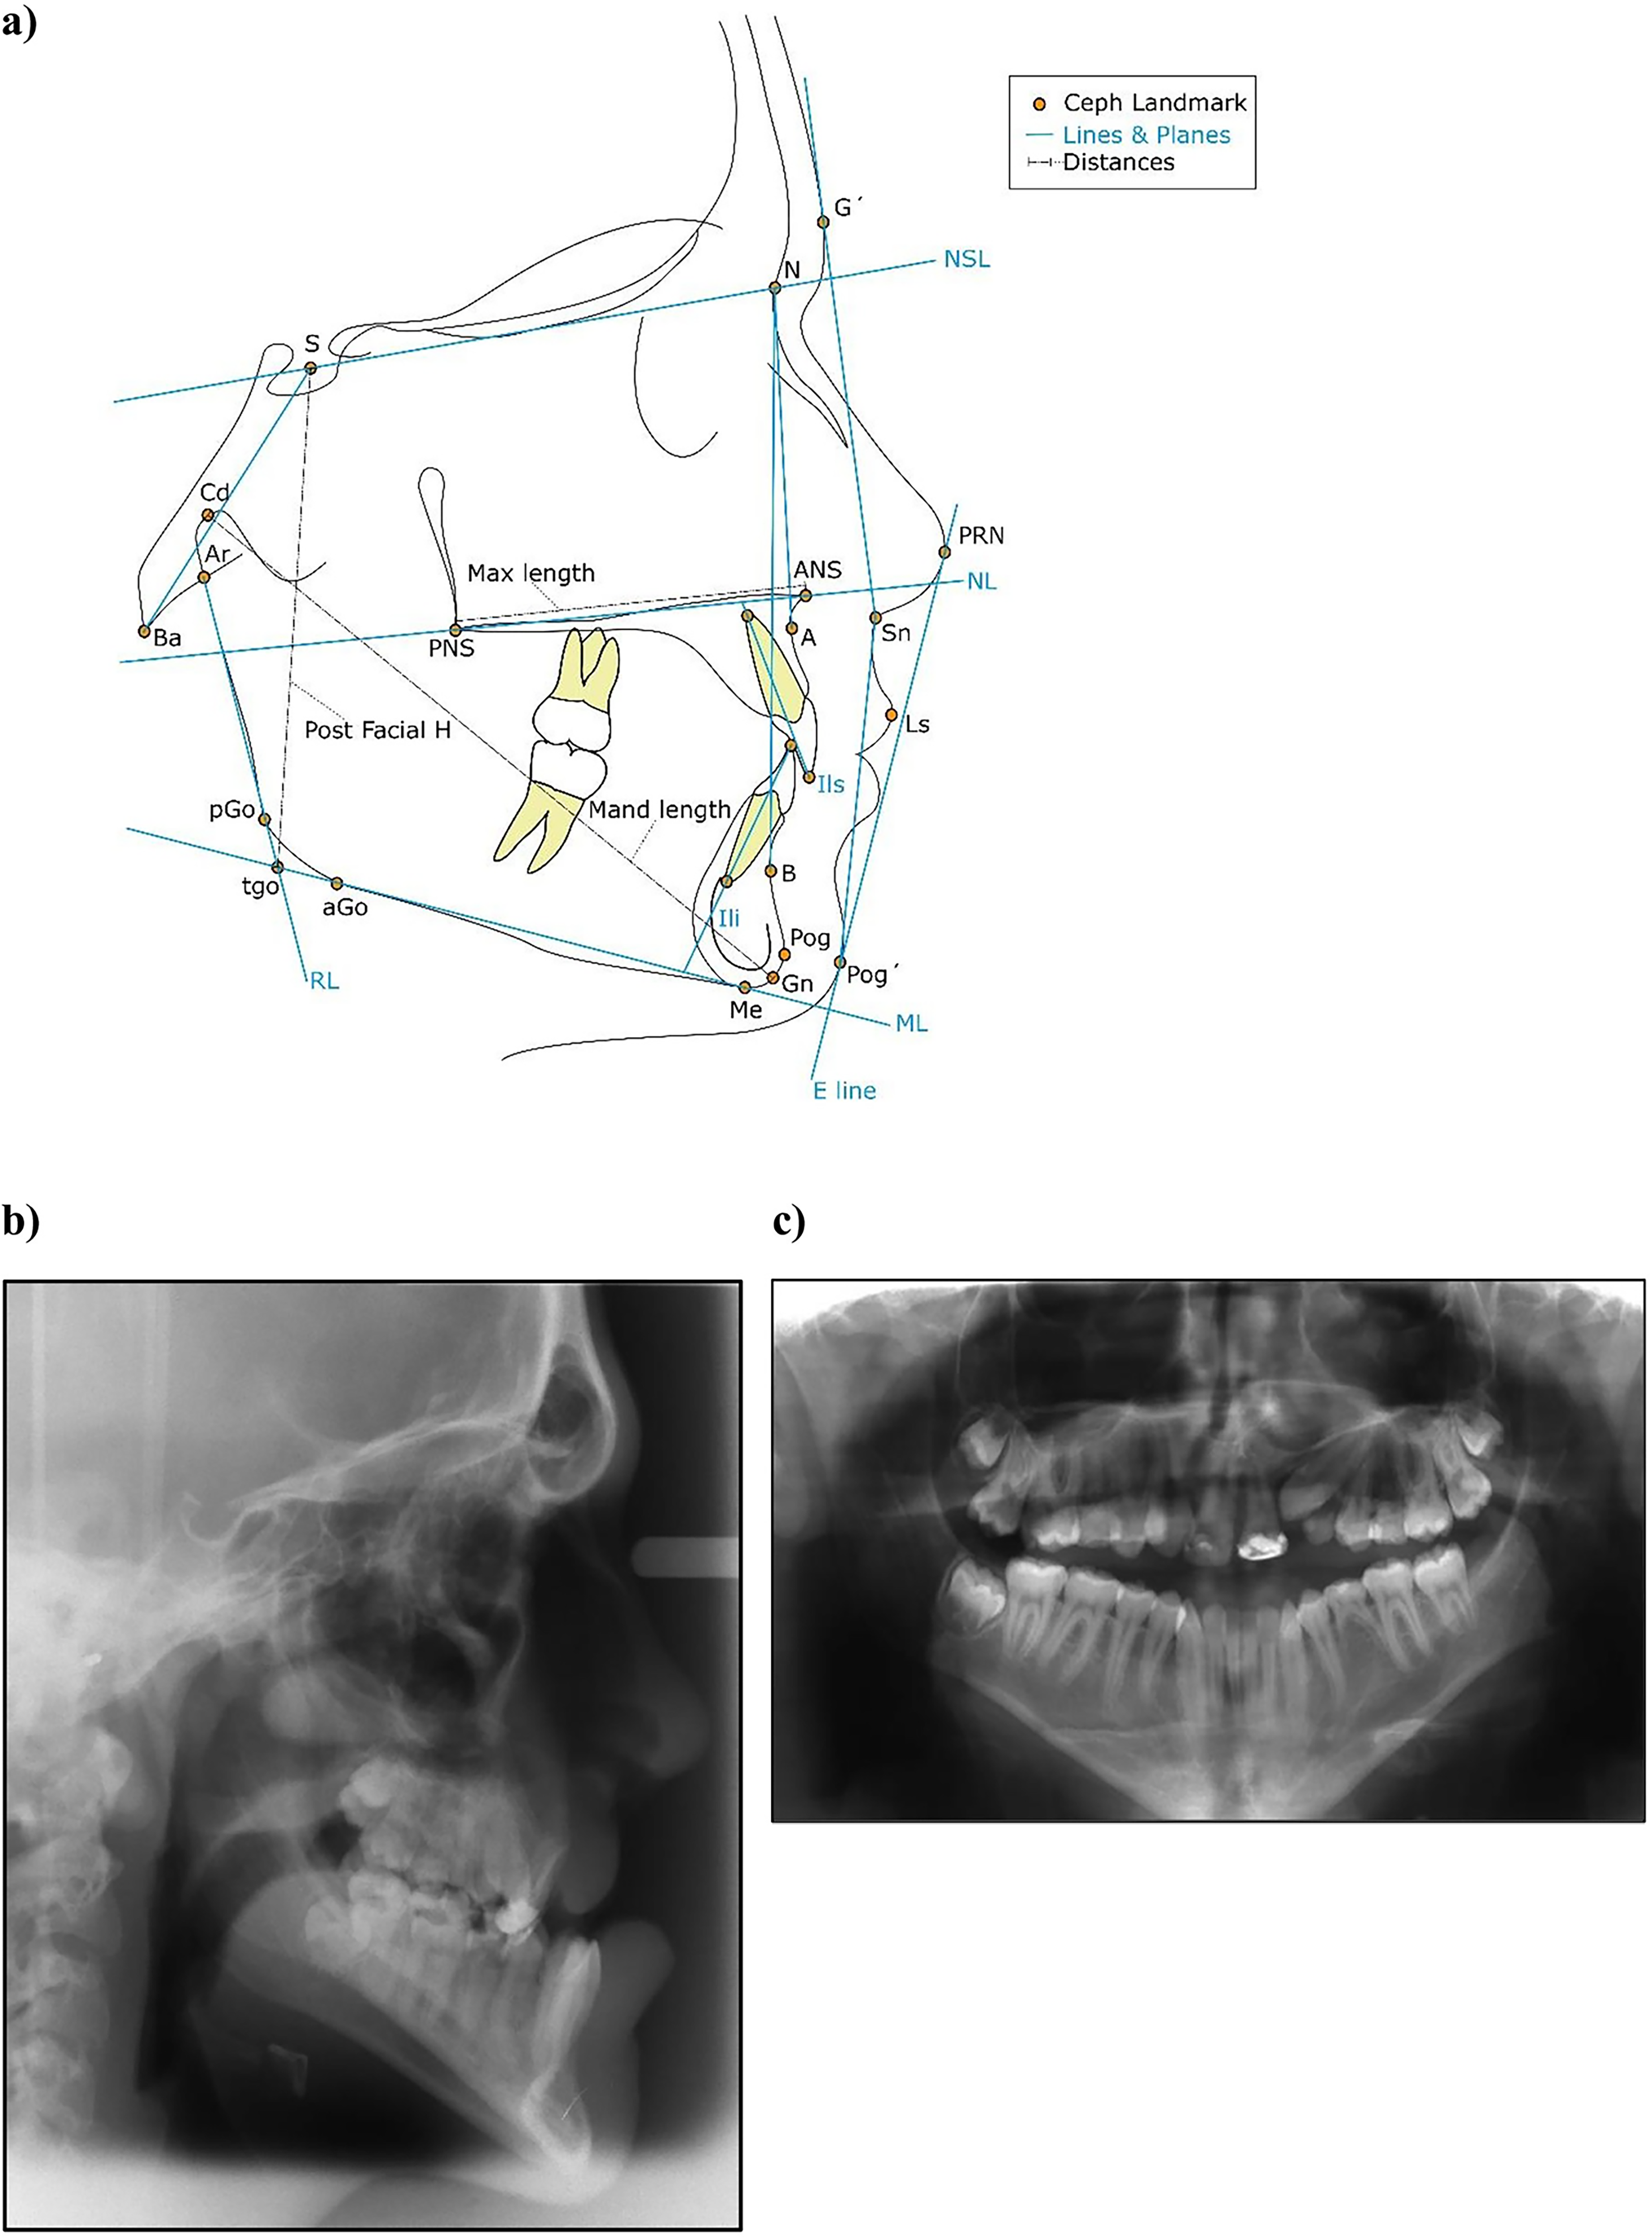
(a) Reference points, lines, and angles used in cephalometric measurements. Hard tissue measurements: NSBa, SNA, SNB, ANB, NSL/NL, NSL/ML, NL/ML, posterior facial height (S-tgo), gonial angle (ML/RL), maxillary length (ANS-PNS), mandibular length (Cd-Gn). Dentoalveolar measurements: Ils/NL, Ili/ML. Soft tissue measurements: upper lip-E (Ls- E line), facial convexity (G-Sn-Pog’) (tgo is the intersection between RL and ML). (b) Cephalometric and (c) panoramic radiograph of a 16-year-old boy born with Van der Woude syndrome and BCLP showing a skeletal class III relation with a retruded maxilla, retroclined incisors, and hypodontia of five permanent teeth (excluding 3rd molars).
For the analysis of hypodontia, the VWS (n = 20) and the NSCL/P (n = 20) groups were compared. The panoramic radiographs were used to study the frequency of hypodontia. The patients’ dental records were, when needed, used to verify these findings. The healthy control group was not included in the analysis of hypodontia, as no panoramic radiographs were available for this group.
Statistics
One experienced senior orthodontist (MV) traced all the cephalograms, and 12 randomly selected lateral cephalograms were traced twice (MV). The intraindividual error of measurement was calculated using Dahlberg's formula 27 and varied between 0.26⁰ (for SNB) and 1.98⁰ (for Ils/NL).
For the cephalometric statistical analysis, the programming language “R” in Version 4.4.0 was used. 28 The Shapiro-Wilk test and Q-Q plots tested the variables’ distribution for normality. The variables’ homogeneity in variance was tested using Levene's test. Means and standard deviations were calculated for descriptive statistics. Line graphs were plotted to depict changes in means between T0 and T1. Since non-normal distributions were found, we proceeded with non-parametric tests to estimate differences between groups using the Kruskal-Wallis test, followed by the Dunn test. The family-wise error rate was controlled using the Holm-Bonferroni method. 29
For the statistical analysis of hypodontia descriptive statistics and Mann-Whitney U-test were performed using the programs GraphPad Prism and Excel.
The statistical significance level was set at P < 0.05. Due to the low incidence of the syndrome, we included all individuals born with VWS that were available at our centers and fulfilled the inclusion criteria.
Ethical Approval
The research protocol was approved by the Ethics Committee in Stockholm (Dnr. 2009/2095-31), with written informed consent waived. Principles outlined in the Declaration of Helsinki were followed.
Results
Craniofacial Growth
The 13 individuals born with VWS and the controls included in the cephalometric analysis did not differ in cleft type, gender distribution or in age at T0 (10y) and T1 (16y). Mean and range are shown in Table 1.
Baseline Demographic Data for the 13 Triplets Included in the Growth Analysis (VWS / NSCL/P / CTR).
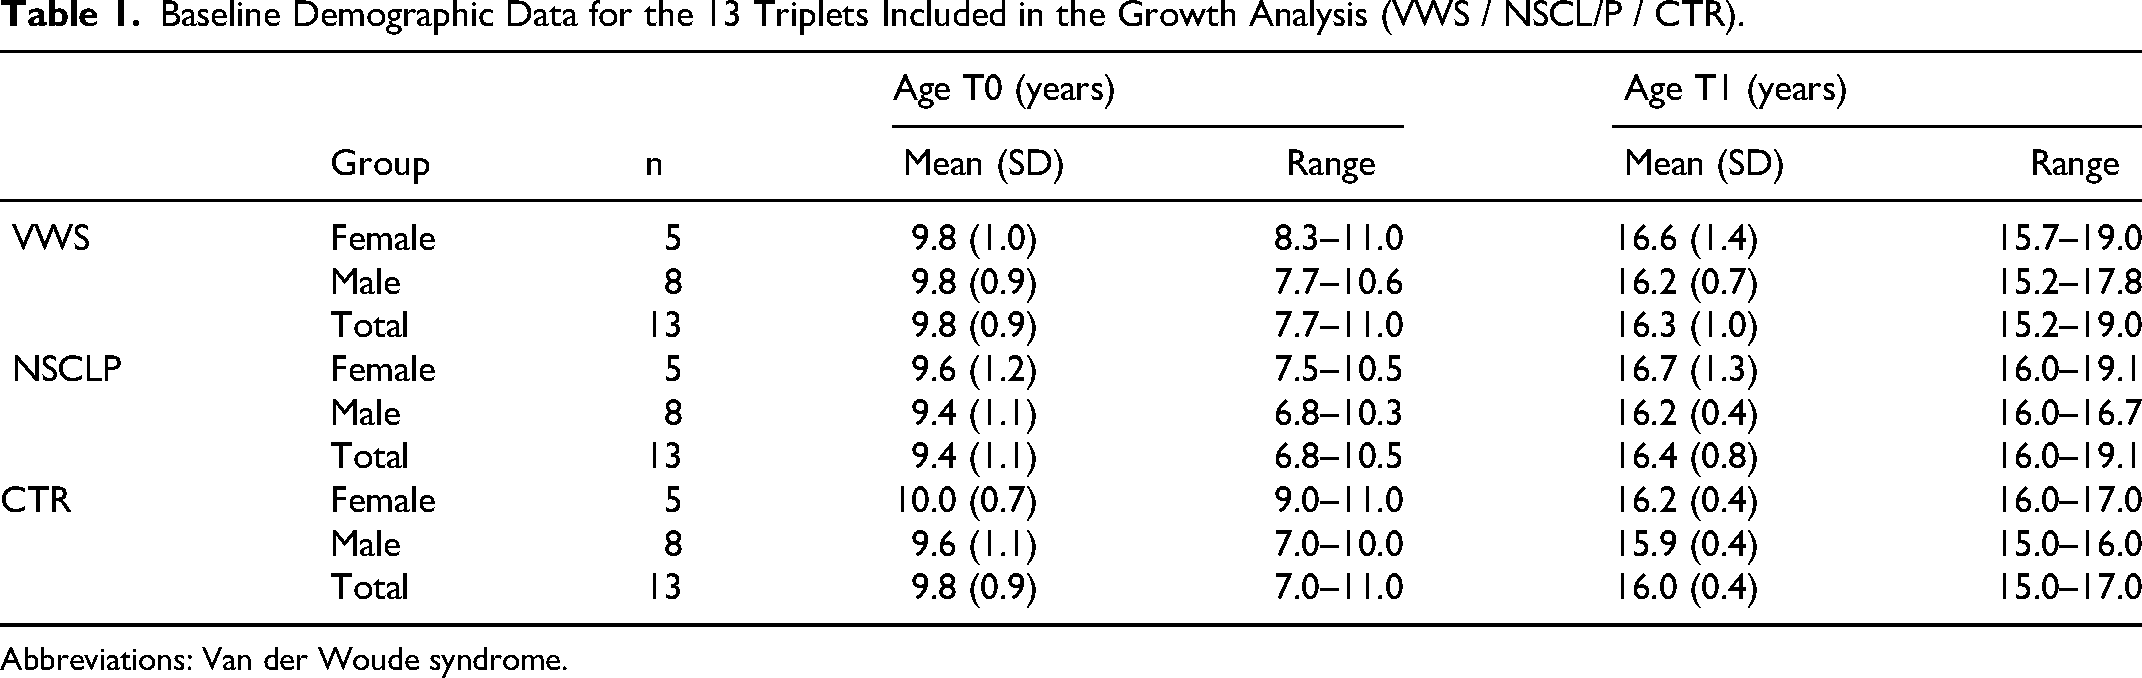
Abbreviations: Van der Woude syndrome.
Descriptive statistics of cephalometric data at T0 and T1 and the cephalometric changes over time of interest are shown in Tables 2 and 3.
Mean and Standard Deviations (SD) of Cephalometric Data at T0 (10 Years) and T1 (16 Years) for the VWS (n = 13), NSCL/P (n = 13), and CTR (n = 13) Groups.
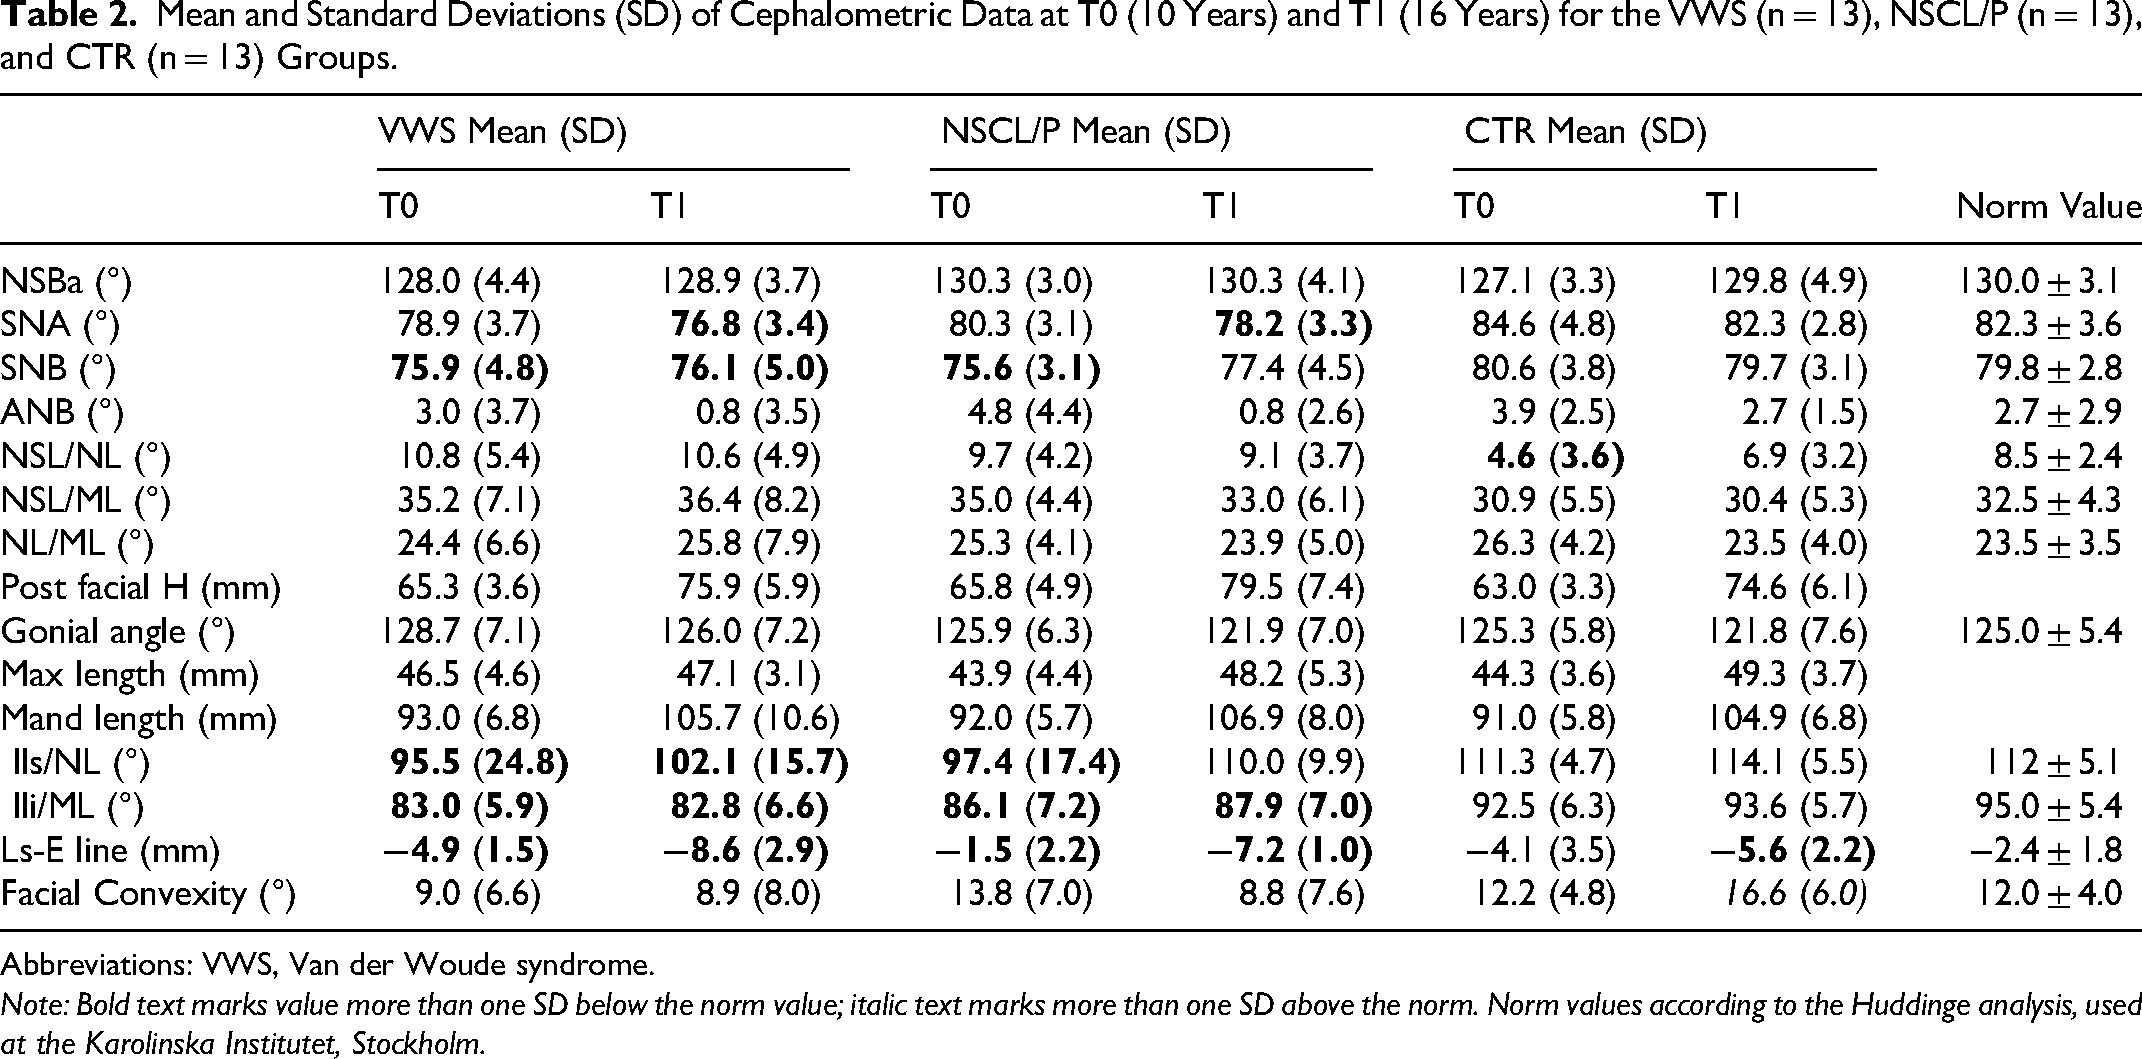
Abbreviations: VWS, Van der Woude syndrome.
Note: Bold text marks value more than one SD below the norm value; italic text marks more than one SD above the norm. Norm values according to the Huddinge analysis, used at the Karolinska Institutet, Stockholm.
Cephalometric Changes (Δ) Between T0 (10 Years) and T1 (16 Years) for the VWS (n = 13), NSCL/P (n = 13), and CTR (n = 13) Groups.
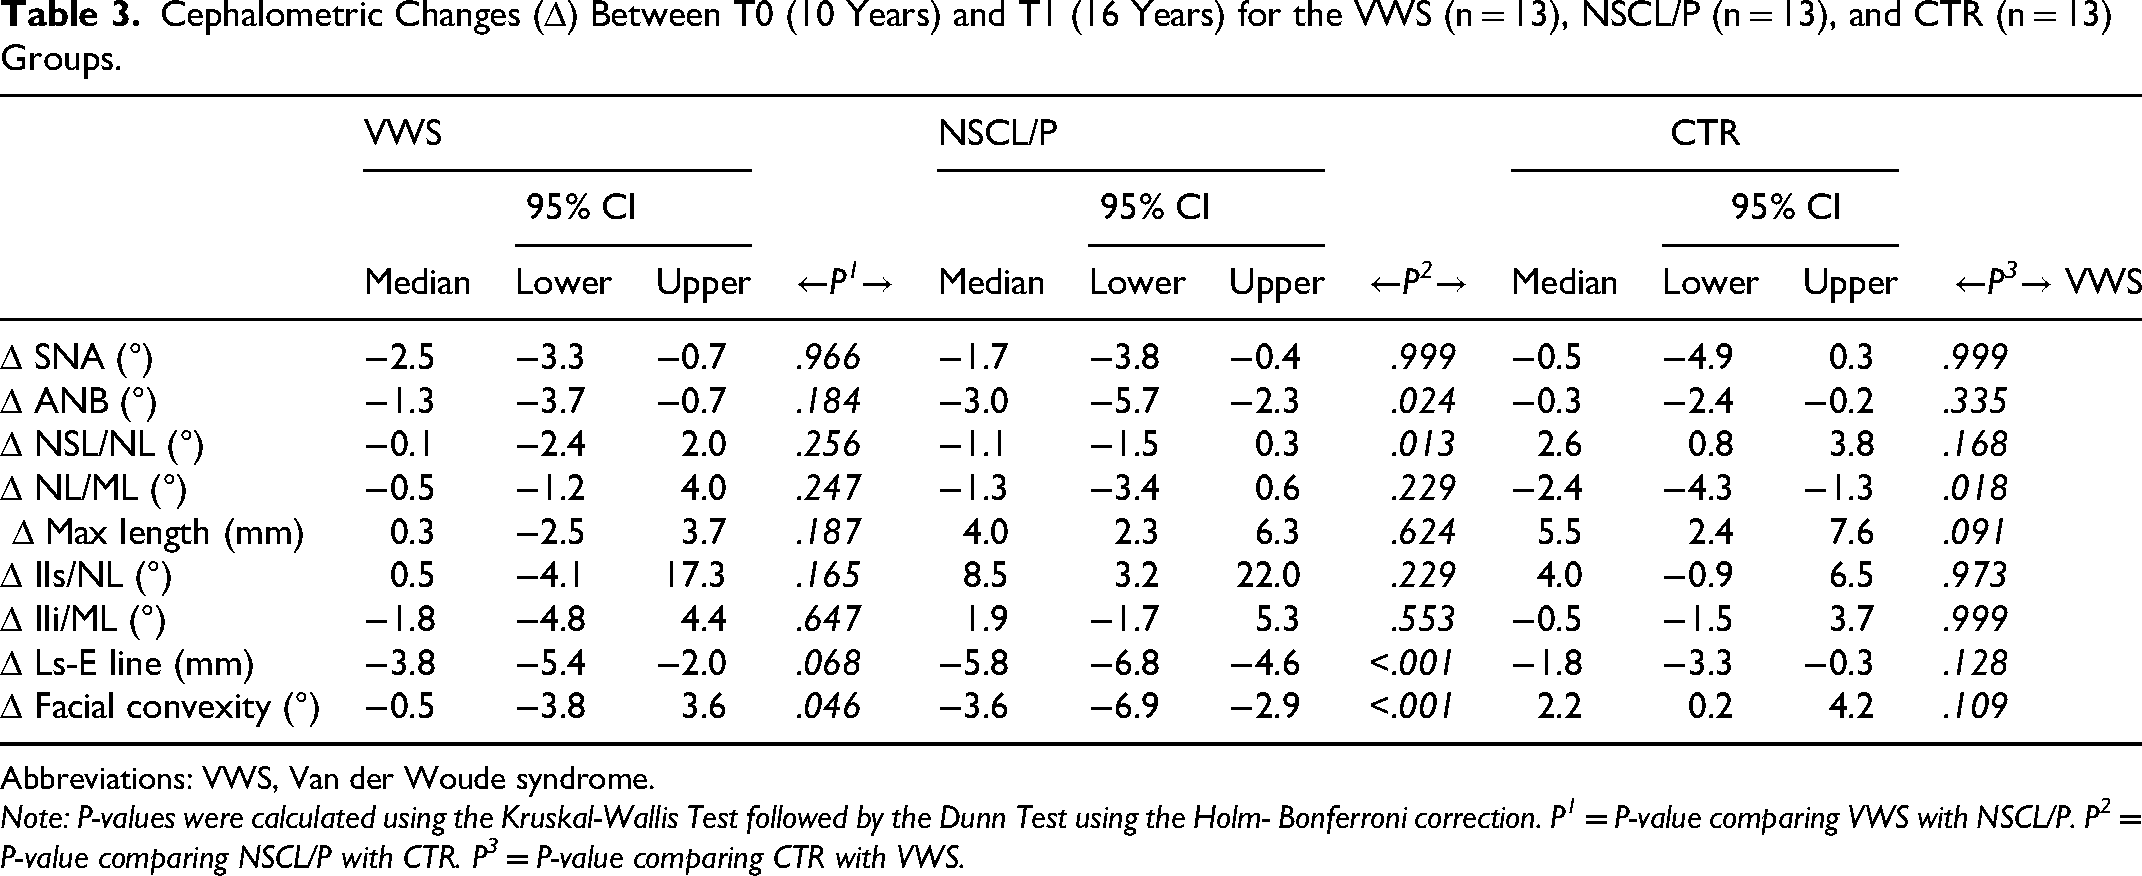
Abbreviations: VWS, Van der Woude syndrome.
Note: P-values were calculated using the Kruskal-Wallis Test followed by the Dunn Test using the Holm- Bonferroni correction. P1 = P-value comparing VWS with NSCL/P. P2 = P-value comparing NSCL/P with CTR. P3 = P-value comparing CTR with VWS.
The mean value of SNA at 16 years, both for the VWS and the NSCL/P group, was more than 1 SD below the norm (76.8⁰ and 78.2⁰ respectively), while the CTR group had a normal value (Figure 2a, Table 2).
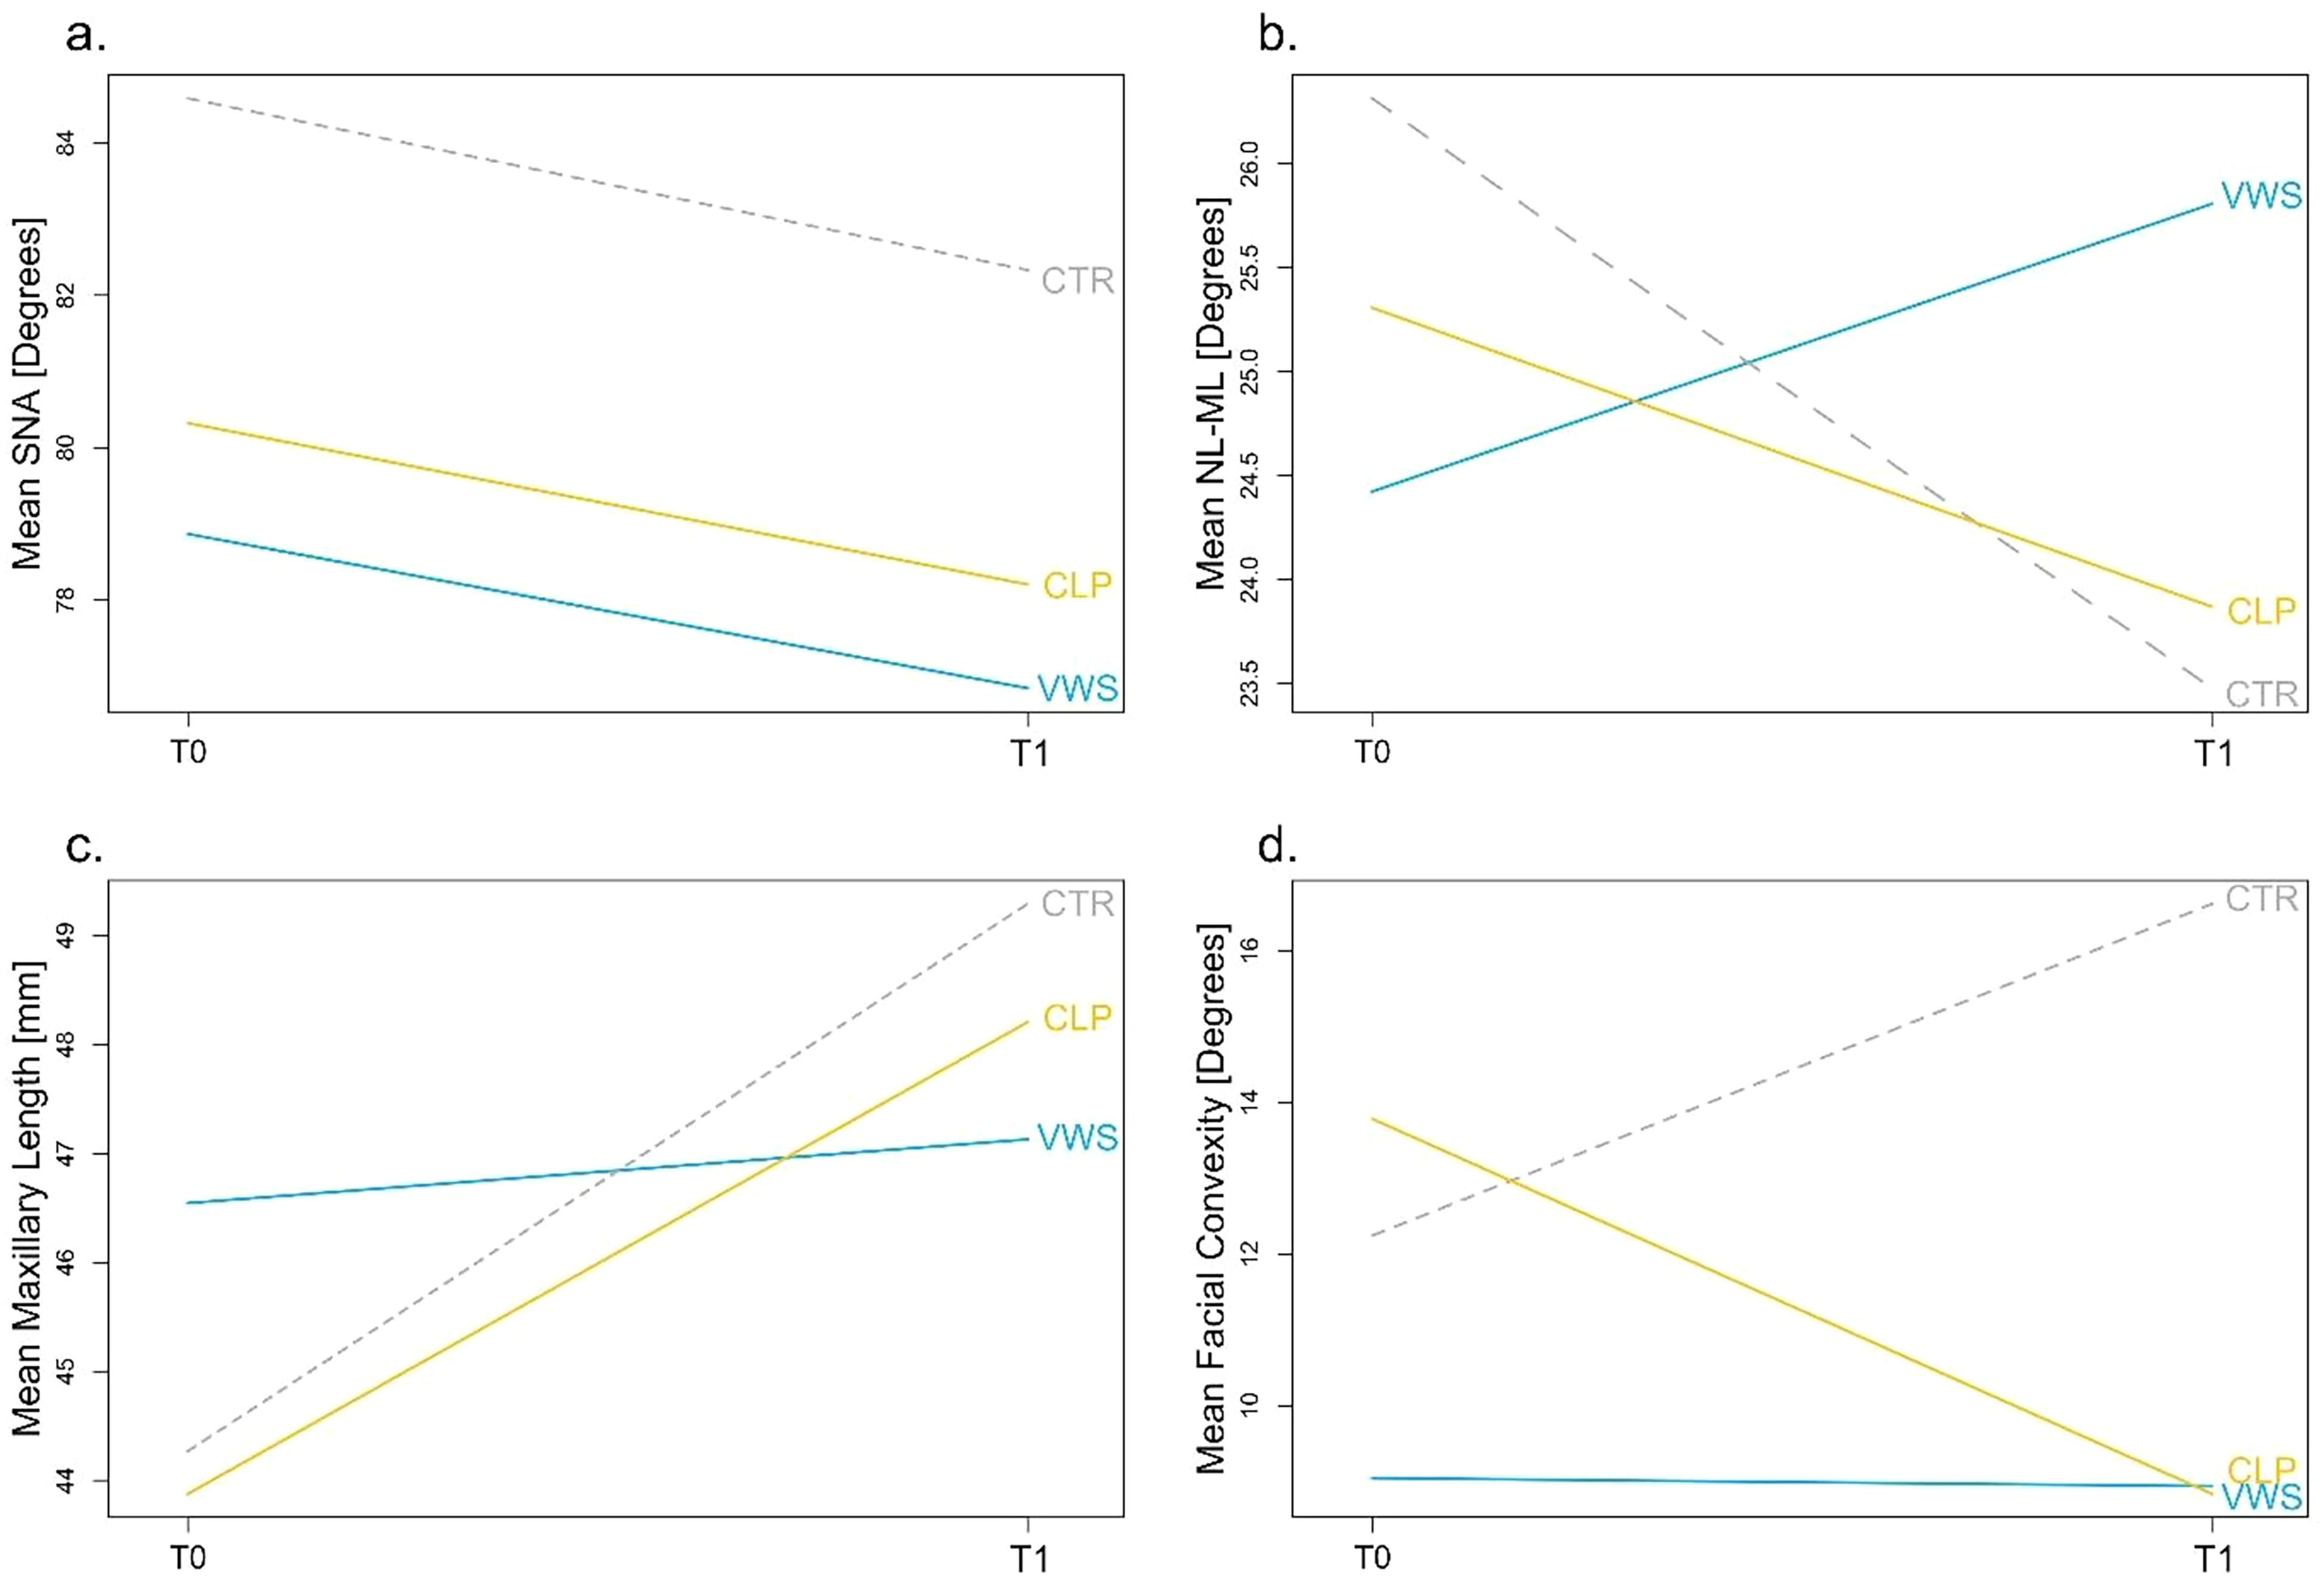
Change from T0 to T1 (10 to 16 years) for the VWS group (blue line), NSCL/P (CLP) group (yellow line) and CTR group (gray dotted line) for: (a) maxillary protrusion (SNA), (b) vertical jaw relation (NL/ML), (c) maxillary length, (d) soft tissue facial convexity (G-Sn-Pg’).
SNB was more than one SD below the norm value at T0 for both cleft groups, but at T1 only the VWS group had a retrognathic mandible (SNB 76.1⁰).
For the change in the inclination of the maxilla (ΔNSL/NL), there was a statistically significant difference between the CTR group (+2.6⁰) and the NSCL/P group (−1.1⁰), where the CTR group had a posterior rotation of the maxilla from T0 to T1, normalizing the inclination at T1 for this group.
The inclination of the lower incisors was more than 1 SD below the norm for both cleft groups at T0 and at T1.
Regarding the change of upper lip protrusion (ΔUpper lip to E-line), a statistically significant difference was seen between the NSCL/P and the CTR group (−5.8 mm and −1.8 mm, respectively). The VWS group also had a decrease in protrusion of the upper lip over time, and at T1 (16y), the upper lip was more retruded in the VWS group (−8.6 mm) compared to the NSCL/P (−7.2 mm) and the CTR group (−5.6 mm). All three groups had values more than one SD below the norm (Table 2).
Hypodontia
In the VWS group 90% (18/20) of the individuals had hypodontia (with at least one missing tooth) compared to 60% in the NSCL/P group. There were more than twice as many in the VWS group compared to the NSCL/P group that had hypodontia outside the cleft area (65% and 30%, respectively). 85% of the VWS group had hypodontia in the maxilla compared to 55% in the NSCLP group.
There was a statistically significant difference in the number of missing teeth (hypodontia) between the VWS group and the NSCL/P group, in total (Median: 2.0 and 1.0. P = 0.0011), outside the cleft area (Median: 1.5 and 0.0. P = 0.0045), and in the maxilla (Median: 2.0 and 1.0. P = 0.0032) (Figure 3).
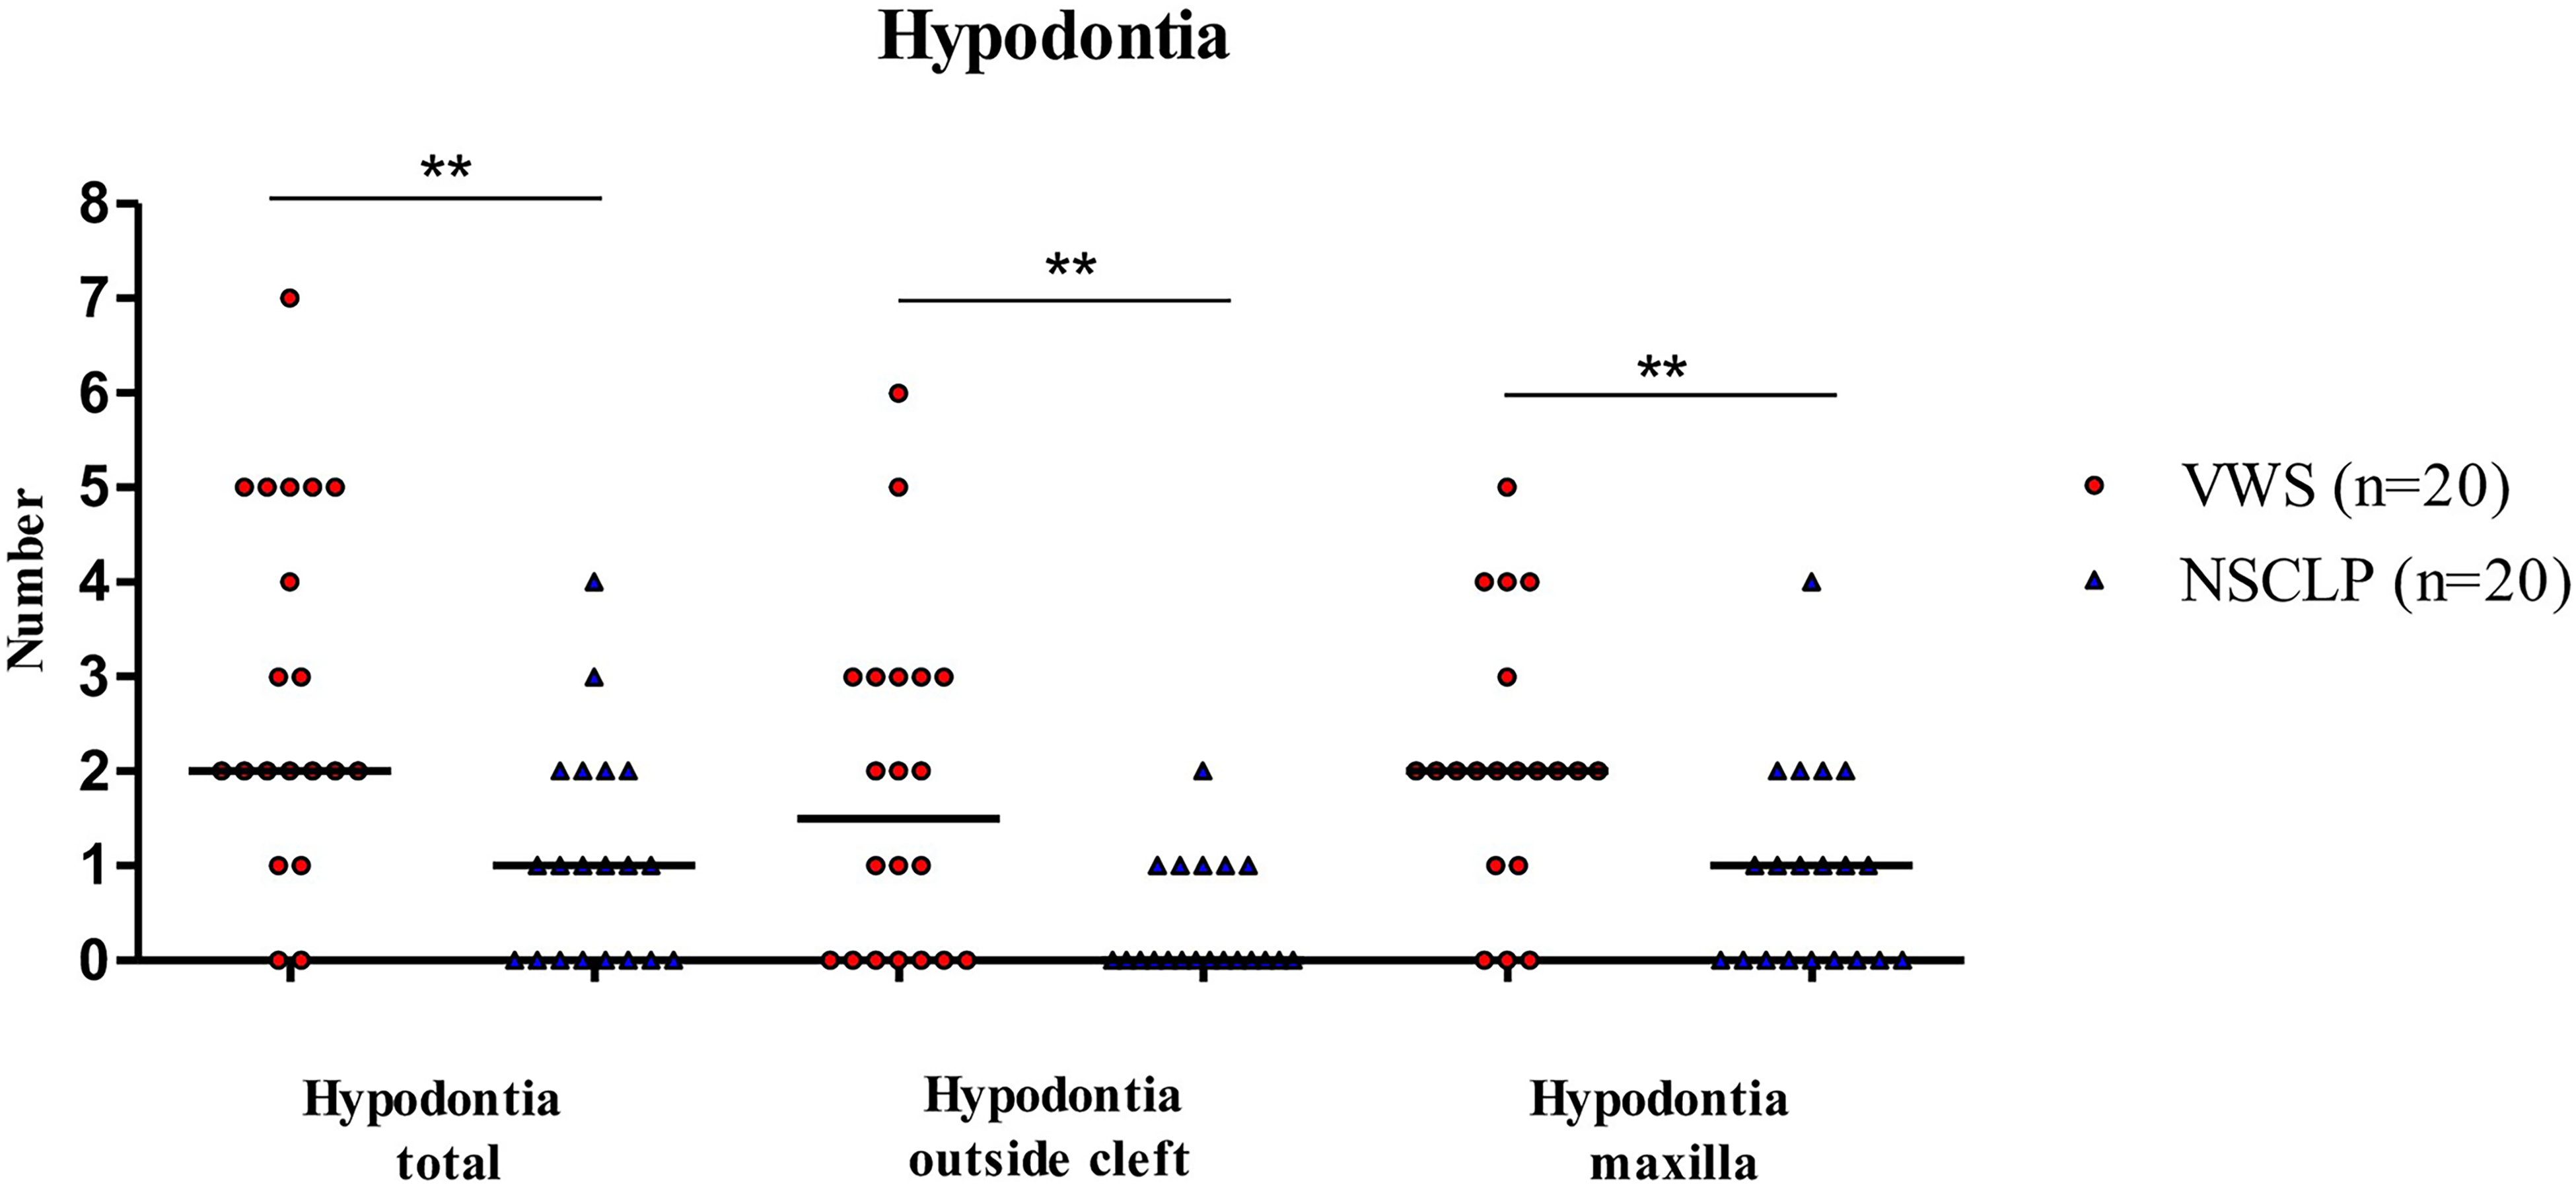
Hypodontia in the VWS group (red circle) and in the NSCL/P group (blue triangle) shown in total, outside the cleft, and in the maxilla. Horizontal bars indicate median values. Comparisons between independent groups were performed using the Mann-Whitney U test. (**P < 0.01).
Discussion
Individuals in this study born with VWS show a restricted maxillary growth during puberty. Until today, only a few studies have been covering this subject.15,16,18,30
The main finding of this study is that children born with VWS had almost no anterior growth of the maxilla during puberty (from 10 to 16 years of age). This reduced maxillary growth agrees with the findings in the studies by Kane et al and Oberoi and Vargervik.16,21 Reardon et al also found a higher prevalence of midface retrusion (61%) in individuals born with VWS and a cleft compared to a control group with NSCL/P (21%). 30 In a study by Heliövaara et al, no difference was found in craniofacial morphology between 44 children with VWS and a control group with non-syndromic cleft. 20 However, in that study, only children with an isolated CP were included (in contrast to the cleft diagnoses in our group), and the mean age was only about 6 years, several years before the pubertal growth spurt. Also, in the study by Estévez-Arroyo et al who found a larger ANB in their VWS group compared to NSCL/P controls, the included individuals were younger (mean age ∼12y), and only 7 patients with VWS were included. 22 Even in the study by Kane et al, it was only in the oldest group (13 years or older, n = 4) where they found a reduced maxillary length in the VWS group. 21 So, it is important to wait until growth has ceased until any difference in craniofacial growth can be evaluated.
At 16 years of age, both cleft groups exhibited SNA values more than 1 SD below the norm, with a tendency toward smaller values in the VWS group (76.8° vs. 78.2°). This tendency toward a more retrognathic maxilla in the VWS group was also found by Oberoi and Vargervik, although their study included younger individuals. 16
A slightly retrognathic mandible was observed in both cleft groups at 10 years of age, but at 16 years of age only the VWS group had an SNB below the norm value. This may be partly explained by the tendency for a more vertical growth pattern in the VWS group, which shows a slightly more posteriorly inclined mandible (NSL/ML 36.4⁰) compared with the NSCL/P and the CTR groups (33⁰ and 30.4⁰, respectively), a pattern also reported in previous studies of younger cohorts.16,22
For the decrease in ANB during puberty, a statistically significant difference between the NSCL/P group (−3⁰) and the CTR group (−0.3⁰), but not for the VWS group was found. However, at 16 years of age, the VWS group and the NSCL/P group had the same ANB value (0.8⁰), almost reaching one SD below the norm value. The tendency for a smaller ANB and a skeletal class III tendency for individuals born with a cleft has been shown in earlier studies.31,32
Concerning soft tissues, the decrease in convexity was most pronounced for the NSCL/P group, but at 16 years of age, the two cleft groups showed similar convexity with a somewhat straight profile. At 10 years of age, the VWS group already exhibited a tendency toward a straight profile, and the lack of decrease in convexity probably have been influenced by the slightly vertical growth pattern (Figure 2d). The same pattern was seen for the change of upper lip protrusion where a statistically significant difference in change of protrusion between the NSCL/P and the CTR group (−5.8 mm and −1.8 mm respectively) was found, but interestingly at 16 years of age the upper lip was still more retruded in the VWS group (−8.6 mm) compared to the NSCL/P group (−7.2 mm). This was also demonstrated by Oberoi and Vargervik in their group of 10-year-old individuals born with VWS. 16
Regarding agenesis of teeth, it has been shown that individuals born with VWS have a higher prevalence of hypodontia compared to individuals born with NSCL/P.15,16 Our study supports this as 90% of the included individuals born with VWS and a cleft have hypodontia compared to 60% in the NSCL/P group. Twice as many in the VWS group had hypodontia outside the cleft area, compared to the NSCL/P group, which was also seen in the study by Awadh et al. 17 The relatively high number of individuals with hypodontia probably reflects the spread of cleft diagnoses in our group. Seventy percent had a total unilateral or bilateral CLP and 5% had a cleft of the alveolus and of these with a diagnosis of VWS 100% had hypodontia. This agrees with the findings by Oberoi & Vargervik who also found that all individuals born with VWS and UCLP or BCLP had hypodontia. 16 The only individuals born with VWS in this study who did not have hypodontia were two individuals with isolated CP, reflecting a lower prevalence of hypodontia in individuals born with VWS and isolated CP (2/5 = 40%), which is in accordance with the findings by Awadh et al who found that 37% of individuals born with VWS and CP had hypodontia. 17
For the inclination of the upper incisors in the cleft groups, only the VWS group had retroclined incisors at 16 years of age. The more retroclined upper incisors in the VWS group at 16 years might be caused by more scar tissues, a tendency for an open jaw relation, and a higher frequency of hypodontia in this group. Information about orthodontic treatment was not collected, but probably most of the individuals in the cleft groups had had some treatment at the age of 16 years, and for the CTR group, there was no history of orthodontic treatment or hypodontia. One might speculate that it would be more difficult to open spaces (for prosthetic substitutions) and procline the incisors if there are more missing teeth, as in the VWS group. Antonarakis and Fisher found that individuals with UCLP and hypodontia had a more constricted upper arch (more negative Modified Huddart/Bodenham score) and more deficient maxillary growth compared to those without hypodontia. 33
Limitations of this study are the retrospective design of the study that builds in risk for biases. It would also be preferable to include more individuals with VWS, but this is the problem when studying an uncommon syndrome. A larger multicenter study and a longer follow-up period are future solutions. As this is a national multicenter study, individuals with VWS from other clinics in Sweden were included, so different surgeons and different surgical protocols were used, which might influence the results. However, in the large multicenter Scandcleft study (which included three Swedish cleft centers), no major differences in maxillary growth were observed at 8 years of age when comparing four different surgical protocols for primary palatoplasty in individuals born with UCLP. 34 The inclusion of multiple cleft types, influenced by the limited sample size, also represents a limitation; however, the matching performed was intended to compensate for this.
The strength of this study is that the same individual was followed longitudinally over the pubertal growth spurt, up to the age of 16 years and with more included individuals than in earlier studies of individuals born with VWS. For example, in the study by Kane et al, only 4 out of 17 included individuals with VWS had cephalograms analyzed at the age of 13 or older and in the studies by Heliövaara et al, Oberoi and Vargervik and Estévez-Arroyo et al, the age at follow-up was even younger.16,20-22
Individuals in this study born with VWS have a high prevalence of hypodontia and show reduced maxillary growth during puberty. Genetic factors (mutations in IRF6/GRHL3) in this group might influence growth, directly and by healing defects and scar tissues after reparative surgery and the high prevalence of hypodontia may add to the restriction of the maxilla. 18 These factors probably give rise to a higher treatment need with a higher risk for orthognathic surgery. Earlier studies on individuals with NSCLP have shown a higher risk for aggravated skeletal class III and a need for orthognathic surgery with more hypodontia.35,36 All these factors are important to have in mind in treatment planning and when giving information to patients born with VWS and to their parents.
In future studies, it will be important to include the evaluation of dental relationships (eg, overjet, overbite, transverse relationships), extractions performed and the need for orthodontic treatment, with or without orthognathic surgery, after growth completion, as well as a larger sample size.
Conclusion
Individuals born with VWS and a cleft, have reduced growth of the maxilla during puberty and a statistically significantly higher prevalence of hypodontia compared to controls with NSCL/P in the studied population. Initial analyses demonstrated significant intergroup differences in maxillary growth; however, significance was lost after adjustment for multiple comparisons. The null hypothesis, that there is no difference in craniofacial growth or in the prevalence of hypodontia in patients with VWS and matched controls, is accepted for craniofacial growth but rejected for prevalence in hypodontia.
Footnotes
Acknowledgements
We would like to acknowledge Sara Rizell (Department of Odontology, Sahlgrenska Academy, University of Gothenburg, Sweden), Ingemar Swanholm (Faculty of Odontology, Malmö University, Sweden), and Mauritz Persson and Nameer Al-Taai (Department of Odontology, Umeå University, Sweden) for helping us collect and giving access to X-rays for our study.
Ethical Approval
The research protocol was approved by the Ethics Committee in Stockholm (Dnr. 2009/2095-31), with written informed consent waived. Principles outlined in the Declaration of Helsinki were followed.
Funding
The author(s) disclosed receipt of the following financial support for the research, authorship, and/or publication of this article: This work was supported by The European Orthodontic Society and by The Swedish Freemasons’ Foundation for Children’s Welfare.
Declaration of Conflicting Interests
The authors declared no potential conflicts of interest with respect to the research, authorship, and/or publication of this article.
Data Availability
The datasets analyzed in the current study are available from the corresponding author on reasonable request.
Authors’ Note
This work was presented as a poster at the 15th International Congress on Cleft Lip/Palate and Related Craniofacial Anomalies, October 20–24, 2025, Kyoto, Japan.