
Abstract
In comparison to their weight, honeycomb composite structures have a high bending stiffness, which makes them very suited for every application such as airplanes, railway-cars and vehicles, where little weight is important. The sandwich panels consist of two thin and stiff aluminum face sheets, which are bonded to a thick and lightweight aluminum honeycomb core. These structures are subjected to dynamic loading. However, in the literature, there are hardly any fatigue properties of the honeycomb core described. The fatigue properties of the core are investigated using the finite element method and experiments. Depending on the load application, the honeycomb core fails either through core indentation or shear failure. For a fatigue prediction, both failure modes have to be investigated. Additionally, the physical behavior of the honeycomb core is depending on the orientation of the core. Hence, fatigue tests were conducted in three directions of the core: the stiffest direction, the most compliant direction and the direction with the highest stresses. A three-point bending test setup was built to study the fatigue properties of the honeycomb core. Several fatigue tests were carried out with a load ratio of R = 0.1 (maximum load 10 times bigger than minimum load) and the fatigue diagrams being illustrated. Additionally, food-cart roller tests (wheels of a cart rolling in a circle on a floor panel) were done to dynamically test the panels in every angle. The sandwich structures were modeled with the ANSYS finite element software. The simulations, which were used to determine the stress amplitudes in the specimens, are described later. In addition, buckling analyses were used to examine core indentation failure. Based on these simulations, failure predictions can be made. The fatigue life of the examined specimens is successfully approximated in this manuscript, with the lifetime analysis being based on the FKM guideline (error less than 14% in load amplitude).
Keywords
Introduction
Description
Honeycomb composite structures are usually used for applications such as airplanes, railway-cars and vehicles, where low weight is important because of the high bending stiffness in comparison to the low weight. The sandwich panels consist of two thin and stiff aluminum face sheets bonded to a thick and lightweight aluminum honeycomb core. (Figure 1) The mechanics of honeycomb sandwich structures have been studied by different authors in the past. Gibson and Ashby (1997) conducted a study about the in-plane and out-of-plane stiffness of honeycomb cores. Staal et al. (2009) investigated different failure modes of bended honeycomb panels. Zhang and Ashby (1992) analyzed the out-of-plane properties of honeycombs. Theoretical stresses and buckling loads are derived in L-, W- and T-direction.
Sandwich structure with honeycomb core. Honeycomb structures are usually subjected to dynamic loading. In the literature, there have been some experimental investigations, but hardly any stimulation-based fatigue predictions have been made though. Sharma et al. (2006) presented a summary of the latest update concerning fatigue in honeycomb and foam-cored sandwich panels. Burman and Zenkert (2000) experimentally investigated the fatigue properties of pre-damaged and undamaged honeycomb beams. Belouettar et al. (2009) conducted an experimental study about the static and dynamic failures of honeycomb sandwich structures. Fatigue studies leading to debonding failure were conducted by Belingardi et al. (2007) and Berkowitz and Johnson (2005). Fatigue failure in the face sheet of sandwich structures was investigated by Bauer (2008). Bianchi et al. (2011) made fatigue analyses with honeycombs subjected to in-plane shear stresses, loading the core in different directions. They found out that the shear strength is minimal at an angle between 50° and 80°. During this project, fatigue tests with failures of the core structure were conducted in parallel with finite element calculations. Tests and simulations were done in the stiffest direction, the most compliant direction and the direction with the highest stresses. It was shown that fatigue life predictions can be made by using finite element simulations and the FKM guideline (Hänel et al., 2003).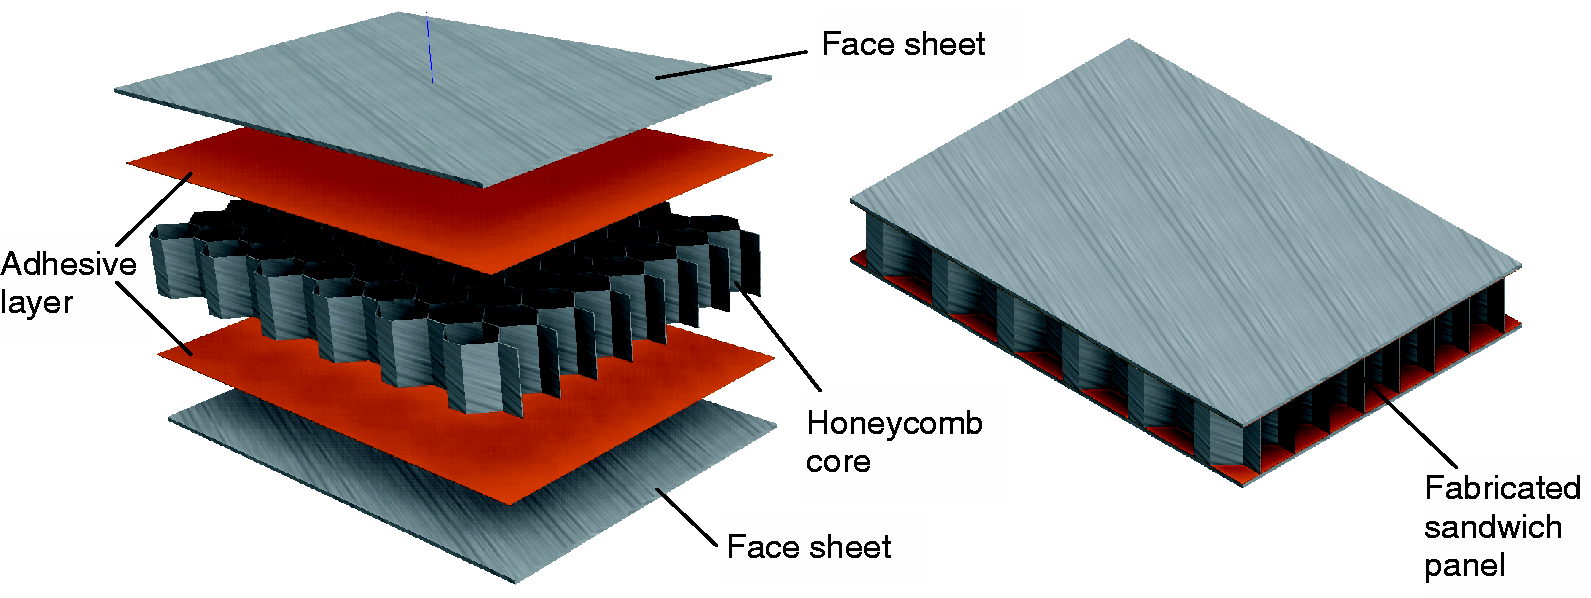
Orientation of the honeycomb core
Since the behavior of the panels is orthotropic, the panels react differently depending on the direction of the loading. So it is necessary to distinguish between the honeycomb core’s three directions of symmetry called L-, W- and T-direction (Figure 2). The other directions can be specified by the angle α, with α = 0° in the L-direction and α = 90° in the W-direction.
Honeycomb core with notations.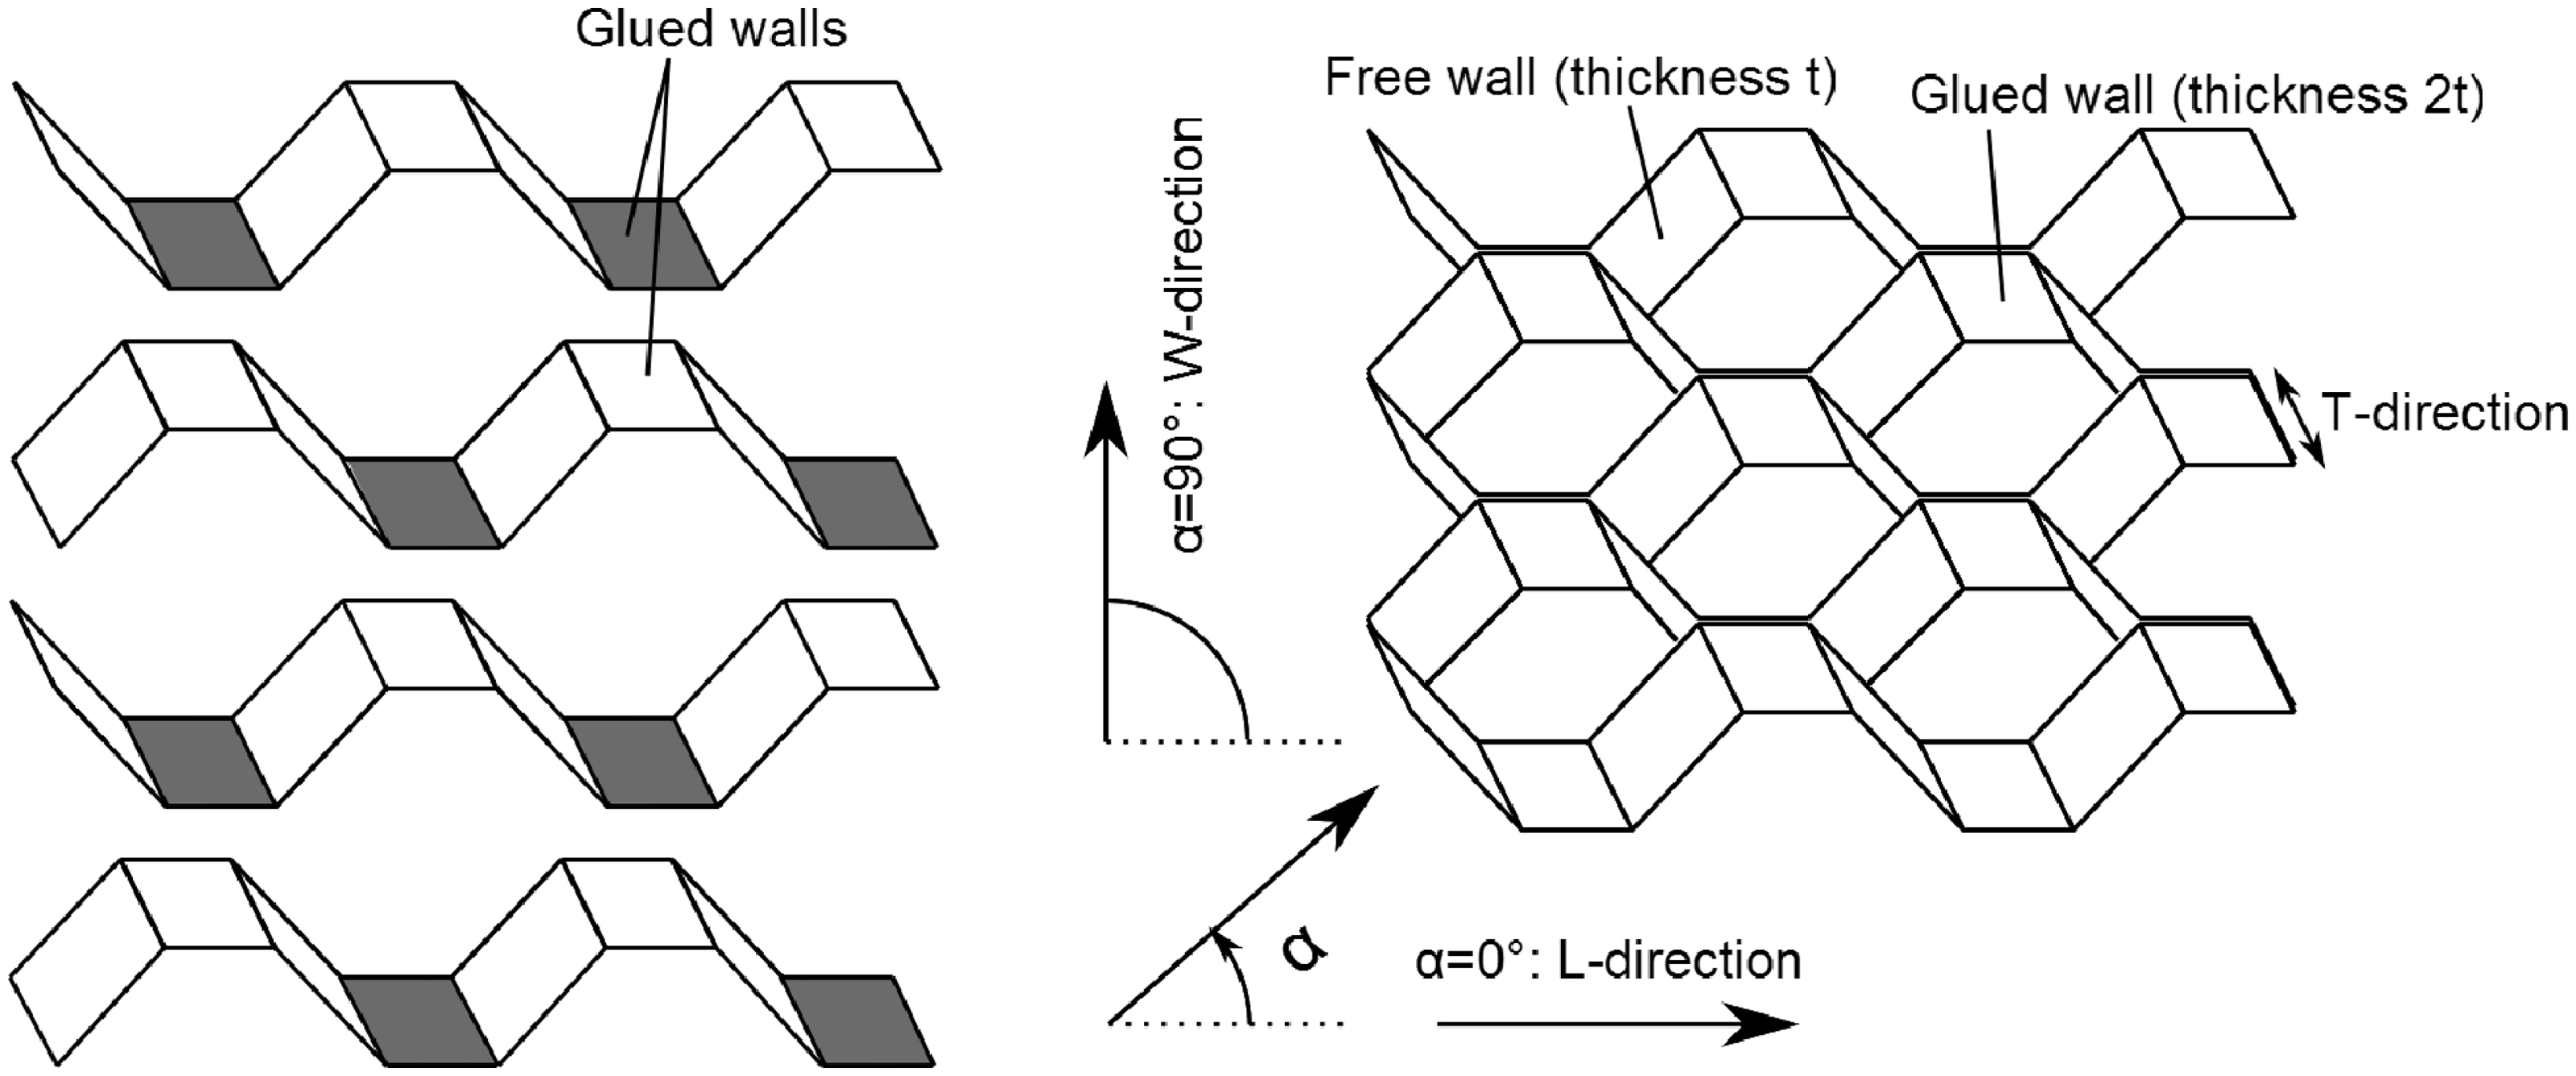
The walls of the honeycomb cells have different wall thicknesses. This is due to the manufacturing process, during which the foils are partly glued together. The glued walls with double thickness are in the L-direction (Figure 2).
Stresses in honeycomb sandwich structures
A sandwich panel, which is exposed to a transverse load, is subjected to different stress types: The face sheets are mainly subjected to tension and pressure loads, and the core to shear and pressure loads. The tensile stress in the face sheets can lead to cracks in the face sheets, which was examined in another project (Bauer, 2008) and is not covered in this report (this failure mode has not occurred in the experiments of this work).
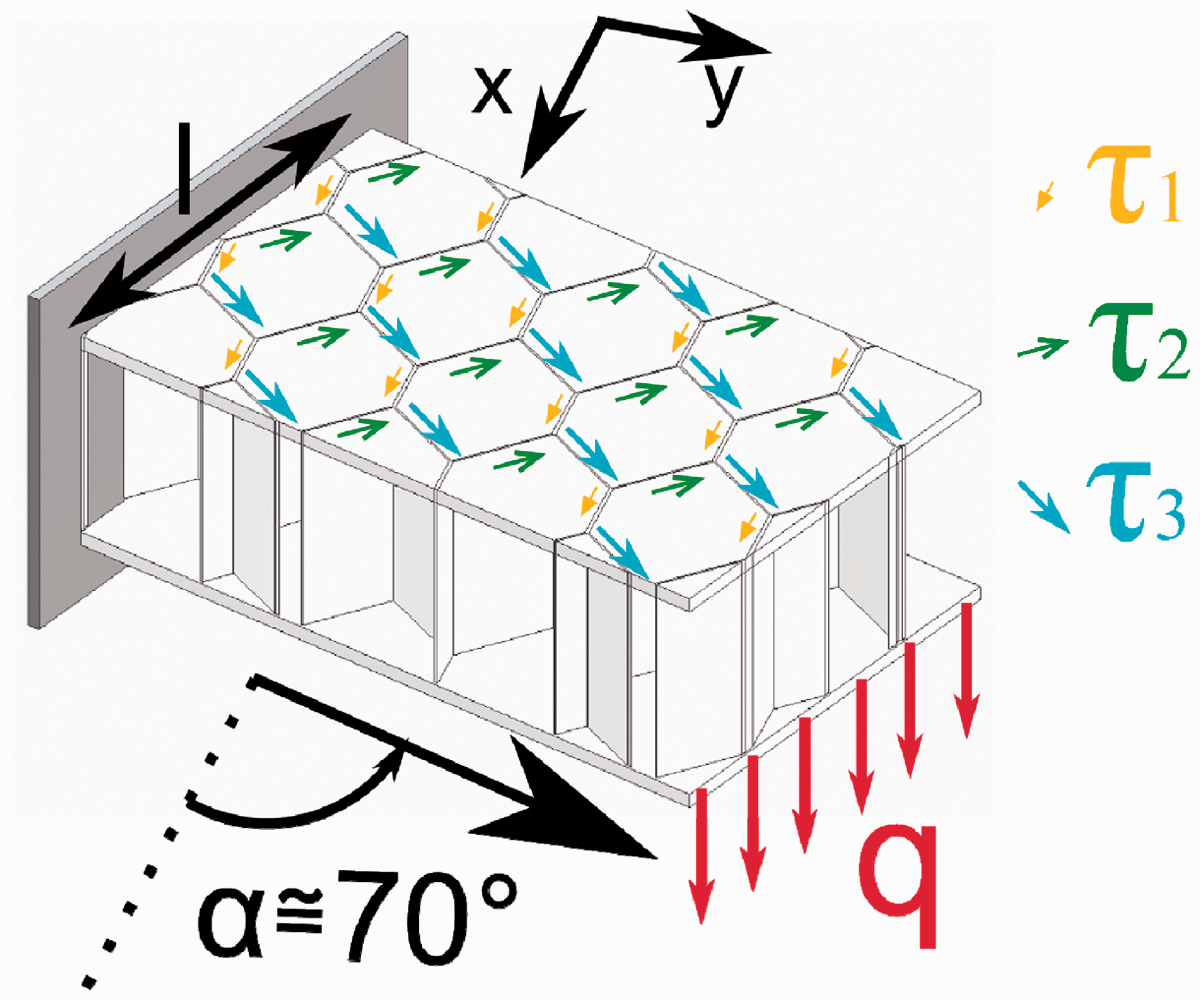
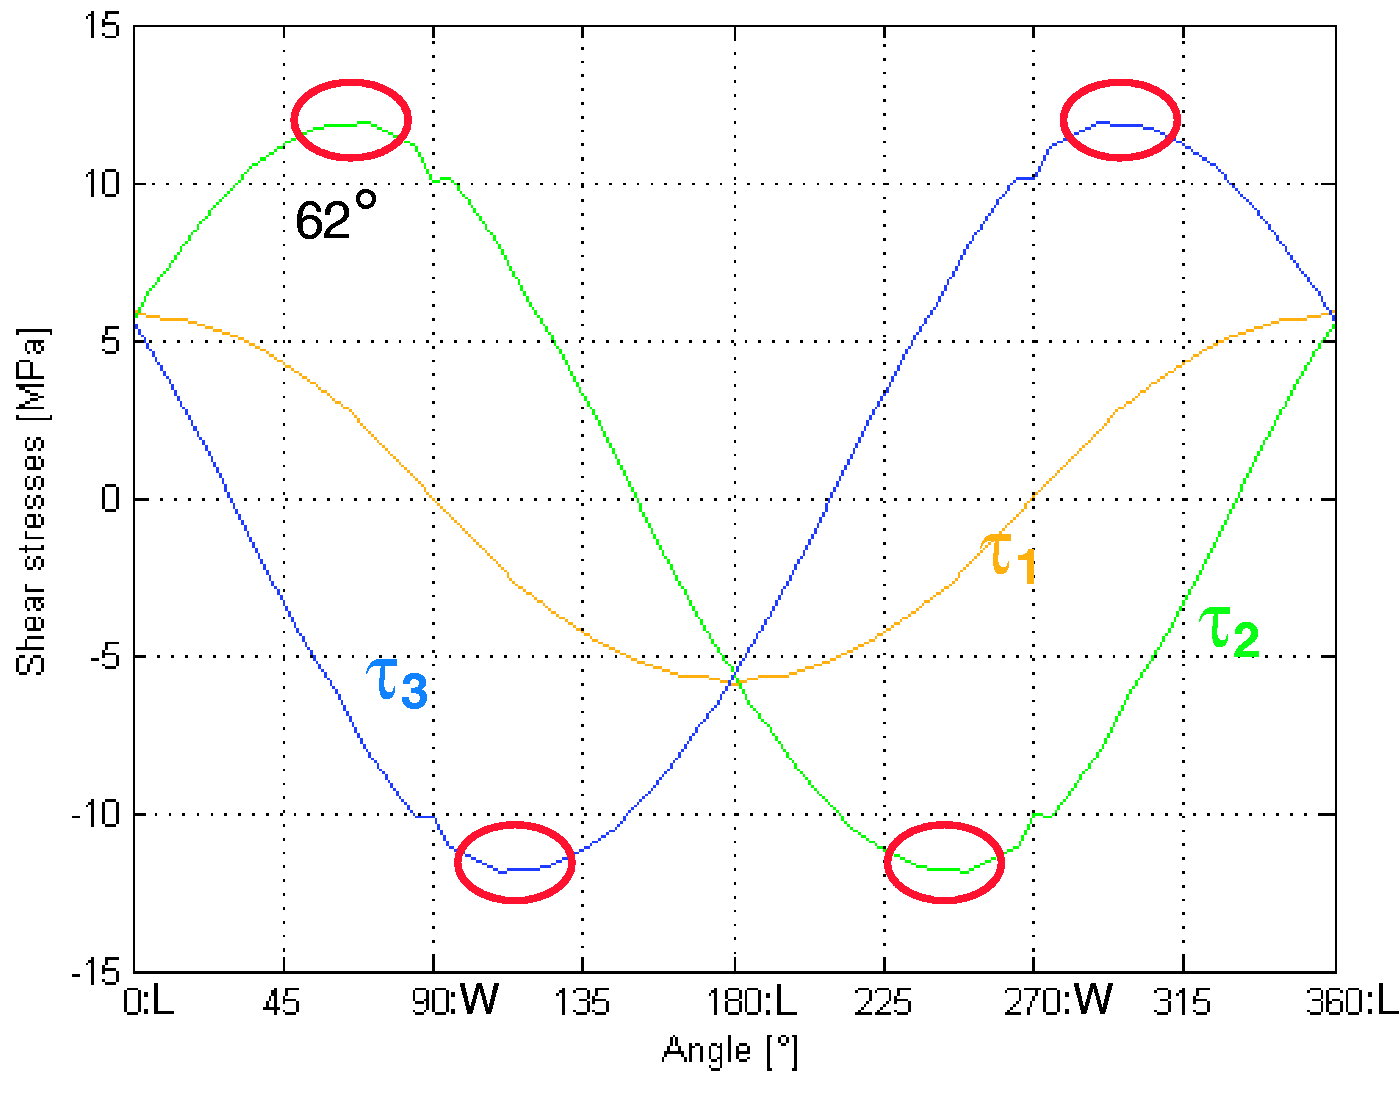
The core of sandwich panels fails usually due to shear or compression stress. The shear and compression stress distribution in a sandwich panel’s core is illustrated in Figure 3 for a typical three-point bending test. Depending on the cell geometry and the load application, the shear or the compression stresses are prevailing with the prevailing type of stress being responsible for the core failure. The distribution of the stresses in Figure 3 was simulated with the ANSYS finite element software. The shear stress is maximal next to the point of the middle force application. The compression stress in the core reaches a maximum just below the middle load. Core indentation occurs when the compression stress surpasses the buckling strength of the honeycomb core. In this case, the structure fails locally due to the core’s buckling (Figure 3). A clamped sandwich structure with a core orientation of α = 70° and loaded by a transverse force q is illustrated in Figure 4. The honeycomb core is composed of three-angle cell walls, which are subjected to different in-plane shear stresses τ1, τ2 and τ3 as shown in Figure 4. Depending on the orientation of the orthotropic core, yet the shear stresses τ1, τ2 and τ3 do not change synchronously. The average stresses of τ1, τ2 and τ3 in dependency of the angle α are illustrated in Figure 5 for a sandwich panel having a width of 76 mm, a cell size of 6.4 mm and a transverse force of 100 N (derivation can be found in Wahl et al., 2012).
Stress distribution and failure modes of the honeycomb core. Top view of a clamped sandwich structure loaded by a transverse force (Shear stresses τ1, τ2 and τ3 are not identical). Shear stresses τ1, τ2 and τ3 in dependence of the orientation angle α.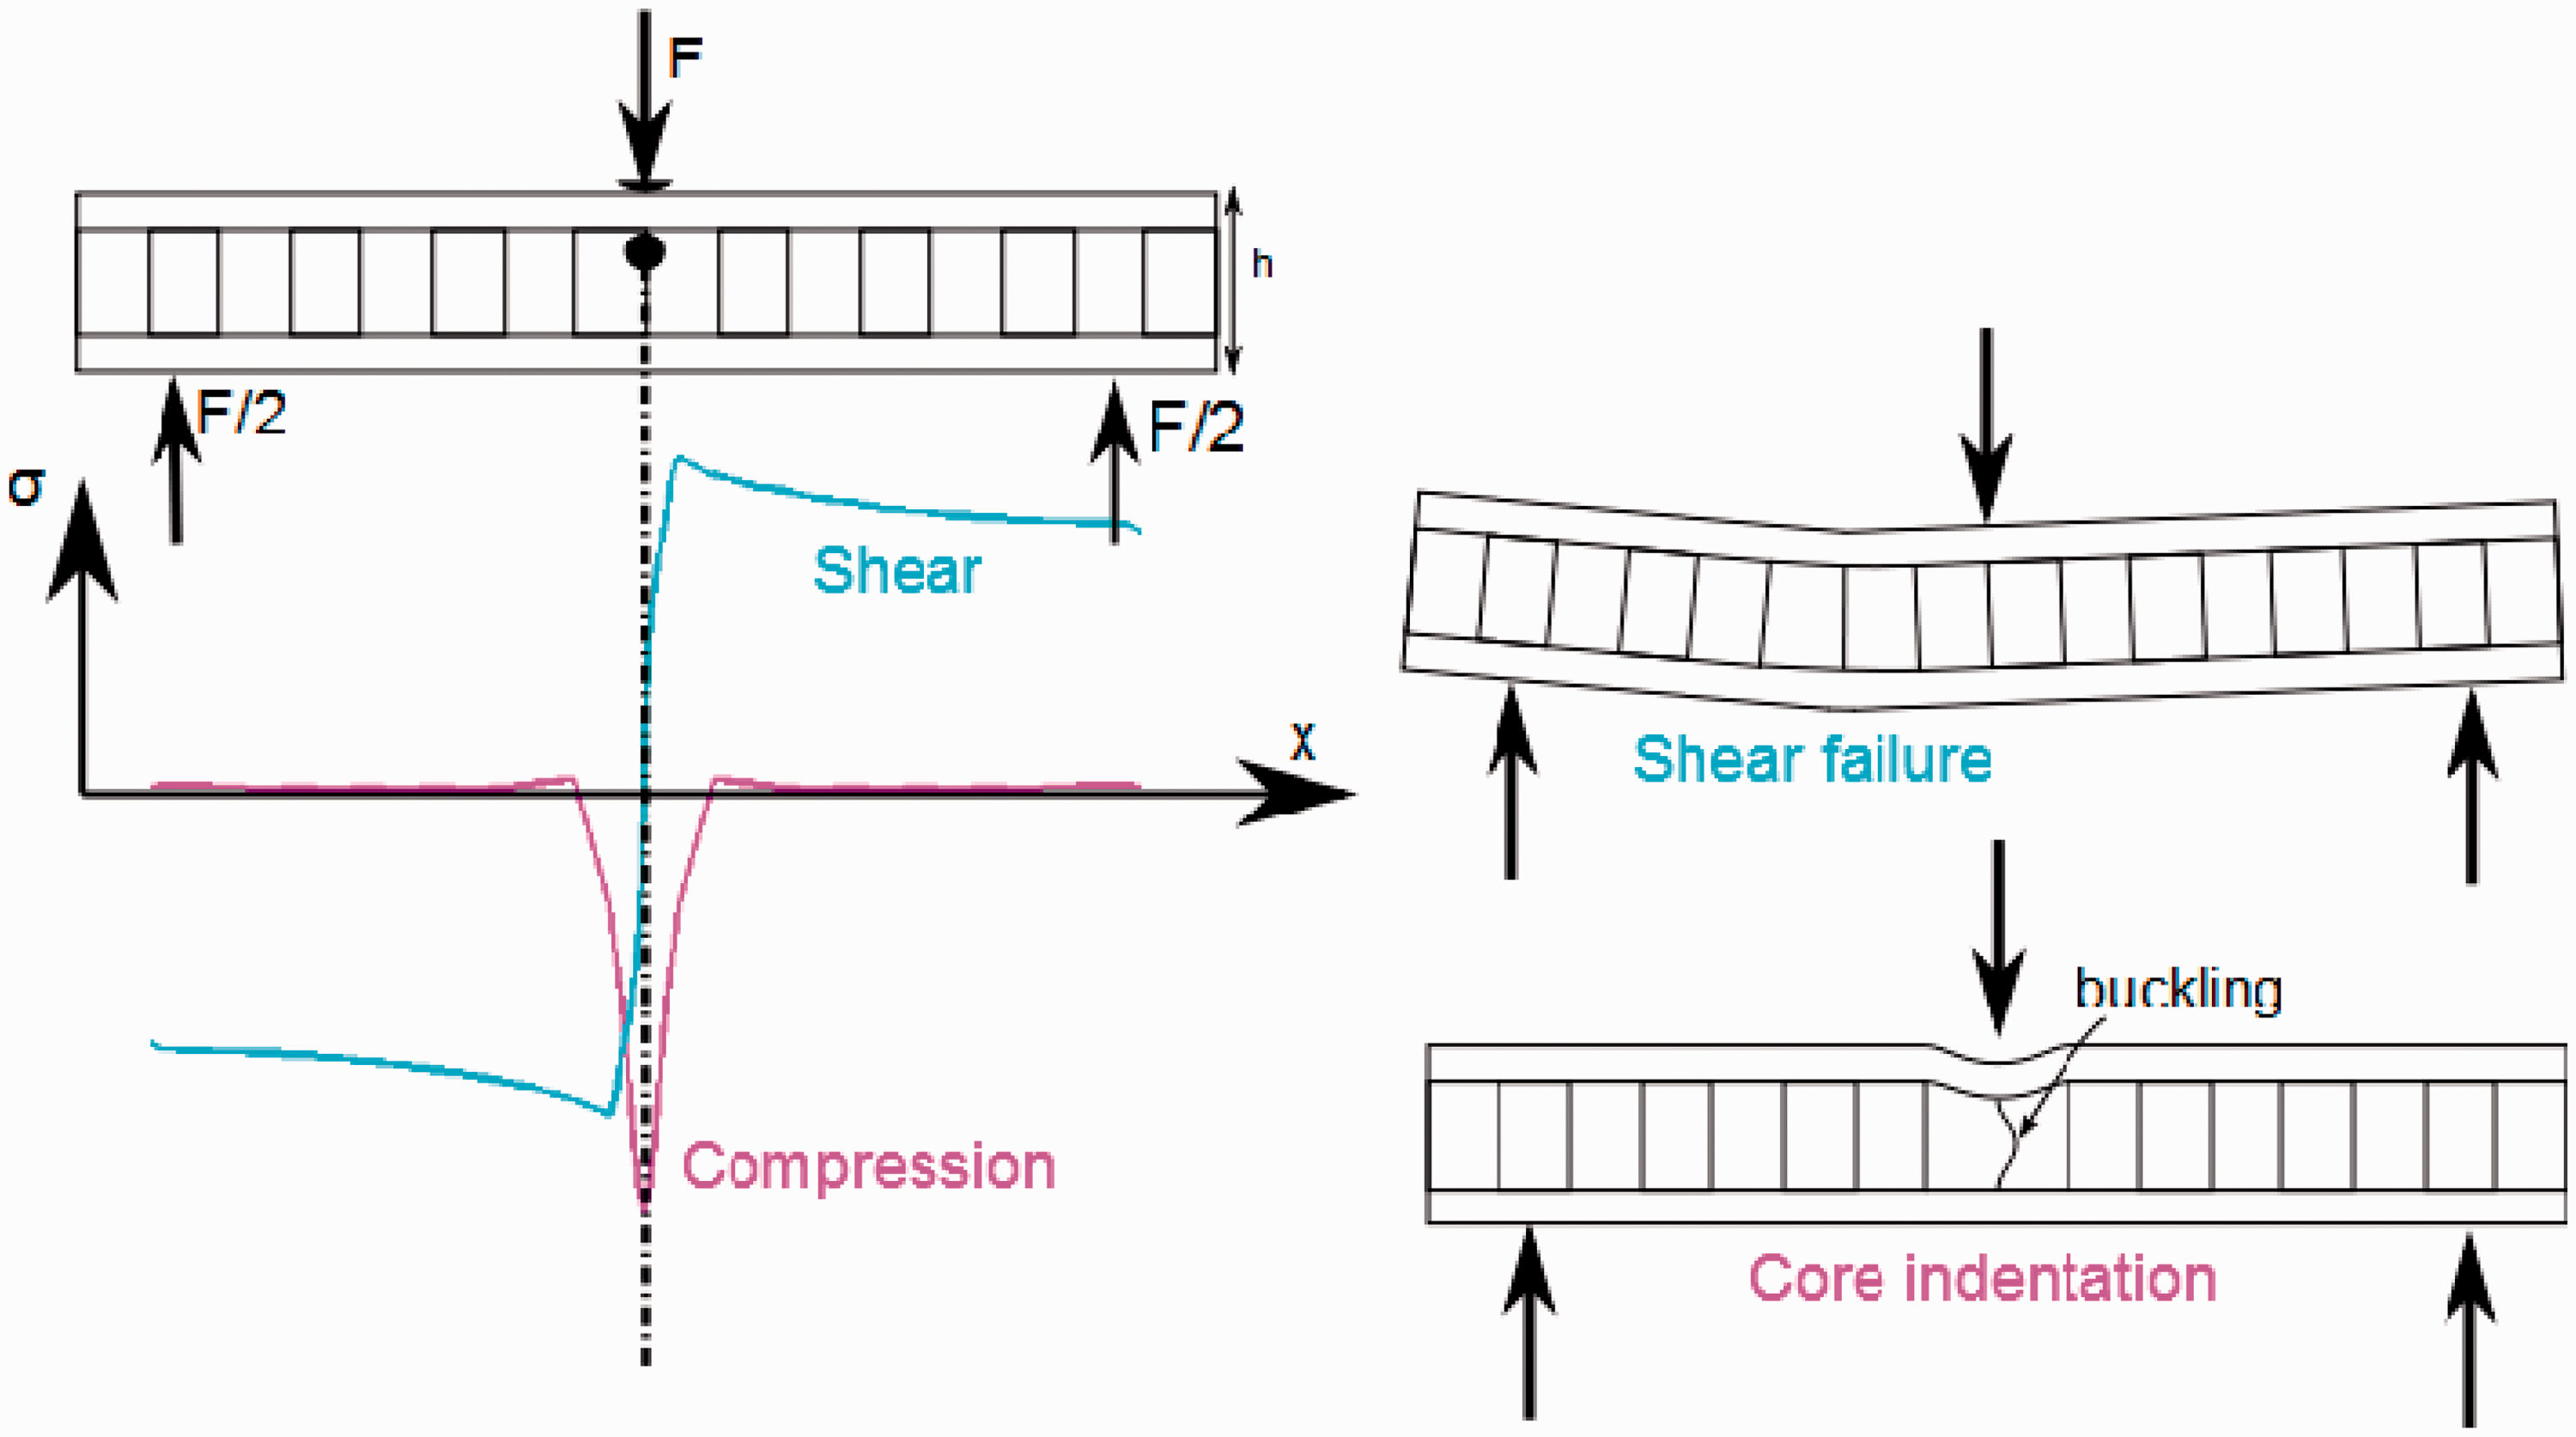
Materials and dimensions of the investigated structures
Material properties
The examined sandwich structure consists of three different materials:
– Glue ST epoxy; – Aluminum alloy AlMg3 H44 (AW 5754) for the face sheets and – Aluminum alloy AlMn1Cu H19 (AW3003) for the honeycomb structure.
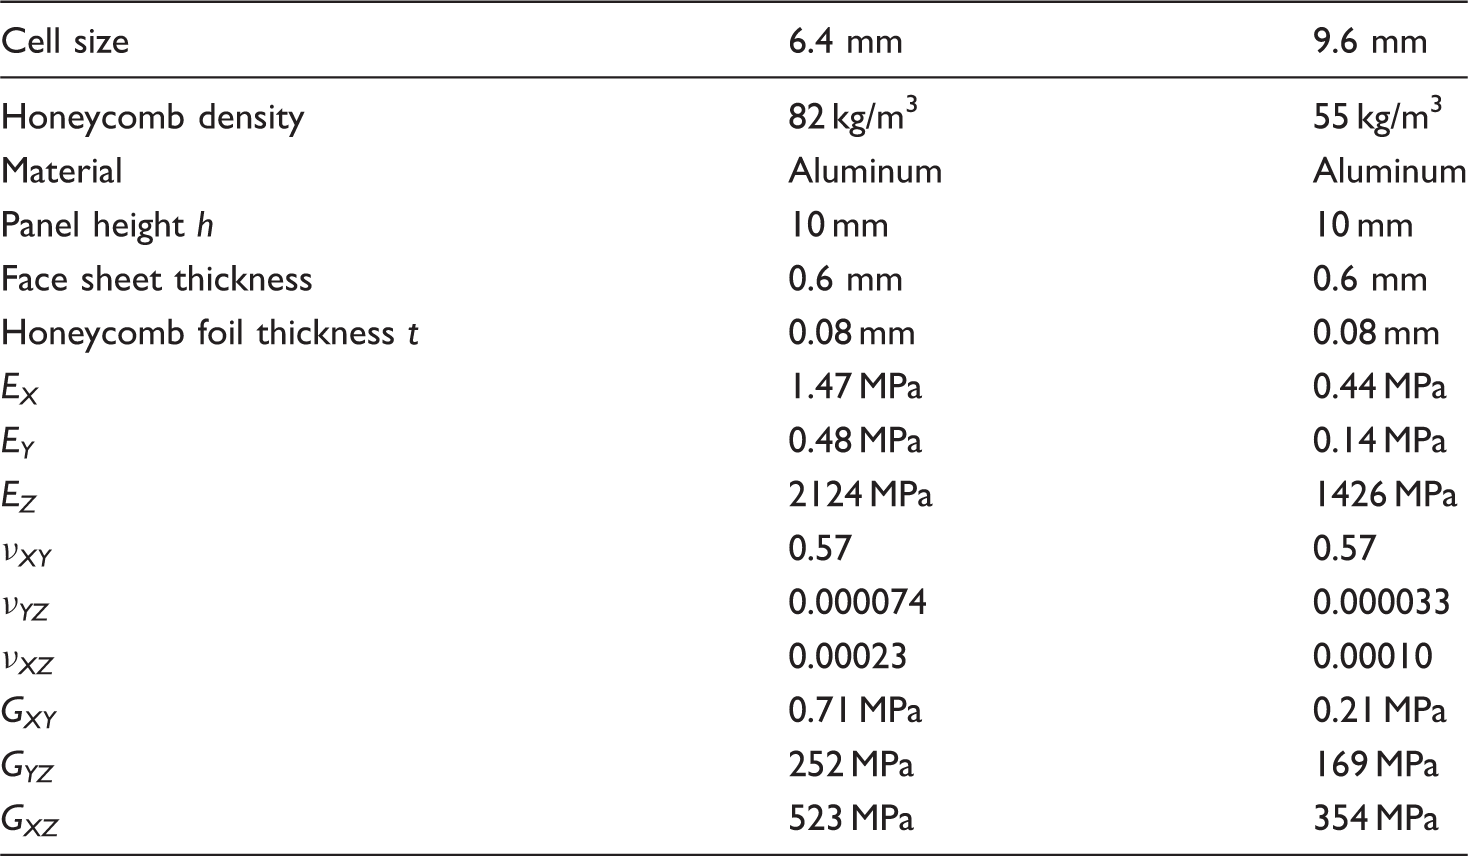
Mechanical properties of the materials used in the sandwich panels.
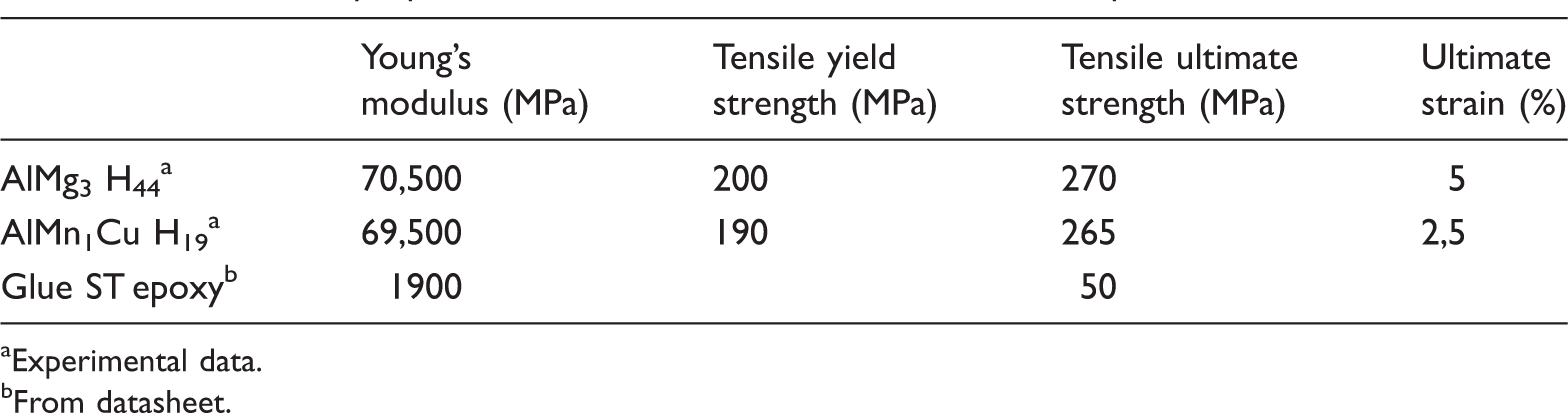
Experimental data.
From datasheet.
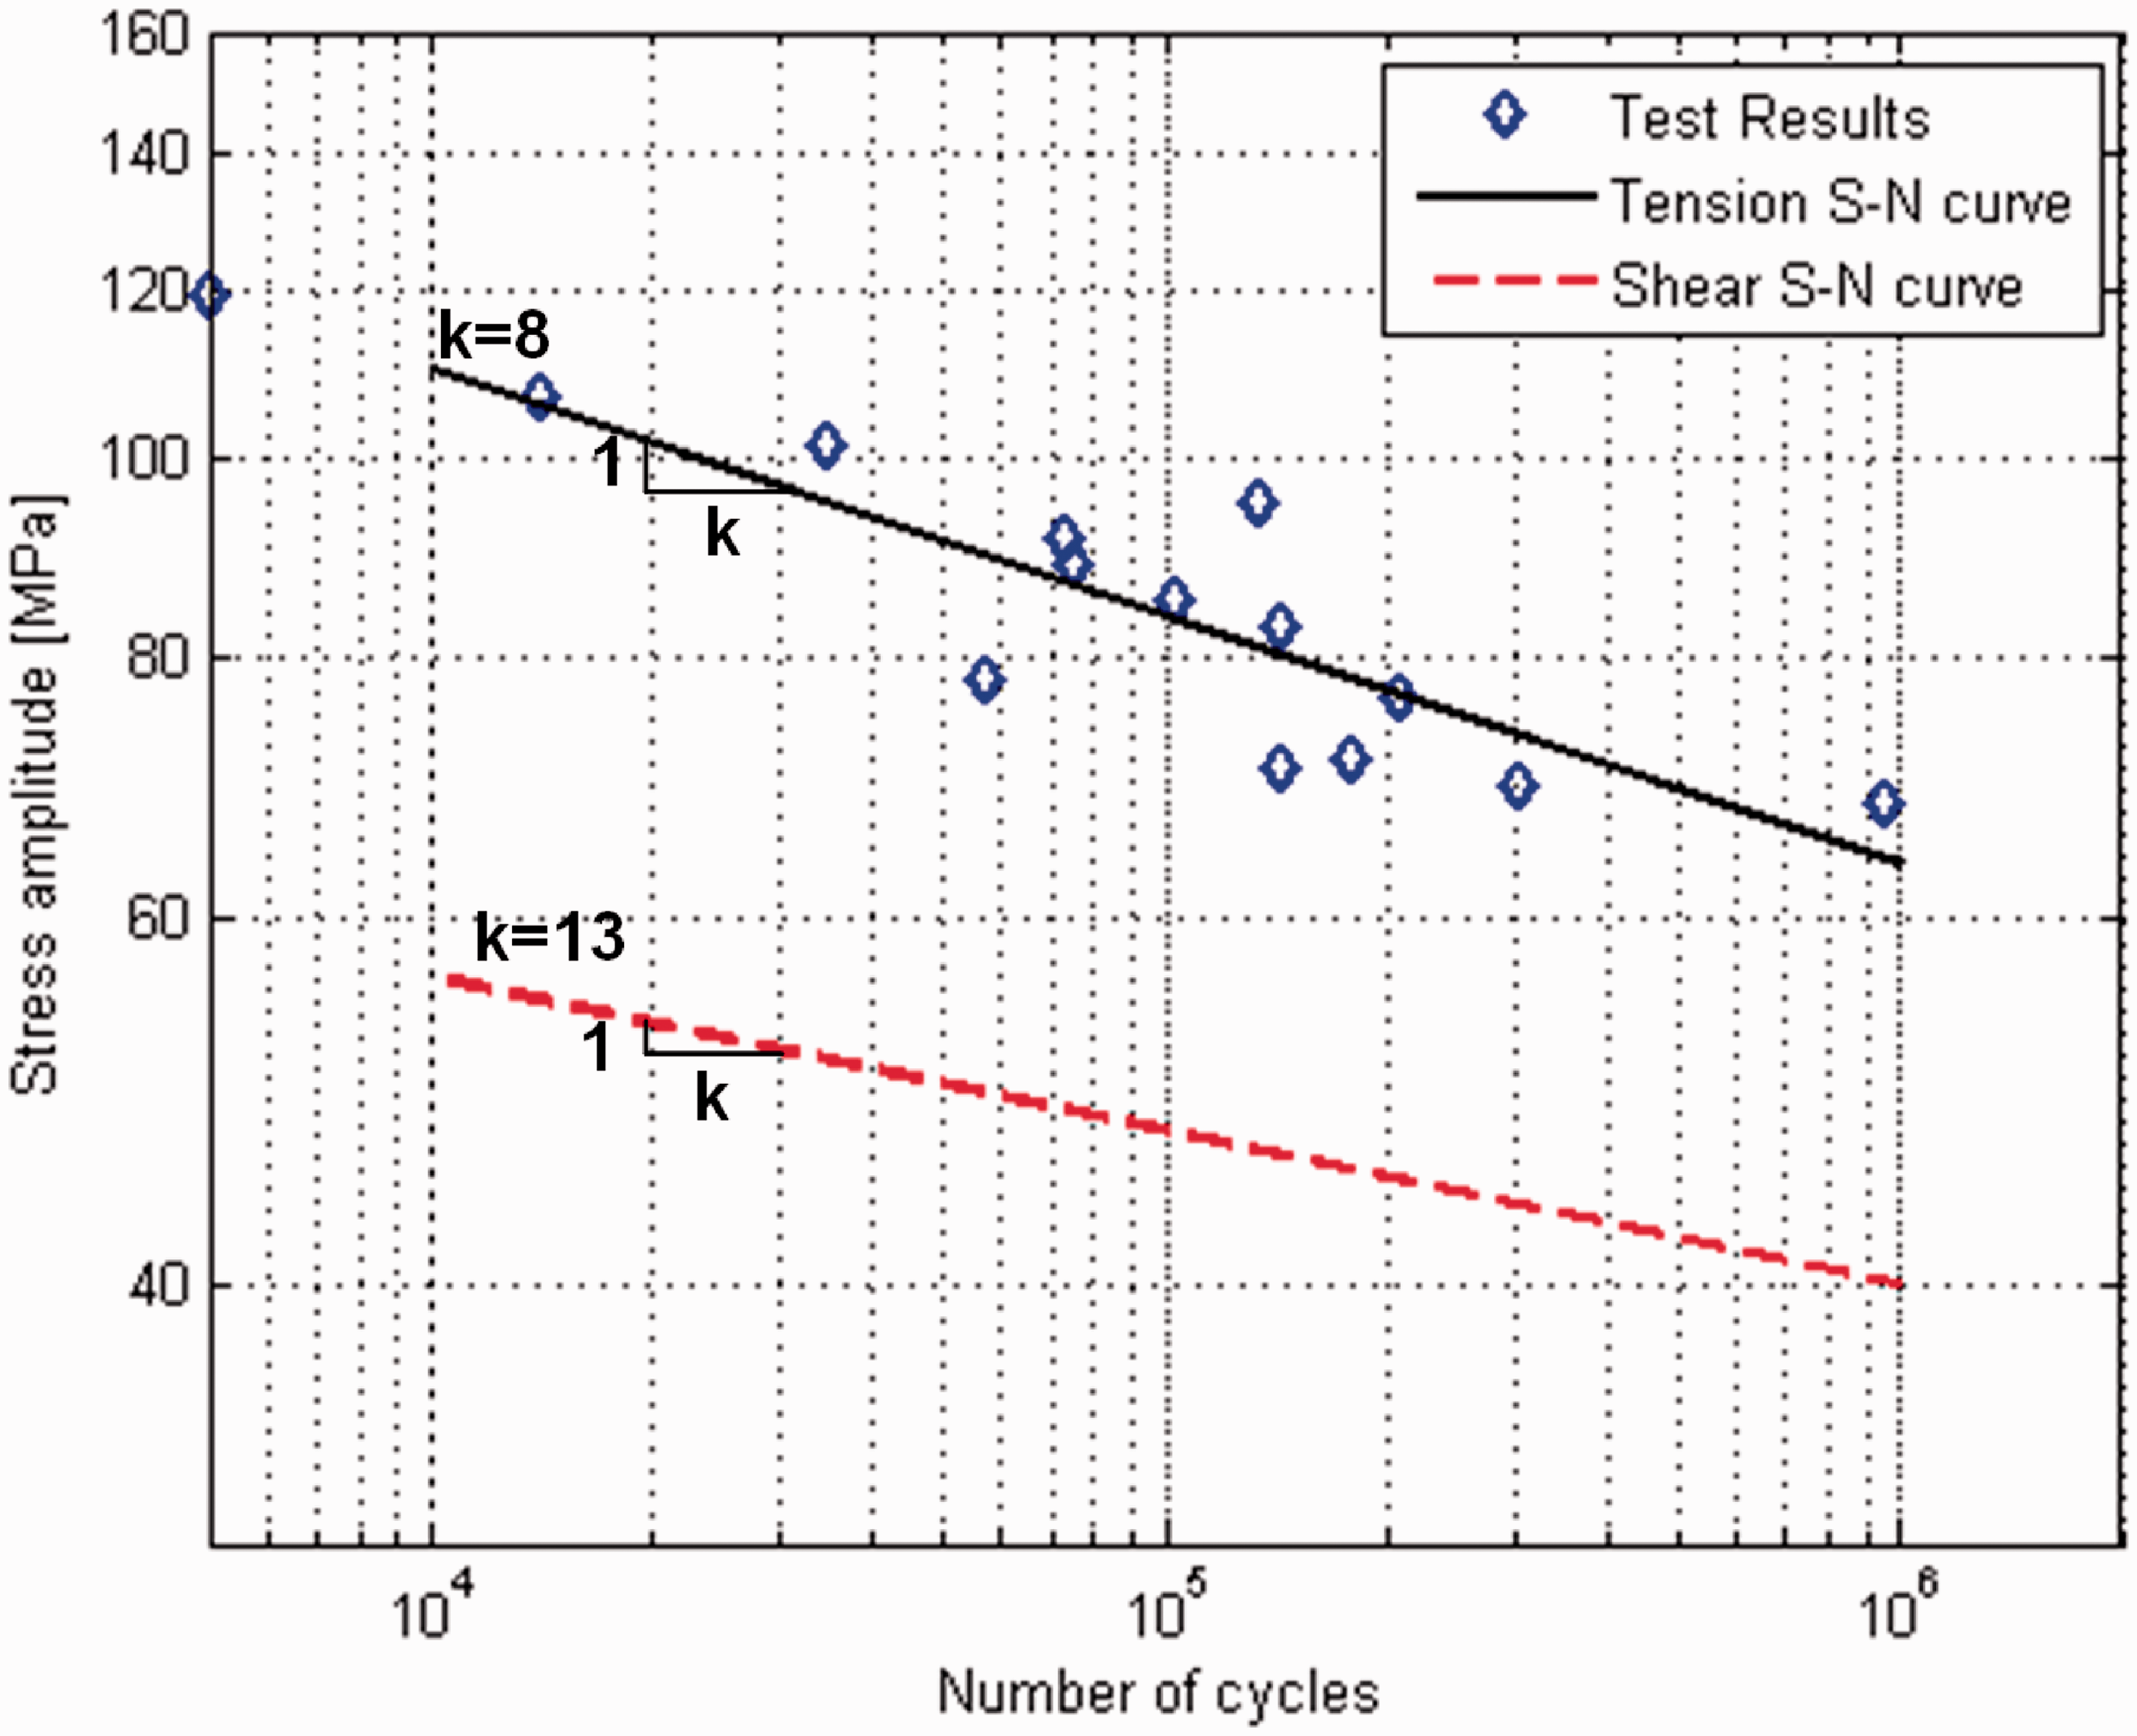
Some cyclic tensile fatigue tests (Figure 6) were conducted at a load ratio of R = 0.1 (thickness of material does not allow compression) with the core material AlMn1Cu H19 to get the S–N curves (Figure 7). The very thin samples were produced by stamping (shape according to ASTM D638). The S–N curve for shear stresses was derived from the tension curve, by moving the curve downwards by the factor √3 according to the Von Mises criterion (at 106 cycles). The slope k is changed by the factor 1.6 (from 8 to 13) according to the FKM guideline (Hänel et al., 2003) (this is an assumption, which is confirmed for this material in “Comparison analysis/test results” section).
Tensile fatigue test setup used for the cyclic material testing (left) and broken sample (right). S–N curves for a load ratio of R = 0.1 and a failure probability of 50% (Tension curve interpolated, shear curve calculated).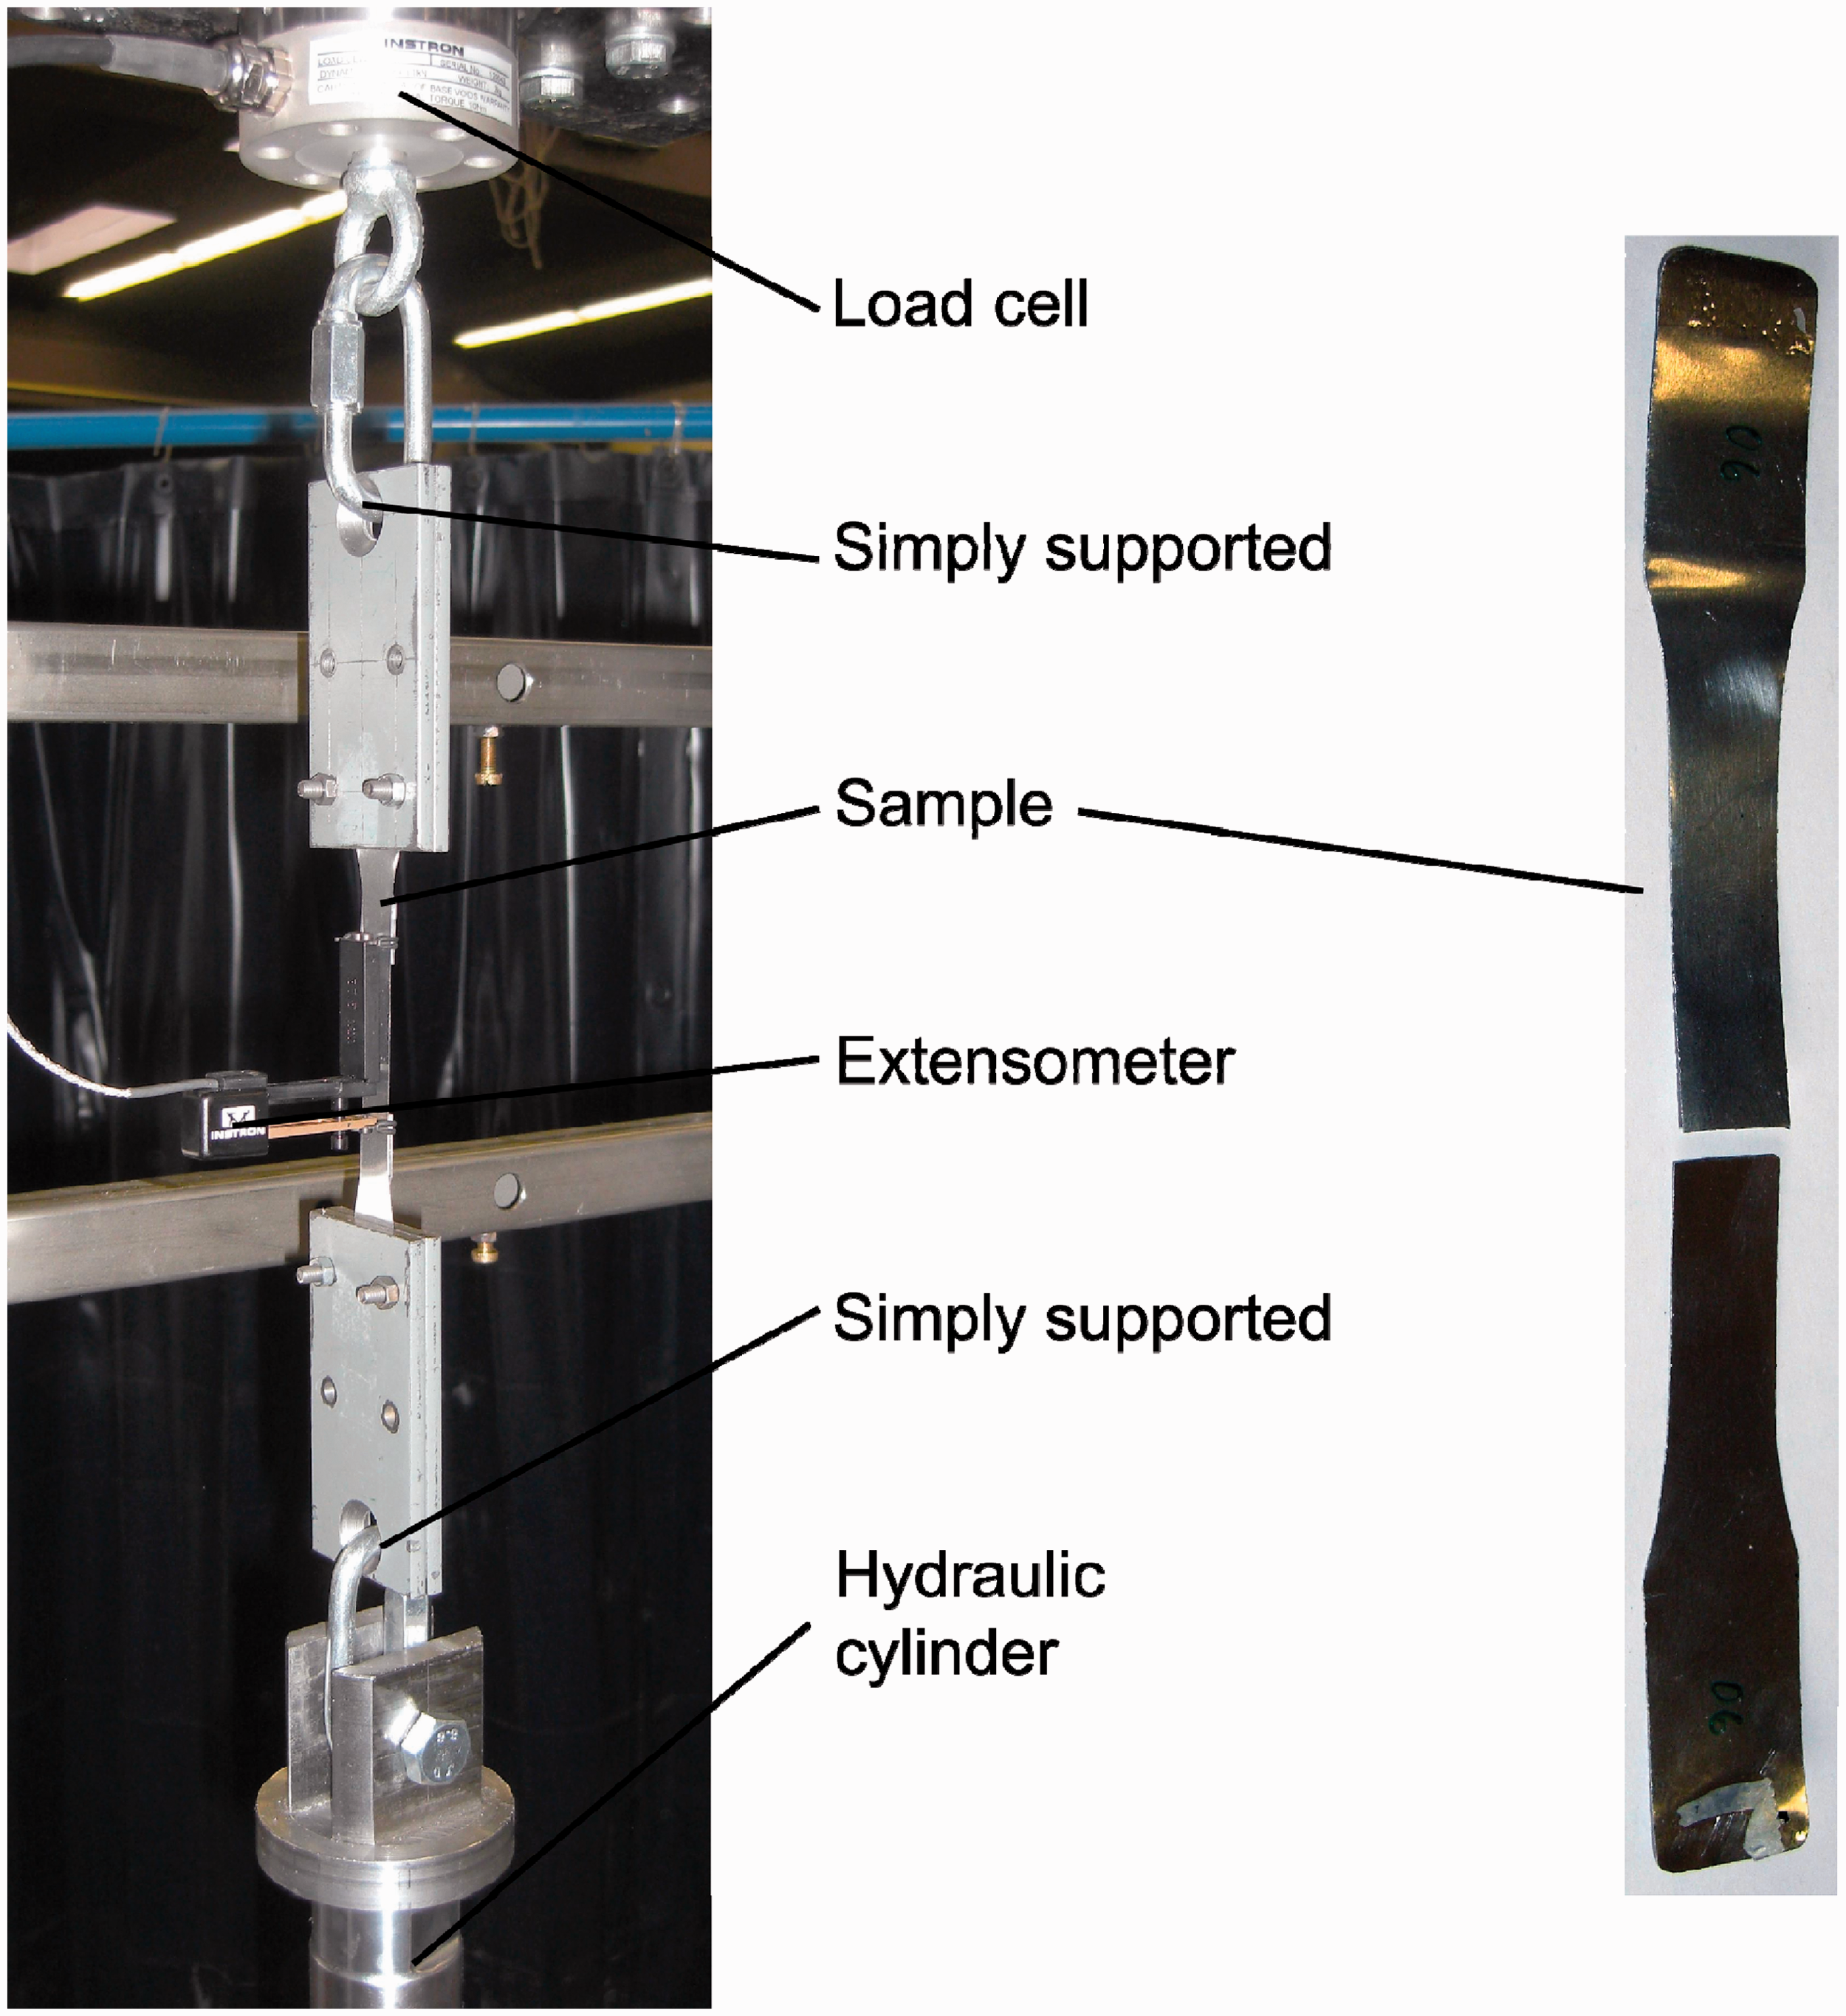
Properties of the core
Orthotropic properties for the core.
Description of the different experimental setups
Three-point bending tests
Dynamic three-point bending tests were performed to provoke core failure. The test setup is powered by a hydraulic cylinder from Instron Structural Testing Systems. Figure 8 shows the test setup including the sensors. The displacement of the support in steel is measured by an inductive sensor, which is also detecting the damage. The samples were loaded in the three-point bending test with a sinusoidal load (regulated by the force sensor) with constant amplitude at a power ratio of R = 0.1. The excitation was force controlled. The specimens fail in the core due to the shear stresses, as shown in section “Three-point bending results.”
Three-point bending setup used for fatigue testing.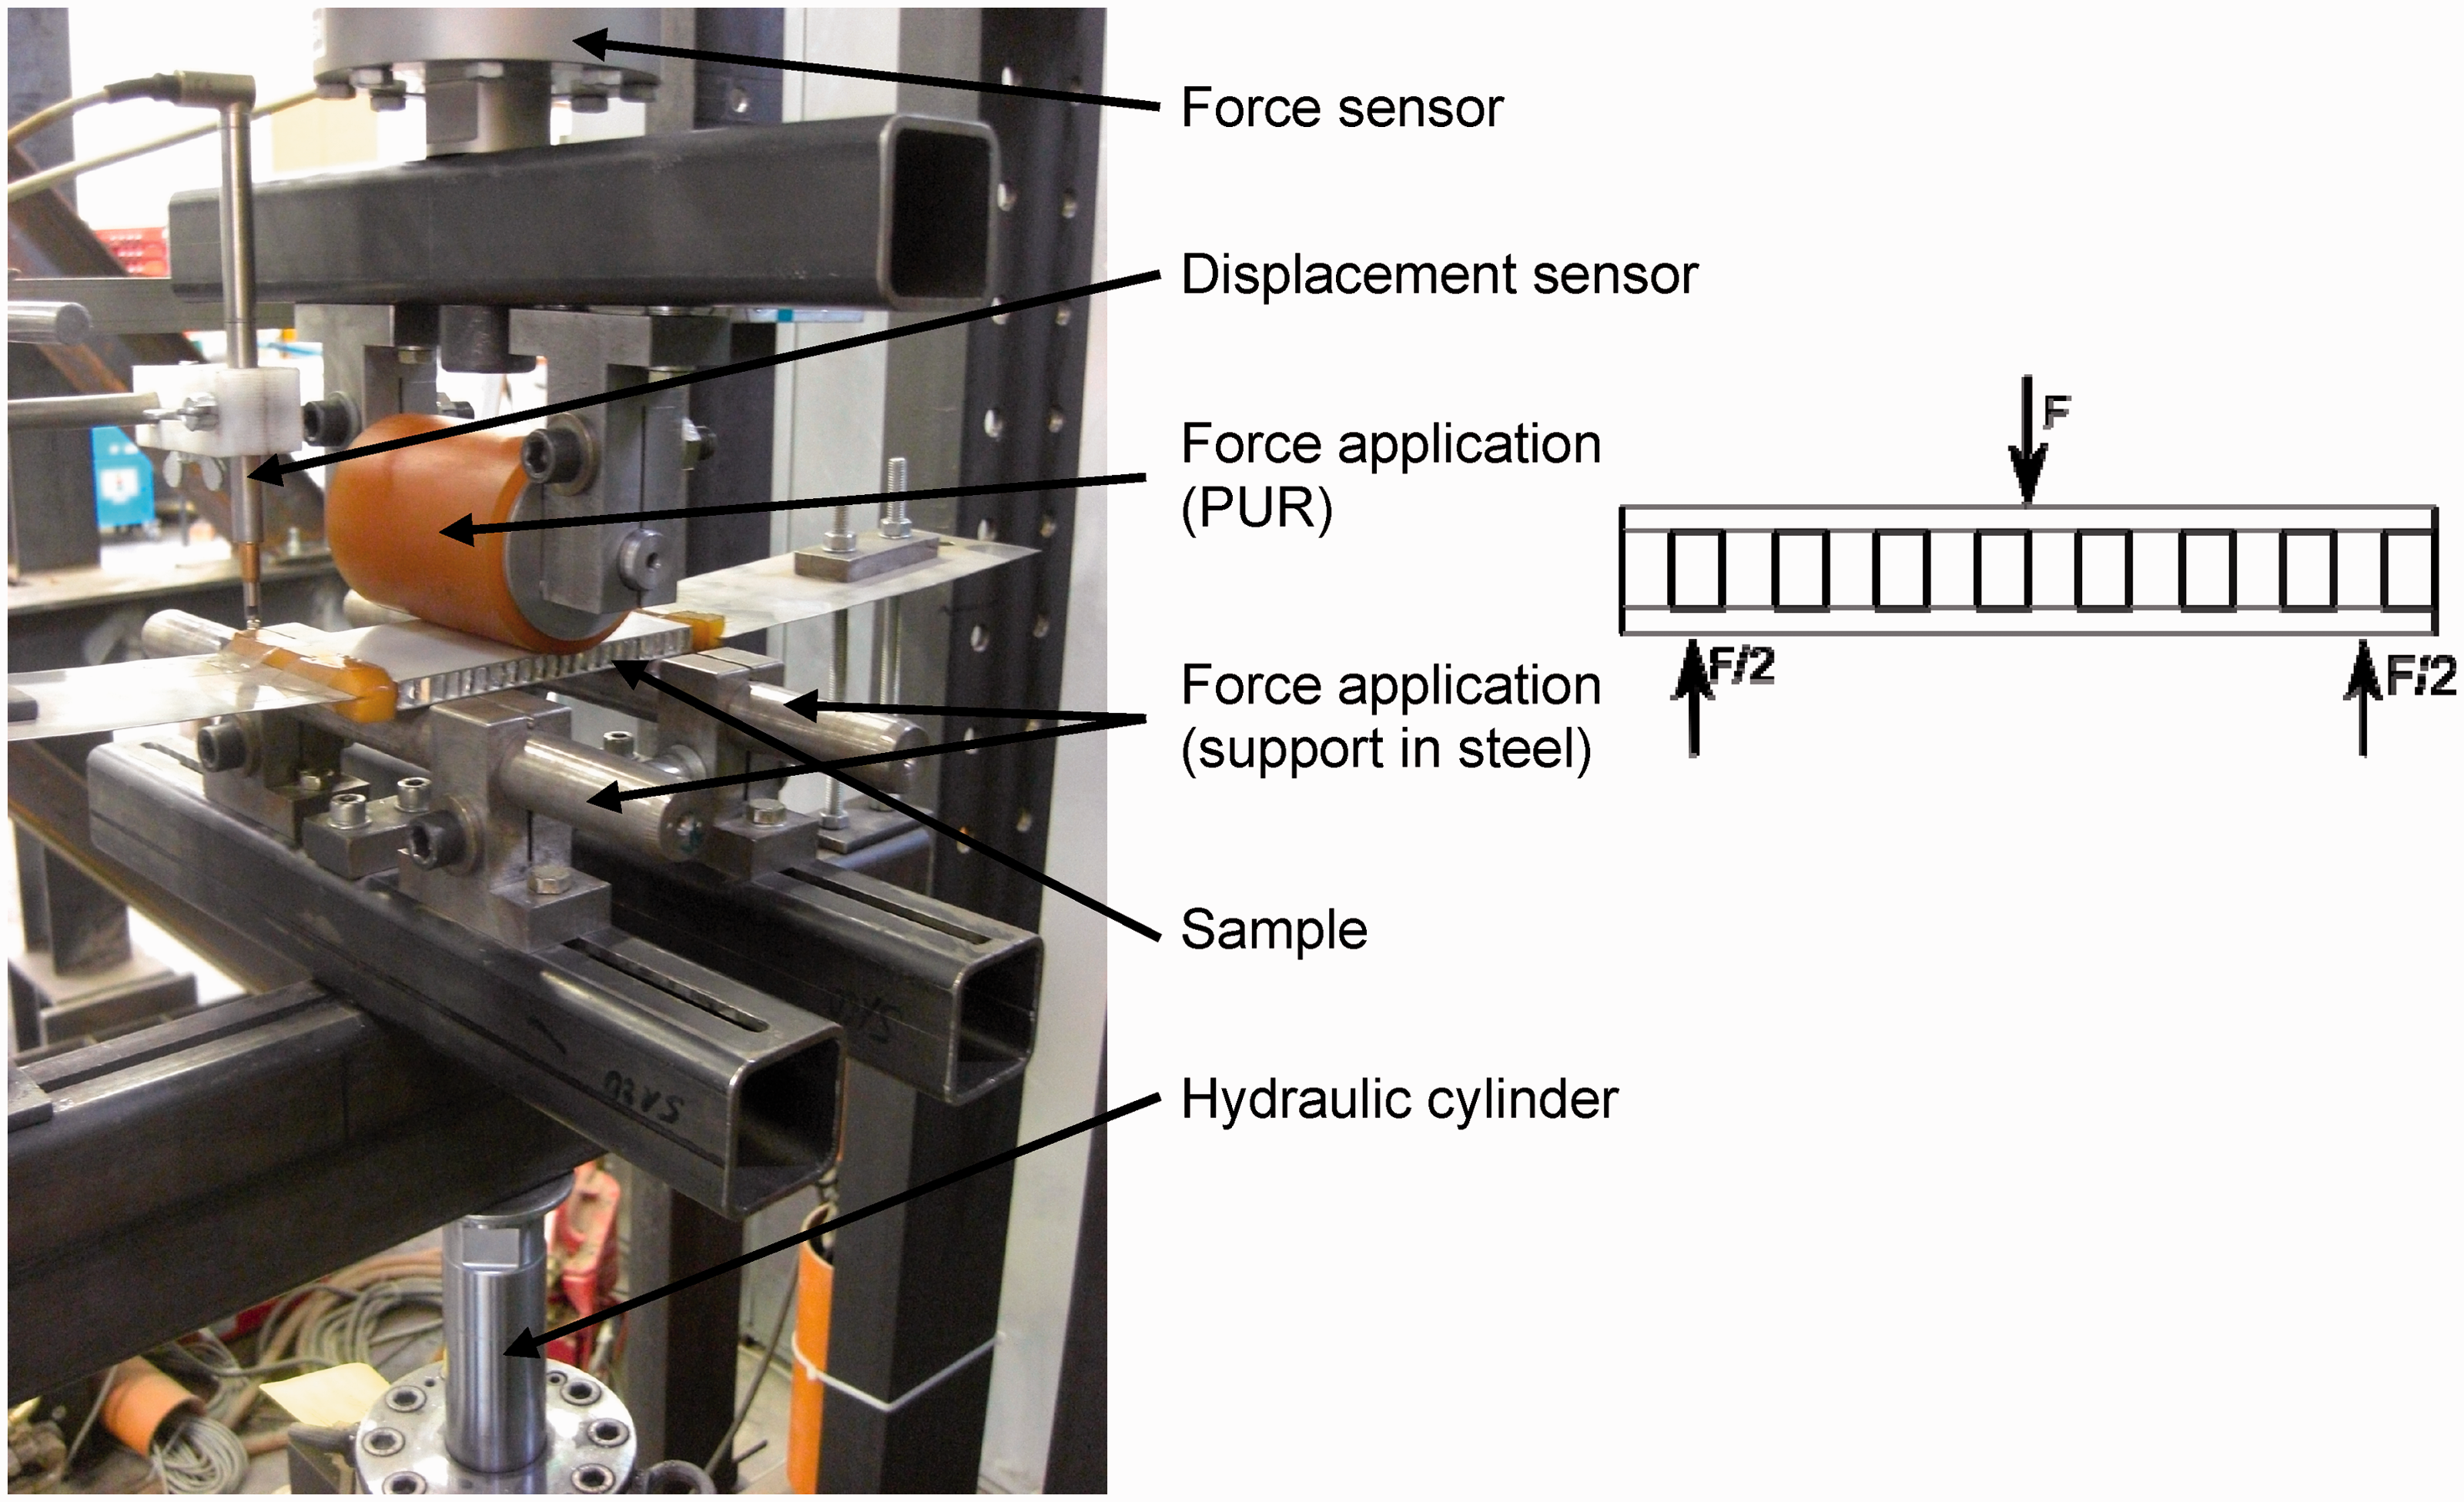
Food-cart roller test
Another common fatigue test for sandwich structures is the “food-cart roller test” (Boeing material specification, 2007; Douglas specification, 1985). This test consists of a plate, which is charged with weight loads and rolls on three wheels on a sandwich structure (Figure 9). The wheels move in a circle, thus they cross the fixed internal core structure in every orientation angle. There are two sandwich panels with screw fixed to the rig, as illustrated in Figure 9. This test simulates a cart which is rolling on a floor panel, for example, in a plane. The face sheets and the adhesive layer are not failing in this test as well, but the core structure is failing due to the shear stresses, as shown in section “Food-cart roller results.”
Food-cart roller testing rig.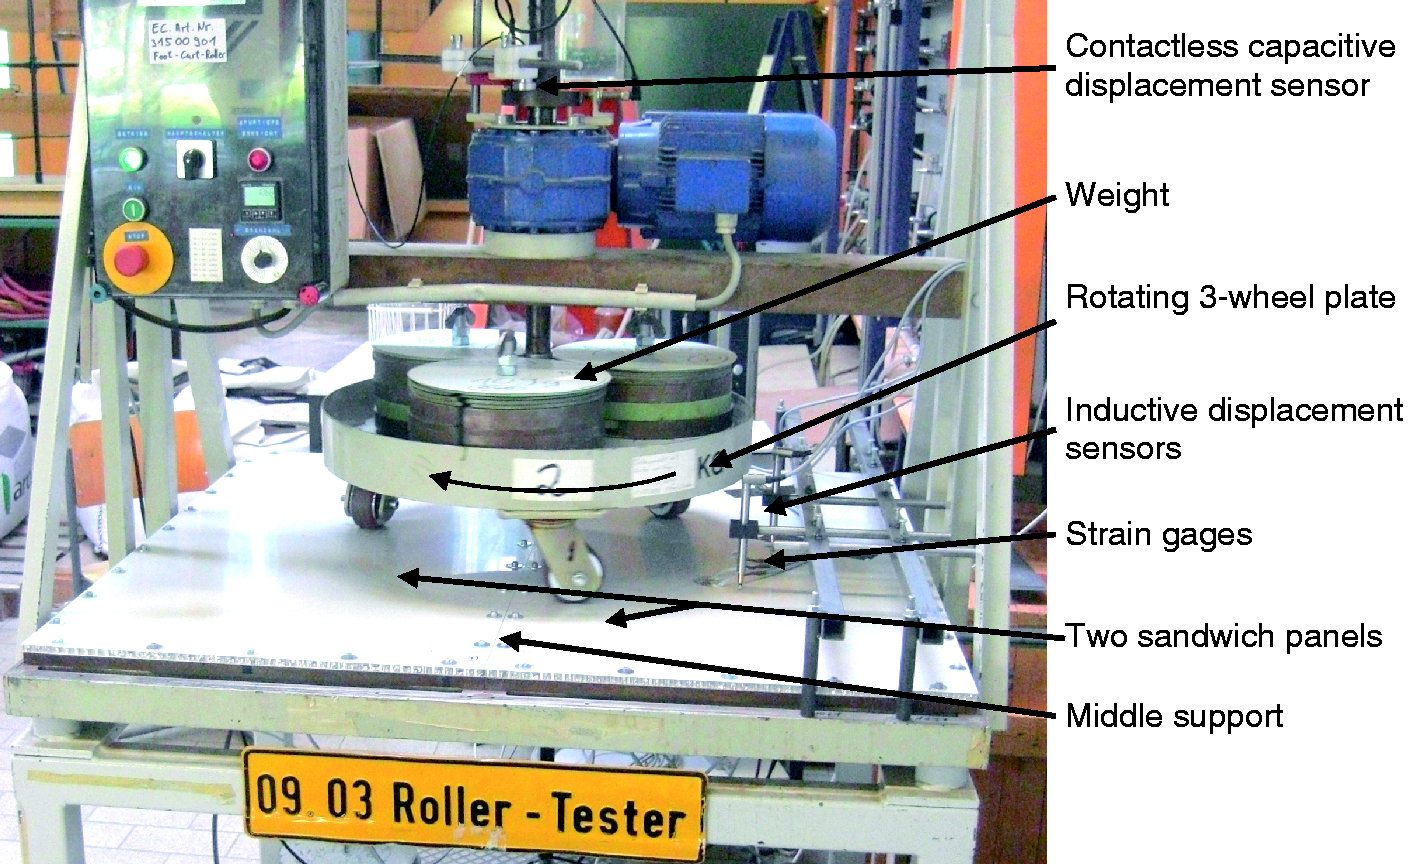
The food-cart roller tests were executed with the same sandwich panels as described in Table 2. The parameters of the testing rig are listed in Table 3.
Dimensions of the food-cart roller testing rig.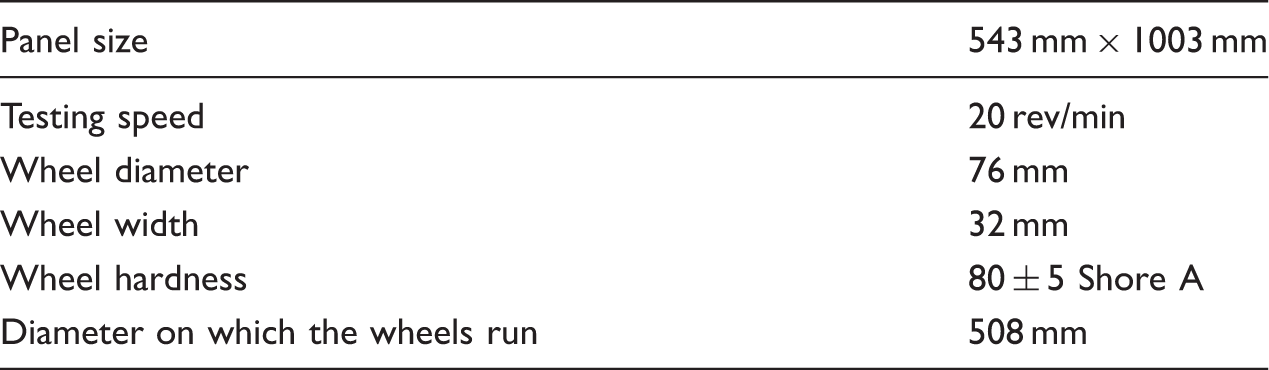
Simulations
Three-point bending simulation
A model of the sandwich structure was created with the ANSYS finite element software. The core structure was modeled with shell281 elements, having eight nodes with 6 degrees of freedom each. Shell281 elements are also suitable for large deformations and plastic behavior. The face sheets were modeled with solid95 elements, volume elements with 20 nodes with 3 degrees of freedom each. Linear finite element analyses are appropriate, because no big plastic effects are occurring during the investigations (minimum 104 cycles). No imperfections were included in the structure as the influence of the small imperfections had been proved to be negligible (Wahl et al., 2011). The distributed load was applied on the same area as in the experiments (pressure load initiated at a width of approx. 10 mm, as shown in Figure 10).
Finite element model of the three-point bending test.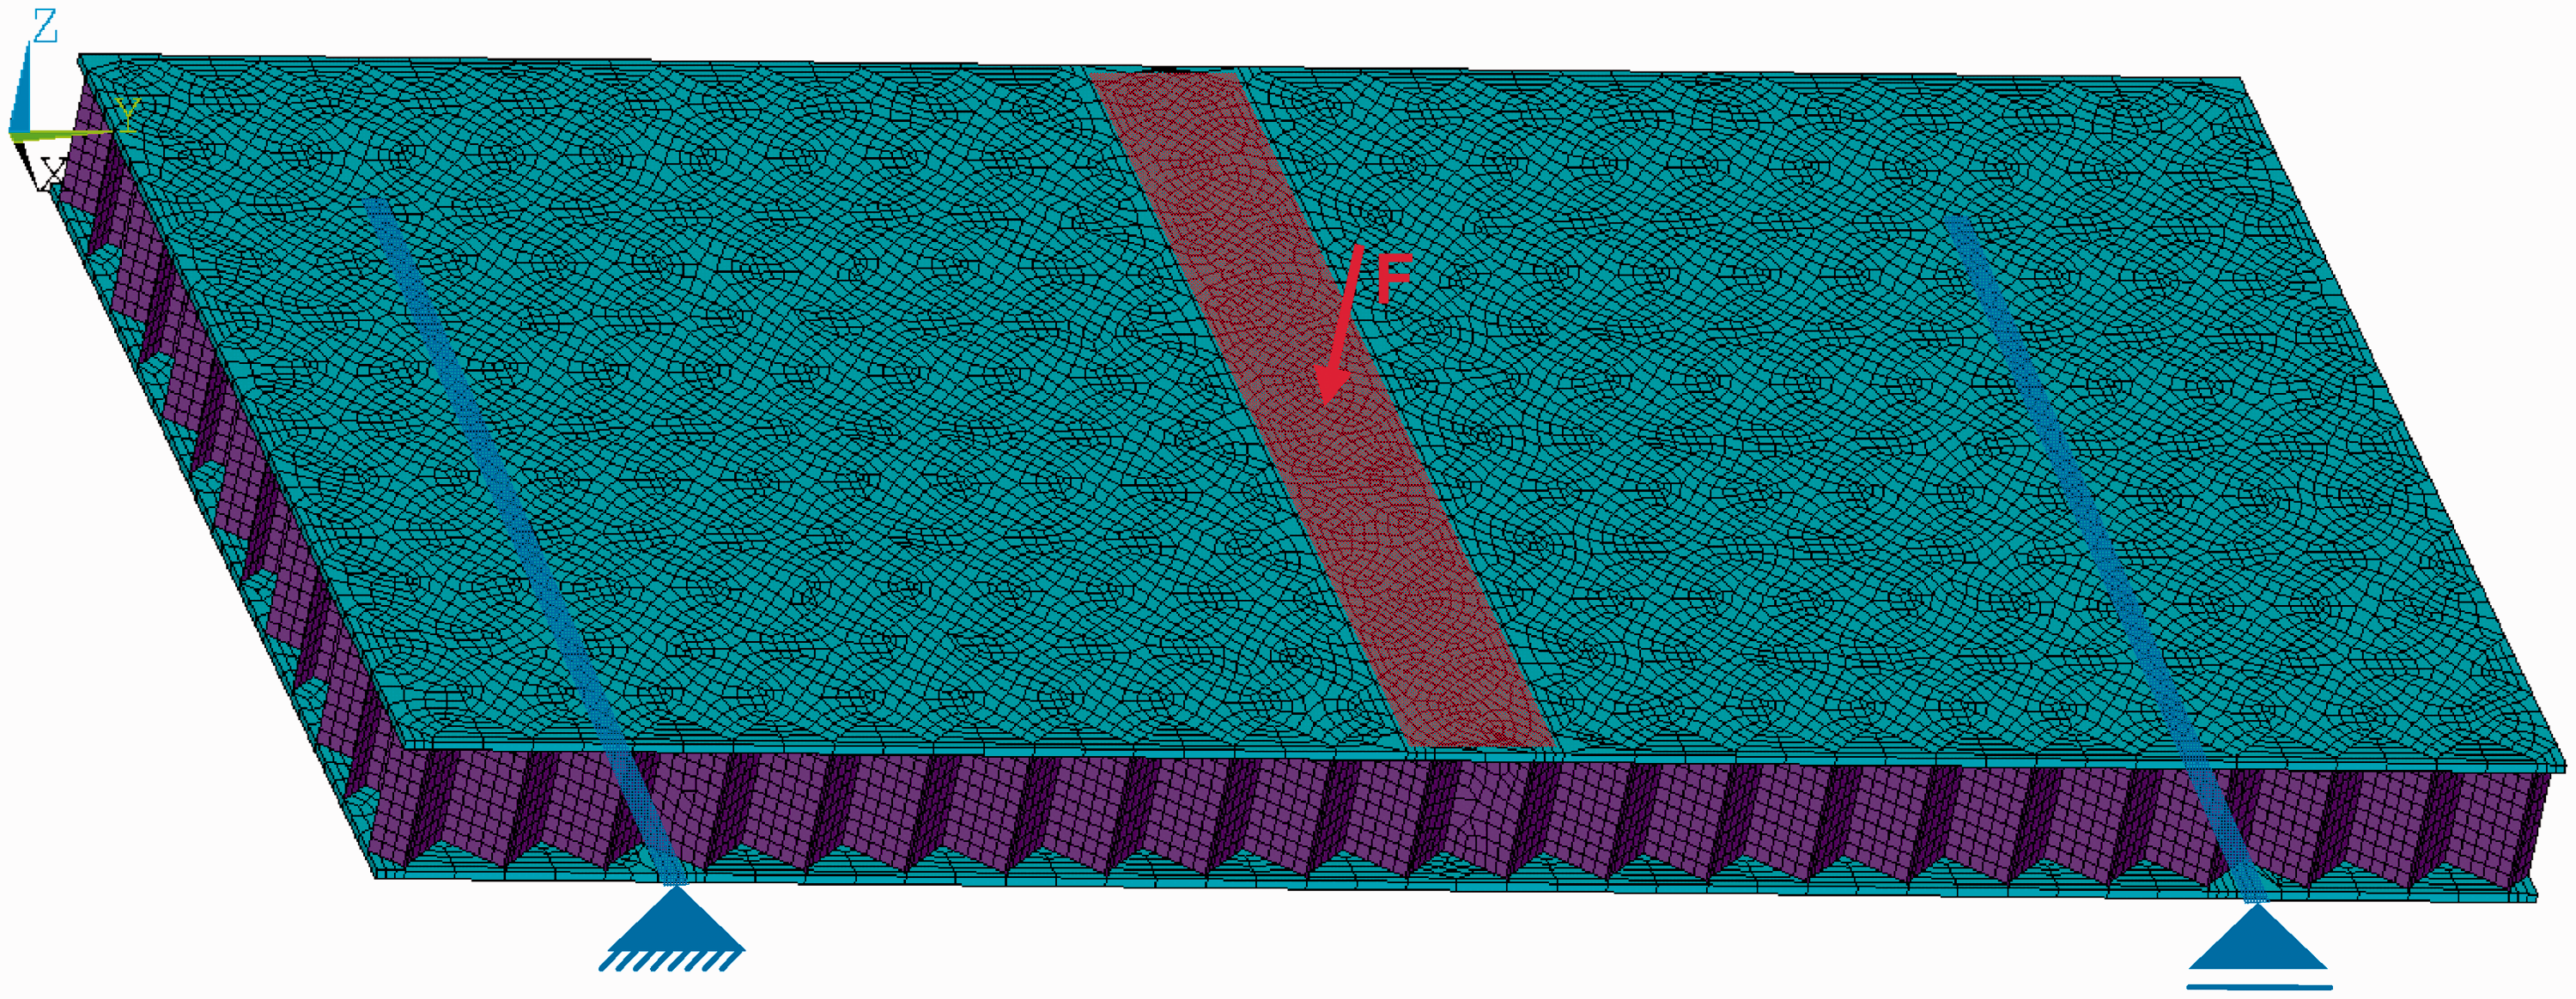
Food-cart roller simulation
The dimensions of the panels of the food-cart roller test are much bigger than the panels of the three-point bending tests. In order to mesh the honeycomb core of the food-cart roller test, a huge number of elements are necessary, which would lead to exploding computation times. The number of elements is reduced by replacing the honeycomb core with a homogeneous core with orthotropic properties (properties given in section “Properties of the core”). The resulting displacements (not the stresses) of the homogeneous core simulation are approximately the same as the solution of the real honeycomb core. The homogeneous core was modeled with solid95 elements. Sandwich panel with homogeneous core and submodel with honeycomb core modeled with shell elements (vertical displacement displayed). Pressure distribution under the wheel depending on the load (food-cart roller test).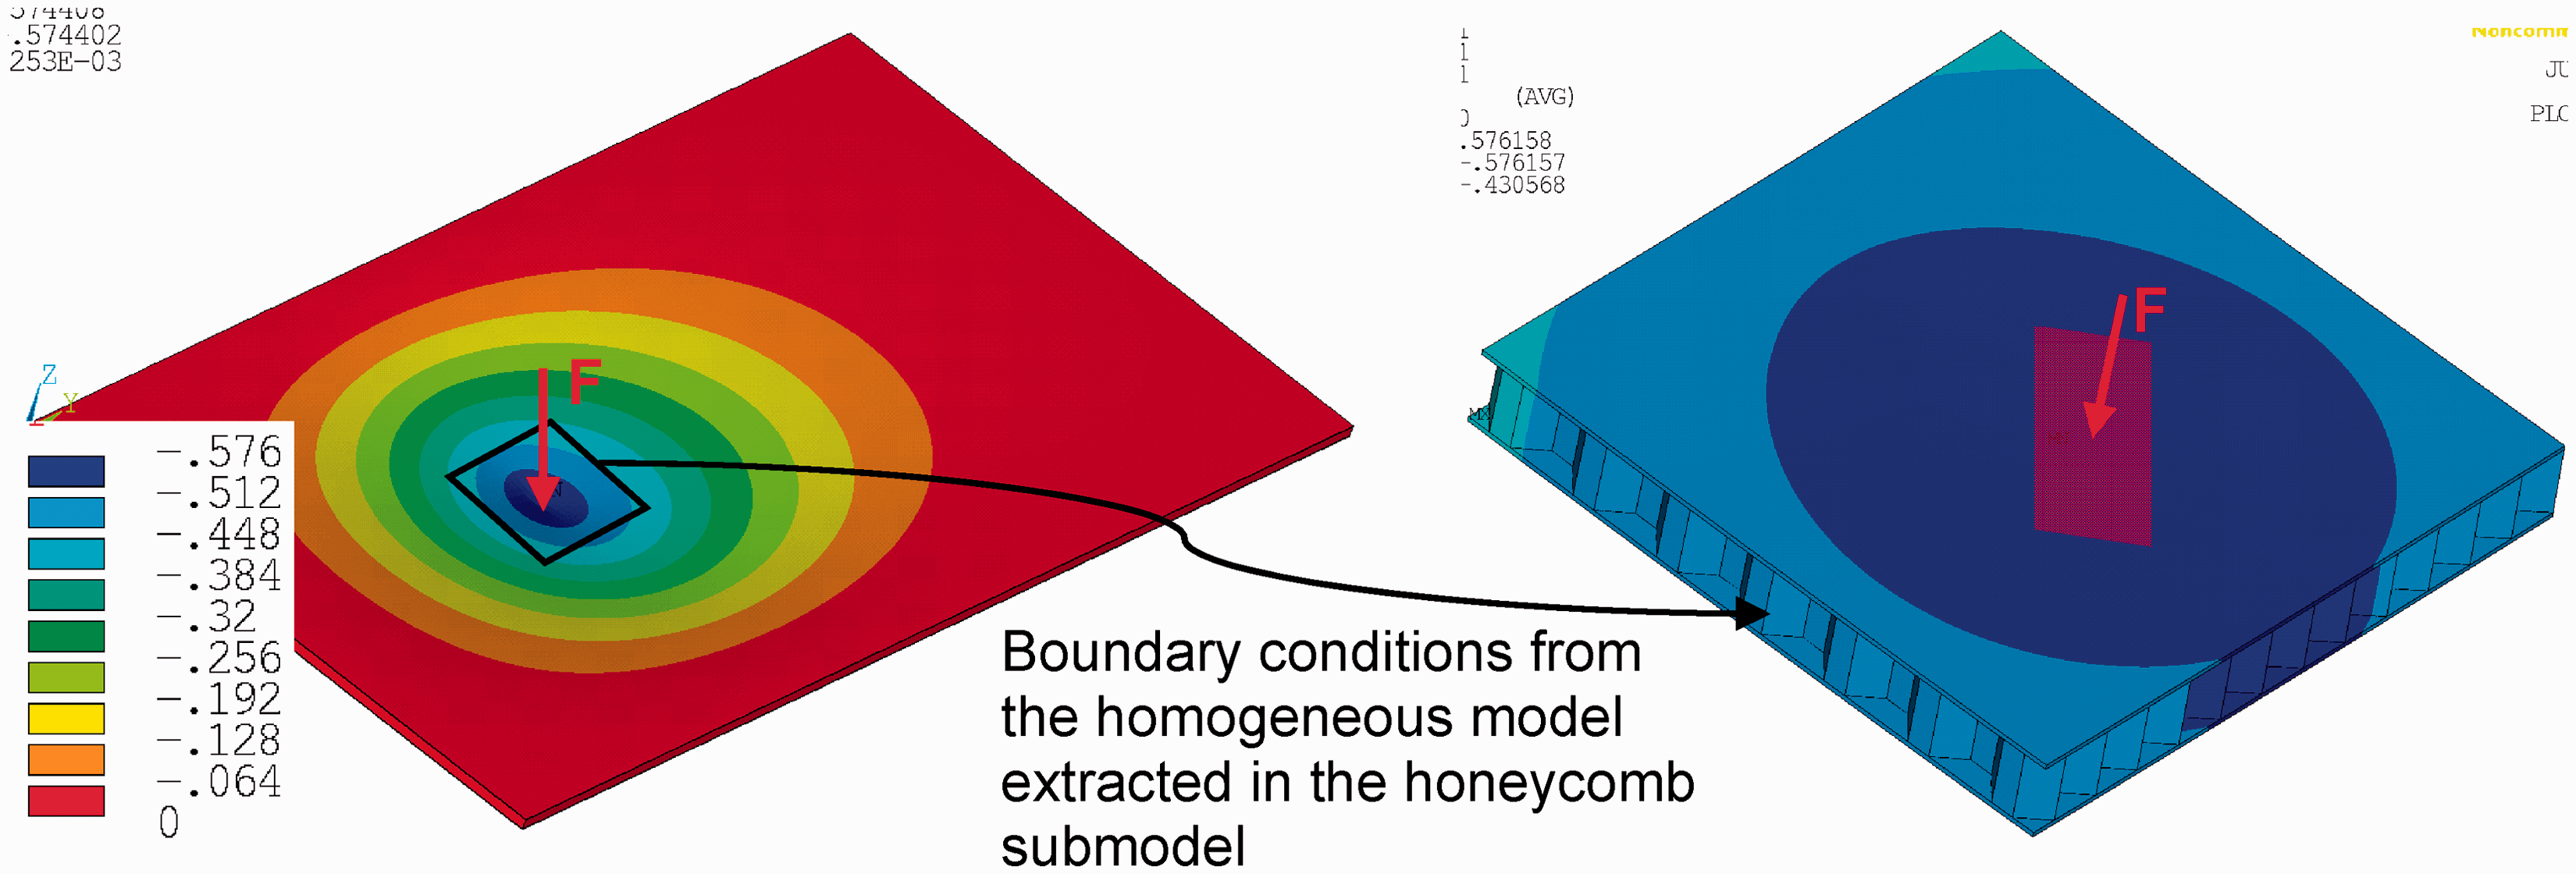
Load application
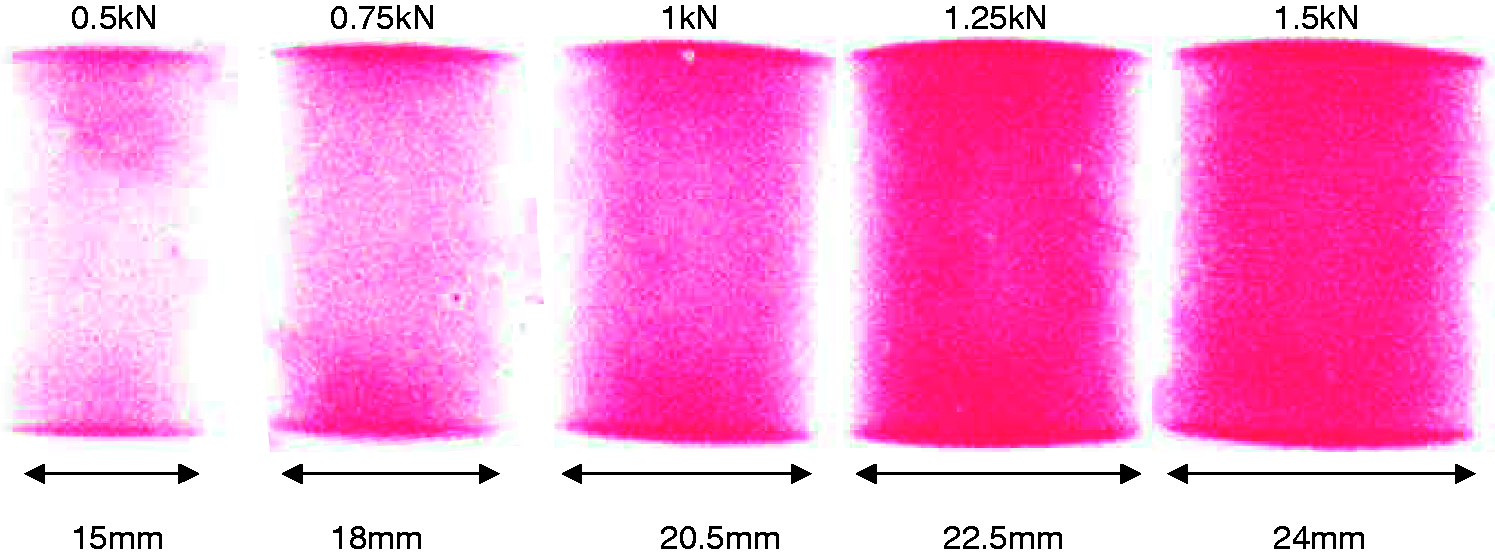
An important part of the simulation is to model the load application in a convenient way on the specimen. The load application in the tests is realized by a roll made of polymer polyurethane, which has nonlinear properties. The pressure distribution under the load application is measured with a Fujifilm pressure film. The red color of the pressure film shows the pressure distribution on the contact region. The most important parameter of this measurement is the size of the area on which the load is applied. The investigations showed that the slightly unequal load distribution over the area has no considerable influence on the results. However, if an incorrect assessment of the load area is made, there is a big impact. Therefore, in the simulation, the load applied was perfectly distributed on an area with the same size as in this measurement.
Core indentation (buckling of the core)
In section “Stresses in honeycomb sandwich structures,”it is shown that the honeycomb structure can fail in the mode of core indentation. Physically, core indentation of honeycomb panels means that the cell walls are buckling. The buckling process induces bending stresses in the cell walls, including high tensile stresses. These tensile stresses have a very negative influence on the core’s fatigue behavior, that is, the crack initiation phase immediately becomes very short. Therefore, it is reasonable not to tolerate the buckling of the core. In real applications, core indentation is usually avoided by reinforcing the panel at the position of the load application. Good lifetime predictions can only be made if no buckling occurs in the honeycomb core. Therefore the buckling effect of the core has to be analyzed, which can be done in two different ways, using the finite element method: first, by a buckling analysis that calculates the theoretical buckling load for a perfect elastic system (Euler analysis), or, alternatively, by evaluating the buckling load in a nonlinear simulation. The simulations done during this project showed that both methods lead to similar results, due to the small deformations. Therefore a nonlinear simulation is not necessary.
Fatigue analysis
The fatigue analysis of an aluminum honeycomb sandwich’s core structure should be as follows:
– Determine the buckling load of the core in a buckling finite element analysis (considering geometric nonlinearities). To avoid buckling the load applied must not reach this value. – Determine the stresses in a static finite element analysis with a homogenized core and a coarse mesh (pure elastic simulation). – Locate the critical points (e.g. in a contour plot of shear stresses as these stresses are predominating). – At the critical point determine the exact stresses in a submodel with shell elements and a fine mesh (in this work, pure elastic simulations are enough because no buckling is occurring and stresses are below yield point). – Calculate the honeycomb core’s lifetime, using the FKM guideline (Hänel et al., 2003). – If possible, confirm the results by tests.
Buckling loads
Buckling loads of the three-point bending test.
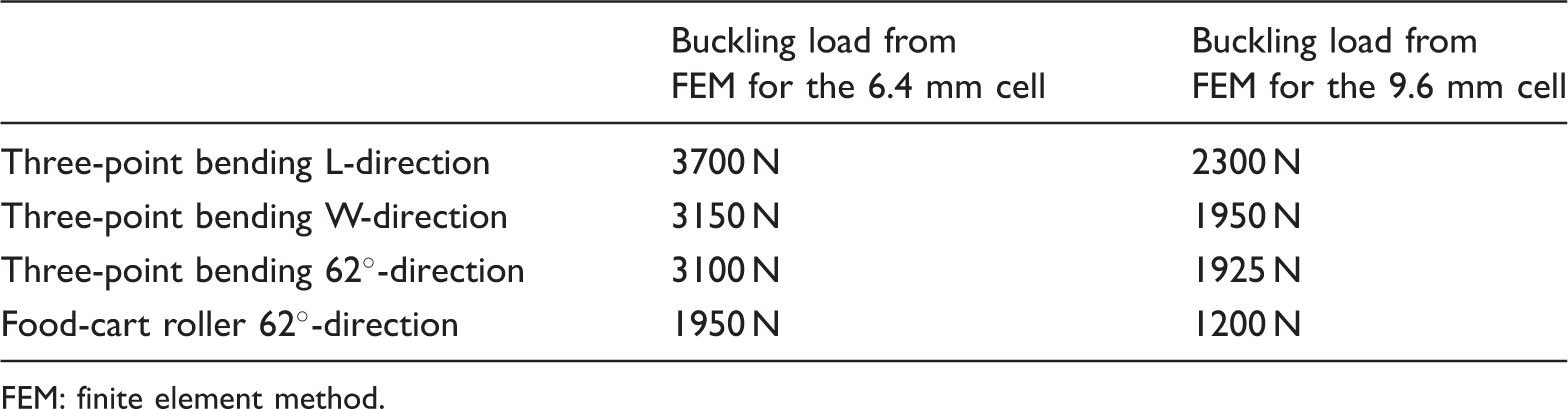
FEM: finite element method.
Three-point bending fatigue analysis
After proving that there is no buckling of the core, a static finite element analysis can be made, followed by a fatigue prediction using the results of this analysis. At locations of the load application, the compression stress is predominating, and close to the load application, the shear stress predominates as shown in Figure 3. When there is no buckling of the core, the most damaging stress component in the core is the shear stress. Therefore, the critical location can be determined from a shear stress contour plot. A fatigue prediction can be made for this location, using the FKM guideline (Hänel et al., 2003).
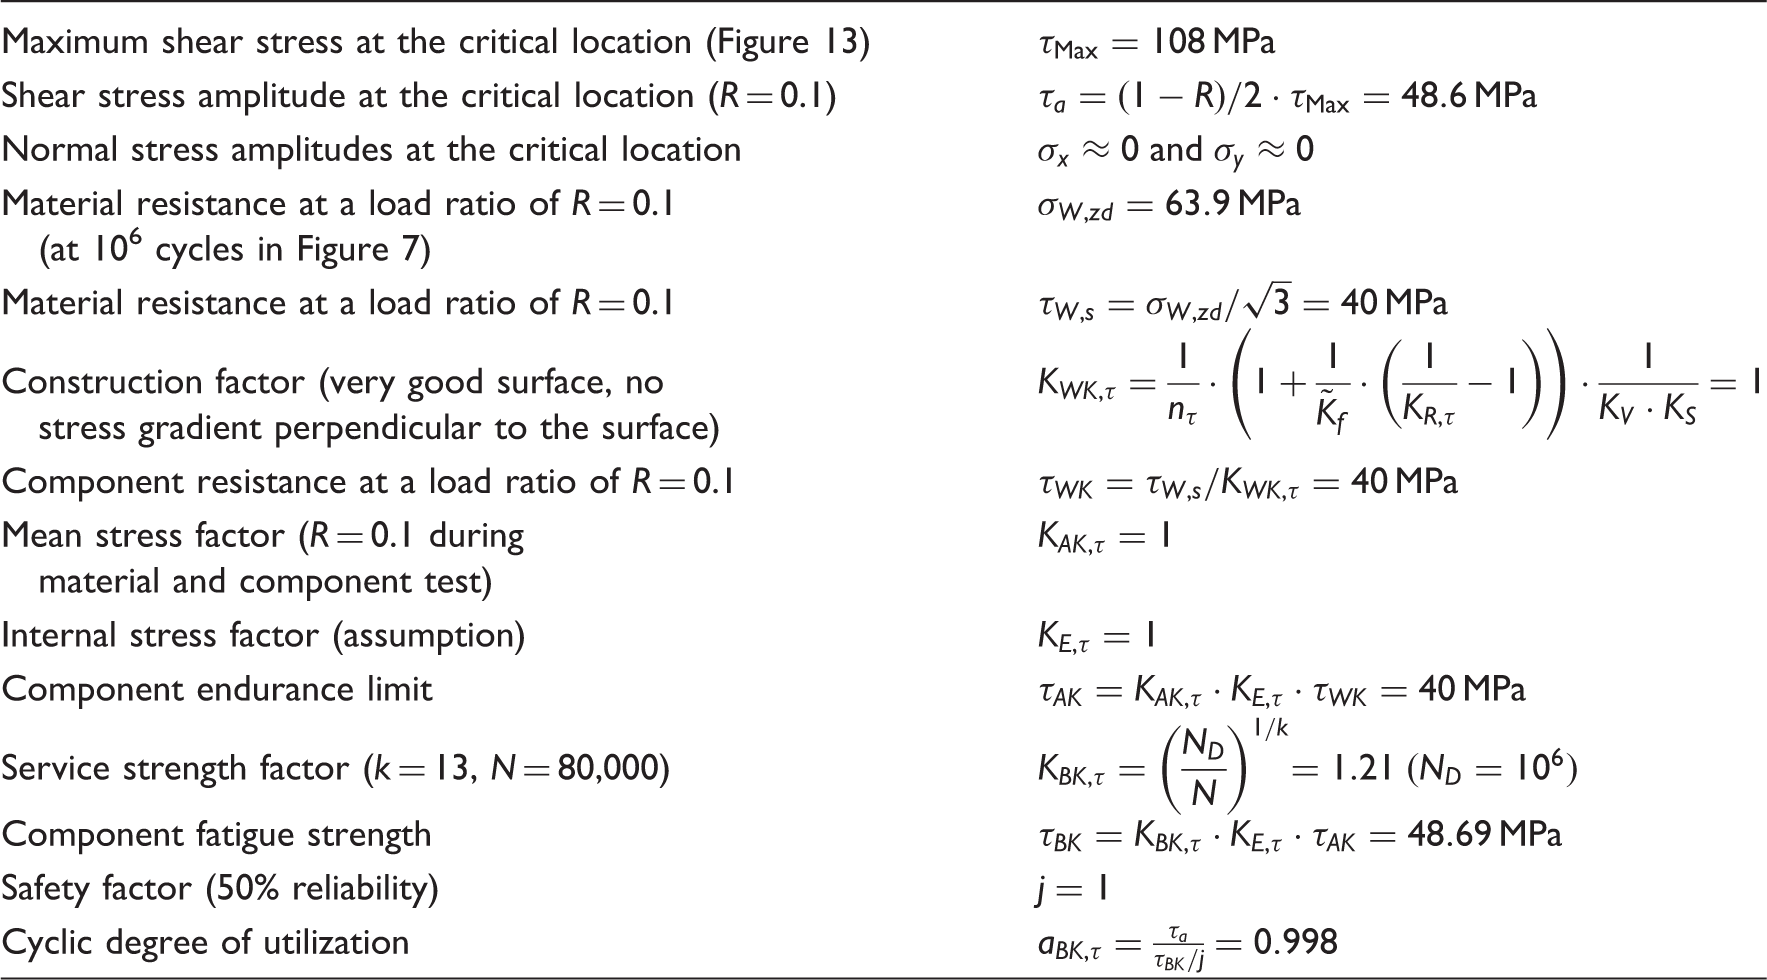
In Figure 13 the different stress components in the honeycomb core are illustrated for the specimen with the core oriented in the W-direction and a load amplitude of 787 N (randomly chosen). The fatigue prediction was made according to the FKM guideline for shell structures. Table 5 shows the calculation steps for this example, by using the FKM guideline (Hänel et al., 2003). For 80,000 cycles, the degree of utilization is 1. As a result the failure of the structure is predicted after 80,000 cycles according to the FKM guideline (Hänel et al., 2003).
Stresses in the core during the three-point bending test (load amplitude = 787 N, W-direction, element coordinate system). Fatigue prediction (Hänel et al., 2003) at the location shown in Figure 13: the component will fail after 80,000 cycles if the load amplitude = 787 N.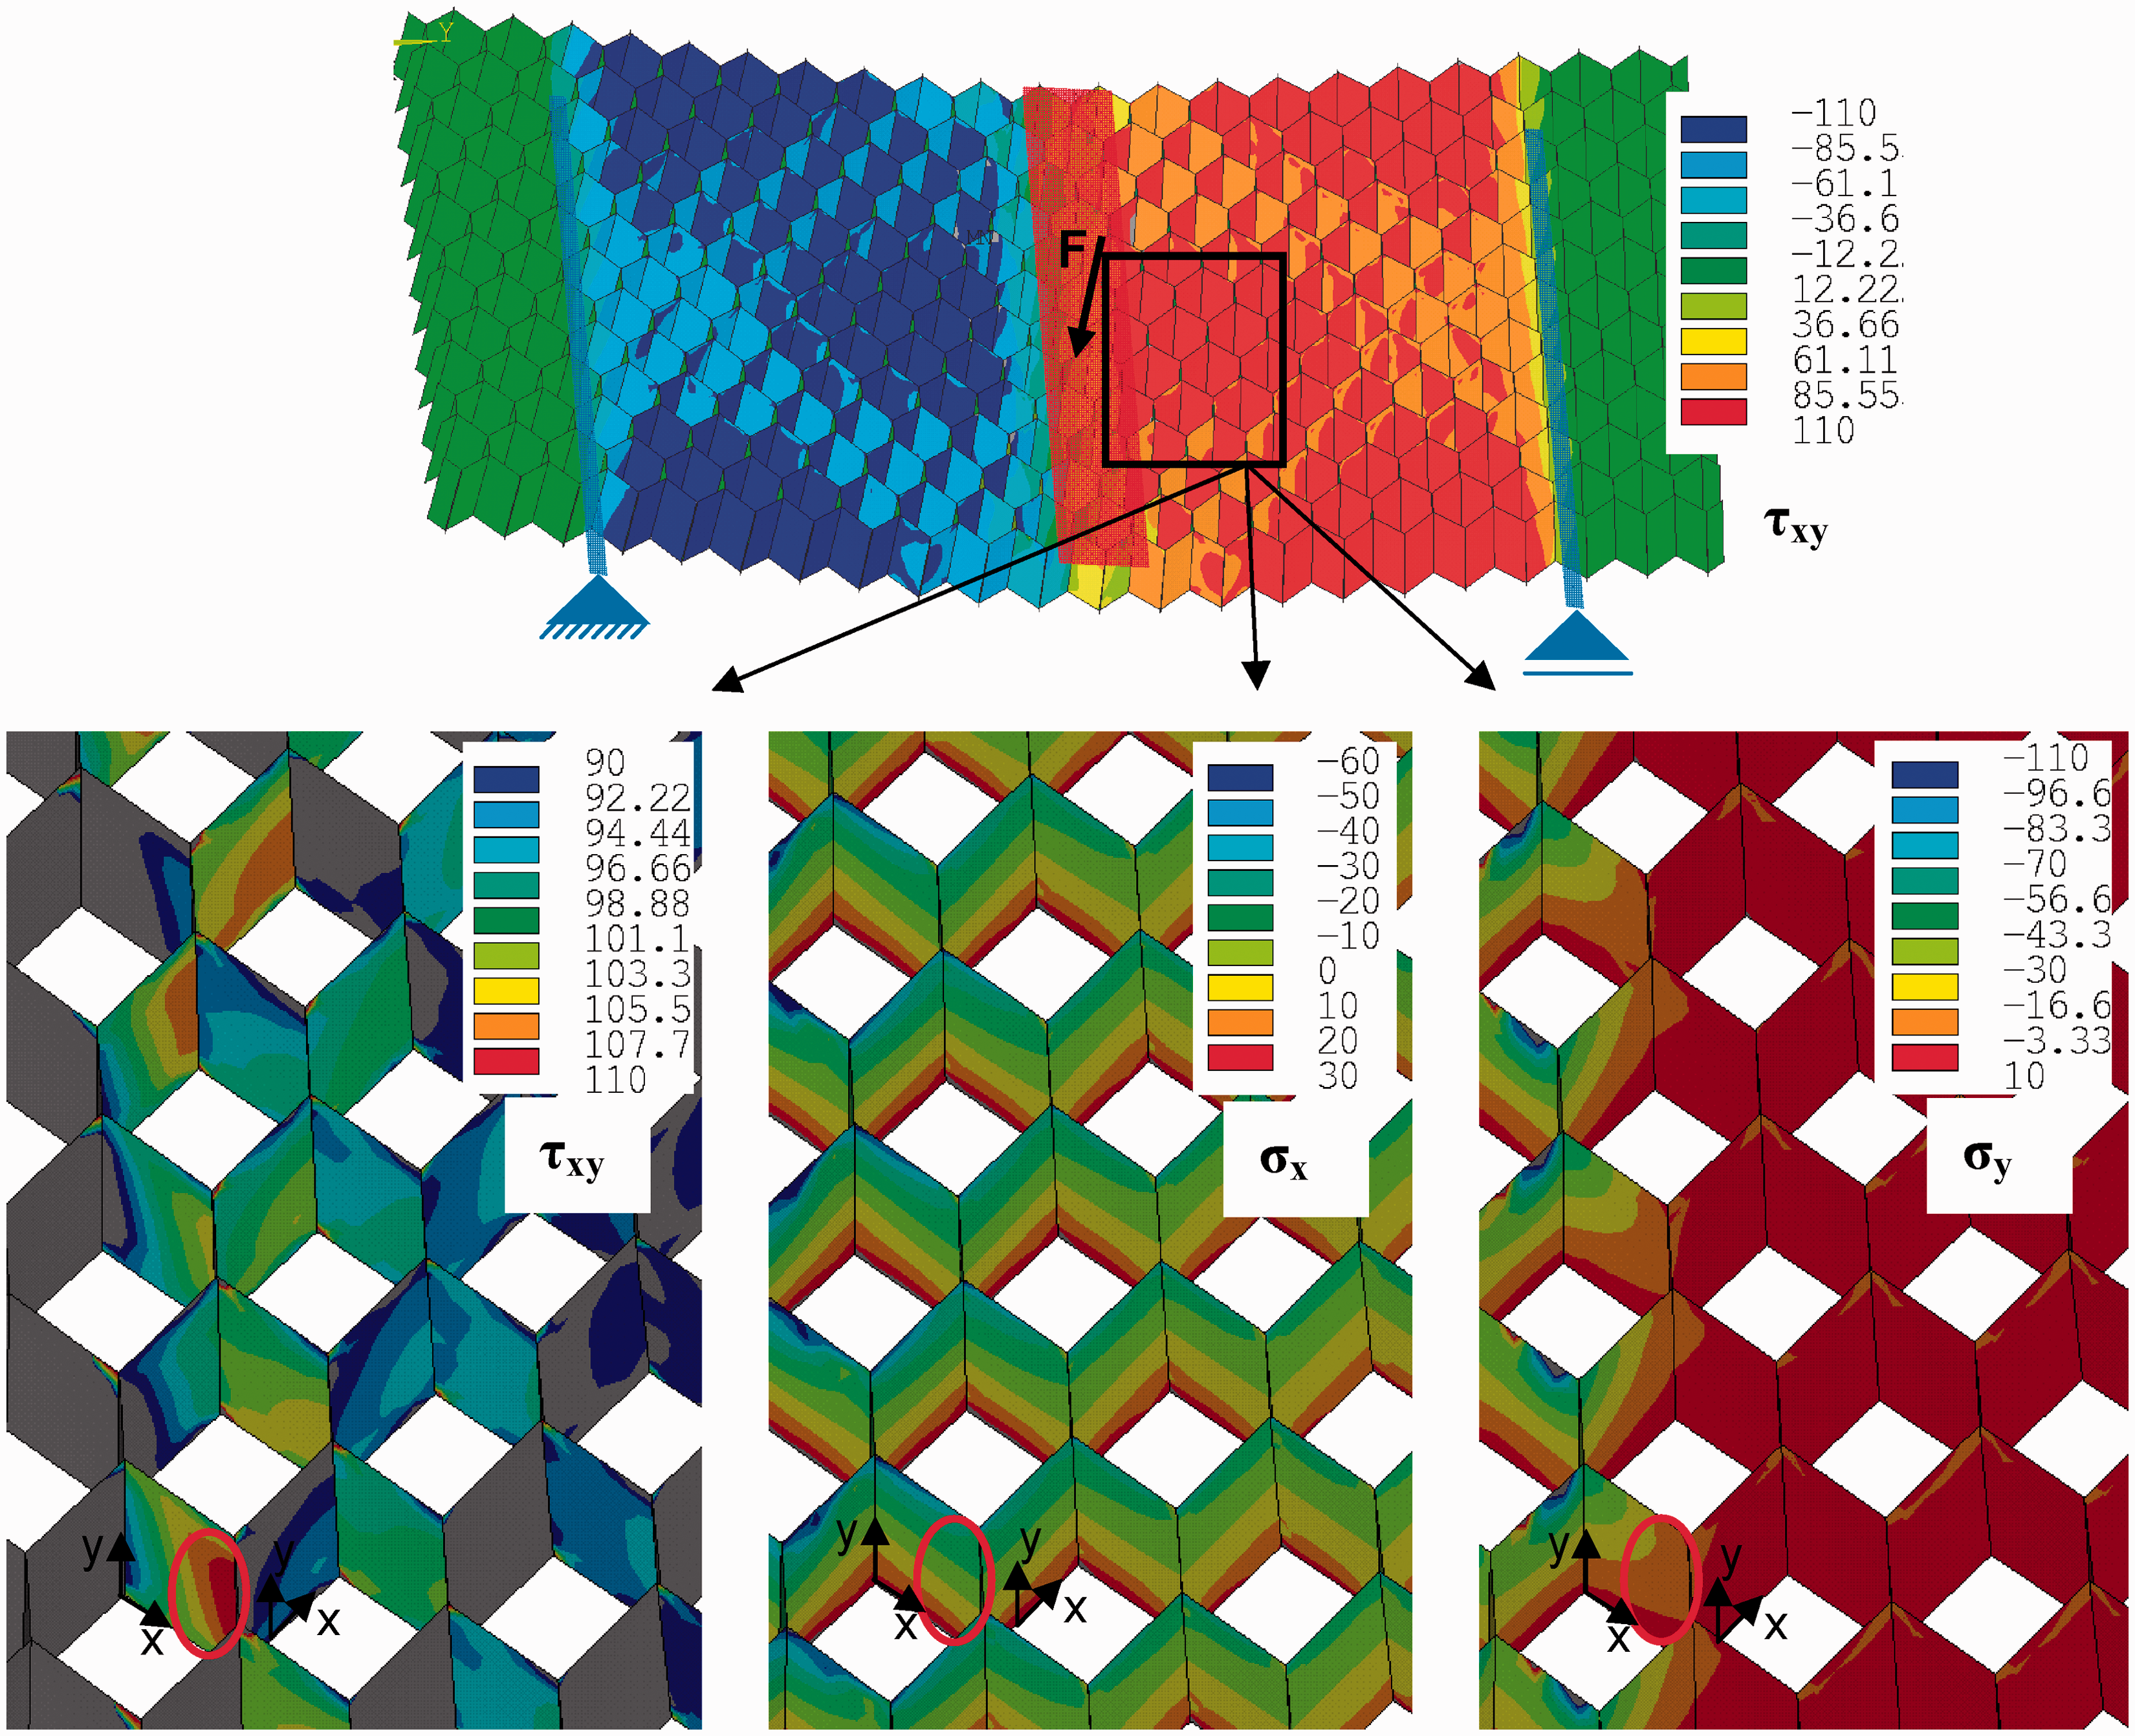
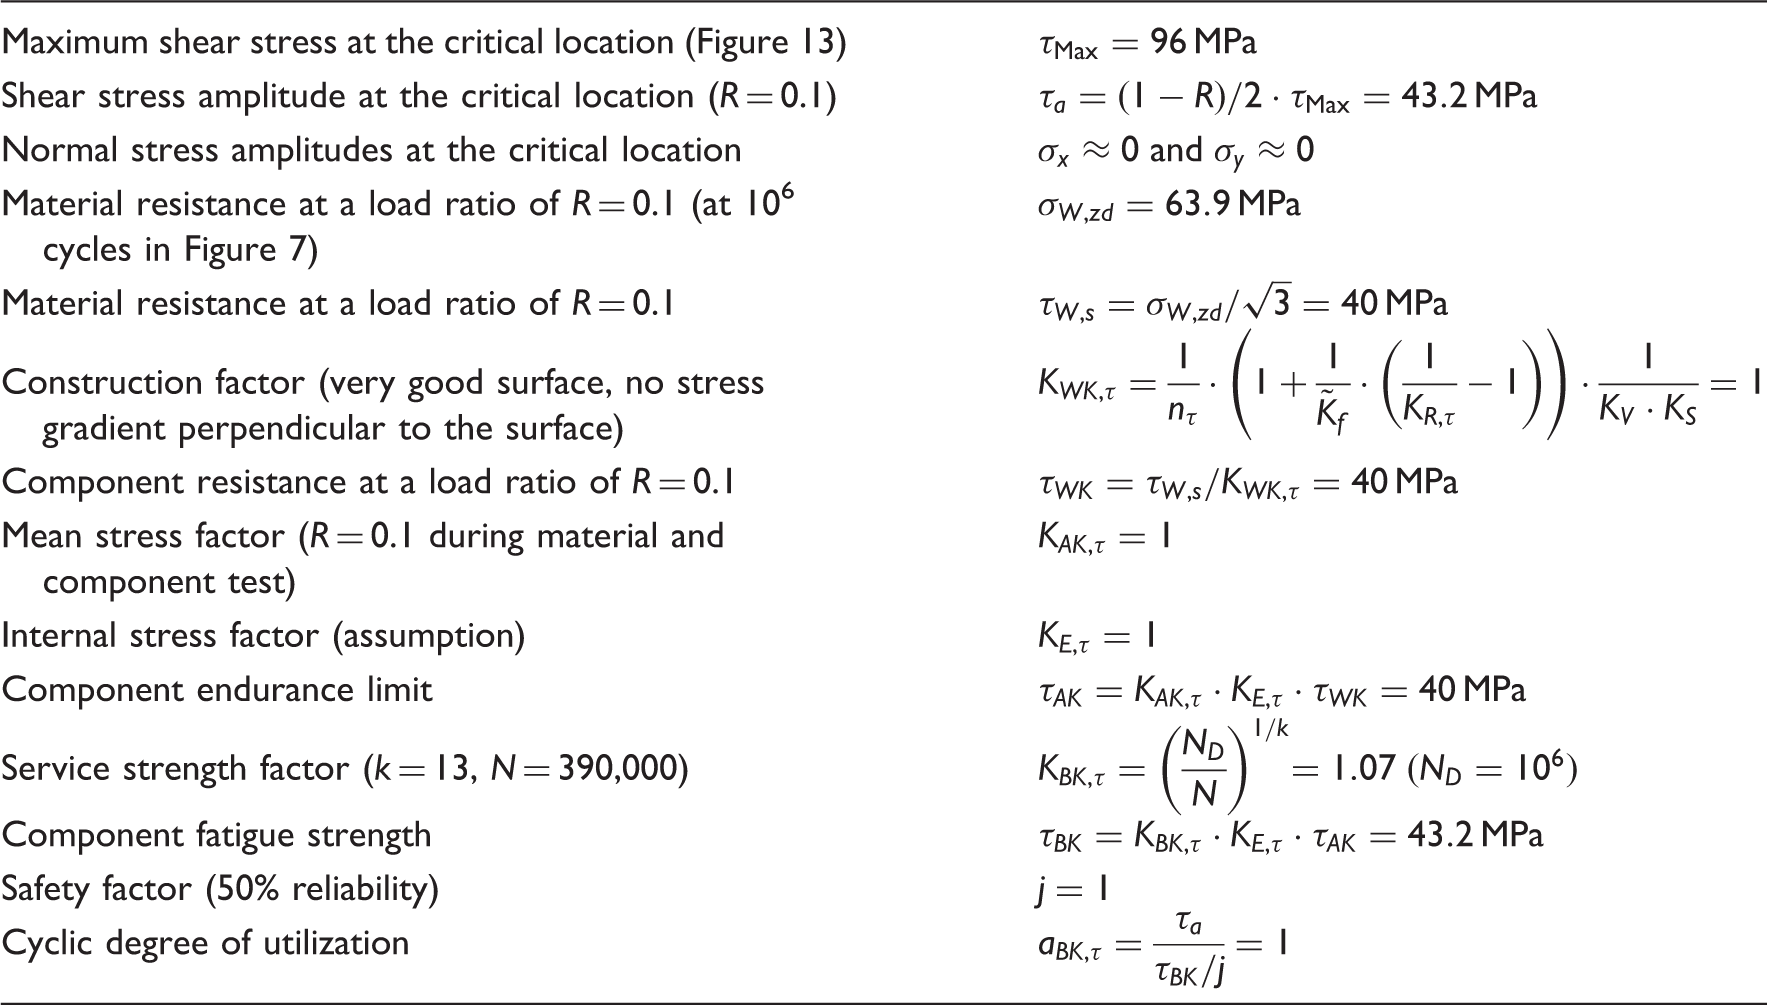
In order to confirm the results, a different core orientation is analyzed. In Figure 14, the different stress components for a specimen with a core orientation in the L-direction and a load amplitude of 990 N (randomly chosen) are illustrated. Similar to the W-direction, a fatigue prediction was made according to the FKM guideline (Hänel et al., 2003) for shell structures (Table 6). Although the load amplitude is higher in this example than in the example of the W-direction, the lifetime is higher as well (390,000 cycles vs. 80,000 cycles).
Stresses in the core during the three-point bending test (load amplitude = 990 N, L-direction, element coordinate system). Fatigue prediction (Hänel et al., 2003) at the location shown in Figure 14: the component will fail after 390,000 cycles if the load amplitude = 990 N.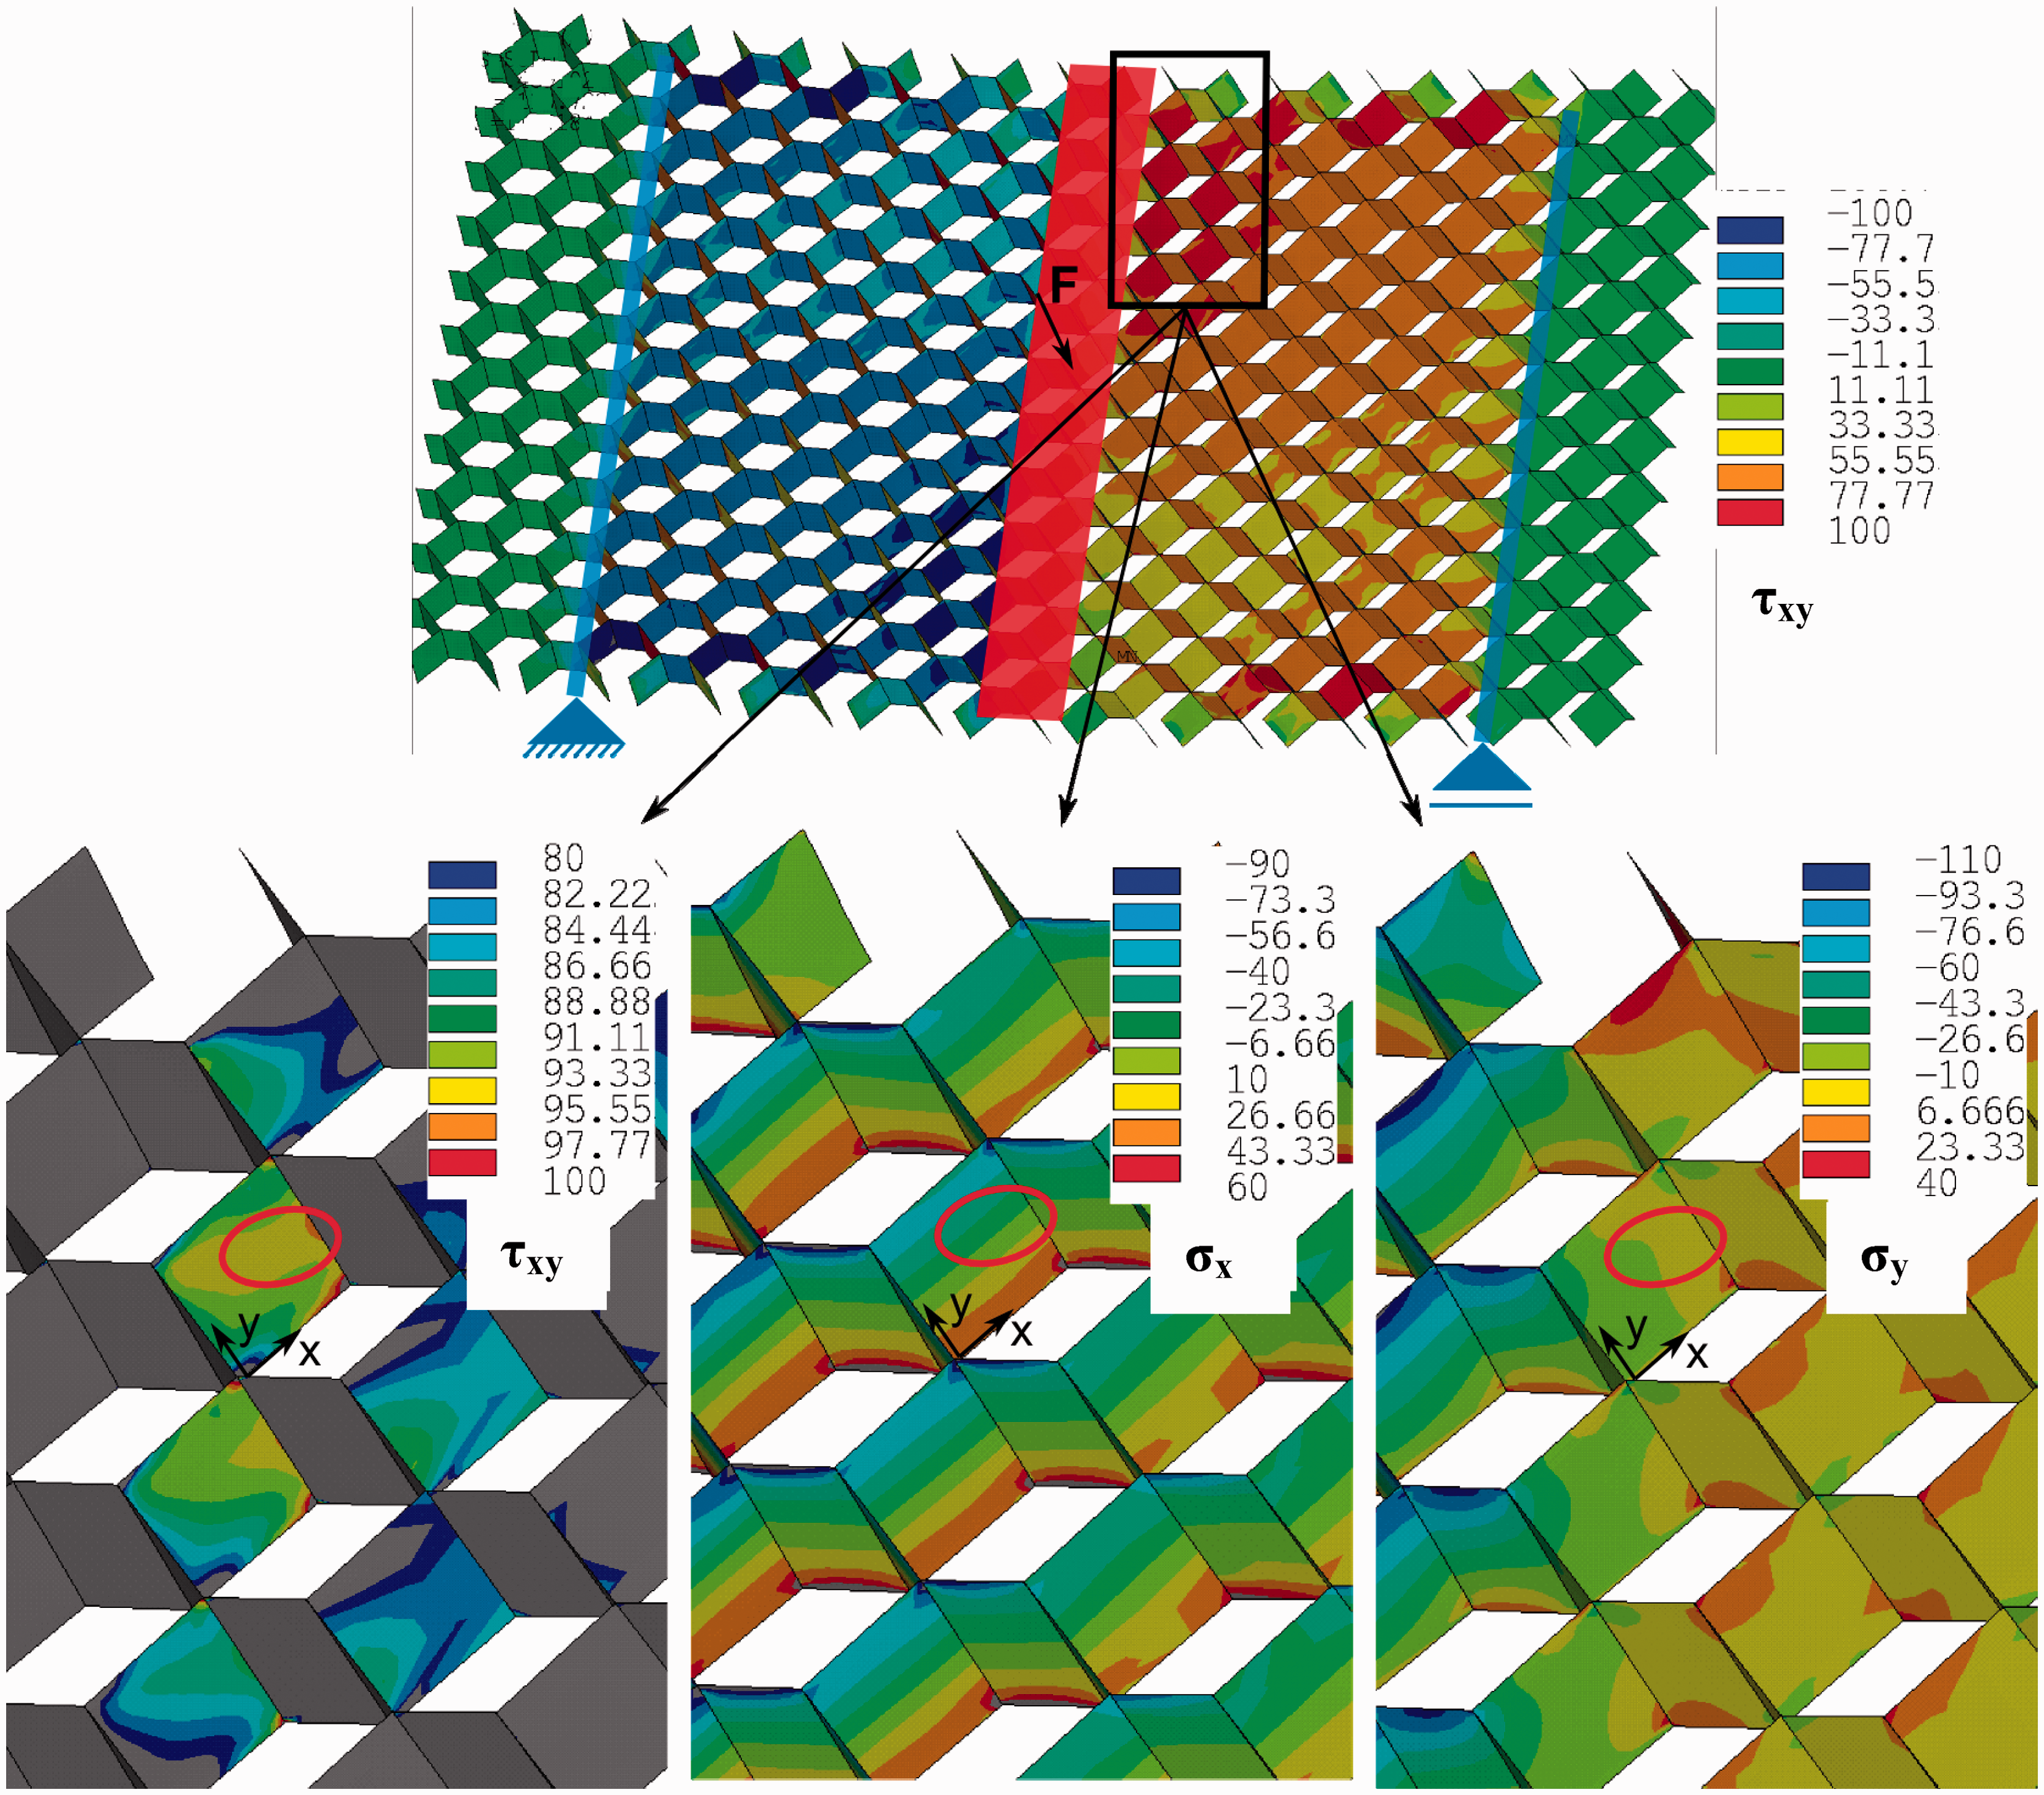
Food-cart roller fatigue analysis
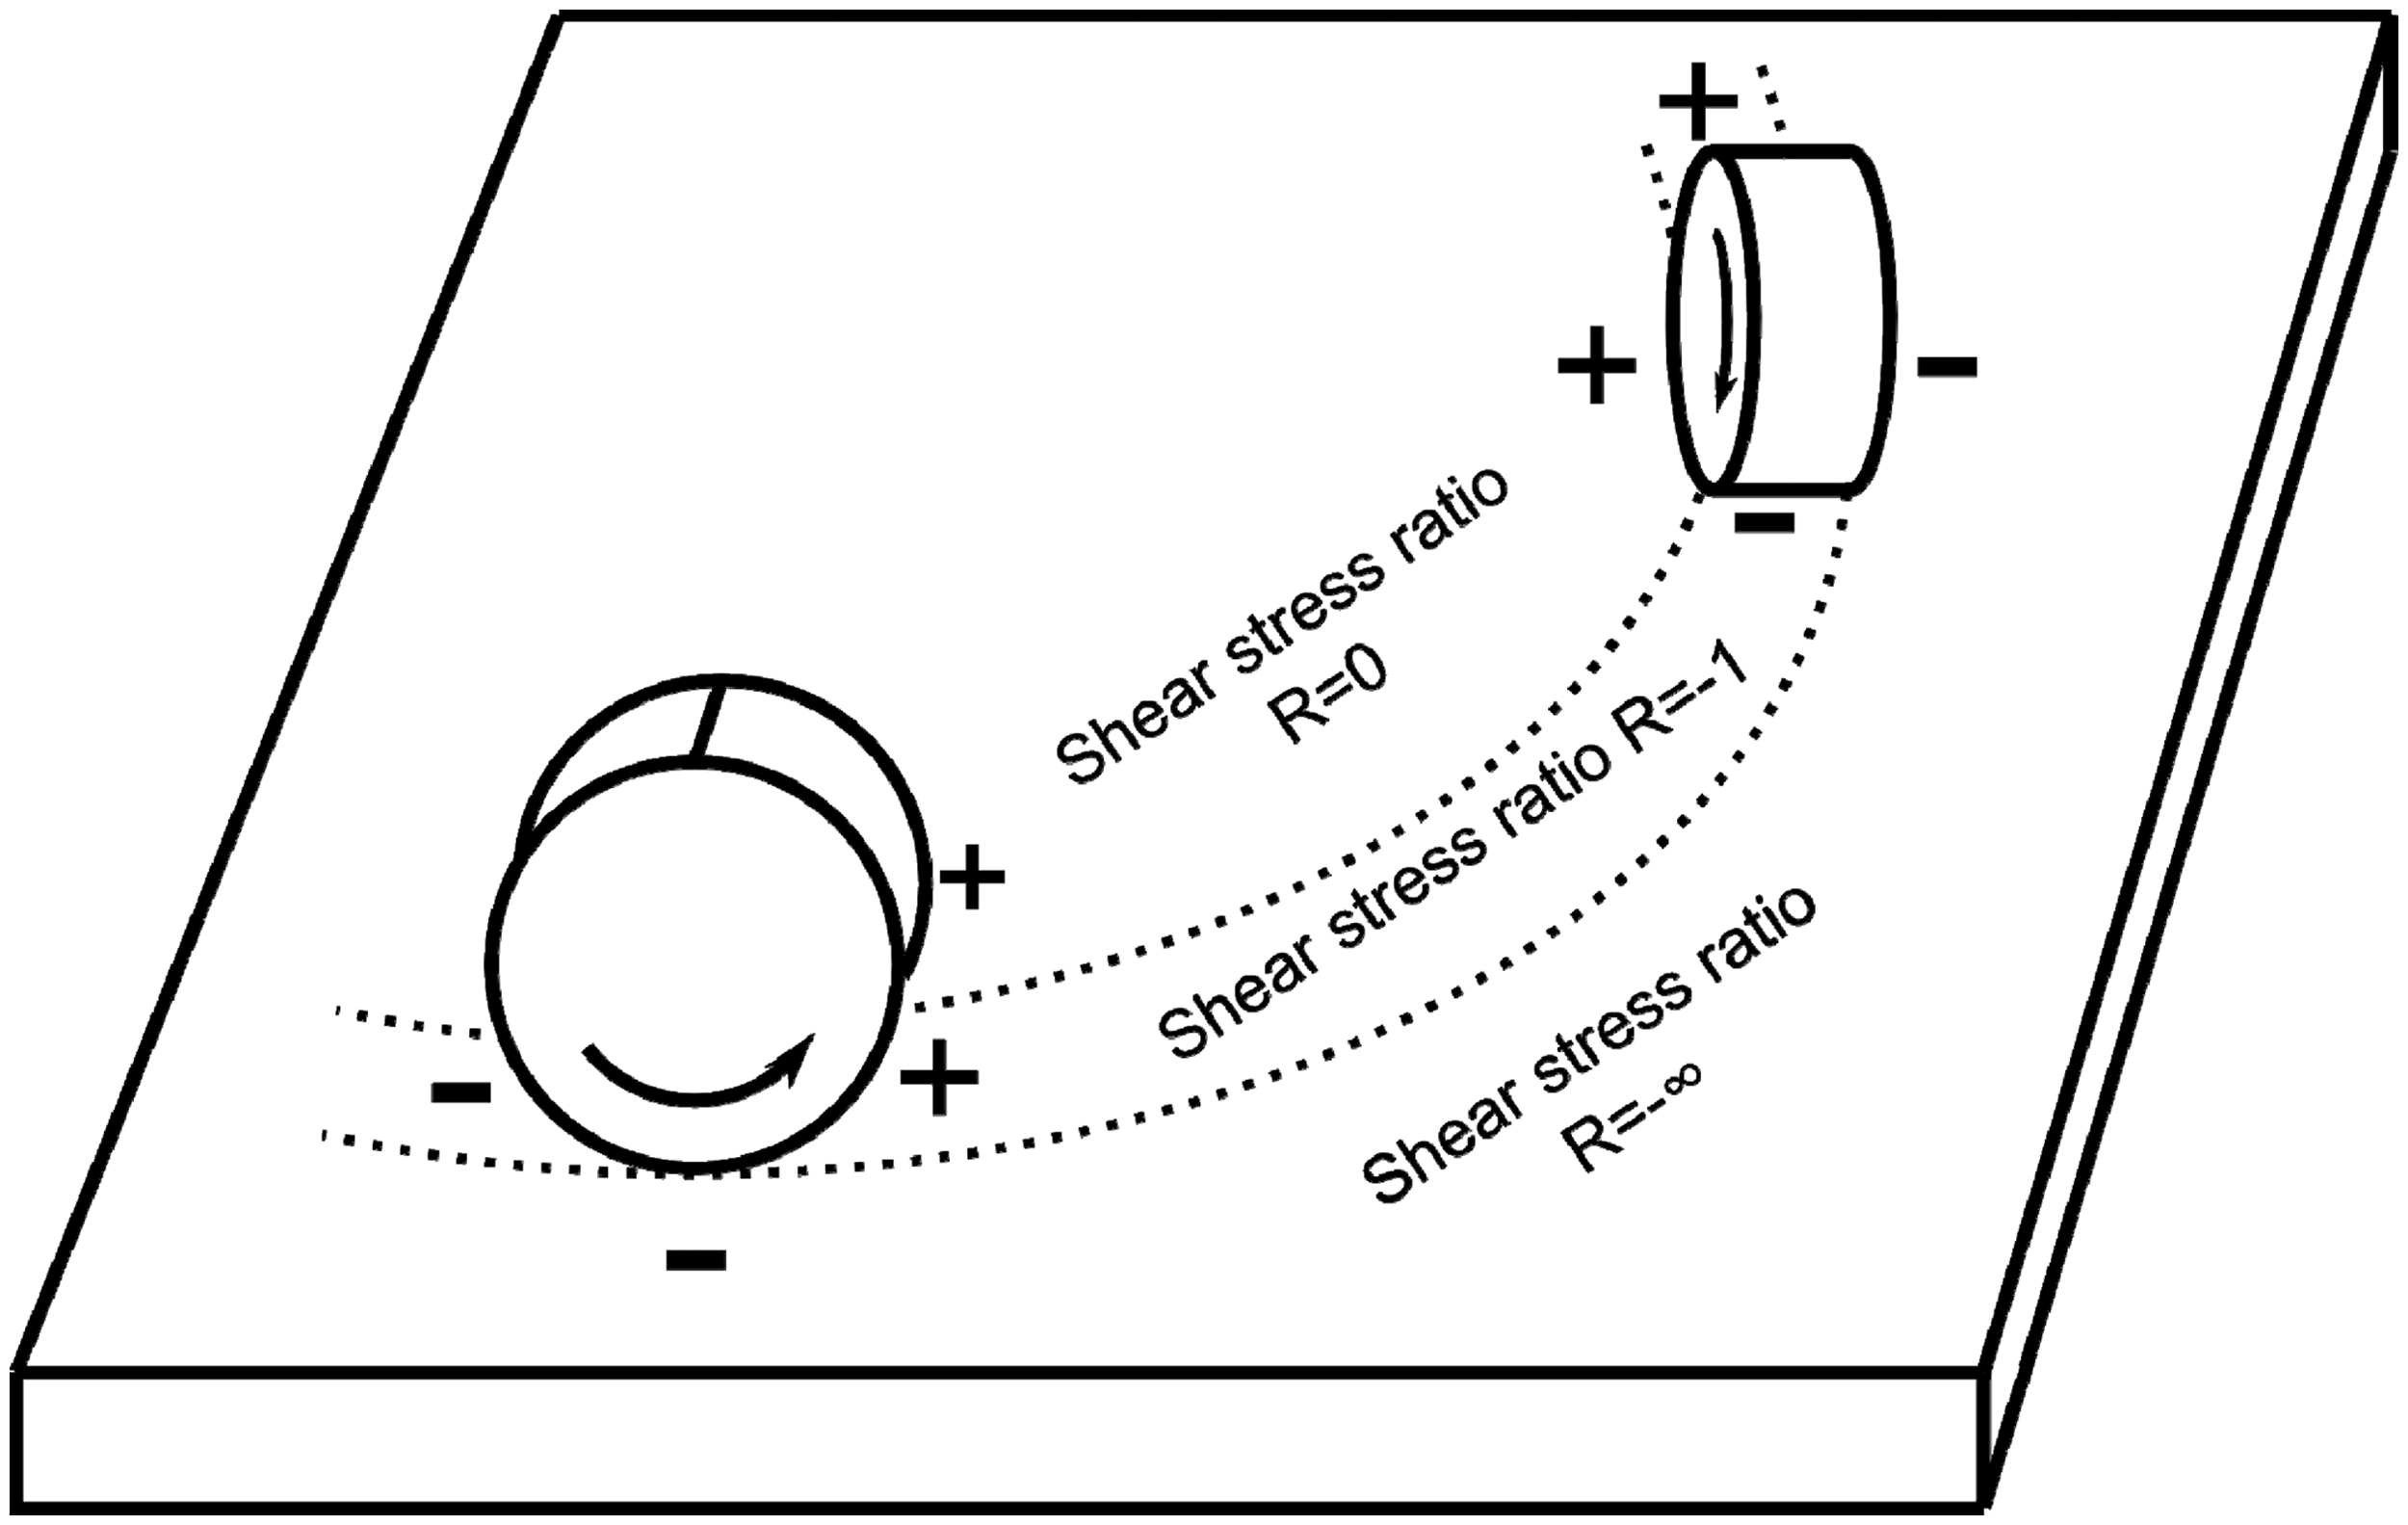
During the rolling movement of the load application, the stress distribution in the honeycomb structure is very different to the three-point bending test. Therefore, the stress distribution in the sandwich panel’s core is investigated first. The stress distribution under the wheel in the rolling direction is illustrated in Figure 15. The stresses were calculated by a finite element simulation. It is under the wheel that the compression stress is maximal and the shear stress is minimal. A buckling analysis shows that the compression stresses during this test are not leading to buckling of the cell walls (Table 4). Therefore, only a failure due to shear stresses was examined. The shear stresses have different signs in front and behind the wheel, so the shear stress ratio R on the wheel lane is –1. This is different concerning the left or the right side of the wheel (Figure 16). On the one side, the shear stress is always positive or zero, so the shear stress ratio R is zero at these locations. On the other side, the shear stresses are negative and the shear stress ratio R is –∞.
Stress distribution, taken from a finite element analysis, in the core next to the wheels. Different stress ratios, depending of the location.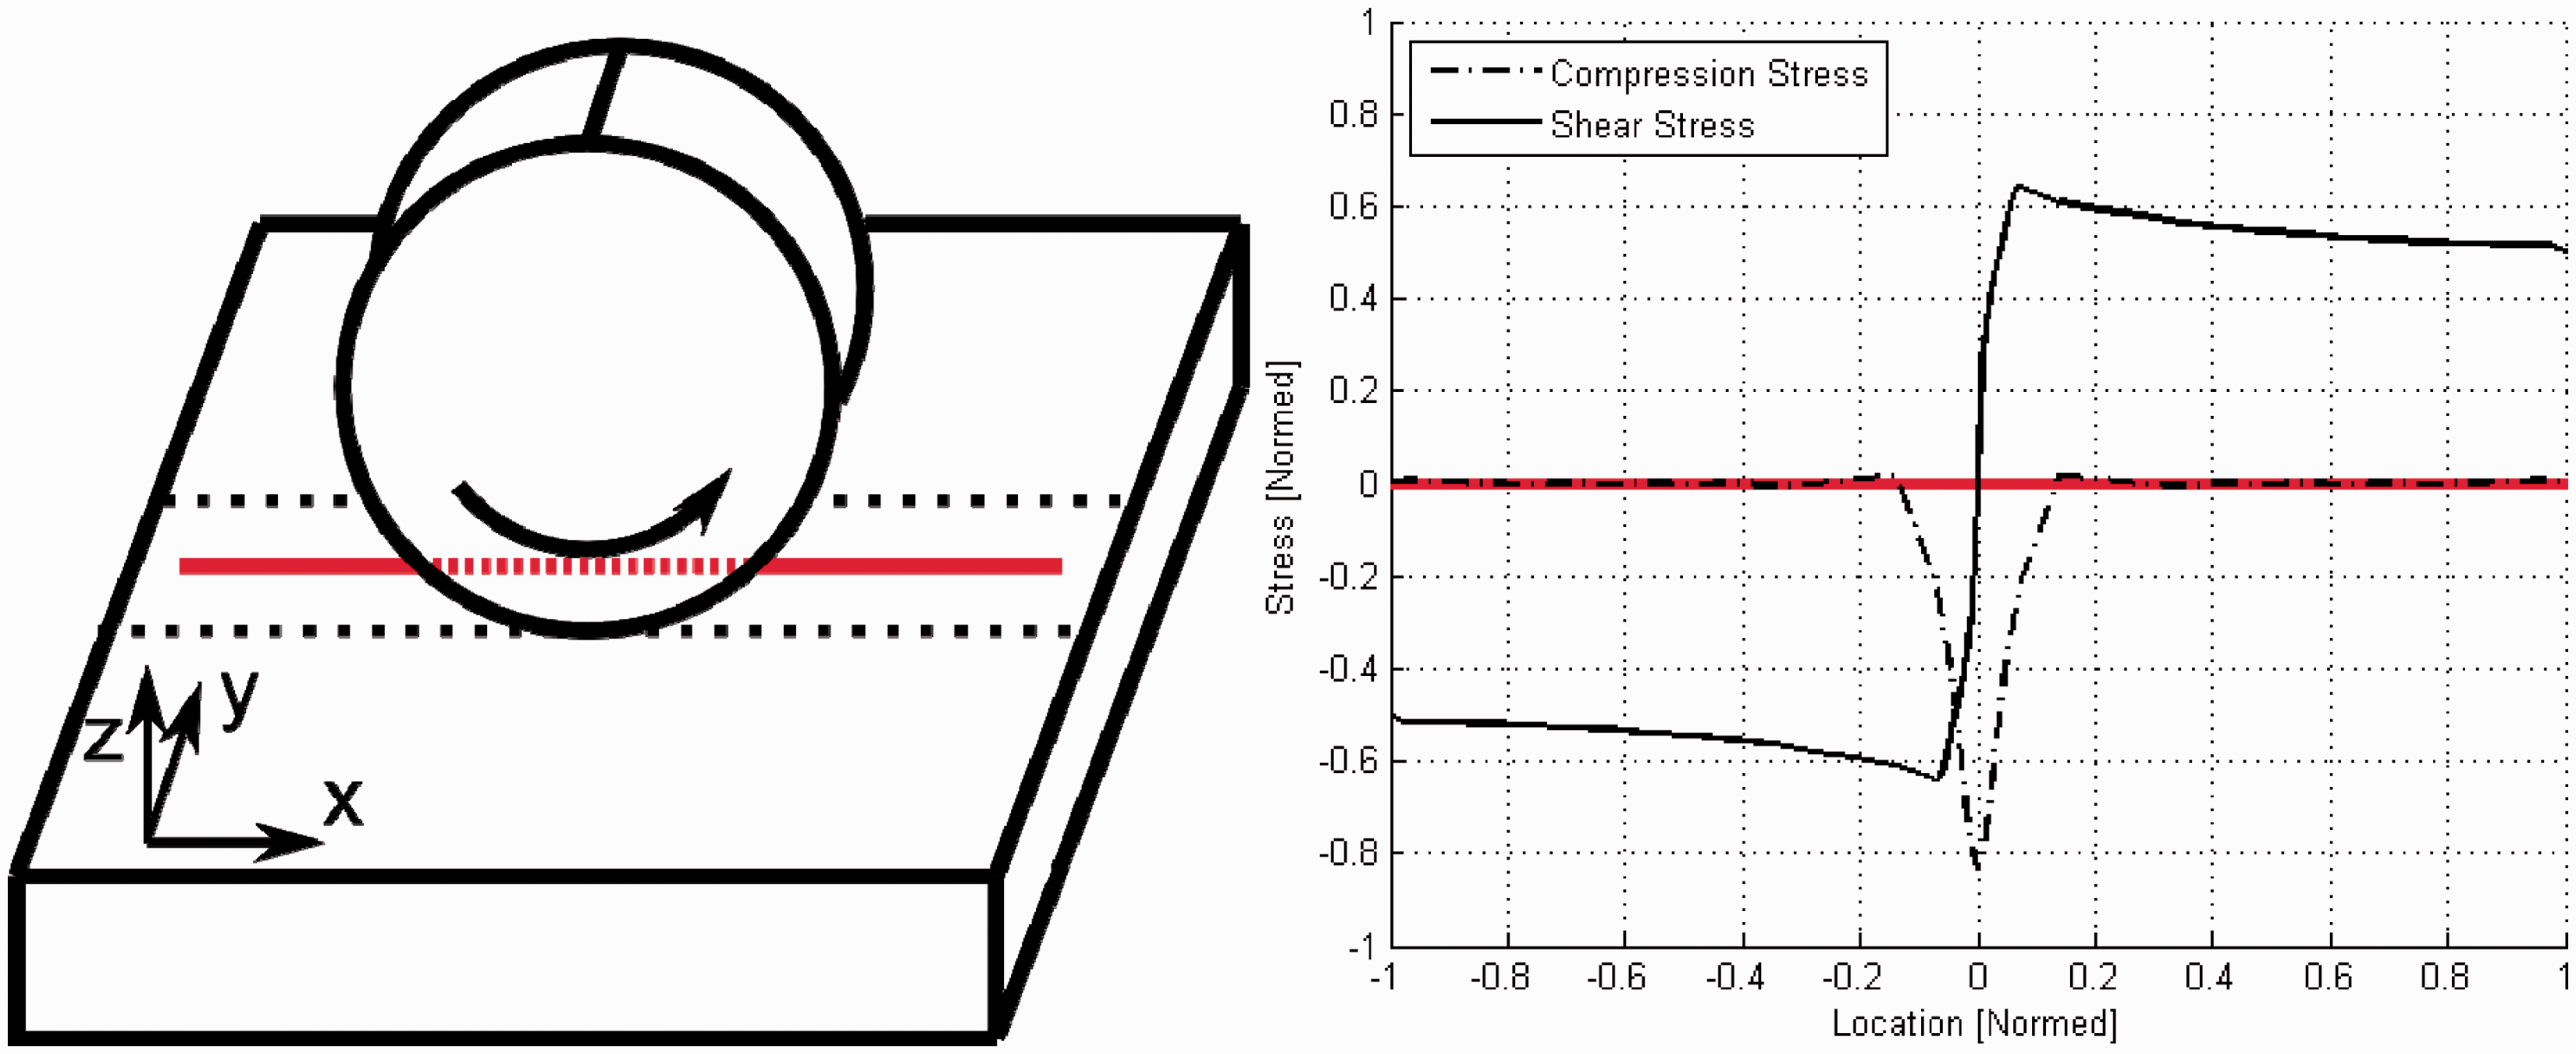
Due to the different shear stress ratios in the structure, the shear stress amplitude has approximately double the size at the wheel lane than left or right of this lane. Hence the core will fail on the wheel lane, so the fatigue analysis must only be made at these positions.
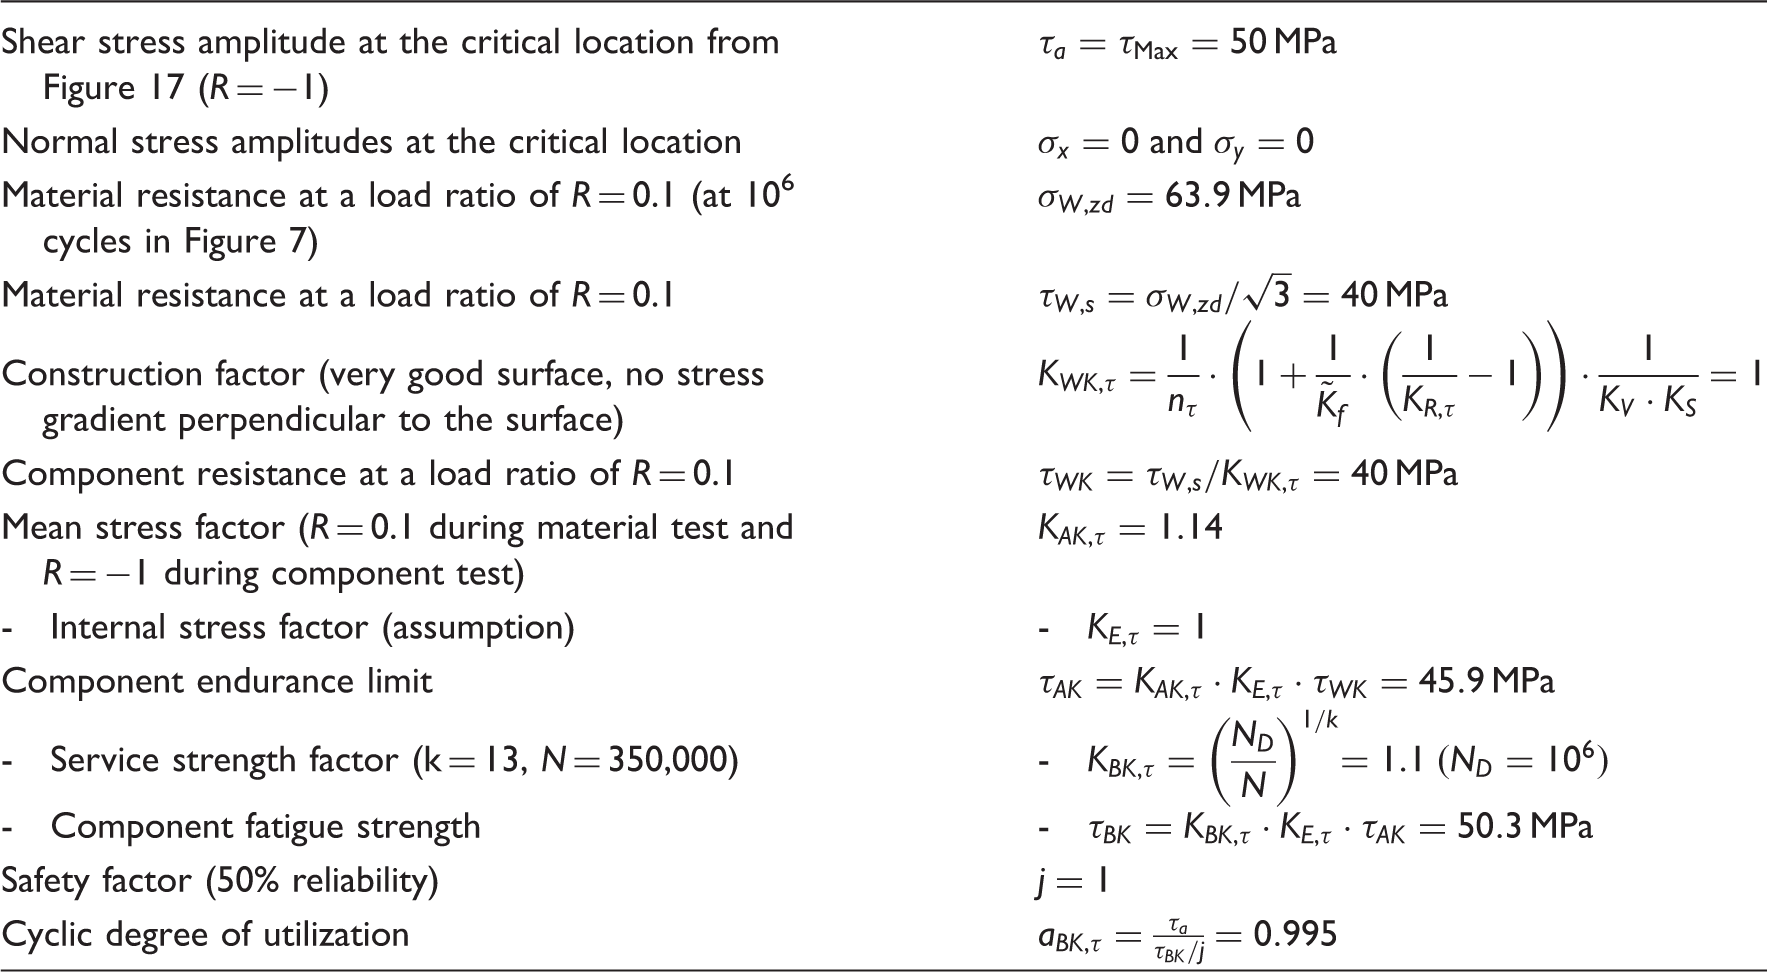
In order to find the panel’s weakest location during this test, some simulations were carried out. The size and the fixation of the panel had no big influence on the stresses in the core (on the stresses in the face sheets, however). The location of the load application has only a minor influence too. The core is failing at an angle of approximately 62° because the out-of-plane shear loads in the 62°-direction produce the highest shear stresses as shown in Figures 5 and 22. Figure 17 shows the different stress components in the honeycomb core, at the moment when the wheel is at 62° (critical position) for the specimen loaded with a 560 N (randomly chosen) per wheel. The critical walls are those where the shear stress ratio R is –1. The material tests have been conducted at a different stress ratio (R = 0.1), whereupon a mean stress factor had to be defined (Hänel et al., 2003). The fatigue prediction was made according to the FKM guideline for sheet-like components. Table 7 shows the calculation steps for this example. For 350,000 cycles, the degree of utilization is 1, so that the structure will fail after 350,000 cycles according to the FKM guideline (Hänel et al., 2003).
Stresses in the core during the food-cart roller test (load = 560 N per wheel at 62°, element coordinate system). Fatigue prediction (Hänel et al., 2003) at the location shown in Figure 17: the component will fail after 350,000 cycles if load amplitude = 560 N per wheel.
Comparison analysis/test results
Three-point bending results
The fatigue tests lead to shear failure in the honeycomb core. No cracks could be detected in the adhesive layers (delamination) or in the face sheets (the experimental setup was chosen so that the tensile stresses in the face sheets are small). Cracks were initiated in the interior of the honeycomb core, which grew predominantly perpendicular to the first principal stress (Figure 18). These cracks did not occur under the load, but some cells away from it, where the shear stress is maximal as shown in Figure 3. This proves that the failure is shear failure and not core indentation (core crush).
Fatigue shear failure for a core orientation in the W-direction.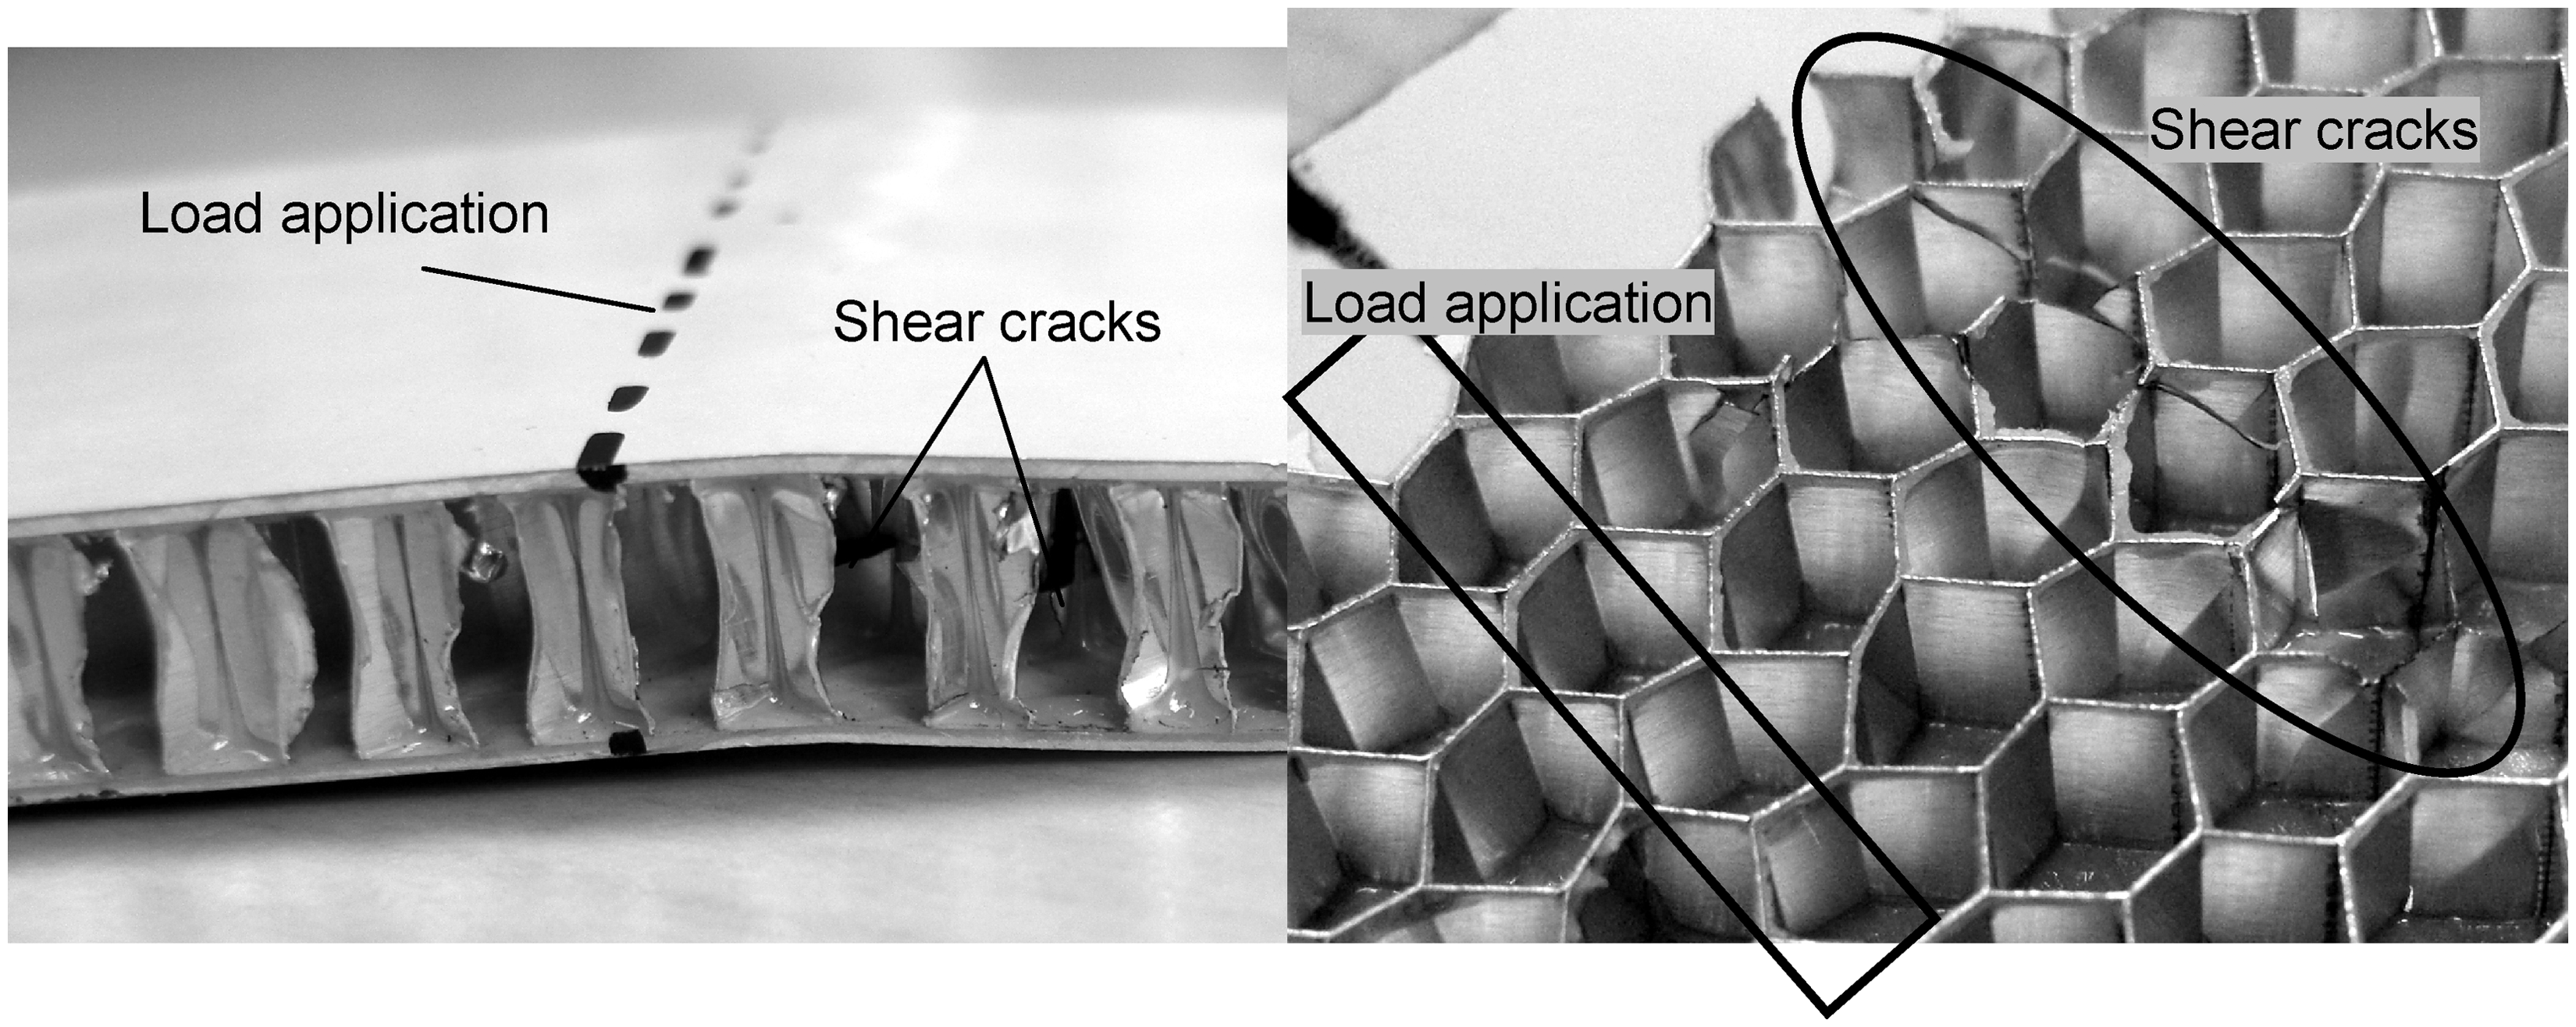
The amplitude of the cylinder displacement is nearly constant over the lifetime, mainly because the face sheets define the stiffness of a sandwich panel (the face sheets stay undamaged over the lifetime). Therefore, the displacement amplitude is not suitable to define a damage. A damage is defined in this work as an increase in the mean value of cylinder displacements by 50% of the displacement amplitude. In section “Stresses in honeycomb sandwich structures,” we have seen that the angle of the core has considerable influence on the shear stresses in the structure. Therefore, the tests were made with three different angles: 0° (L), 62° and 90° (W). The 0° angle is the stiffest direction, 90° is the most compliant direction and 62° is the weakest direction. (The stresses reach a maximum in the 62°-direction, Figure 5.) In Figure 19, the fatigue prediction according to section “Three-point bending fatigue analysis” is compared with the test results of these three angles for 6.4 mm and 9.6 mm cell sizes. The 62°-direction is the weakest one, as was explained in section “Stresses in honeycomb sandwich structures.”
Fatigue strength diagram for samples loaded in different directions and for 6.4 mm and 9.6 mm cell sizes. The ordinate of the fatigue diagram displays the force amplitude and not the stress amplitude at the location of the crack initiation. These two values are related, and the relationship is linear assuming Hooke’s law and small deformations. The number of cycles on the abscissa corresponds to the number of cycles to complete failure of the part due to the fact that the cracks are invisible from outside.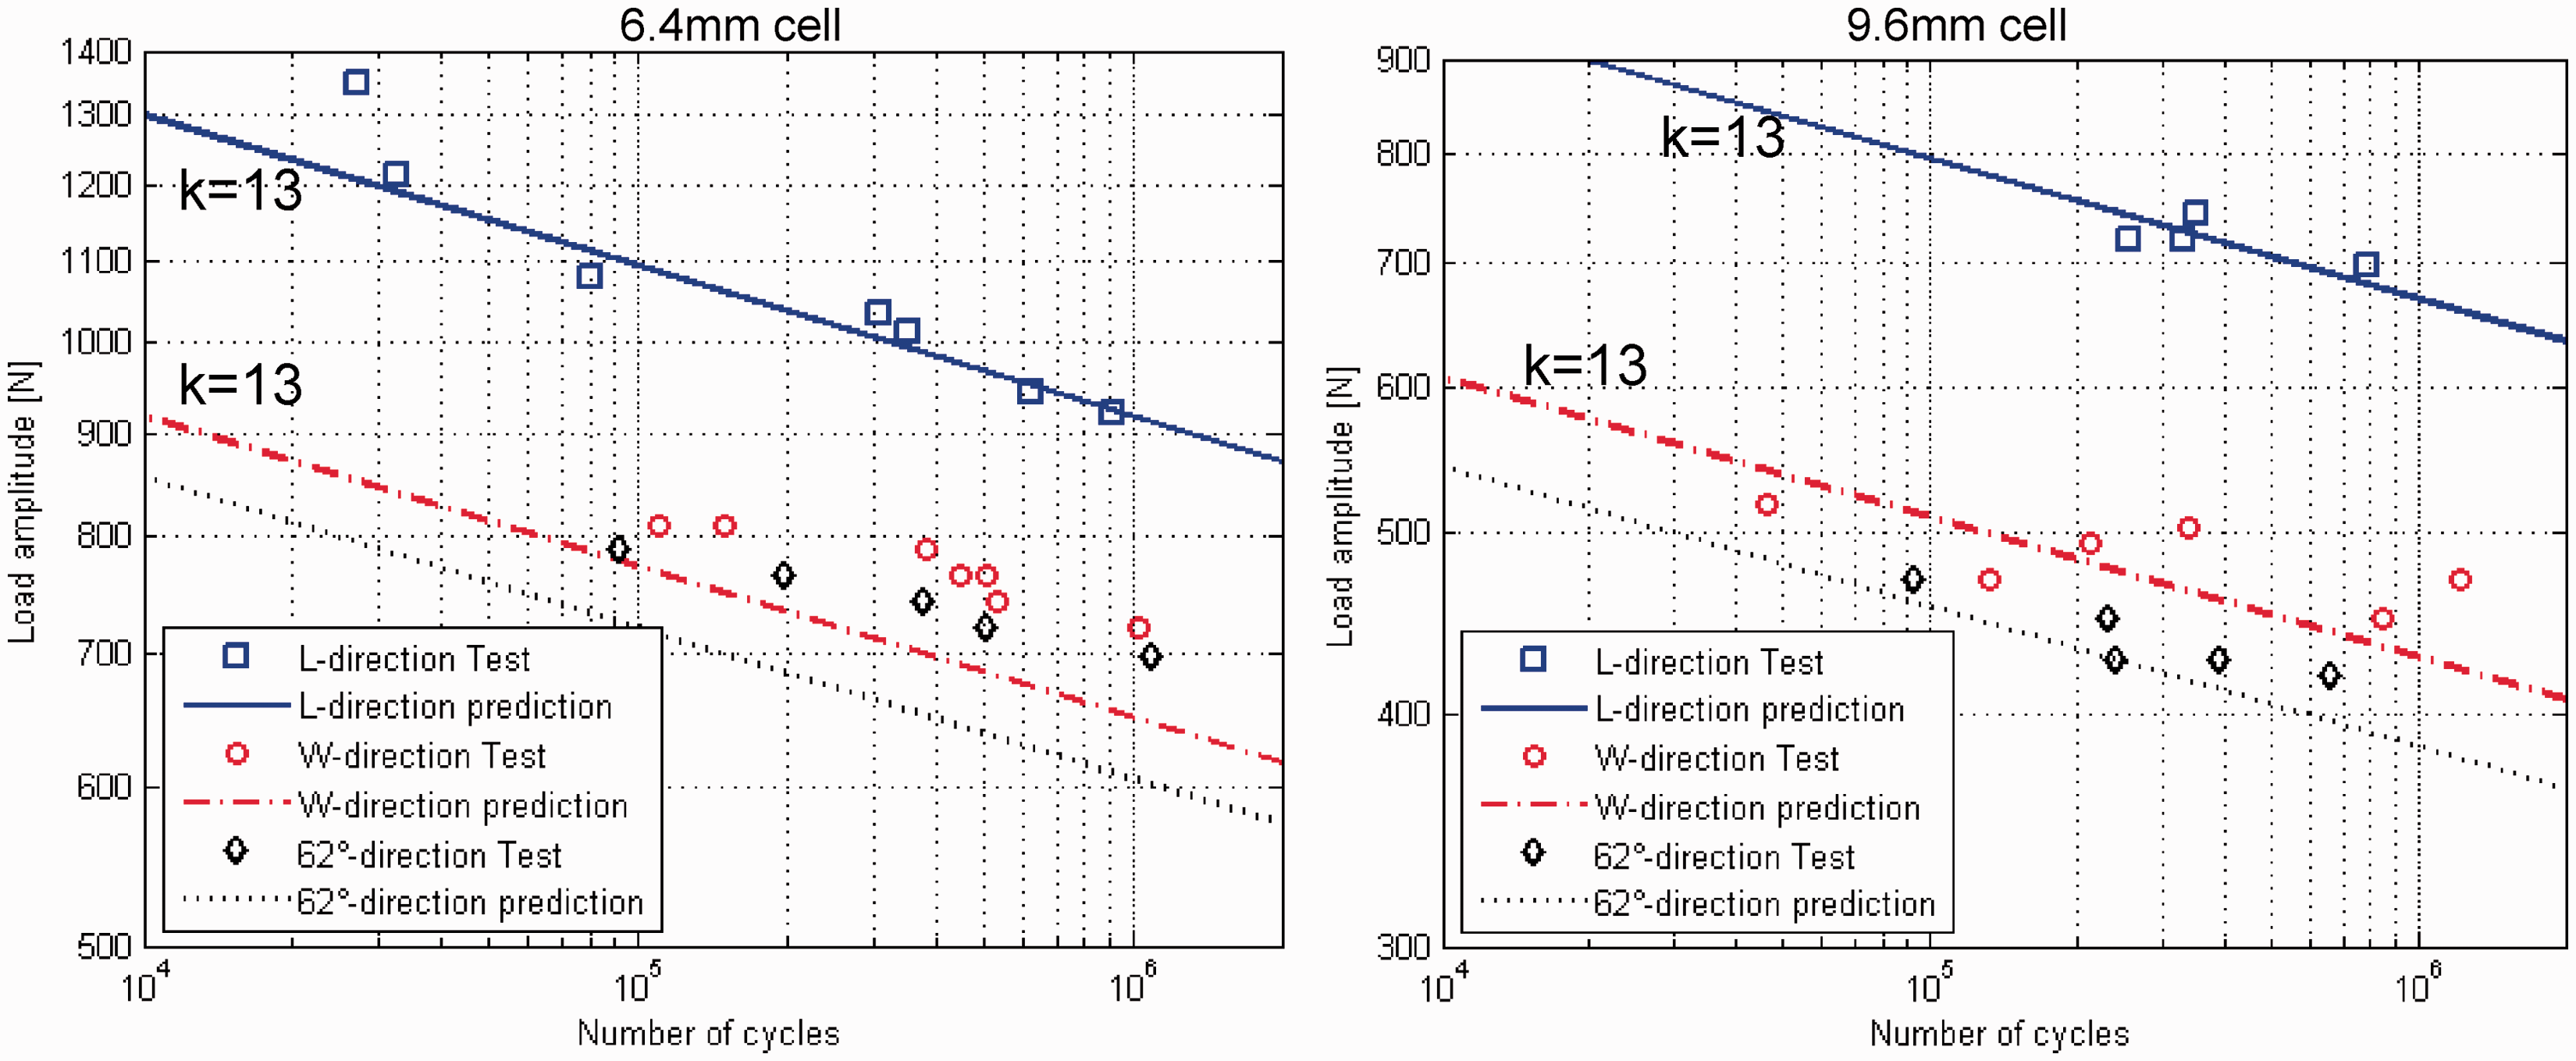
Food-cart roller results
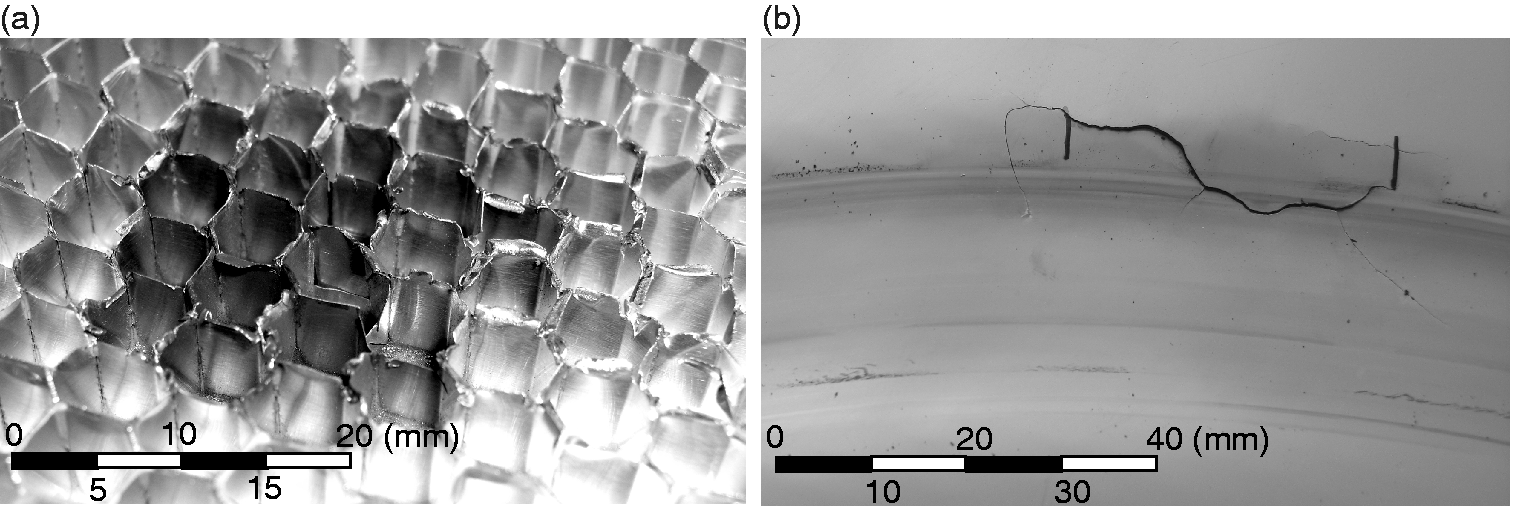
The testing configuration in Table 3 and the panel configurations in Table 2 always lead to the same damage mechanism. During the first 90% of the sandwich panel’s total lifetime no damage could be detected. Afterwards some cracks occurred in the panel’s core (Figure 20). These cracks were located under the wheel lane and only in the walls, whose direction is almost parallel to the rolling direction. The simulations have shown that the shear stresses are prevailing (Figure 17), which means this is a shear failure. In order to see the cracks, the plates had to be removed from the panel, meaning that the structure had to be destroyed. During the tests no sensor was able to detect these minor cracks, which did not immediately lead to a total failure. When several cracks occur at the same location, the core cannot bear the load anymore and crushes (Figure 21(a)). This crush is not the reason of the failure, but only the consequence of the previous shear failure. At this point, the damage is detectable from outside because a plastic deformation becomes measureable at the face sheet (but the panel can still carry loads).
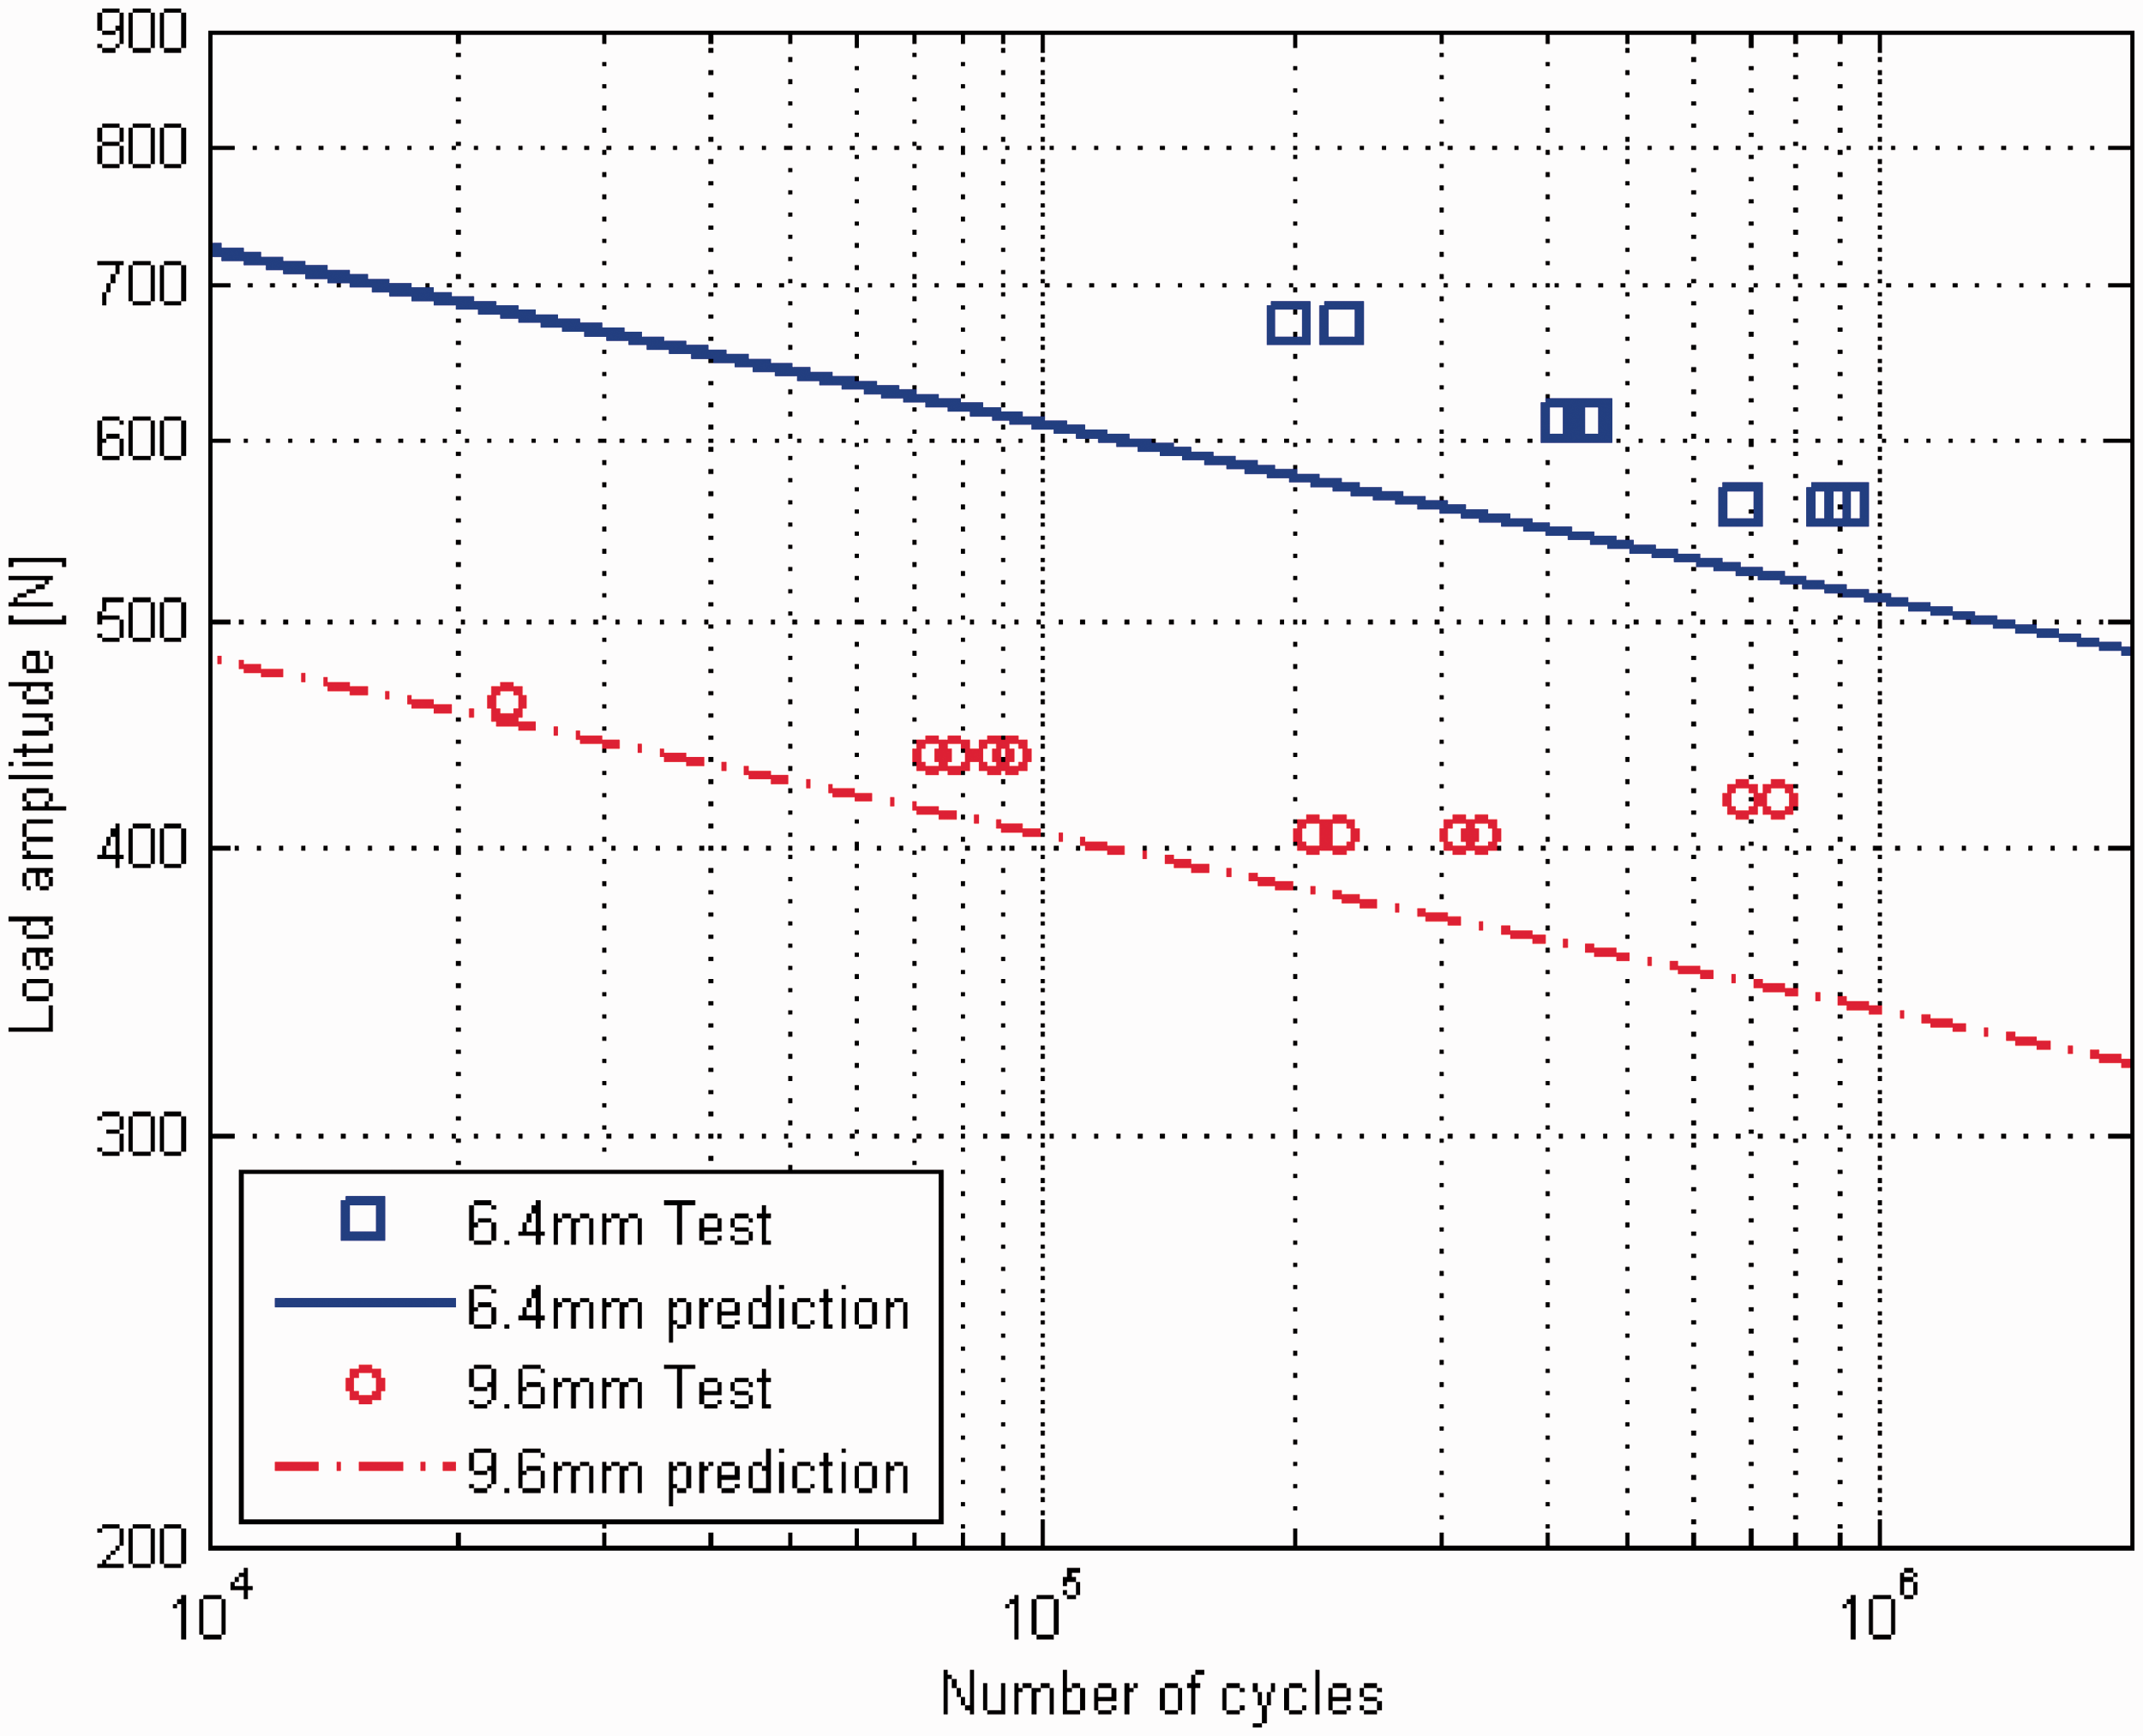
Cracks occurred after over 90% of the structure’s lifetime. (a) Location of core crush after cracking and (b) crack in the coversheet of the pane after core crush. Damage occurred at approximately 62° from the L-direction. After the crush of the core, the plate of the panel is subjected to considerably higher stresses, which finally lead to a total plate failure (Figure 21(b)). The food-cart roller tests were executed at different load amplitudes. In Figure 23, the fatigue prediction according to section “Food-cart roller fatigue analysis” was compared with the test results of 6.4 mm and 9.6 mm cell sizes. The abscissa illustrates the number of cycles before core failure occurred. As shown in Figure 22, the panel has four potential damage locations. As a result it is theoretically possible that every test provides four measuring points in the fatigue strength diagram. In reality, however, to prevent damage being caused to the test equipment, the test often has to be stopped before the fourth location fails.
Fatigue strength diagram of the food-cart roller test.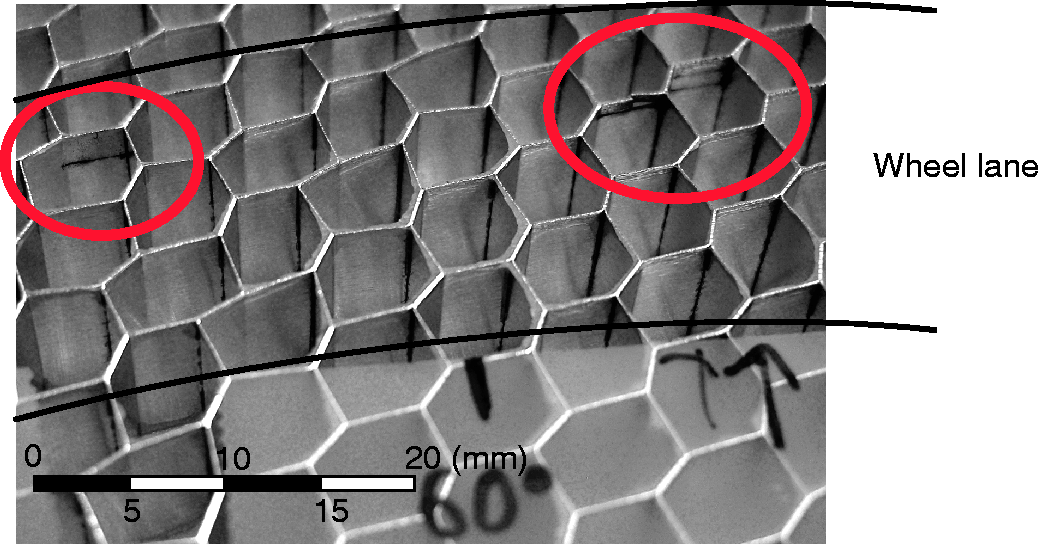

Conclusions
There were two different failure modes of the aluminum honeycomb core structure examined: core indentation and shear failure. Core indentation induces the buckling of several honeycomb cells. In practice, components should be designed that no buckling will occur. The buckling load can be easily calculated with a finite element simulation. The shear failure mode can be analyzed by carrying out a static finite element analysis. Afterwards a lifetime analysis can be made using the FKM guideline. The lifetime predictions were confirmed by two different types of tests, namely the three-point bending test and the food-cart roller test. The differences between the predicted and tested lifetimes were inferior to 14% in load amplitude, with the predictions usually being conservative. The sandwich panels with a honeycomb core were investigated at different angles, and it was shown in theory and during testing that the 62°-direction is the weakest.
Footnotes
Funding
The project was financially supported by Eurocomposites, Echternach, Luxembourg.