
Abstract
This paper reports a meso-structure model of 3D-braided composites for the analysis of compressive behaviors and failure modes under quasi-static and high-strain rate compression. An idealized geometrical model of 3D-braided composite, which has the same preform meso-structure with four-step 3D-braided composite is established for finite element analyses of compressive behaviors. The compression stress–strain curves obtained from experimental along the in-plane and out-of-plane directions were used to validate the finite element analyses model. The agreement between the experimental and finite element analyses results proves the validity of the finite element analyses model. It was found that the finite element analyses model provides a way to obtain the locations of stress propagation, the 3D stress state and the progressive failure behavior. The numerical results also showed that the fiber tows in the surface and corner area of braided preform play an important role during both quasi-static and high-strain rate loading.
Keywords
Introduction
Textile structural composites as a new kind of engineering materials have been rapidly developing in the past years (Mouritza et al., 1999). In particular, three-dimensional (3D)-braided composites were developed in the late 1960s to produce 3D carbon–carbon composites that replace high-temperature metal alloys in rocket motor components in order to achieve weight savings of 30–50% (Hu, 2008). It was recognized as one of the most promising materials not only due to their low delamination tendency but also the near-net-shape manufacturing, impact tolerance, and ablation resistance (Bilisik, 2013; Fang and Liang, 2011). In order to extend the applications of 3D-braided composites, especially in the automotive, aircrafts, and impact protection structures, the understanding of their mechanical behavior at different strain rates is necessary in the design of composite materials.
As the architecture of a braided fabric is complex, its mechanical behavior is influenced by various parameters including constituent fiber and matrix properties, braiding patterns, fiber packing density in the yarns, overall fiber volume fraction, etc (Huang, 2005). There are a considerable number of researches that has been conducted to understand the intricate interior architecture of the braided composites (Guo-dong et al., 2009; Li et al., 2010a), as well as for capturing their mechanical, failure behavior, and complex interactions during various loading conditions. Numerous experimental, analytical, and numerical approaches have been employed. Quek et al. (2003) and Wang et al. (2012) conducted a series of biaxial test to understand the compressive and tension mechanical behavior of braided composites. The initiation of microcracks and their accumulation in 3D-braided composites were detected using full-field strain measurements (Lomov et al., 2008) where the carbon nanotubes were used as an in situ sensor (Kim et al., 2010). Sun and Gu (2006, 2007) and Sun et al. (2005) experimentally studied out-plane and in-plane compressive properties and uniaxial tensile behavior of four-step 3D-braided composite at various strain rates and discussed its failure modes. The results showed that the mechanical behavior of the materials is strain rate sensitive, and the failure stress and compressive stiffness increase with increasing strain rate. The 3D five-directional carbon/phenolic-braided composites with different braiding angles and fiber volume fractions were also subjected to uniaxial compressive loads at high-strain rates from 350 to 1600 s−1 in the longitudinal direction. Its macro- and micro-fracture morphology were observed and analyzed by Li et al. (2009). The macro- and micro-fracture morphology were observed and analyzed. Zhang, Sun, and Gu (2012) investigated the characterization of transverse impact behaviors of four-step 3D rectangular-braided composites with a split Hopkinson pressure bar apparatus. Gu and Chang (2007) and Gu (2007) analyzed the energy absorption features of 3D-braided composite under different strain rates compressive loading and ballistic penetration. These works indicate that the 3D-braided composites have higher specific energy absorption and excellent fatigue performances. It can be used in structures under cyclic or impact load condition.
Due to its complicated microstructure and multiple scales, the braided composite has provoked a great interest among the researchers. Since Du and Ko (1993) and Lei et al. (1992) first identified a unit cell representing the fiber architecture of rectangular-braided performs, which was a cuboid containing four diagonally intersecting yarns. Later, many researchers have contributed to the development of finite element analysis (FEA) and theoretical analysis models for predicting its mechanical properties. Up to 2010, these works have been reviewed by Fang and Liang (2011). Besides, they highlighted the importance of recognizing the meso-structure for analyzing the mechanical behavior of 3D-braided composites. Due to the microscopic structure of braided composites with periodical characteristics, a meso-structure representative volume cell (RVC), as well as a refined quasi-microstructure model (Gu, 2005), was chosen to analyze the progressive damage behavior of 3D four-directional braided composites (Endruweit and Long, 2011; Fang et al., 2011; Guo-dong et al., 2009; Li et al., 2010; Zhang and Xu, 2013). The geometry of the deformed RVC, together with the constitutive relations of the yarns, determines the stress in the continuum. However, these methods are not suitable for modeling failure mechanisms, such as fiber tow buckling, or localized stress concentrations that occur due to fiber tow undulations or resin-rich area. In order to obtain the realistic stress distribution and damage behavior in each component, there is need to develop an advanced meso-geometry model based on the realistic spatial configuration and the cross-sectional shape of braid yarns within composites. At the mesoscale, Xiao et al. (2011) presented a method that approximates the in-plane periodic meso-structure of a triaxially braided composite using a sub-cell finite element (FE) approach to predict the strength of tensile and compressive. Gu (2007) presented a meso-structure model for simulating ballistic impact damage of four-step 3D-braided rectangular composite penetrated by a rigid steel projectile. The results showed that impact damage morphology simulated is more precise compared with the other continuum models of the braided composite, which indicates that the fiber orientations have significant influence on the failure modes.
Previous works mentioned above have shown that 3D-braided composites have a skin-core structure and are composed of three regions: interior, surface. and corner. However, up to now, the solid FE modeling mostly focused only on the interior unit cell that constitutes the main part of the whole structure (Zhang and Xu, 2013). The accurate micro-structure of surfaces and corner unit cell needs to be established and their effect on the mechanical properties of 3D-braided composites requires to be further studied.
This paper aims at developing a 3D FE model for investigating the meso-structure mechanisms of deformation and damage in braided composites subjected to high-strain rate compressive loading conditions. The 3D solid meso-structure geometrical model will be established based on the real geometry features and the analysis of internal geometry evaluation as in reference (Li et al., 2010b). The assumptions made are that the cross section of braiding yarns is a regular hexagon (Guo-dong et al., 2009; Xu et al., 2011) and their spatial configuration appears straight in interior cell, bending only happens at the surface and the corner. The micro-structures model of fiber tow, employed periodic boundary conditions, consist of an elastic fiber phase that undergoes brittle damage and a rate-dependent plastic matrix phase that is assumed to undergo ductile failure (Gautam and Dixit, 2012; Gautam et al., 2011). The mesoscale model of fiber tow incorporates Hill yield surface with transversely isotropic. Damage initiation is modeled by applying a ductile damage criterion in conjunction with shear damage criterion. The in-plane and out-of-plane compression behaviors of the 3D-braided composites were conducted under quasi-static and high-strain rate loadings in MTS.810 materials testing system and split Hopkinson pressure bar (SHPB) apparatus, respectively. The experimental results were used to validate the numerical model. The numerical meso-structure model results were used to investigate the compressive responses and the failure modes of 3D-braided composites.
Experimental details
3D-braided preform and composite fabrication
The topological structure of 3D-braided preforms is determined by the braiding process, which is realized through the permutation of yarn carriers on a machine bed by row and column track movements in the X and Y direction, respectively, and the preform is fabricated in the Z direction. The basic concept of the four-step 1 × 1 3D braiding process can be seen in Li et al. (2010) and Zhang and Xu (2013). The size of the braid is denoted by the array of interior yarn carriers (m × n) and the total number of yarns N is given by
In this paper, the basalt filament tows with the yarn count of 800 tex, manufactured by Hengdian Group Shanghai Russia & Gold Basalt Fiber Co., Ltd, were used to prepare 3D-braided preform (see Figure 1(a)) with square cross sections of 9 × 9 arrays using a four-step 1 × 1 braiding machine. The braiding angle was set to about 30°.
Photograph of specimen of 3D-braided composite. (a) Basalt fiber 3D-braided preform. (b) Surface of 3D-braided composite. (c) Cross section of 3D-braided composite.
The vinyl ester resin (Type RF-1001, manufactured by Shanghai Sino Composite Co., Ltd), was employed as the matrix resin to manufacture the 3D basalt-braided composite by the vacuum-assisted resin transfer molding process. The braided preforms were placed on a steel plate and covered with releasing films. This preform assembly was then sealed in a vacuum bag before the resin transfer process was done under pressure of 1 bar. Finally, the composite was cured at room temperature for 12 h. The fiber volume fraction in the specimen was about 45.3% with less than 1% of void content, which was obtained through the “burning method.” The size of composite coupon was cut into 9 × 9 × 9 mm3. Compression tests were conducted both in the in-plane and out-of-plane directions. The surface and cross-sectional photographs of the composites are presented in Figure 1(b and c), respectively.
Mechanical testing
Quasi-static test
The quasi-static compressive tests were carried out on a servohydraulic MTS 810.23 material testing system at a constant compression speed of 1 mm/min. The strain rate corresponding to the speed approximates to 10−3 s−1. At least three specimens were tested. The average stress versus strain curve was obtained.
High-strain rate tests
The high-strain rate compression tests on the 3D-braided composites in both in-plane and out-of-plane directions subjected to three different constant strain rates of 800, 1500, 2100 s−1, were performed on a modified SHPB apparatus. The SHPB apparatus has been widely used in the literature for high-strain rate tests of materials. The SHPB apparatus used in the present investigation was same with Sun and Gu (2007). All the tests were performed at room temperature. The average stress, strain, and strain rate of the specimen were obtained through one-dimensional elastic wave equation, which was based on the assumption that the dynamic forces on both sides of the specimen are equal.
Numerical simulations
Geometrical model of 3D-braided composite
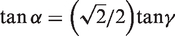
In order to establish a 3D model to perform FE analysis, the architecture of 3D-braided composites has to be identified. The geometrical configuration of the braided composites has periodic features in the mesoscale (Li et al., 2010; Wang et al., 2012). Therefore, a smallest RVC was chosen as geometrical part in FE software to characterize the macroscopic mechanical properties of the braided composites. Especially, because of the complexity of braid structures, the RVC including only the interior braid structure of braid yarn represents the whole braided preform because it constitutes the overwhelming majority of the braided structure (Guo-dong et al., 2009; Li et al., 2010, 2012; Wang et al., 2009). In this section, the geometrical full meso-structure model of a 3D-braided preform and the composites are presented based on the three unit-cell geometrical models (Li et al., 2010; Shokrieh and Mazloomi, 2012). Herein, 3D four-directional braided preforms are composed of four-directional yarns that are braided with the same braid angles in the interior of the material as shown in Figure 4(a). One braiding loop is one period. Due to different directional yarns compressing against each other, the yarn shape becomes rather complex. In this paper, it is assumed that the yarn in the interior unit cell of the braid structure has a regular hexagon cross section with noncrimp. Its bending and changing to other directions only happen at the surface unit cell and corner unit cell. The space between the tows is filled with the resin.
Multiscale constitutive models.
As is shown in Figure 1, the images were analyzed to determine the average dimensions of each of the fiber tows, the spacing between tows, and any other dimension required to accurately recreate the coordinates of interior unit cell of 3D-braided preform. The related position of each fiber tow and architecture of the interior unit cell in a rectangular coordinate system could be seen in Figure 2.
Interior unit cell of the preform. (a) Schematic diagram. (b) 3D solid model.
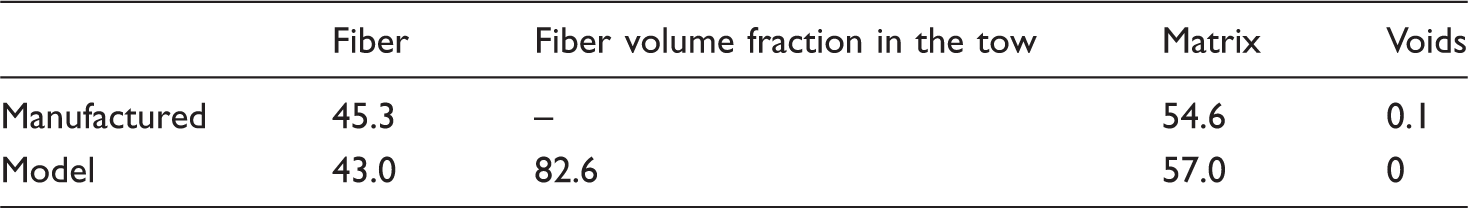
As displayed in Figure 4, the height h of the interior unit cell model is one braiding loop. The braiding angle is an important structural parameter of the 3D-braided composites. Generally, the interior braiding angle γ is difficult to measure since the interior of the preform cannot be easily observed without cutting the specimen. However, the angle of inclination of the yarns on the surface of composite α can be measured readily. The relationship between them is expressed as
The width Wi and thickness Ti of the interior unit cell model are given by

All the cross section of the braid yarn in the interior unit cell is assumed to hold a regular hexagon cross-sectional shape. Then the 3D model of the interior unit cell is copied to form the cross section of the specimen in CATIA software. Finally, the front end of fiber tows is connected at the surface along the smooth splines as yarn’s centerline in 3D space to complete the 3D-braided preform model. All the cross section of the braid yarn is assumed to hold a rectangle shape, and maintain constant to ensure that fiber volume fraction is constant so that the properties are not changing as a function of the position. The created geometry model is shown in Figure 3. The braided preform is solidified with matrix by the Boolean operator to form 3D four-directional braided composites.
3D solid geometry model of braided preform. (a) Surface (b) cross section.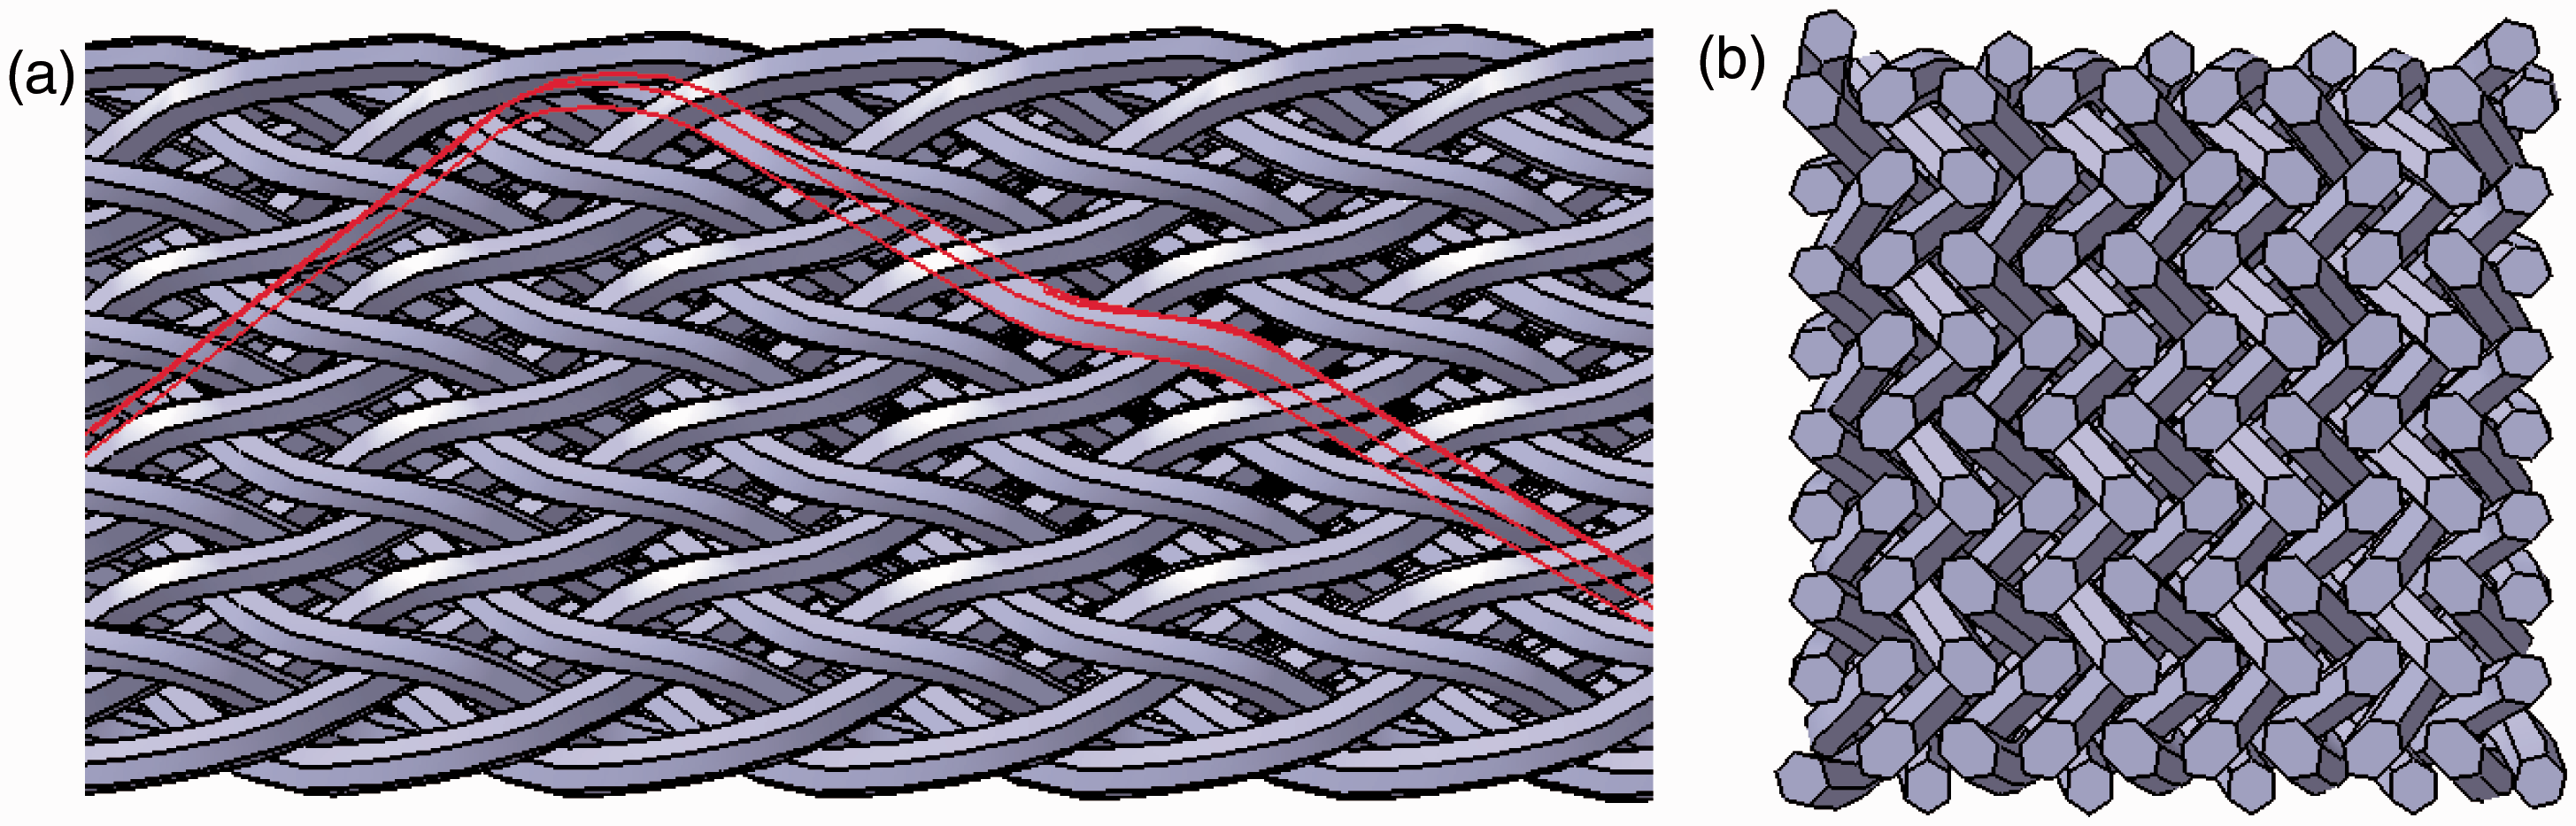
Volume fractions.
Constitutive models
This section briefly introduces the constitutive and continuum damage models that are used to describe the deformation and damage response of fiber-reinforced ductile matrix composites, consisting of the basalt fiber tows and the vinyl ester resin.
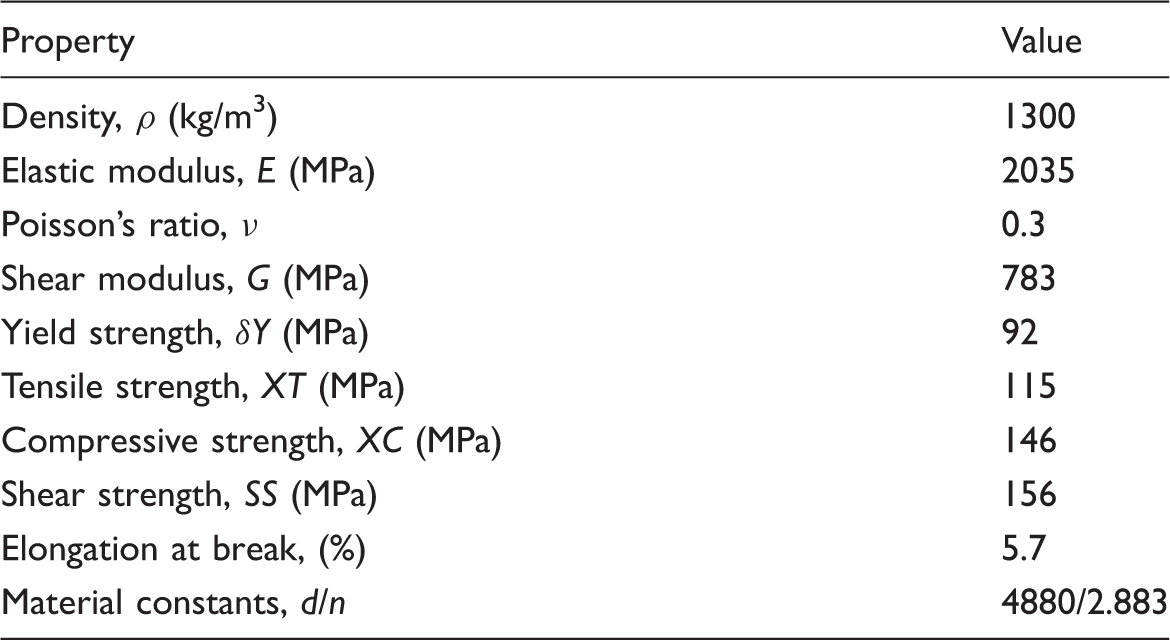
Mechanical parameters of the matrix.
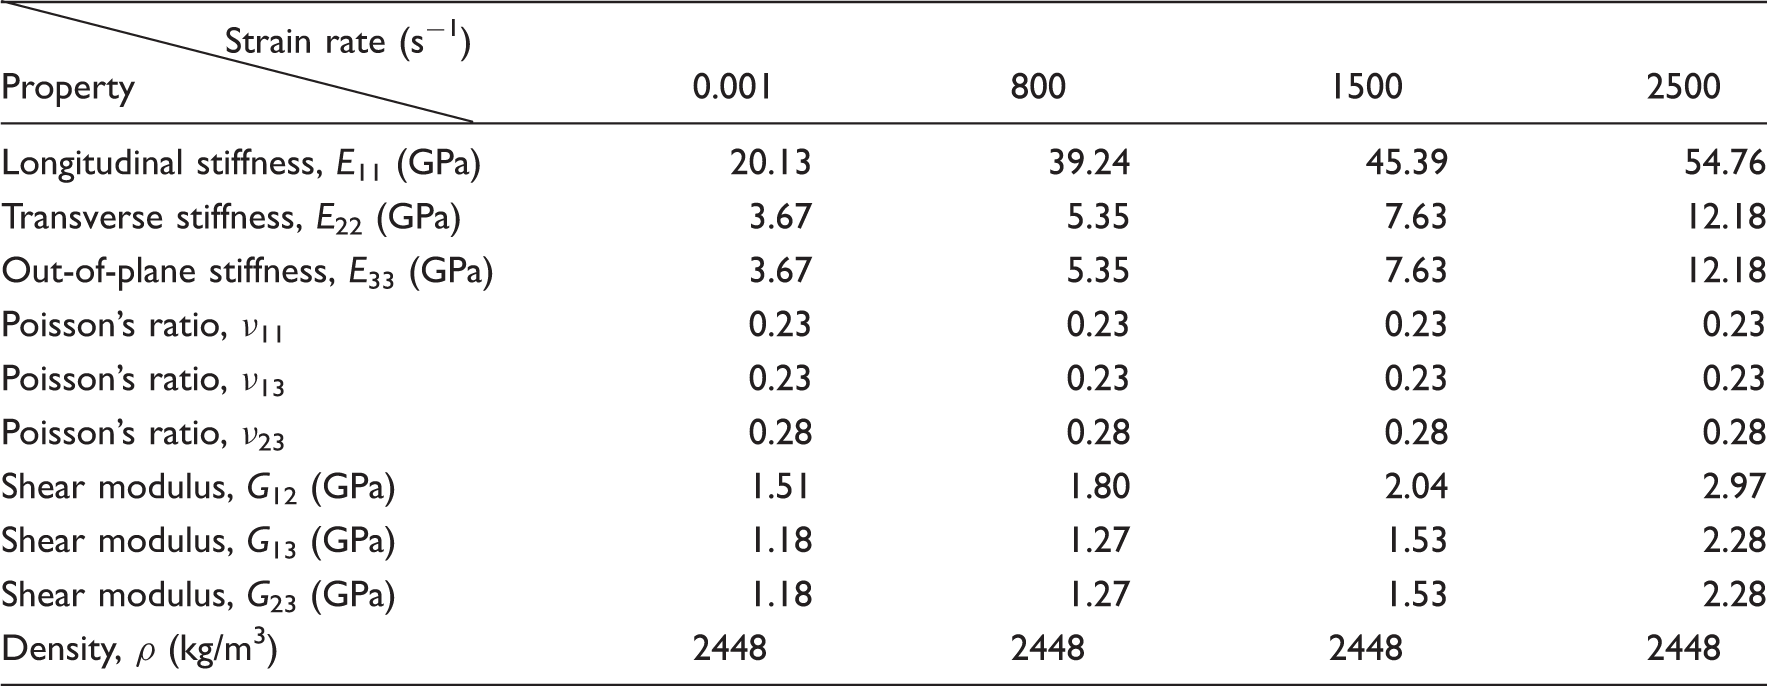
Mechanical parameters of the fiber tow.
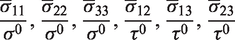
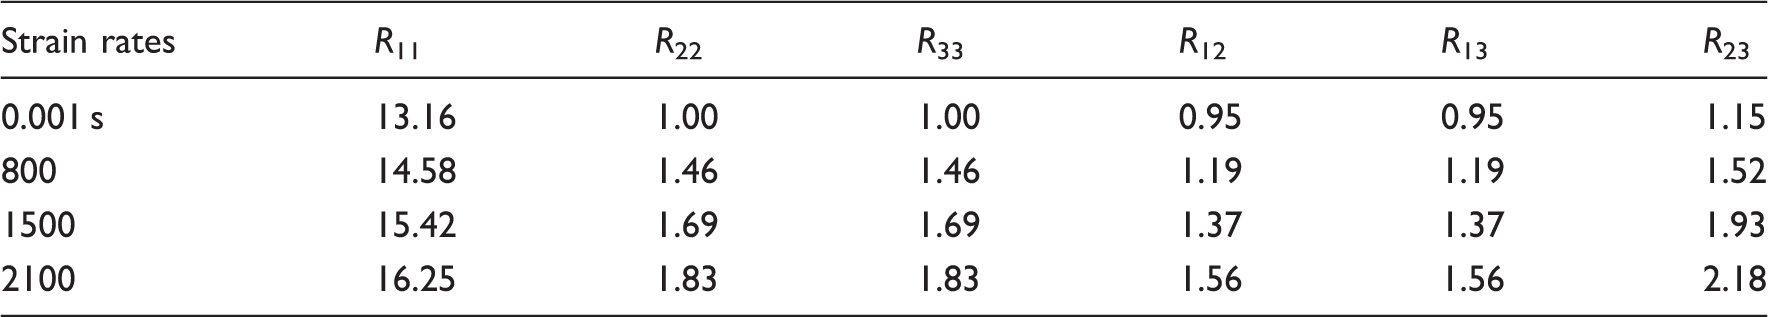
Due to the matrix existing between fibers, the filament tows were modeled as an elastic–plastic material with transversely isotropic defined by local coordinate (see Figure 4(b)). The local one direction of the coordinate system for each fiber tows indicates the fiber direction, and the local three direction is located in the upright 1–3 plane perpendicular to the surface of 3D model. The anisotropic yield property is accounted for by using Hill’s (1952) anisotropic plasticity model and specializing it to the case of transverse isotropy. Hill’s potential function is a simple extension of the Mises function, which can be expressed in terms of rectangular Cartesian stress components as

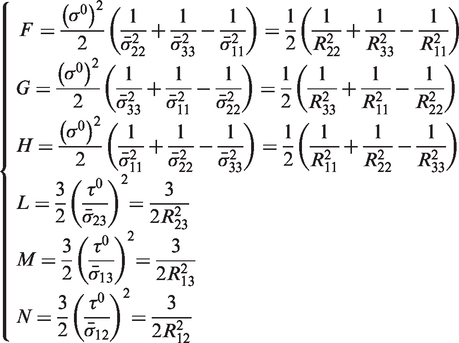
Values of Rij for calculating Hill’s potential constants.
Damage initiation in the fiber tows and the resin was based on a ductile damage criterion in conjunction with shear damage criterion that allowed for the removal of element from the mesh. Detailed information on the principles of these two damage criterions for the basalt fiber tows and viny resion could be found in the previous work of authors (Zhang et al., 2014).
Model of SHPB
A 3D FE model of SHPB apparatus, which only consists of an incident bar and a transmitted bar, is developed to understand how the fiber tows in braided composites carry loads under high-strain rates, as displayed in Figure 5. The geometrical model was then imported into FEA software ABAQUS version 6.11. The FEA model comprised of linear eight-node solid elements (C3D8R) for both braided preform and bars, linear tetrahedral elements (C3D4R) for matrix. Due to the complicated material arrangements of 3D-braided composites, mesh generation may be a large obstacle for predicting mechanical properties by FE method. If the finer mesh size is selected, it can provide more accurate stress distributions, but the computer memory and computation time increase sharply. In order to guarantee the convergence of the solution, the analysis of mesh sensitivity is conducted. According to a compromise consideration, the fine enough mesh size chosen in this study is dependent on the geometry and computation size, giving satisfactory results with relative less computation time. This model consists of 225,784 elements. The interface between yarns and matrix was bonded together meaning perfect bonding.
Mesh scheme of the SHPB testing system. (a) Fabric, (b) resin, and (c) SHPB testing system.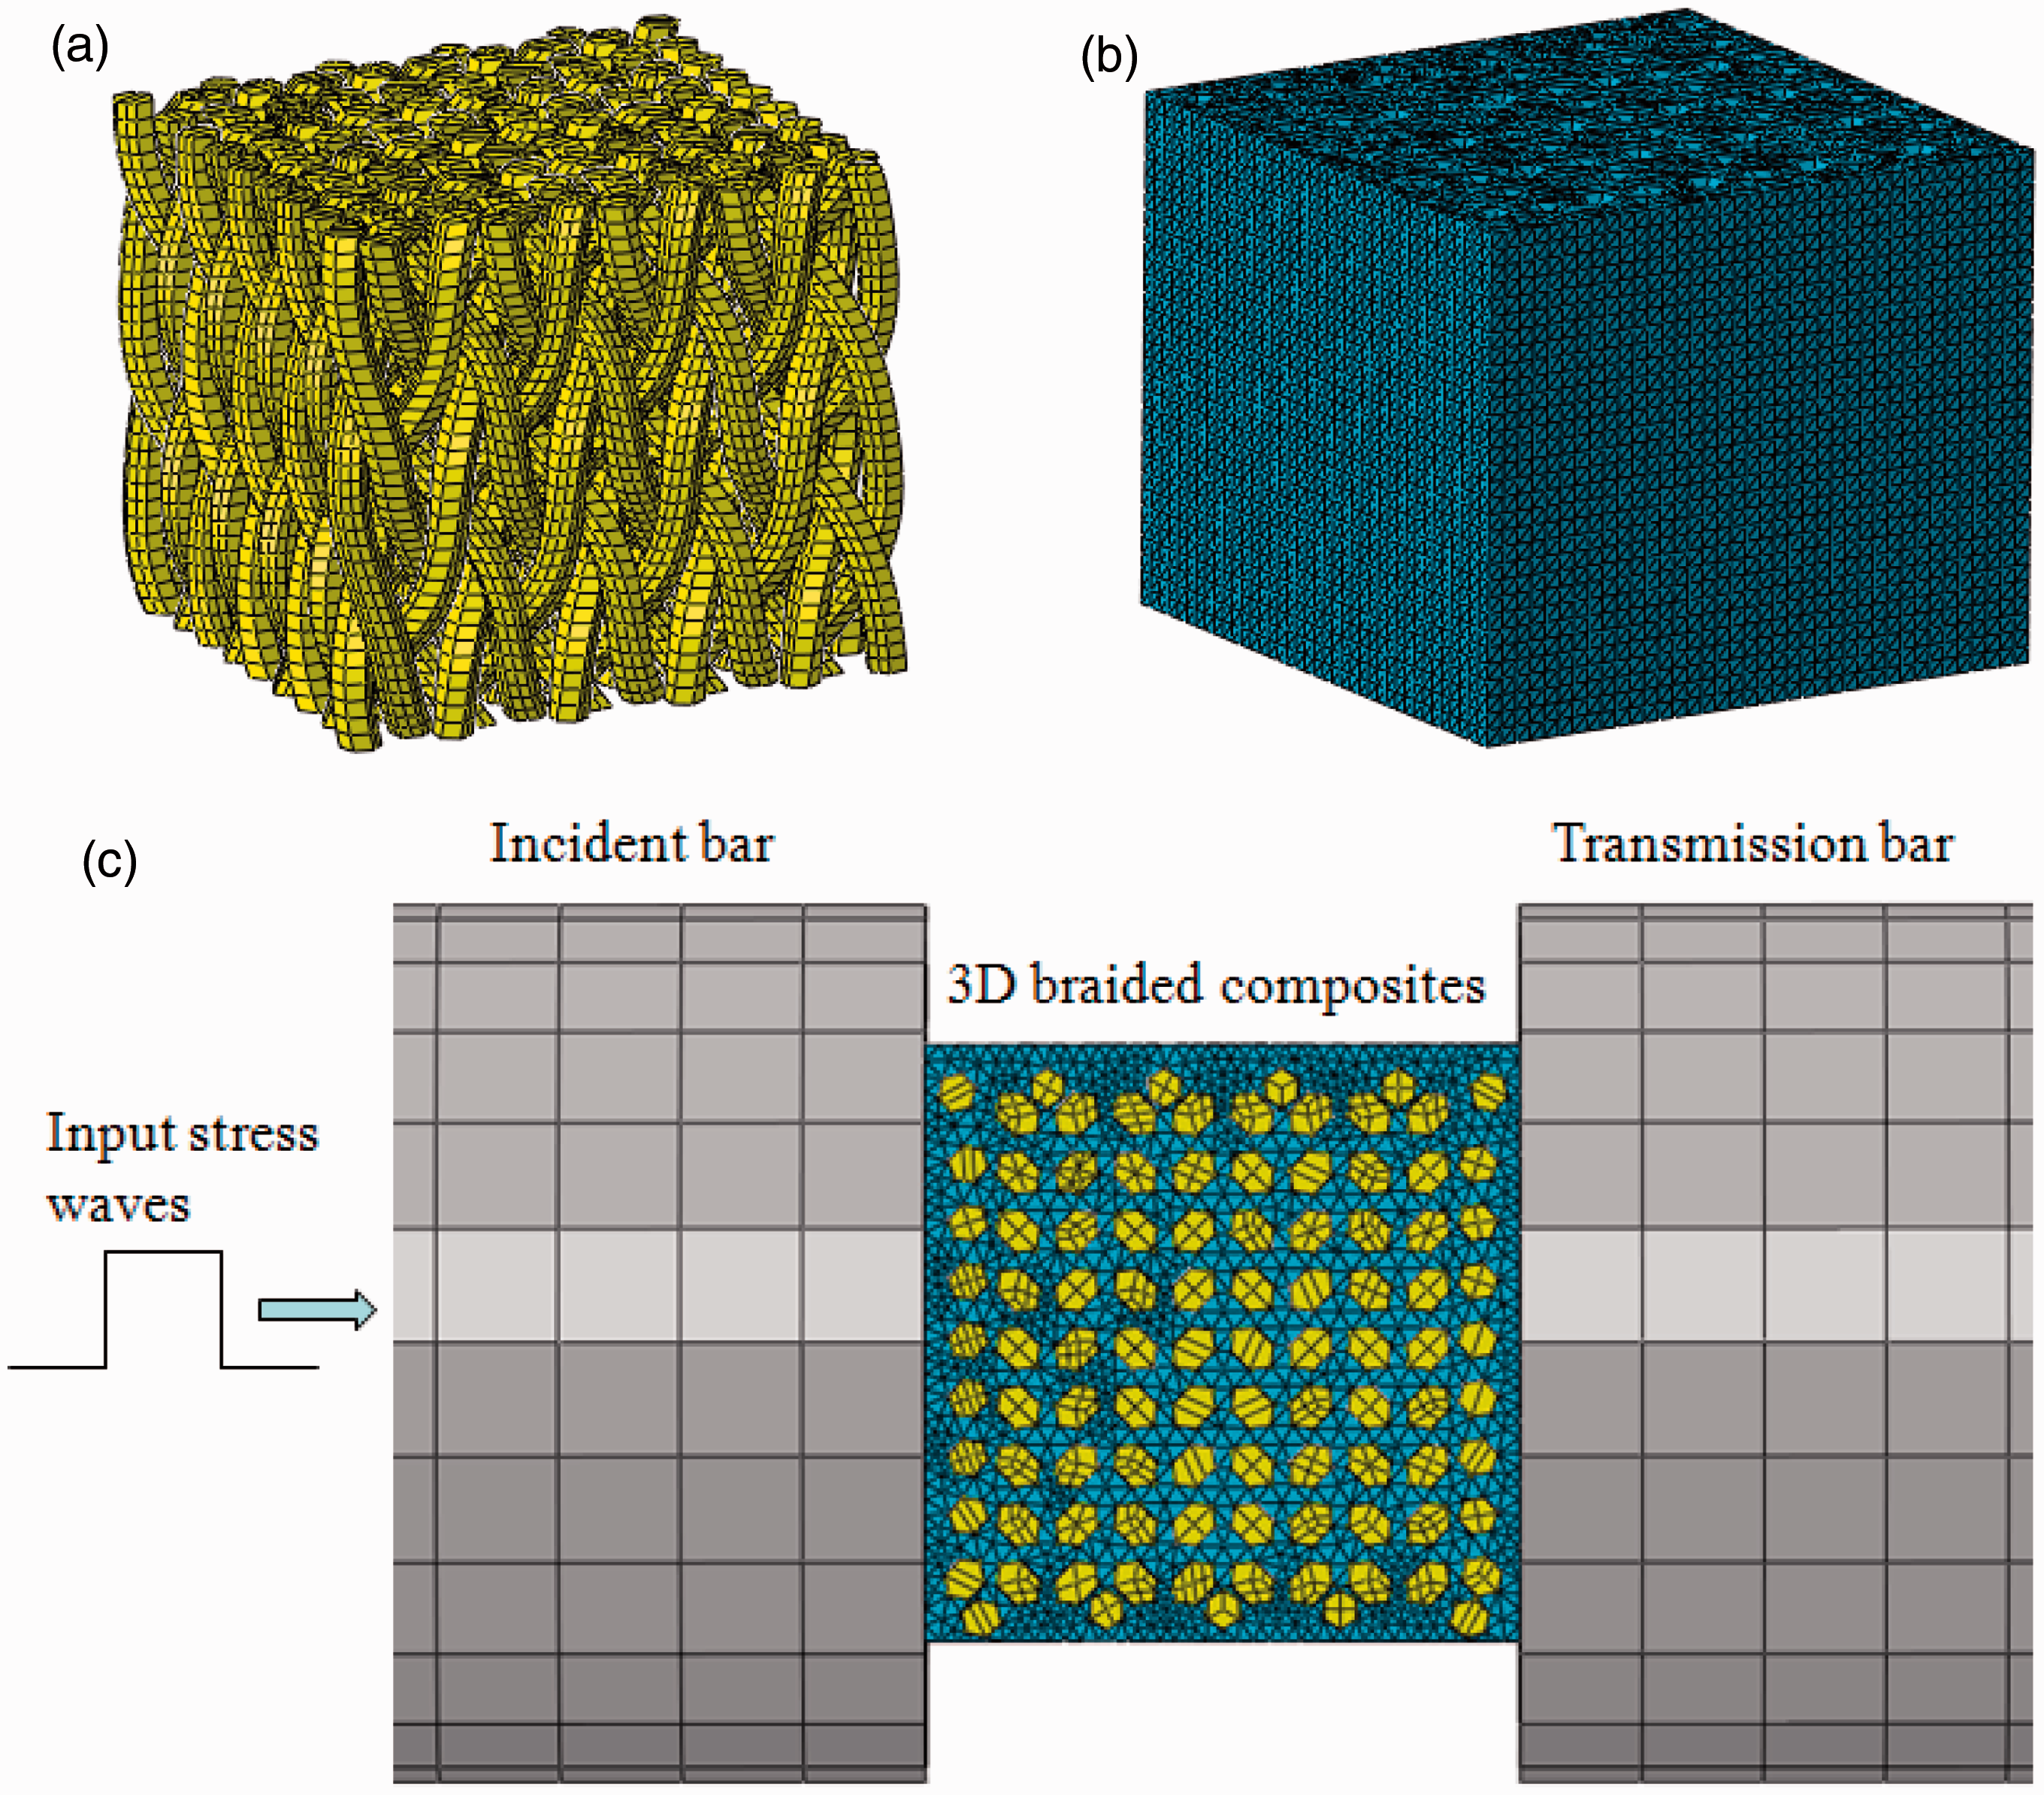
The bars of the SHPB setups, whose length of 600 mm, were regarded as isotropic elastic material and the constitutive relation of the generalized Hooke’s Law was adopted. The definition of the boundary condition of the bars in ABAQUS was to fix the freedom of displacement and rotation except the displacement along the normal impact direction. While the composite model is totally free. The incident strain gauge signal from the experimental test was used to derive the input stress wave to the incident bar of this model.
Results and discussion
Numerical results
In order to determine the effectiveness of the proposed meso-structure model, the predicted results of corresponding strain rates from FEA simulation are compared to the experimental data from compression tests. Figure 6 shows the effective stress–strain curves of braided composites that were compressed in in-plane and out-of-plane directions at different strain rates (0.001 s−1–2100 s−1). Each curve depicts three stages of deformation and damage that the specimen undergoes. These include initial approximately linearly deformation, plastic hardening followed by softening, or failure behavior. For in-plane direction, Figure 6(a) depicts that the stress approximately linearly increases initially and then decreases gradually after the peak stress value. Moreover, there was a marked softening effect at high-strain rate loading when the stress reaches the peak value. However, for the out-of-plane direction, the stress–strain curves are completely different to that of the in-plane direction. As shown in Figure 6(b), these curves have bilinear features that the initial linear elastic response is followed by another smaller slope linear elastic response at each of the strain rates.
Comparison of stress versus strain curves between finite element model and experimental. (a) In-plane direction and (b) out-of-plane direction.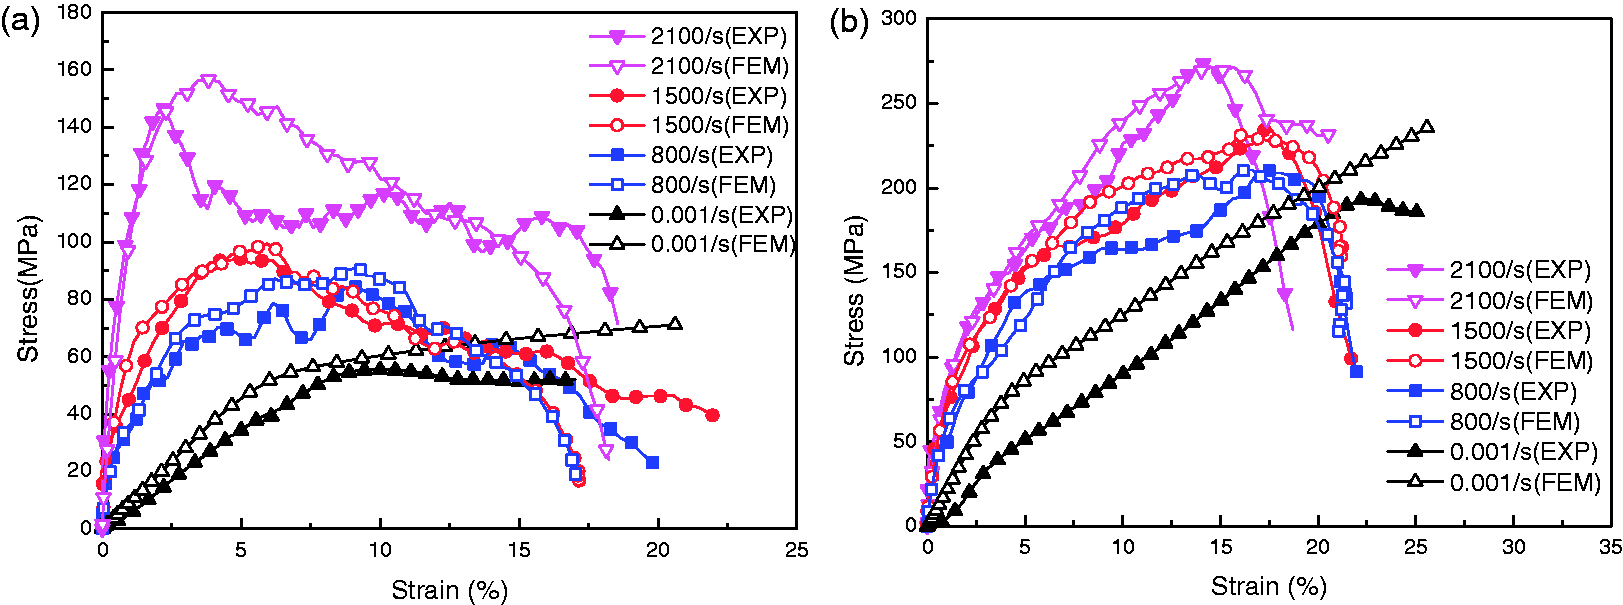
In general, the results show a very good comparison between the numerical predictions obtained from the FEA models and experimental data. A reasonable agreement in predicting the initial slope, the maximum stress, and the maximum strain exist. This suggests that the meso-structure-braided composite model proposed was able to capture the essential features on the response of the composite under those load conditions at the meso level.
Strain rate sensitivity
As depicted in Figure 6, this material in both compressive directions at strain rates ranging from 0.001 to 2100 s−1 exhibits obvious strain rate sensitivity. The initial yield stress and the overall stresses increase with the increment of strain rate. In order to understand the strain rate sensitivity of 3D-braided composites, the compressive stiffness and peak stress were obtained from Figure 6(a) as an example to depict the effects of strain rate as shown in Figure 7. It could be clearly seen that the experimental peak stress nonlinearly increases with increasing strain rate, while the compressive stiffness almost linearly goes up. As compared to static value, there is an increase of 61–179% for peak stress and 125–478% for compressive stiffness. In addition, the strains of curves extend a little at the low-strain rate, but enhance with the increasing of the strain rates.
Comparison of stiffness and peak stress versus strain rate curves in in-plane direction between FEA model and experimental. (a) In-plane and (b) out-of-plane.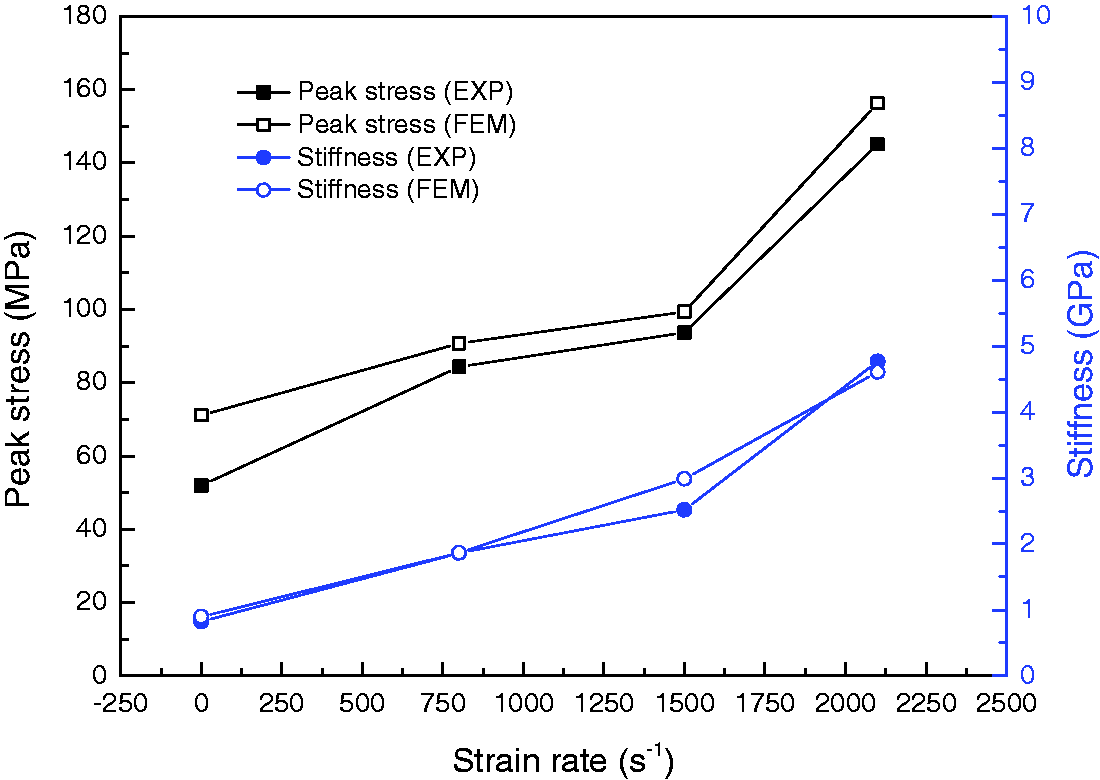
Furthermore, the experimental and computational results, in terms of stiffness and peak stress are compared as shown in Figure 7. It can be found that the computational results obtained are in good agreement with the measured experimental data for stiffness, but overpredicts peak stress. The calculated value of peak stress is bigger by 9.9–35.3% than those obtained from experiment but within acceptable tolerances. This difference is mainly caused by the FEA model that does not take the debonding at the interface of composite-endured compression, uncertainties in the actual imperfection shape, and initial defects (such as air voids, fiber breakage, and microcrack) into consideration.
Mechanical responses
To achieve an in-depth understanding of the mechanical behavior of the 3D-braided composites subjected to different strain rate loadings, the 3D computational analyses were performed to predict the stress propagation, the 3D stress distribution, and the progressive failure behavior. Most often, only the interior unit cell is concerned with the prediction of stiffness by numerical method previously. Although there is the model of three different unit cells, namely, the interior, surface, and corner unit cells, also used to stand for the real 3D-braided composite so far, but it is still not suited well for modeling failure mechanisms, such as fiber tow buckling, or localized stress concentrations that occur from fiber tow undulations or resin-rich area. The advantage of the proposed modeling strategy is that the detailed information on the deformation and stress distribution in the 3D-braided composites under different loadings can be obtained.
Herein, the rate of quasi-static and 2100 s is used as an example to illustrate the out-of-plane and in-plane mechanical responses and failure evolution.
Quasi-static responses
The ABAQUS/standard is used to simulate the nonlinear responses of meso-structure model without failure material definition, which means only the stress distribution can be displayed. As shown in Figure 8, there is a clear evidence of boundary effect when this material is subjected to both the quasi-static loading. That is the fiber tows around the contact loading surface will withstand more load. In addition, it could also be found from the A and B plane cross sections that the state of stress distribution in the interior of the composite has a similar shape of “I” for braided preform and “X” for matrix. This indicates that the fiber tows in the interior area of braided preform can effectively share the majority of quasi-static loading.
Mechanical response at quasi-static compression. (a) In-plane and (b) Out-of-plane.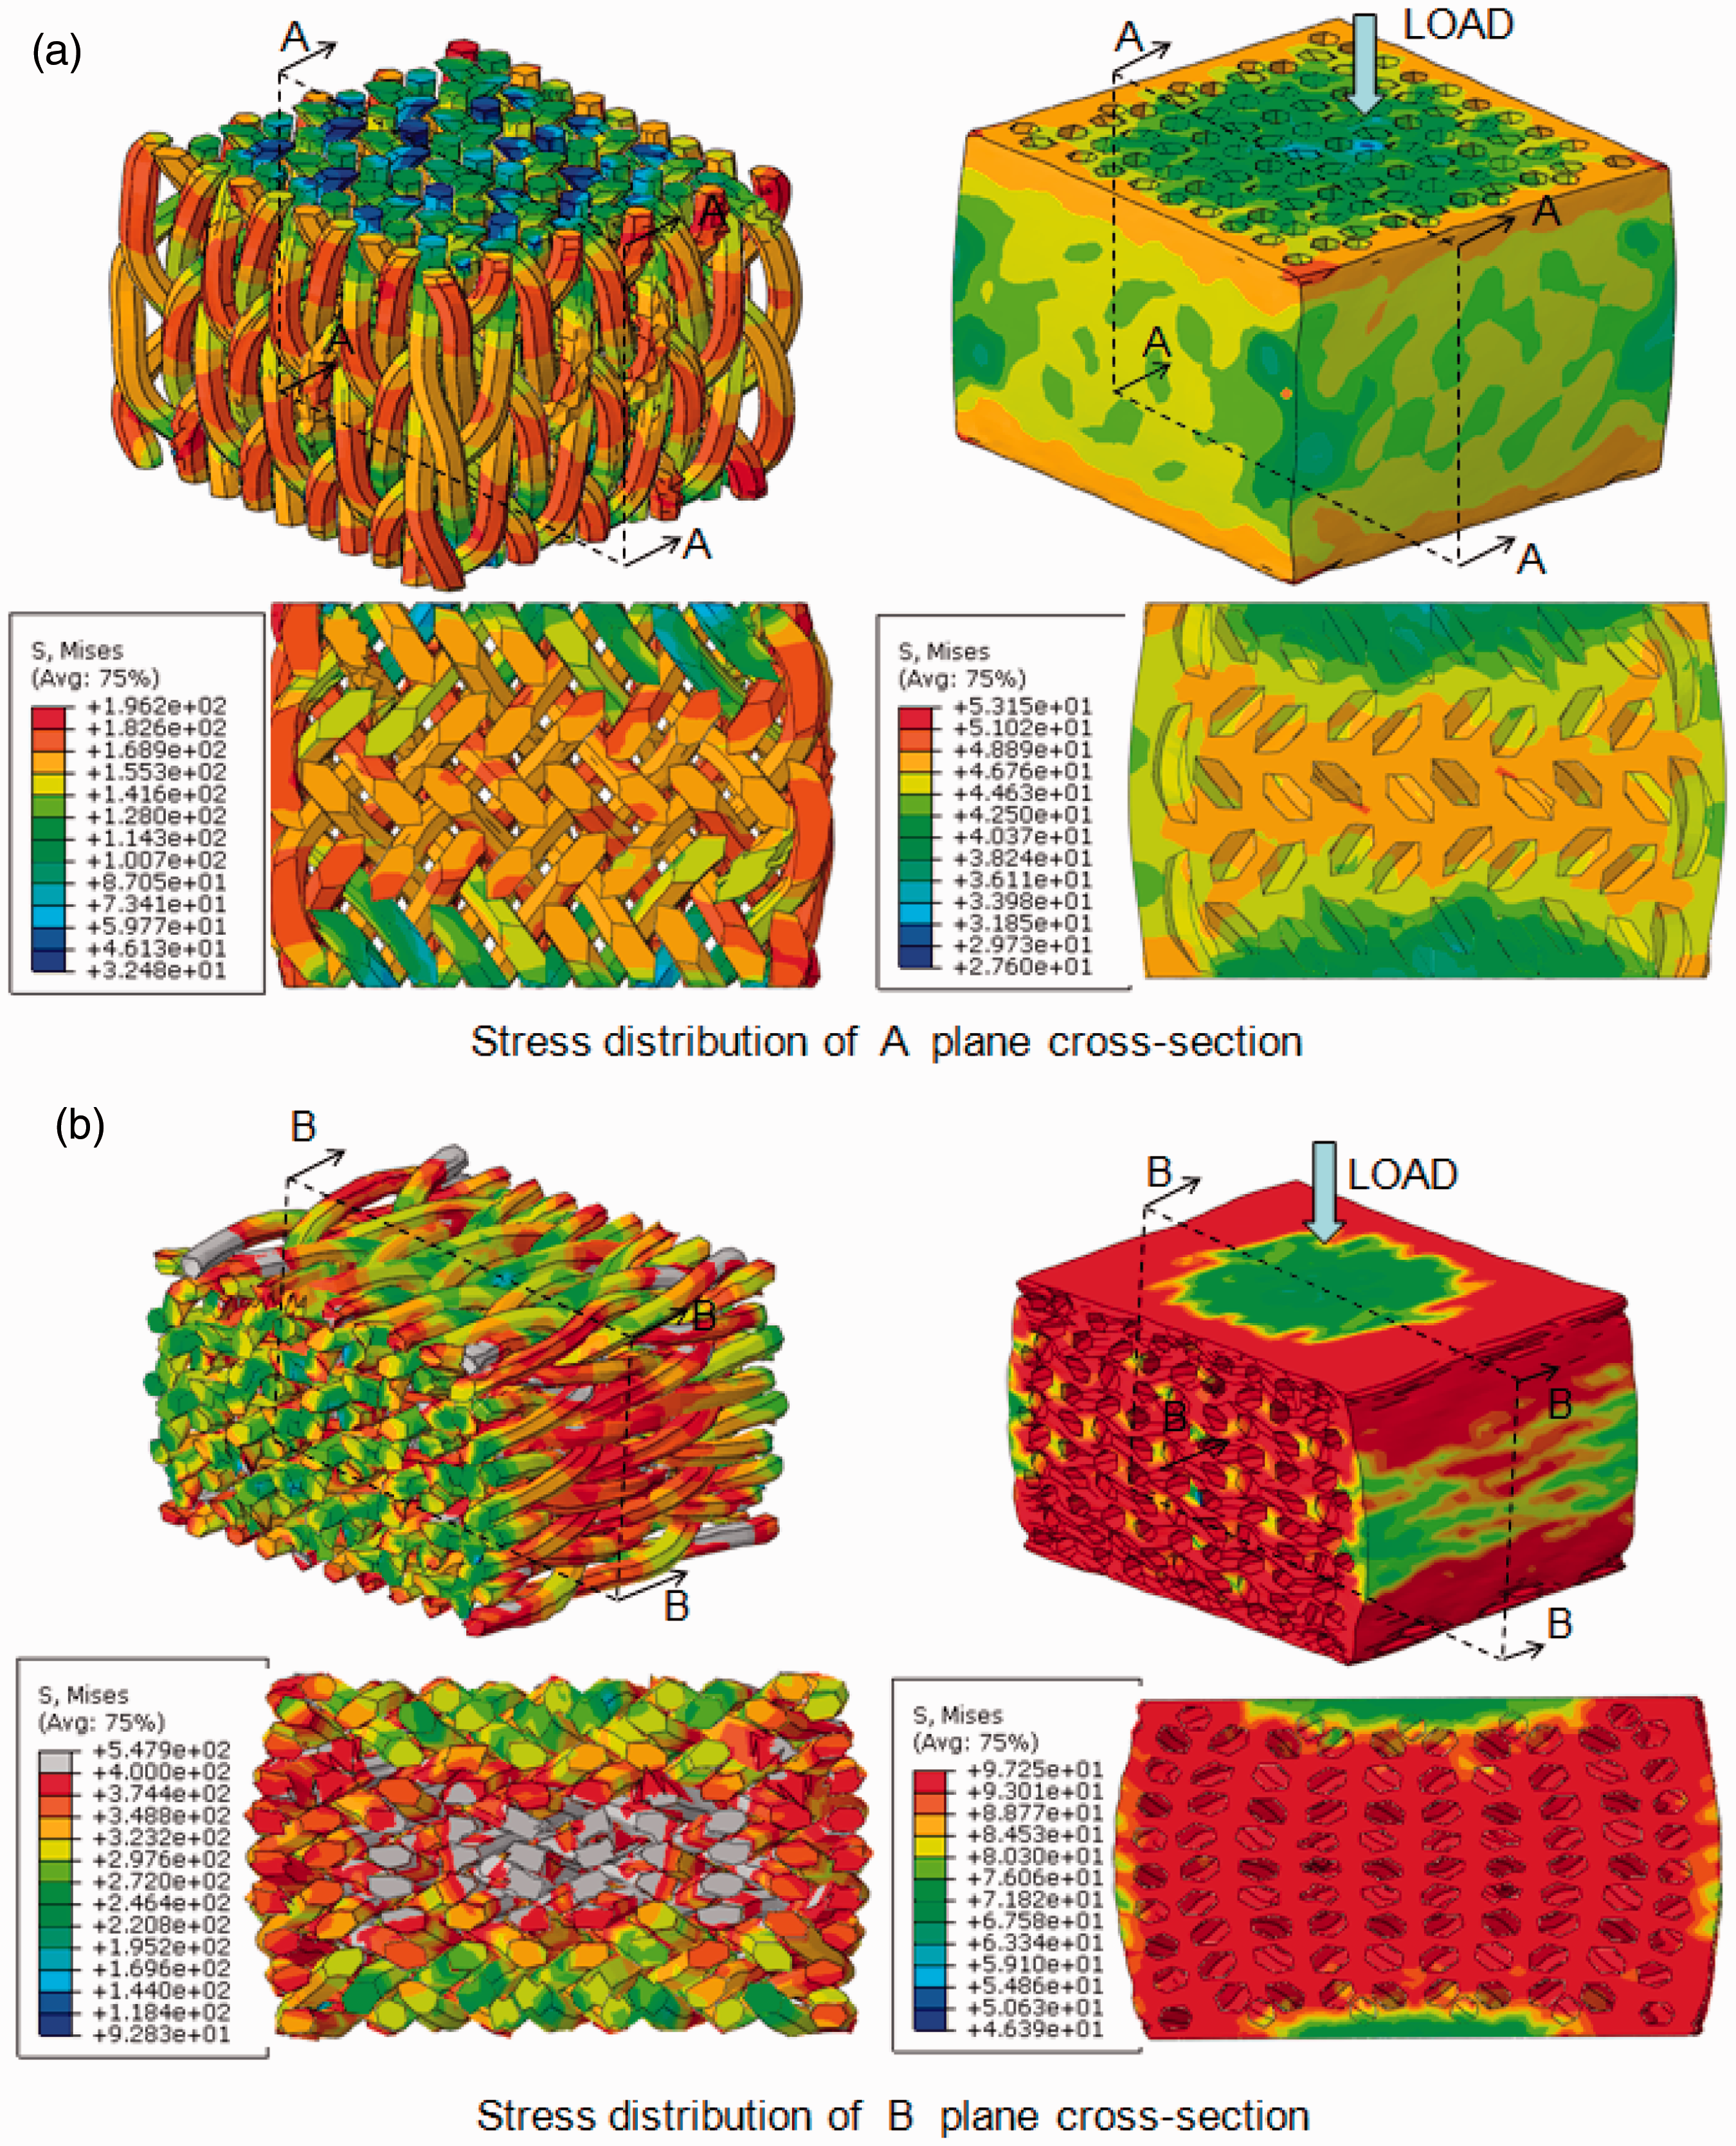
Stress distribution of fiber tows
In most of the dynamical compression-dominated loading cases, the stress distribution of fiber tows in 3D-braided composites always present similar phenomenon. As shown in Figure 9(a,b) and (c,d), that is no matter if it is in-plane or out-of-plane compression, the effect of the fiber tows in the surface and corner area (outside) of braided preform should not be neglected, while the interior fiber tows undergo a lower stress level than the outside. This is because that the outside fiber tows are closer to braiding direction in the exterior regions and will bear more loads. Moreover, the outside fiber tows have higher curvature that causes the stress concentration more obvious, as displayed in Figure 9(b) and (d). Therefore, the peak stress and damage always initially occur in the squeezing positions. The results from the simulation show a very good agreement with the experimental results.
Stress distribution of fiber tows.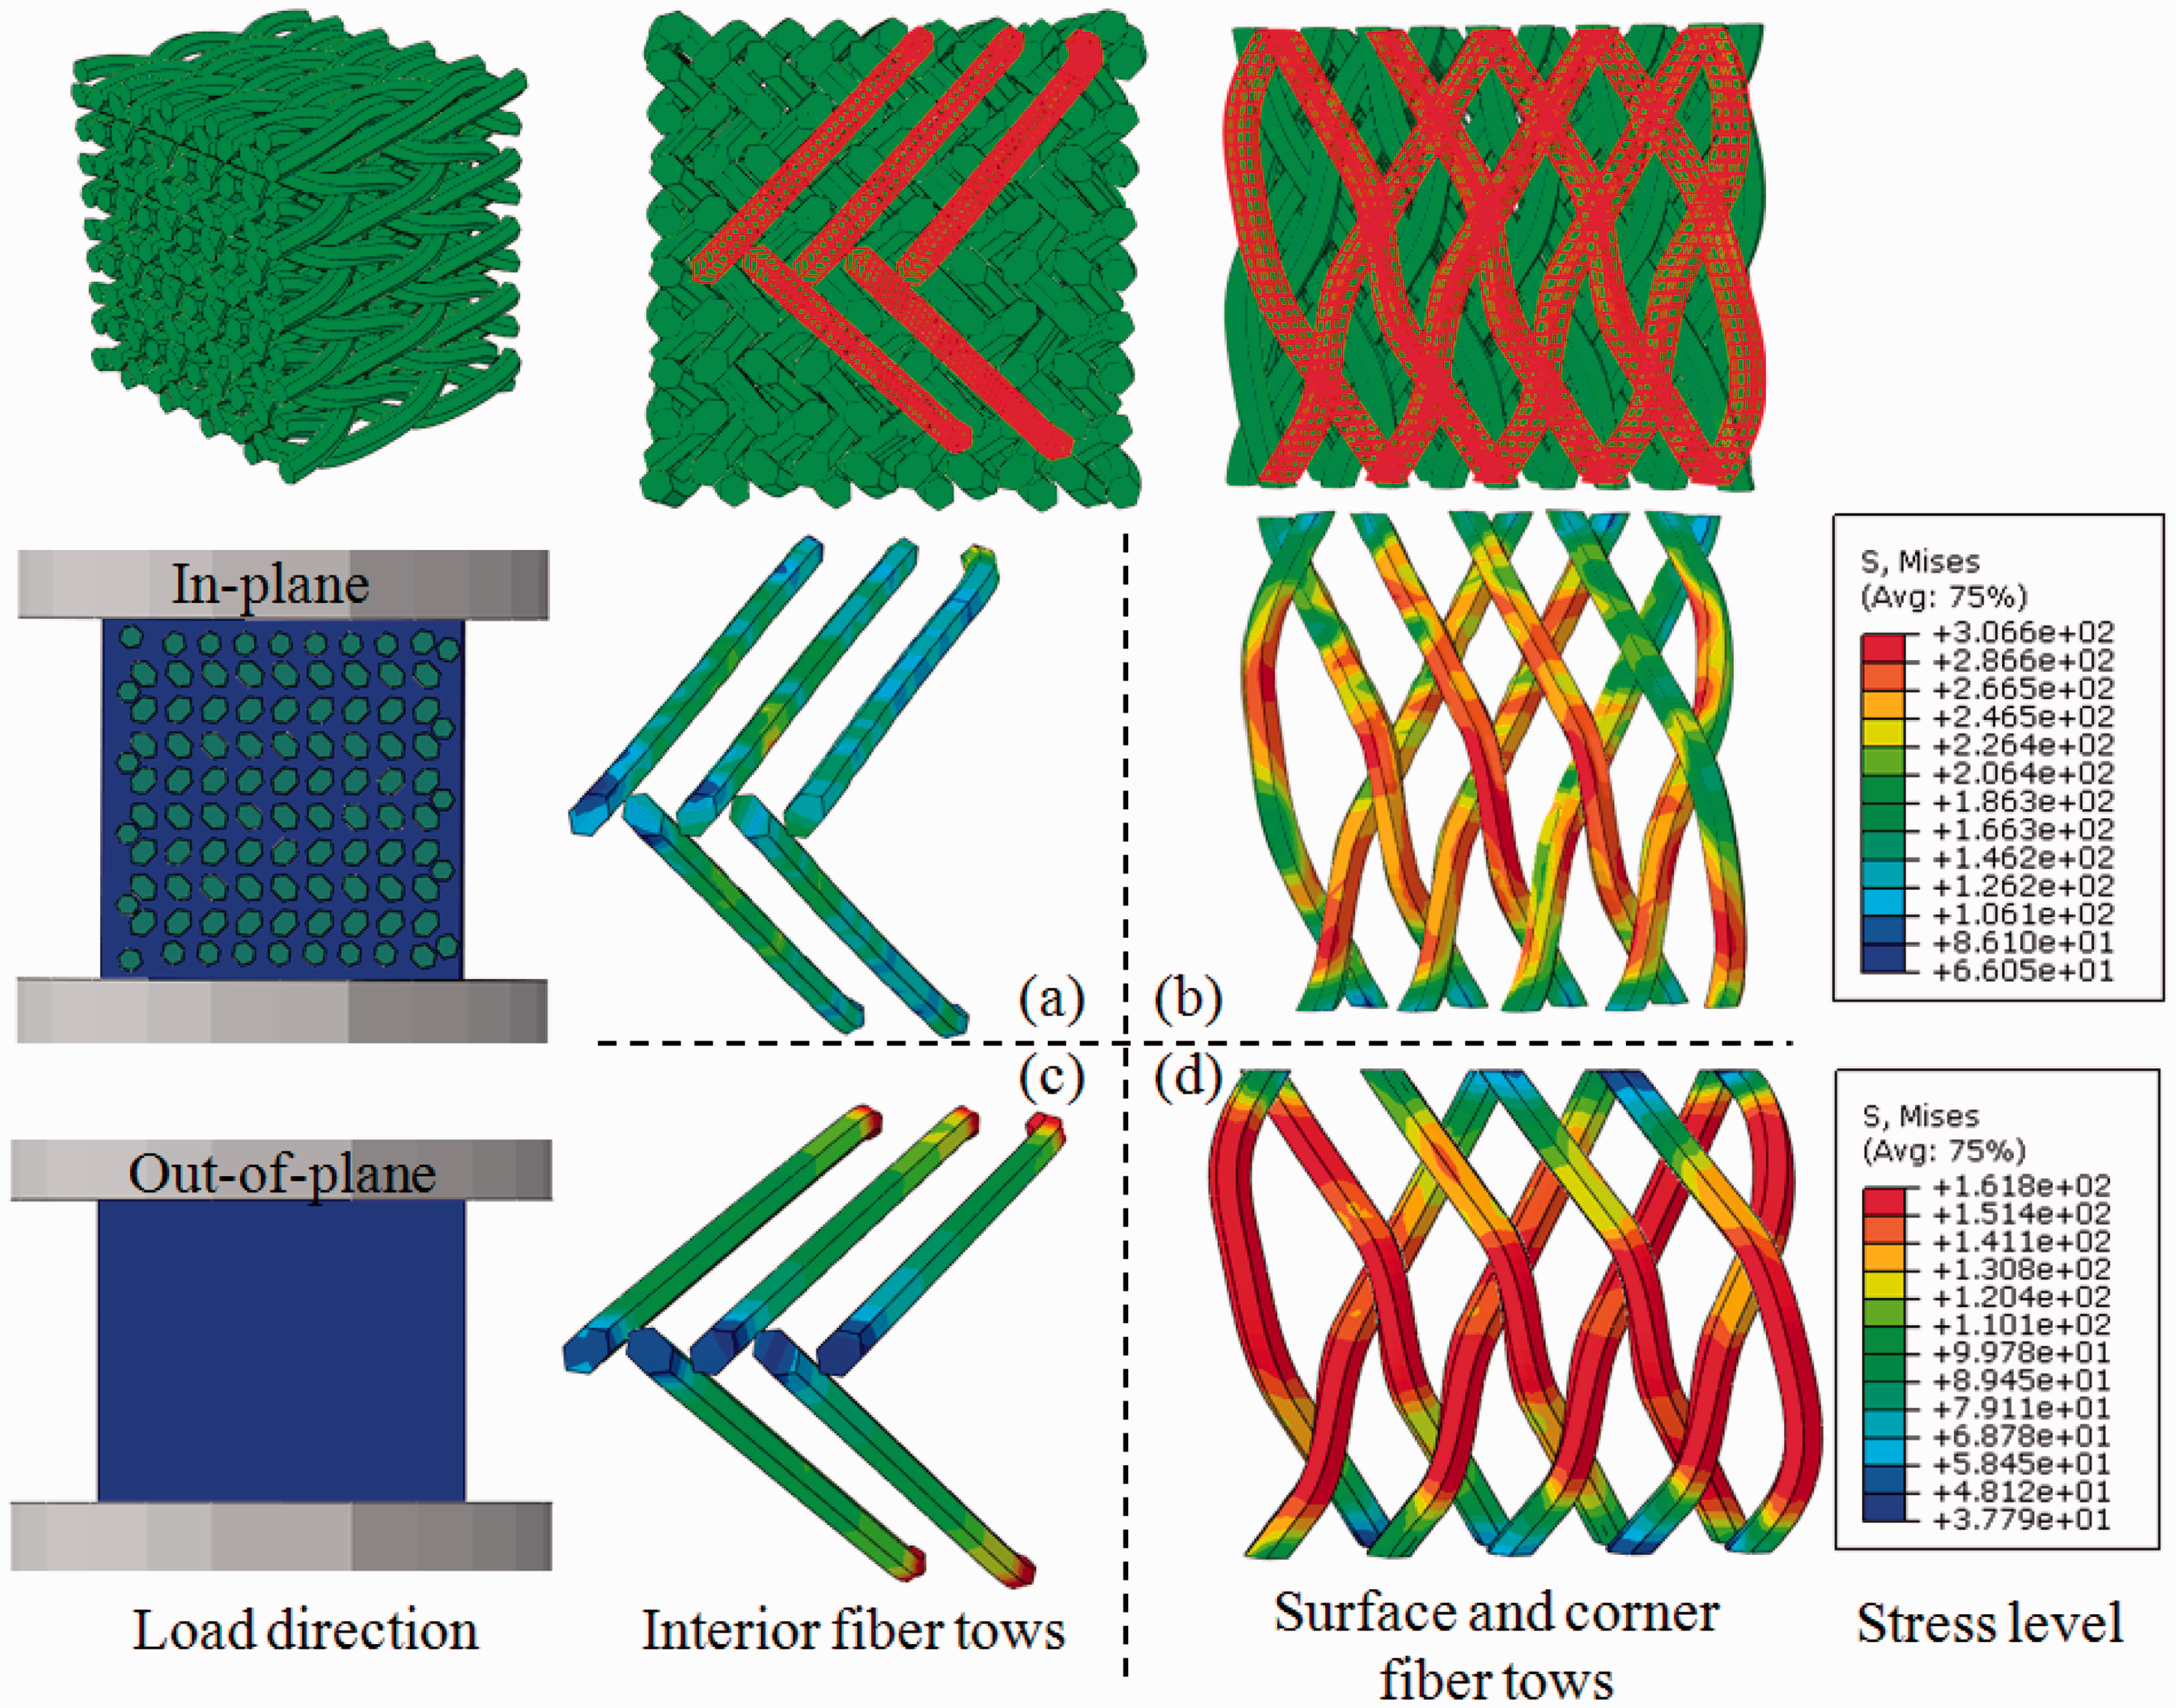
In-plane compression at high-strain rate
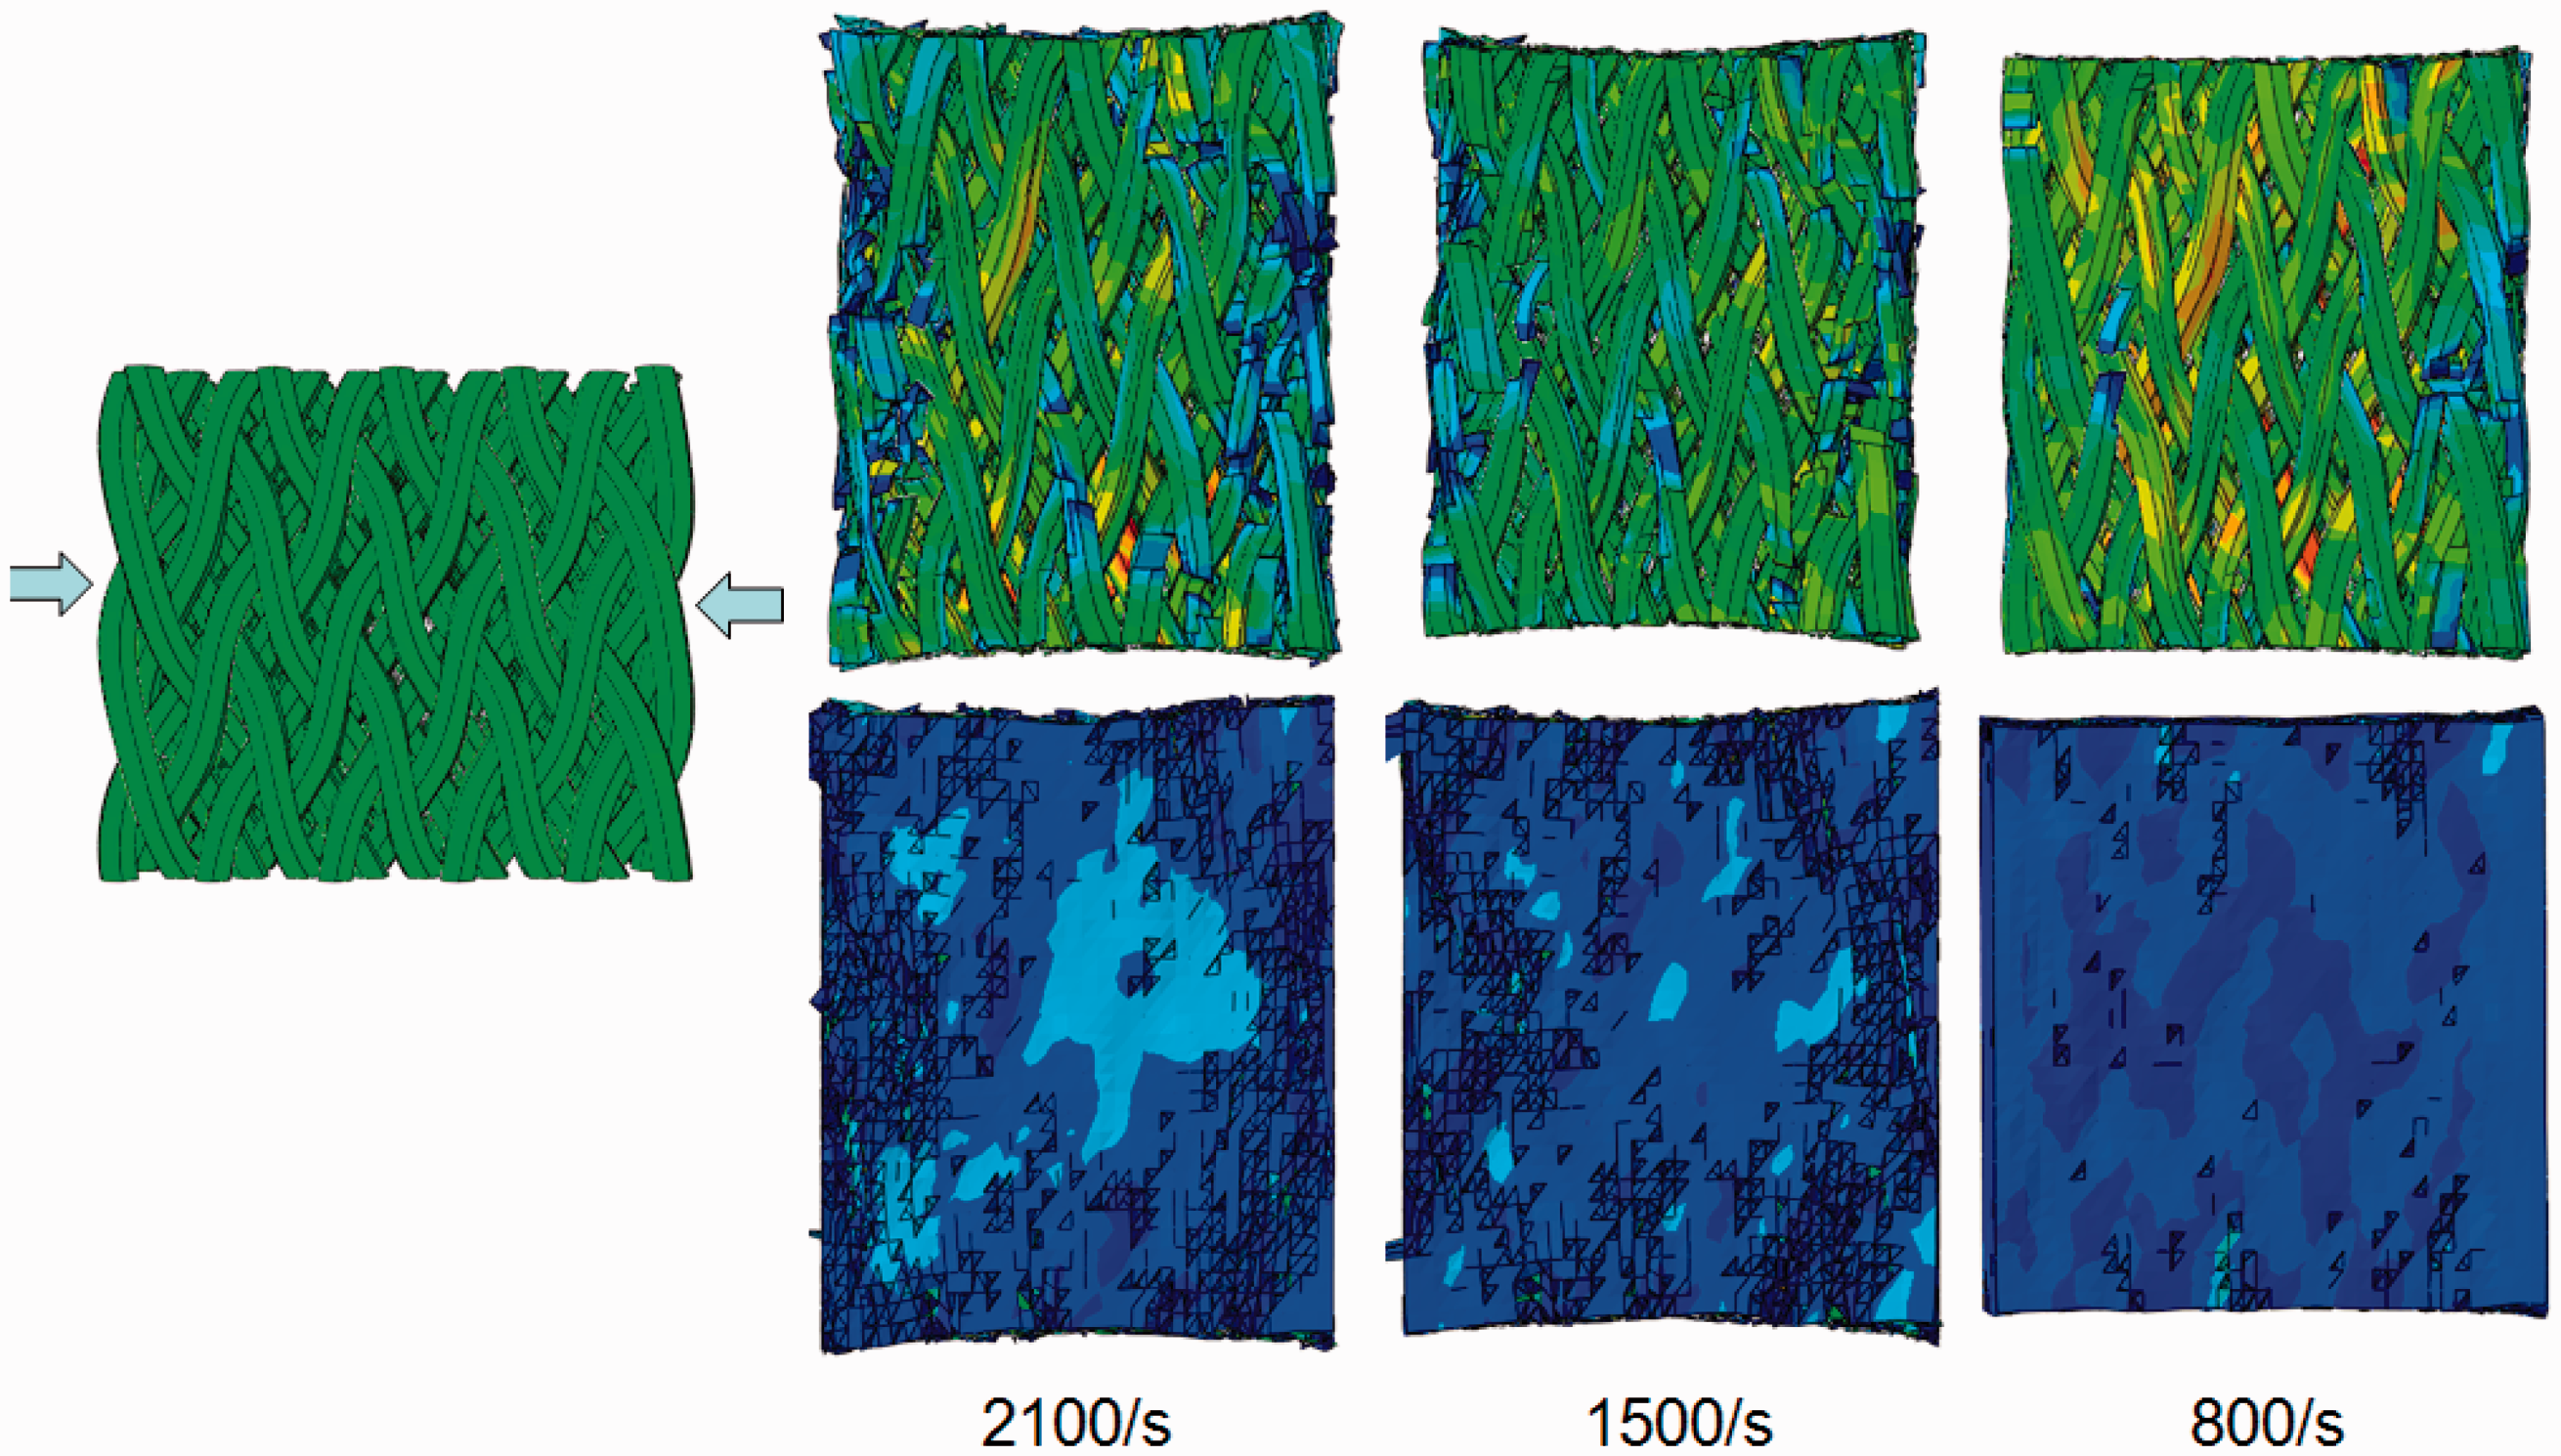
The behavior of the braided composite under high-strain rate loading condition is an issue of concern for composite designers. Figure 10 shows the mechanical responses of the FE model at 2100 s strain rate along in-plane direction. As depicted by these Figure 10 (a)–(c), the von Mises stress wave propagates from the top surface to the bottom along the braiding direction with the variance of the time. Due to the ratio of the elastic modulus to the density of the fiber tows along the loading direction is higher than that of resin, the stress wave in fiber tows propagates faster than in resin (see Figure 10 (1b) and (2b)).
Strain history for through the in-plane FEA model at the rate of 2100 s. (1) 3D-braided reinforcement. (2) Matrix. (3) Loading diagram. (4) Stress versus strain plot with photo events.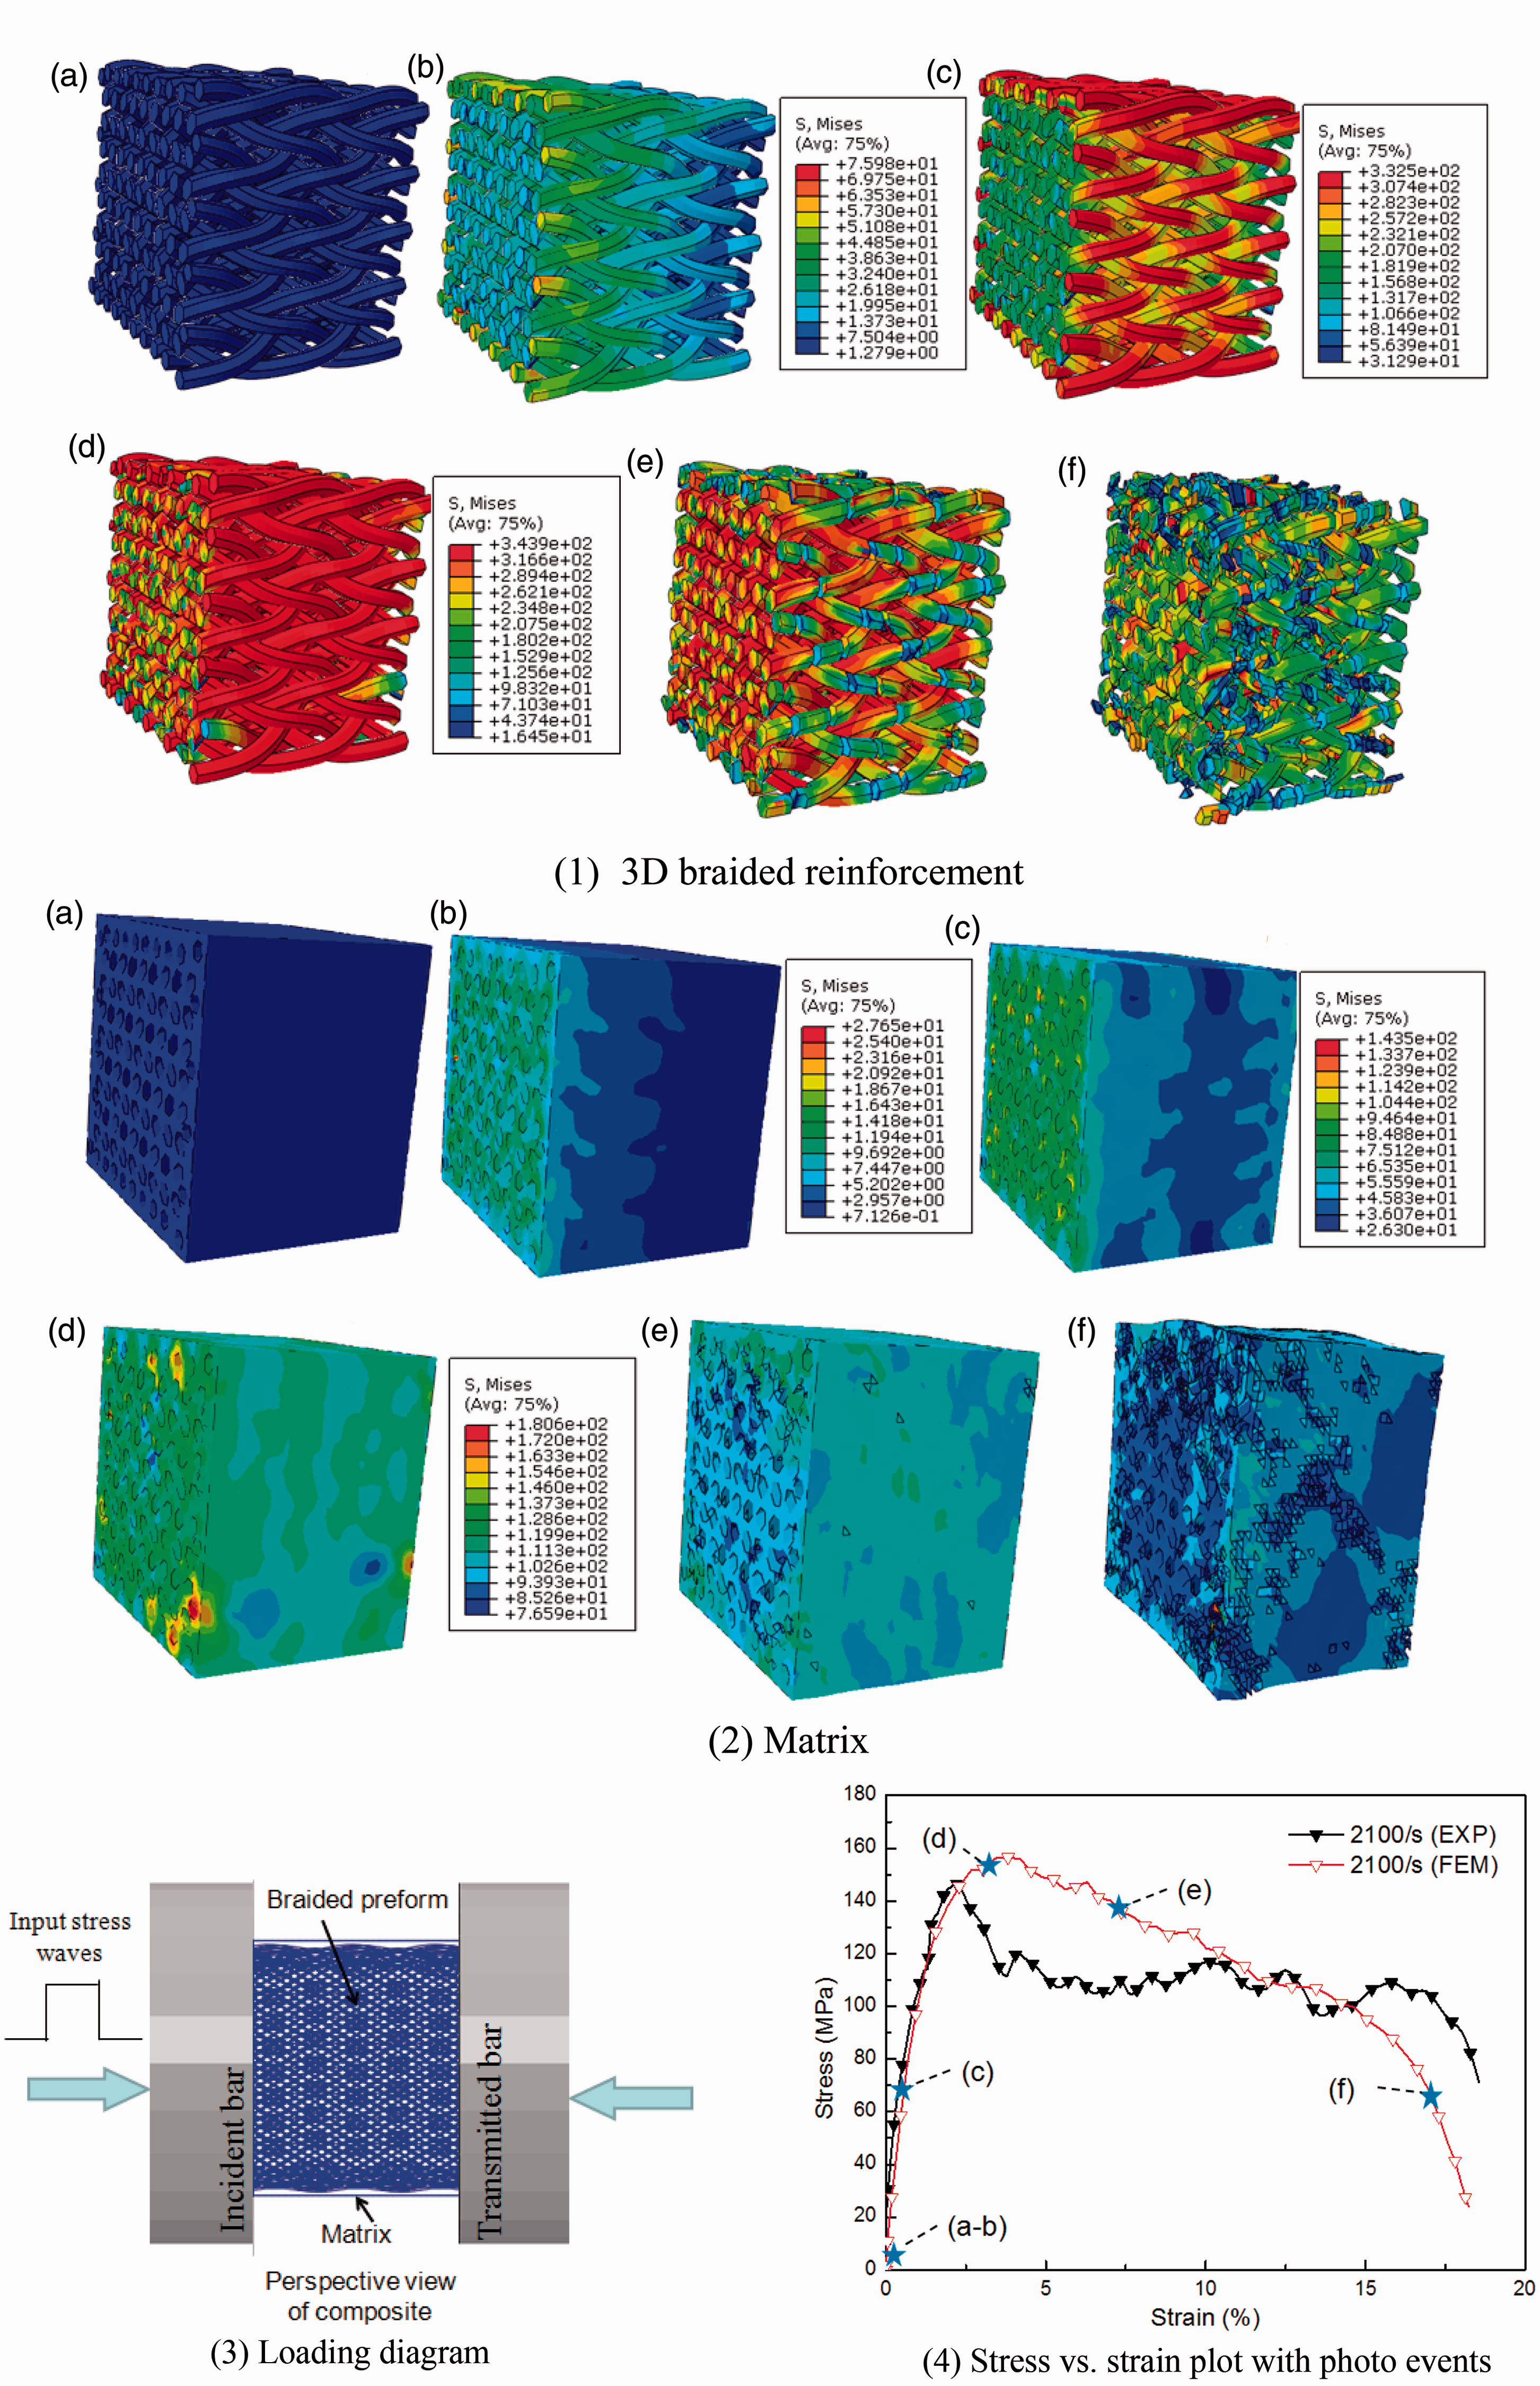
Obtaining the stress distribution of the 3D-braided composites is the second order of concern for the structural analysis as displayed in Figure 10(d). Since the fabric architecture is the main load carrying part in the composites, their von Mises stress is obviously higher than that in the matrix. As for the stress distribution of the braided preform that has been mentioned above in Stress distribution of fiber tows subsection. The stress concentrations occurring at the load surface of the matrix are due to where the squeezing state of yarns is so severe that the matrix volume fraction is too thin, as shown in Figure 10 (2d).
When the stress goes through the peak stress exhibiting softening, the braided yarn breakage begins to occur at the surface of the preform. In Figure 10(e) and (f), it is clearly seen that remarkable concentration of damage is observed in the curvature region with a small radius, whereas large damage zones are characteristic for two shear band forming as a special angel to the loading axis, while the matrix does not appear being destroyed completely rather than hold the failure yarn as an entity. This softening indicates the braided composite is one of the good energy absorption material with high fracture strain.
Out-of-plane compression at high-strain rate
The out-of-plane compression response of the material was also investigated numerically with the meso-structure model used to study the deformation response when subjected to high-strain rate loading. The process of stress propagation in each component part of composites can be seen in Figure 11(a)–(c). Compare these figures with related figures in Figure 10, it can be seen that the stress wave propagation is heavily dependent on the reinforcement of textile architecture. In this situation, the velocity of stress wave in this preform is slow, does not as well as in-plane, even lower than in the matrix along the load direction. This is because the main direction of fiber tows in 3D space is almost perpendicular to the propagation direction of the stress wave. Moreover, the reinforcement structure still is the main part carrying the stress load, as shown in Figure 11 (d)–(g). The state of stress distribution is similar with the mention above in Stress distribution of fiber tows subsection. The matrix also corresponds to experience a nonhomogeneity stress distributing state because of the 3D-braided architecture. From Figure 11(g)–(i), the onset of failure corresponds to both contact ends of the specimen initiating failure. The most serious failure occurs at the corner area with the breakage of the fiber tows where the stress concentration is and the crushed matrix.
Strain history for the out-of-plane FEA model at the rate of 2100 s. (1) 3D woven reinforcement. (2) Matrix. (3) Loading diagram. (4) Stress versus strain plot with photo events.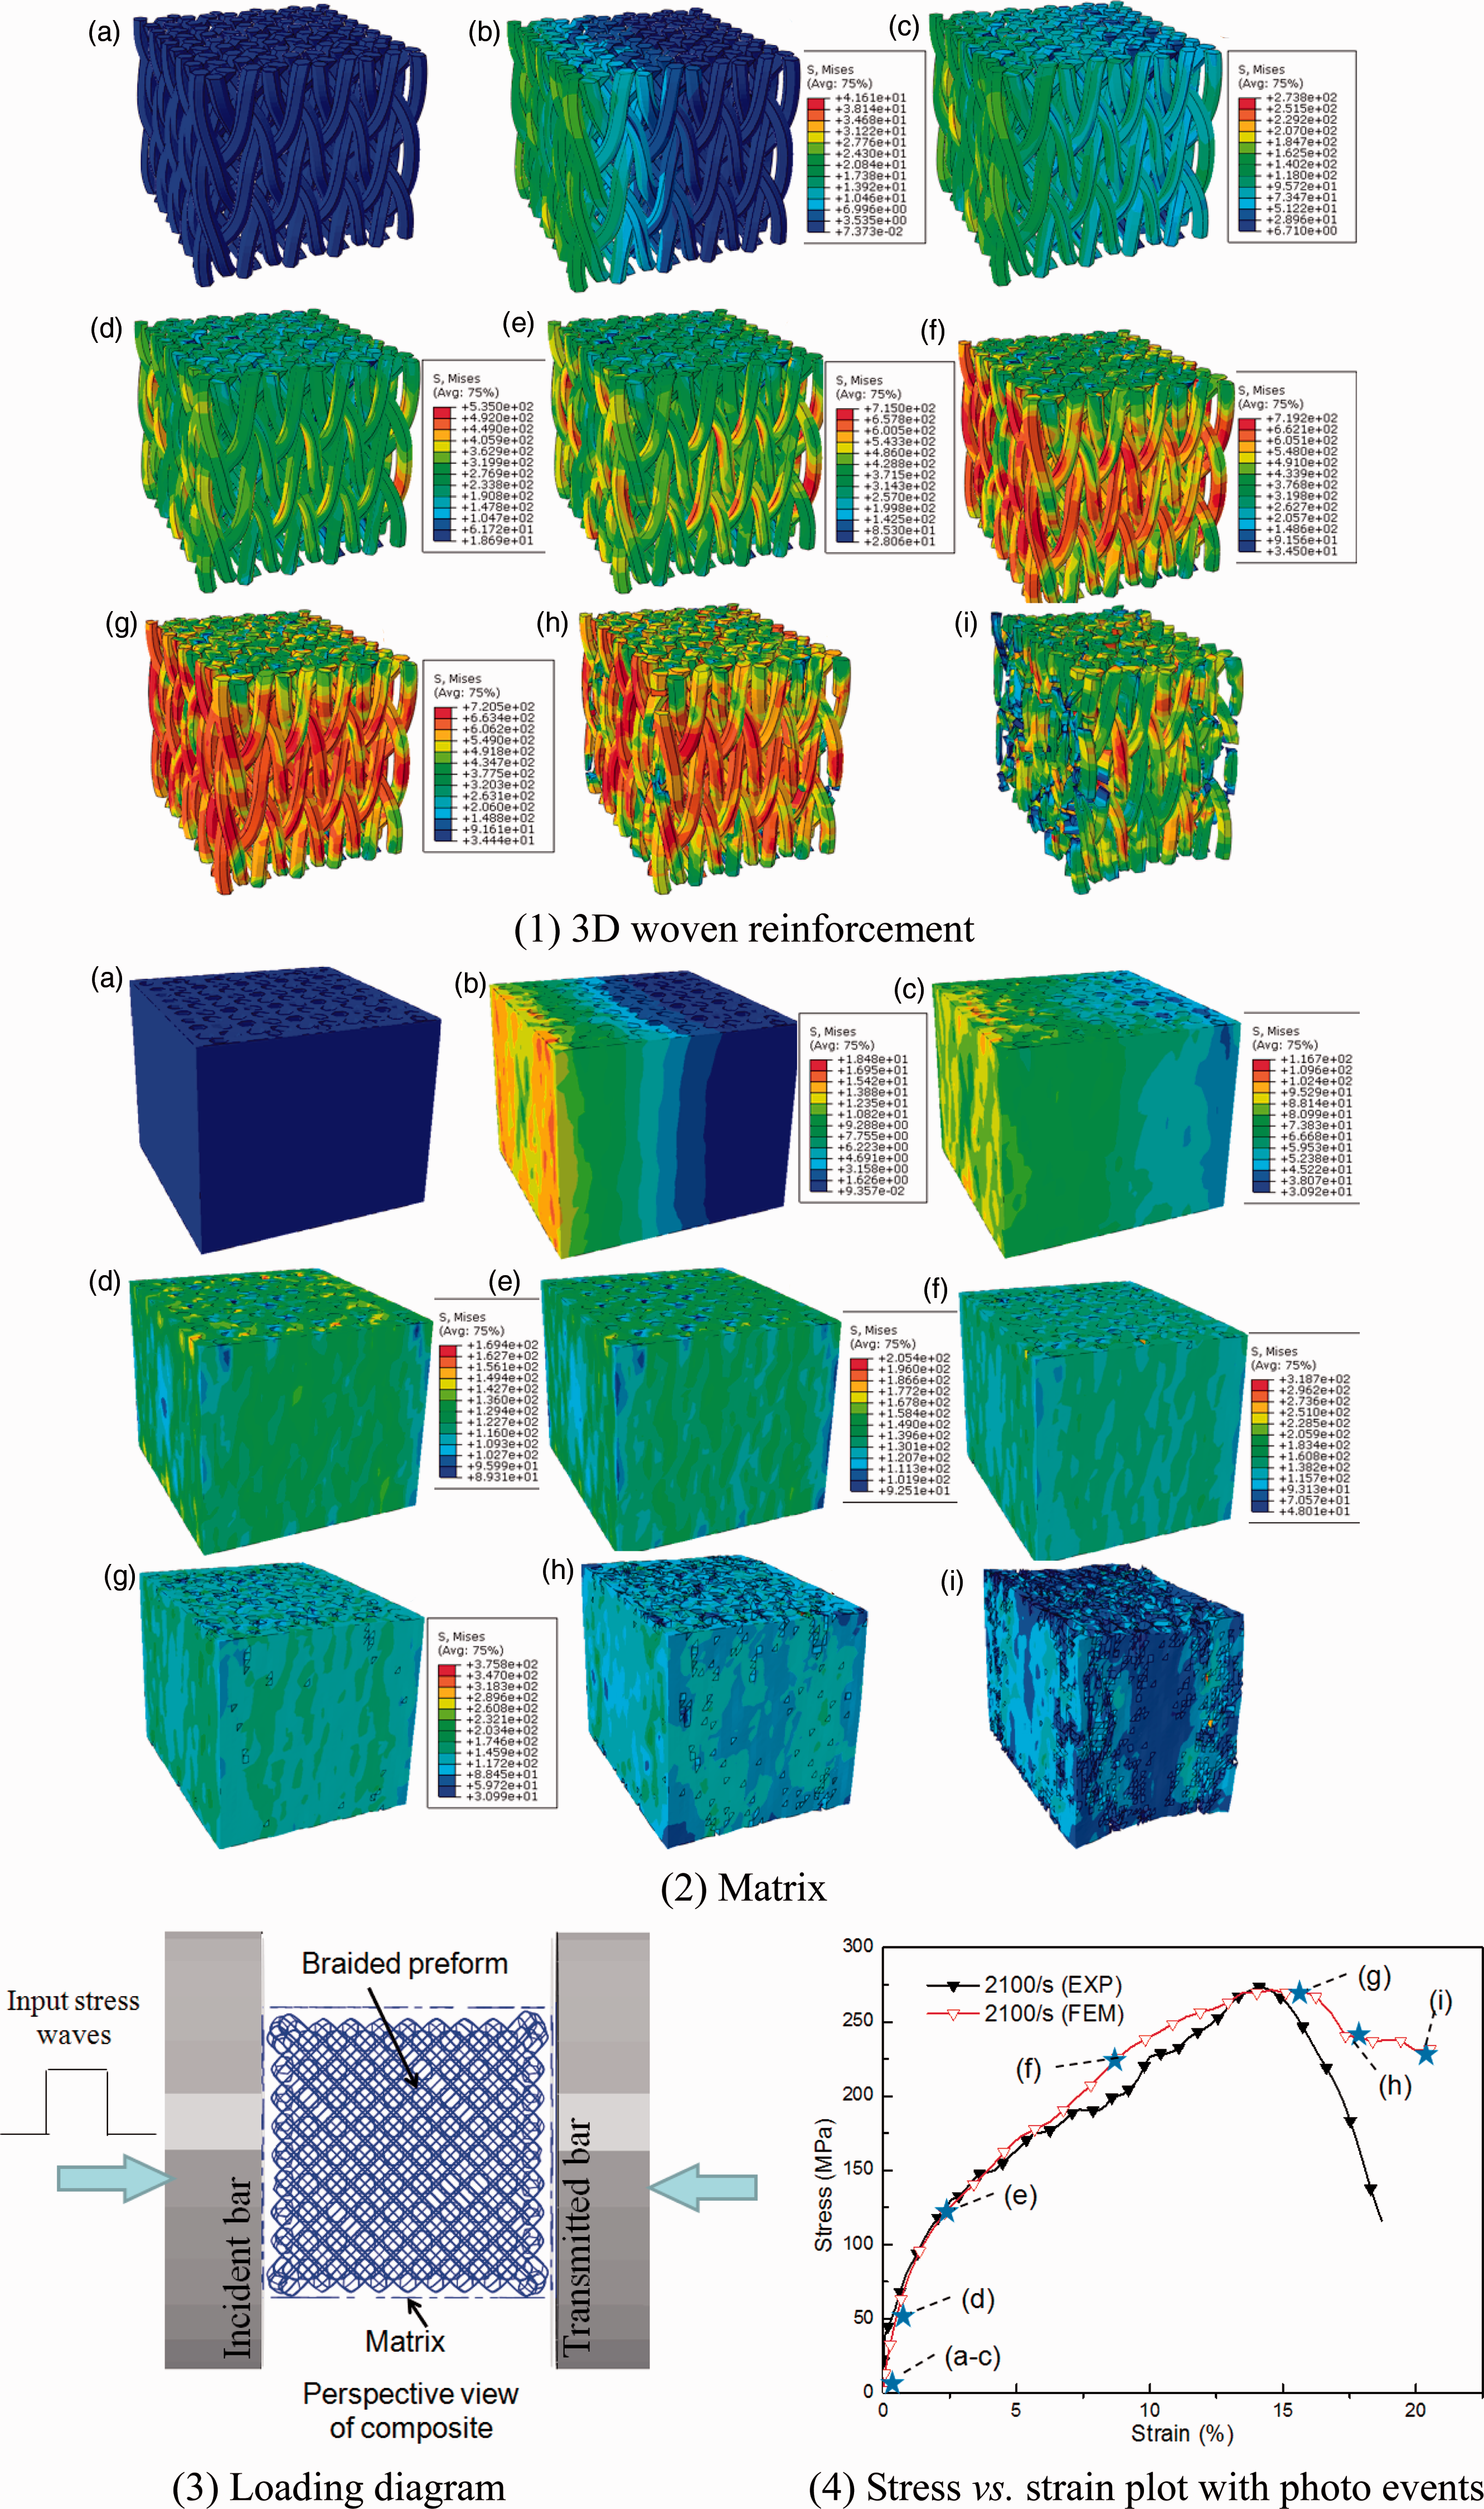
Energy absorptions
Figure 12 displays the effective energy absorption before the failure strain at different compressive strain rates along in-plane and out-of-plane directions, respectively. The energy need for failure can be calculated from the integration of experimental data in Figure 6(a) and (b). From Figure 12, it can be shown that the energy absorption of the 3D-braided composite increase with the increase of strain rate. And this strain rate dependence becomes even more evident in in-plane than out-of-plane when the strain rate reaches up to 1500 s. The reason could be attributed to the severity of the specimens, as show in Figures 13 and 14. Furthermore, the energy absorptions in the out-of-plane are much higher than that of the in-plane direction due to larger compressive deformation and bigger peak stress for out-of-plane direction as observed (see Figure 6).
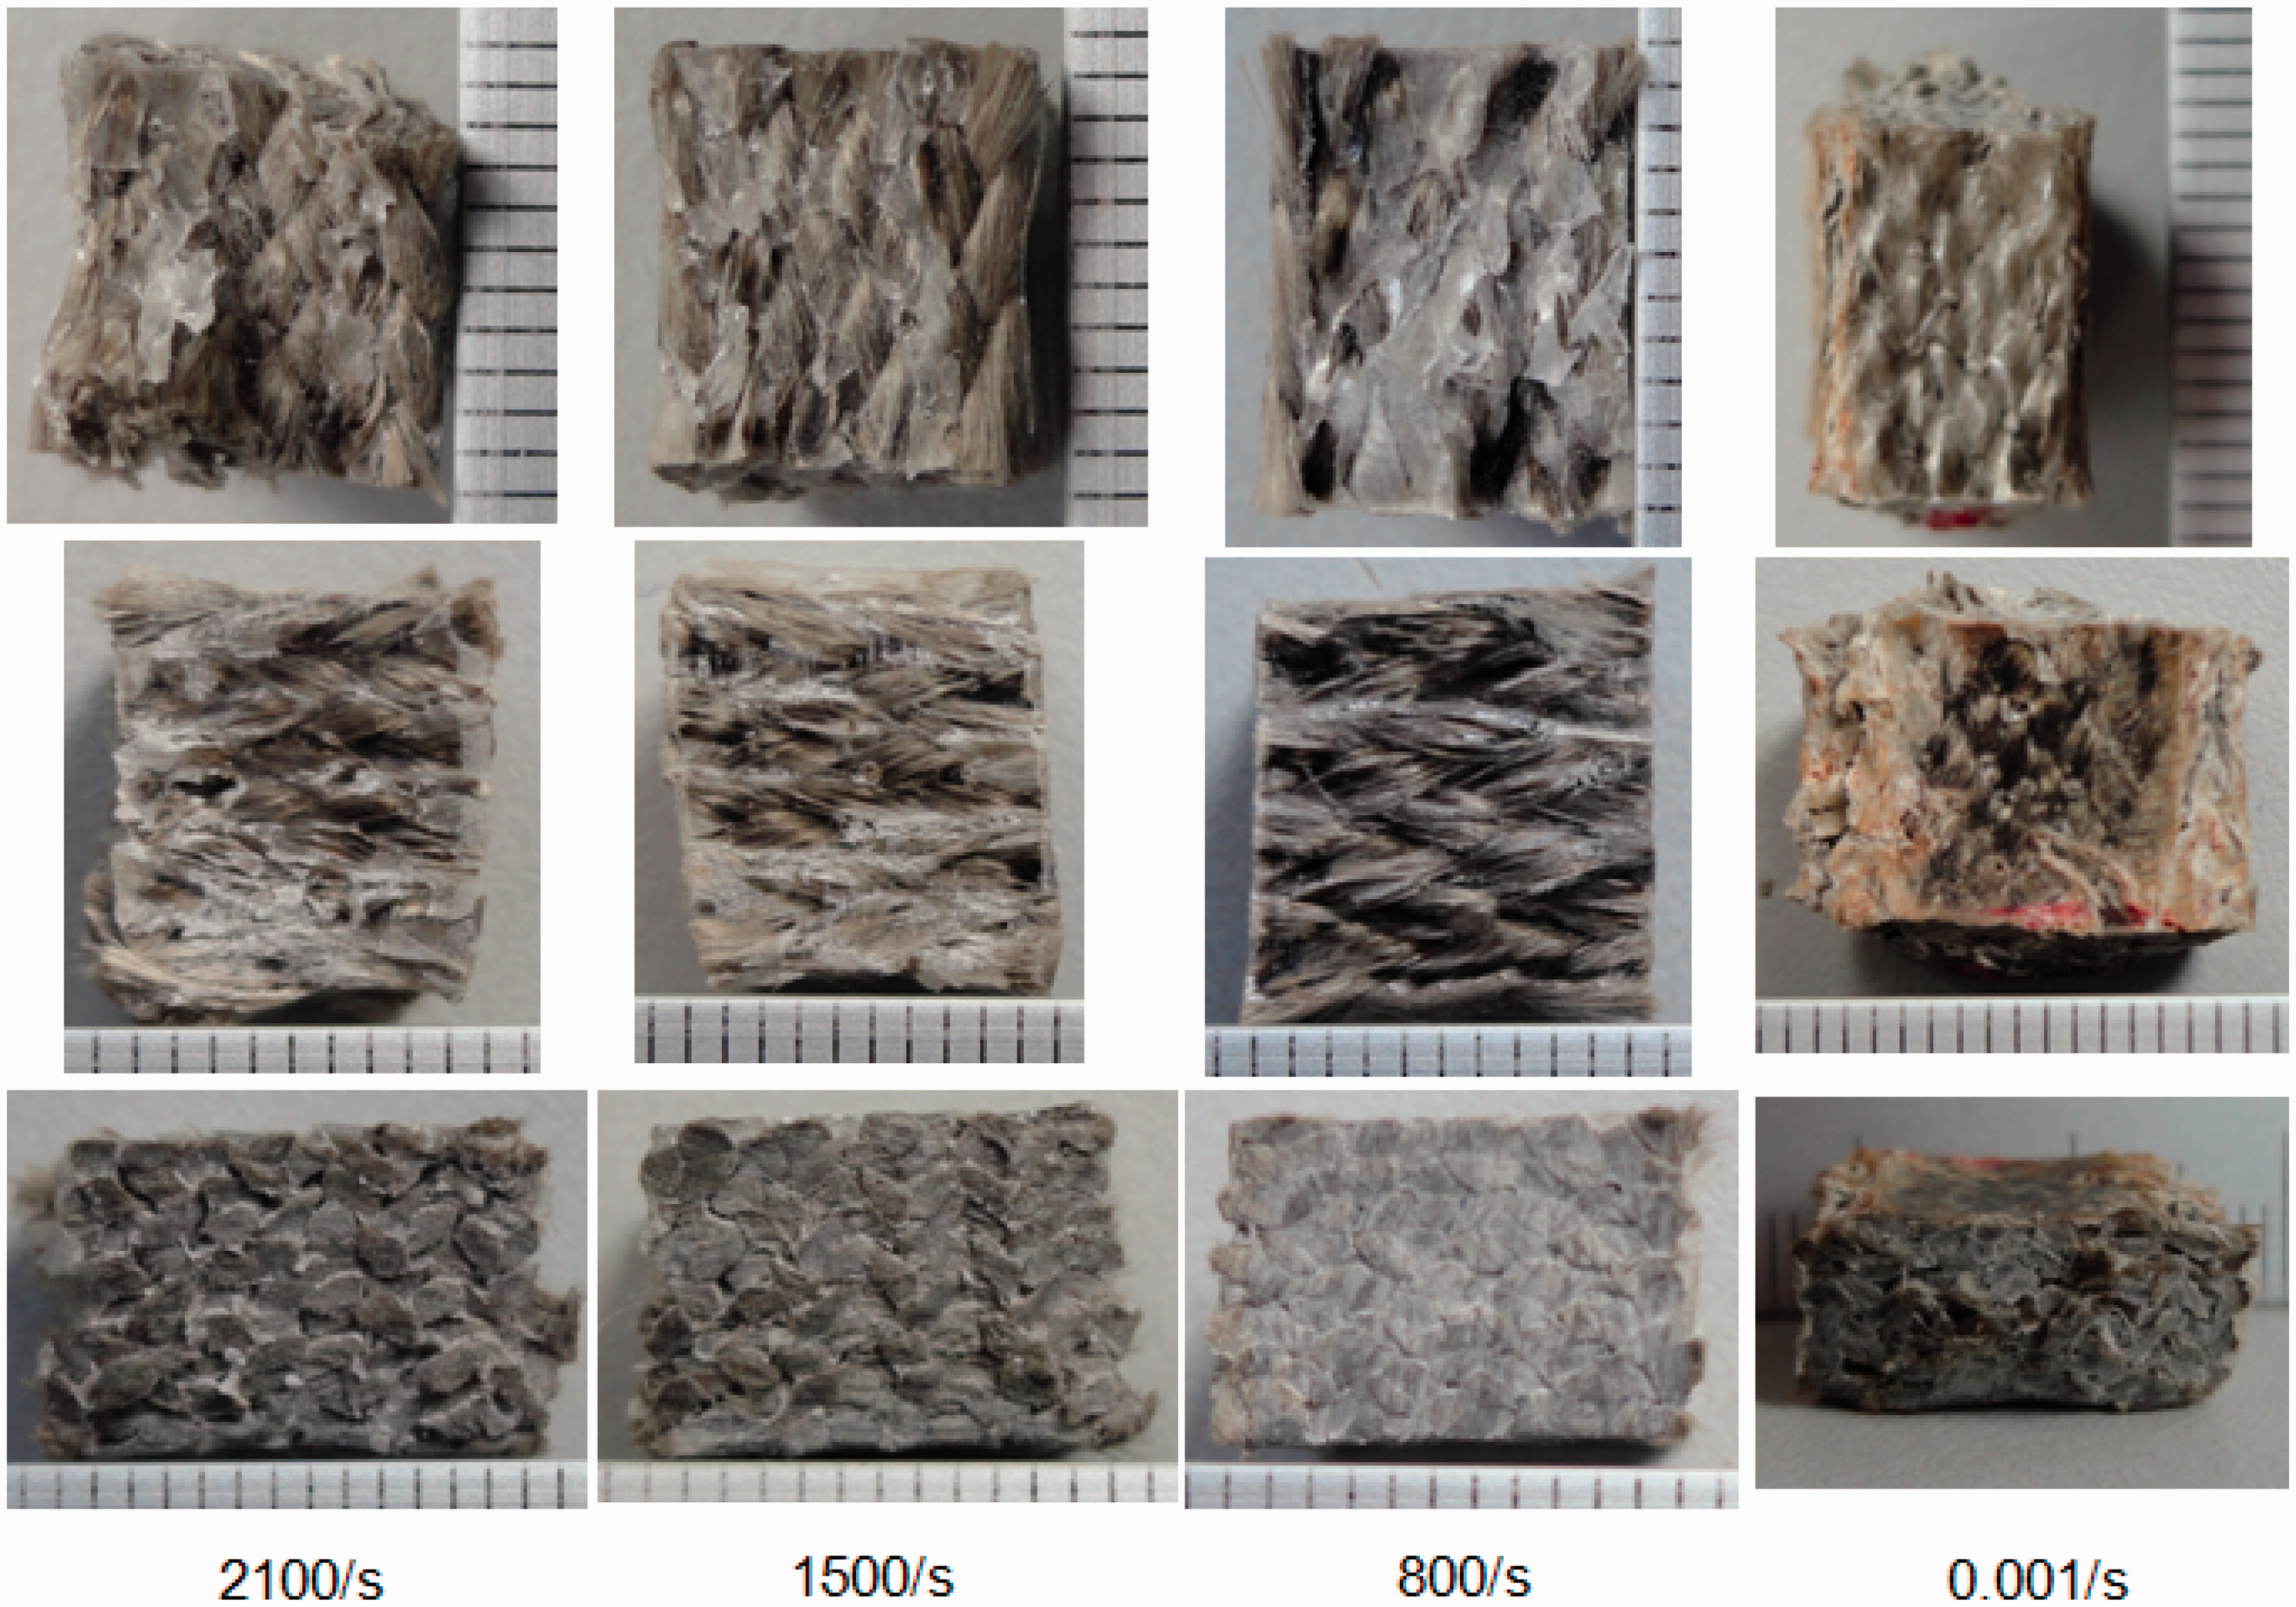
Comparison of energy absorption versus strain rate in the two material directions. The fracture photographs of 3D-braided composites in in-plane direction at different strain rates. The fracture photographs of 3D-braided composites in out-of-plane direction at different strain rates.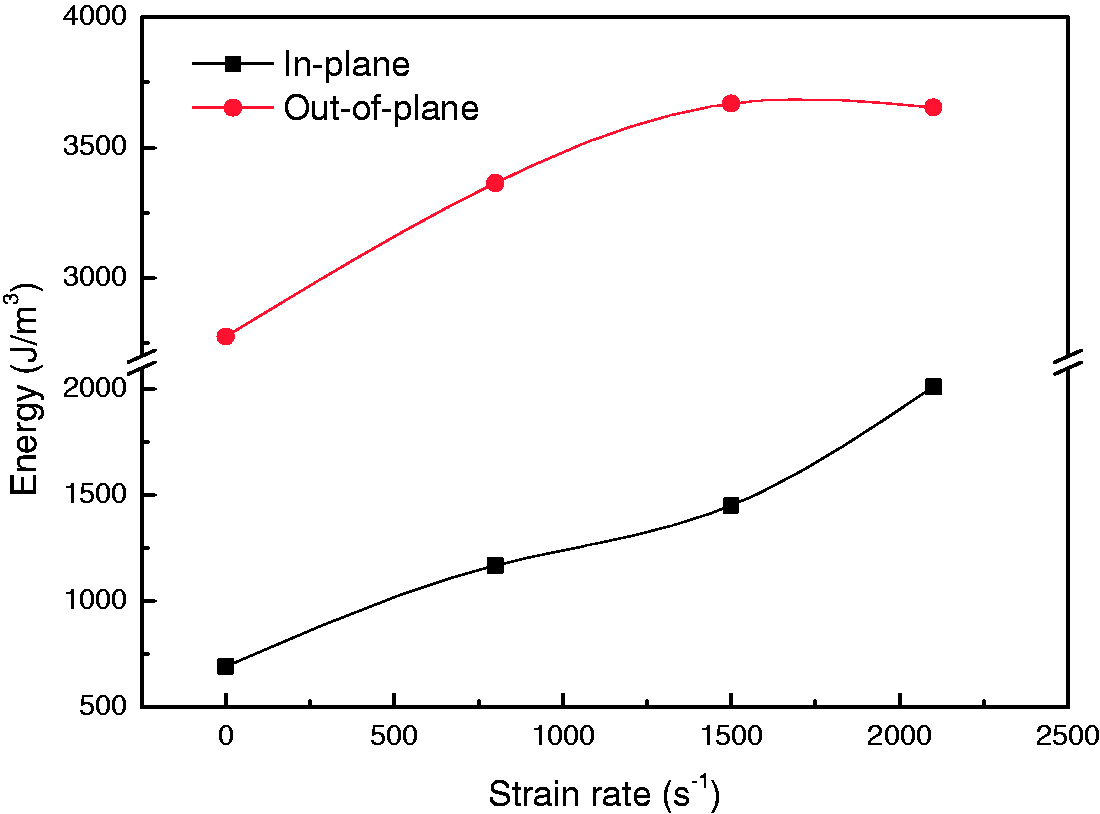
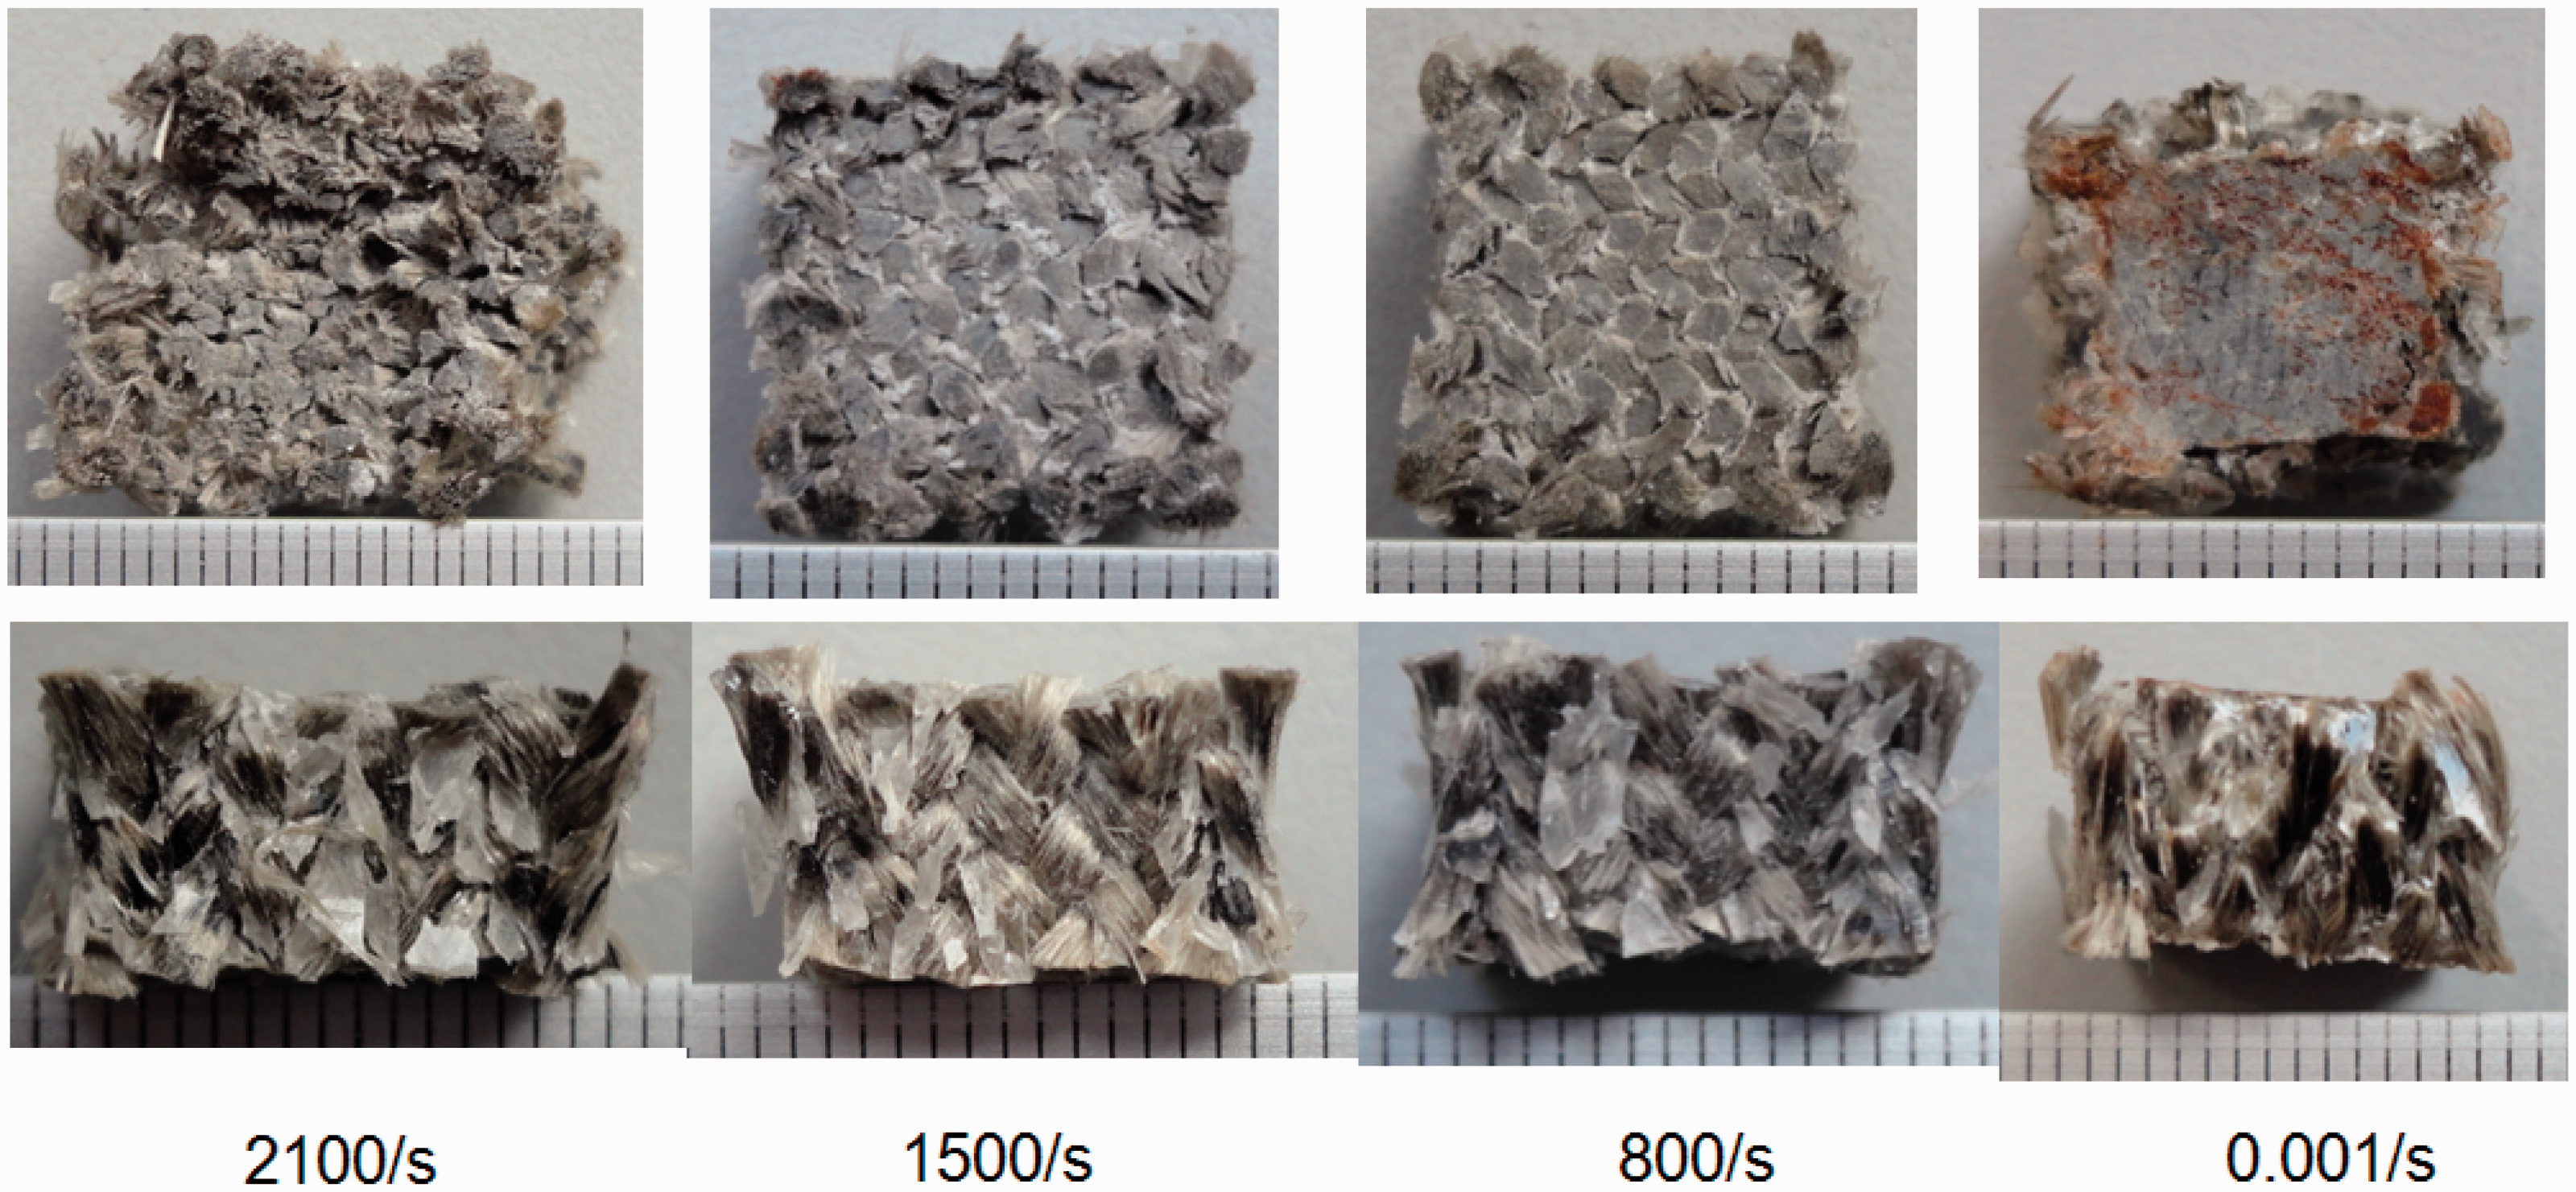
Failure morphologies
The morphology of specimen fractures was observed in order to investigate the type of damage and the failure mechanisms of composites. Figures 13 and 14 illustrate the postmortem photographs of 3D-braided composites at different strain rates. It was found that the damage and failure morphology in each direction have a similar failure mode at high-strain rates. In in-plane direction, a number of tiny cracks can be observed on the specimen-loaded surface keeping a square section and more fragments of matrix were shattered from the outside surfaces. From Figure 13, we can see the damage and failure of the specimens are predominantly caused by the evolving crack and failure in the matrix. At quasi-static loading, there is only failure around the outside surface where the stress concentration is, as given in Figure 8. The damage to the loaded surface looks more serious with the increment of the strain rate. For the out-of-plane compression case, an obvious anisotropic of failure in three directions can be noticed, as shown in Figure 14. The damage morphology observed from these photographs is similar with the result got from the in-plane.
In case of FE results, the meso-structure model accurately predicted the response of the material as discussed in Mechanical responses section, but also it can give new insights into the damage and failure mechanisms under dynamic loading conditions. Although the idealized architecture could not capture failure modes very well because the postmortem photographs of the specimens in the experiments were subjected several times of impact stress wave loading. Moreover, the perfect bonding in the FE model also compromises the matrix debonding and fragment. In Figures 15 and 16, it is clearly seen that remarkable concentration of damage is observed at the outside surface. It is because, as mentioned above, the interior fiber tows stand less loading and the stress concentration always occurs at the surface and corner of 3D-braided composites where the yarn bending is. In all load cases, the FE results also show that the failure of composites was more obvious with more fragments shattered as the strain rate going up. Figure 15 illustrates the main failure pattern in in-plane compression is shear failure with a degree of 39.8. And a number of segments of fiber tows can be seen on the surface due to the failure of the matrix in yarn, which happened when they were subjected to loading. Figure 16 shows the failure of composites in out-of-plane direction was triggered by compressive failure in the yarns at the loaded surface, while the matrix did not flaked off from the specimen surface due to its plastic deformation.
Failure morphologies of composites in FEA model in in-plane direction at high-strain rates. Failure morphologies of composites in FEA model in out-of-plane direction at high-strain rates.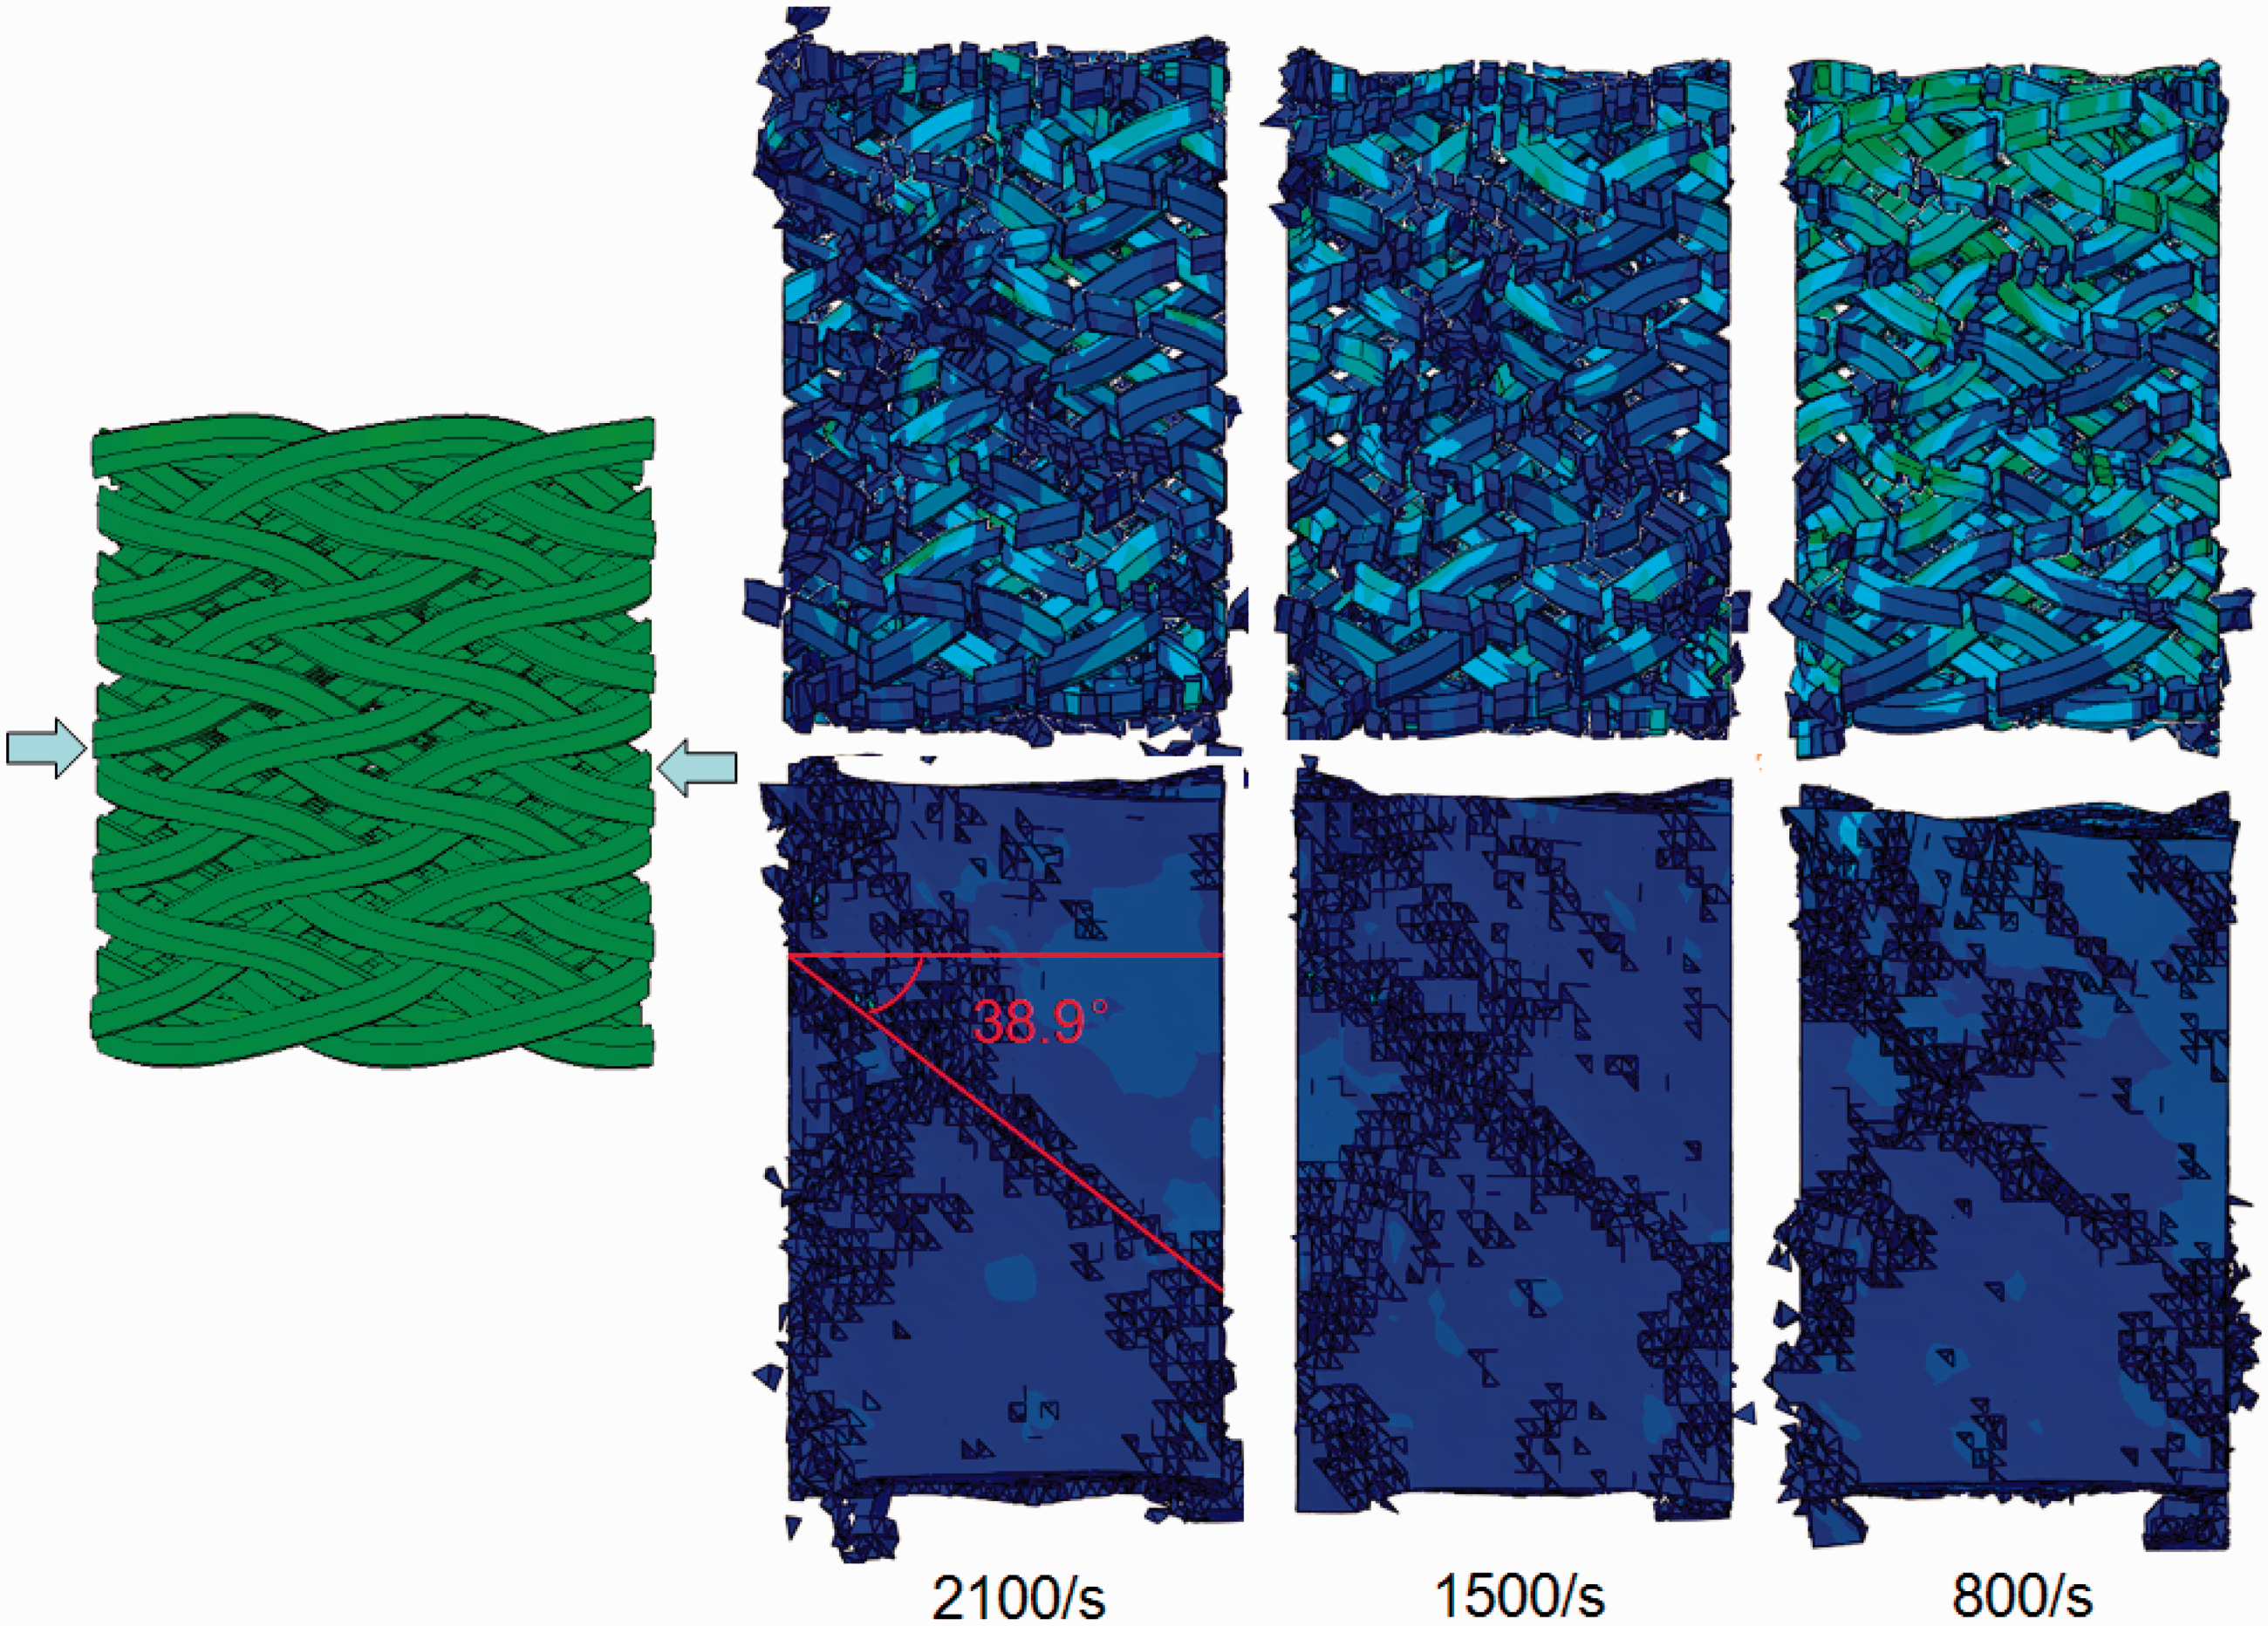
Conclusions
The compressions behaviors of 3D-braided composites under different strain rates in two material directions were modeled with FE method based on meso-structure and compared with those in experimental. The results from experimental and numerical were found to be stain rate sensitive and agree well each other with respect to predicting compression strength and stiffness. The validated FEA models were used to provide insight into the locations of mechanical response within the material. The stress propagation, the 3D stress state of fiber tows in interior and outside surface of 3D-braided composites as well as the progressive failure behavior were discussed. There is good agreement between the numerical and experimental failure modes. The result indicates the distinctive properties and the fiber tows in surface and corner area of braided preform, where the failure easily happens due to the existing of the bending, play a very important role under no matter quasi-static or high-strain rate loading. From the macroscale view, the failure mode results showed that the specimens subjected to only one time of impact compressive loading have similar failure morphologies with a degree of 39.8 of shear band in in-plane direction, while some compressive failure in the yarns at the loaded surface were found in out-of-plane direction. Additionally, the energy absorption of the 3D-braided composite at various strain rates was also calculated and discussed. The energy absorbed, increasing with the increment of strain rate, is much higher in the out-of-plane direction than that in in-plane direction.
Footnotes
Conflict of interest
None declared.
Funding
The authors acknowledge the financial supports from the National Science Foundation of China (Grant Number 11272087) and the Fok Ying-Tong Education Foundation (Grant No. 141070). The financial supports from the Foundation for the Author of National Excellent Doctoral Dissertation of PR China (FANEDD, no. 201056), the Keygrant Project of Chinese Ministry of Education (no. 113027A), Shanghai Science and Technology Innovation Action Plan (grant nos. 12521102400 and 12dz1100407), and the Fundamental Research Funds for the Central Universities of China are also gratefully acknowledged.