
Abstract
This paper presents the experimental results of calcium argillaceous cemented sandstones with different water contents under uniaxial and cyclic loading conditions. The effects of the water content status on peak strength, deformation, and dissipated energy are discussed. Meanwhile, the acoustic emission energy is also studied based on the accelerating energy release theory and energy distribution density function. The experimental results show that the water content has remarkable effects on the peak strength and elastic modulus by a decrease of 37–58% and 15.7–21% after being saturated, respectively. Both the accumulated dissipated energy and dissipated energy generating ratio of dry specimens are higher than those of the saturated specimens. The acoustic emission energy release rate of dry specimens is higher than those of the saturated specimens, which means a high tendency of sudden failure for dry specimens. Moreover, the distributions of acoustic emission absolute energy are consistent with the normal density distribution function, and the AE energy expectations of dry specimens are higher than those of the saturated ones in the loading process and they show an obvious increasing trend on approaching failure. These conclusions will be helpful for the illumination of water-weakening effects on the mechanics parameters and failure mechanism analysis in view of the releasing energy.
Keywords
Introduction
The proved coal reserves in the Western China are about 1063 billion tons, which are almost 81% of the total proved reserves. However, the mechanics properties of coals in Western China are quite different from those of the Carboniferous-Permian coals in Eastern China. The coals in Western China are mainly formed at the Early-Middle Jurassic with short formation time and have weak diagenetic characteristics. Thus, it is quite significant to study the water-weakening effects on the characteristic of mechanics and dissipated energy with calcium argillaceous cemented sandstone in Western China during the loading process for analyzing the mining rock mass stability.
Rock masses usually exist in the specific geological environment with groundwater, in suit stress, and high temperature. Loading history and water content may affect the peak strength, deformation (Hashiba and Fukui, 2015), cracking mechanism (Feng et al., 2004), and energy release (Byun et al., 2012; Gao et al., 2012). And the effects of the loading history and water content are more remarkable on sandstone (Chen and Zhou, 1991; Yuan and Ma, 2015). Estimation and calculation of the damage evolution in the loading process have gained extensive attention (Basu and Mishra, 2014, Iturrioz et al., 2014), and damage models are also important and complex for crack evolution and numerical simulations due to inhomogeneity and discontinuity in rock mass (Desmorat, 2016; Kim et al., 2016). Furthermore, the real-time monitoring damage evaluation and energy release is quite significant for analyzing the stress levels and early warning of instability. So the elastic wave measurement is widely used in reflecting rock parameters for its nondestructiveness, simplicity, and accuracy. Acoustic emission (AE), as a kind of elastic wave, originates as a result of dislocations, grain boundary movement, or initiation and propagation of fractures between mineral grains (Eberhardt et al., 1998), and it contains abundant message presenting failure plane (Richard and Larry, 2001). Thus, AE is also used to identify damage in view of the crack closure, initiation, propagation, and coalescence during the loading process (Liu et al., 2009). As the loading increases, the AE parameters including energy, amplitude, frequency, and rings vary, and correspondingly some of the phenomenon in time sequence can be used to analyze the damage (Moradian et al., 2016; Zhao et al., 2015) and put forward the failure criterion (Byun et al., 2012). Over the past few decades, a considerable number of studies have been conducted on AE parameters, including representative studies such as b-value (Hirata et al., 1987), fractal dimension (Xie et al., 2011), finite element simulation (Burks and Kumosa, 2014), wavelet decomposition (Wang and Chu, 2001), chaotic and neural network model (Li and Liu, 2005), moment tensor inversion (Richard and Larry, 2001), autocorrelation model (Vilhelm et al., 2008), and statistical theory (Cai and Lai, 2003; Rao and Lakshmi, 2006). Based on the previous studies, it can be concluded that the b-value and fractal dimension decrease when approaching failure (Iturrioz et al., 2014; Lei et al., 2000; Rao and Lakshmi, 2005), and the autocorrelation of AE events enhances near peak strength (Vilhelm et al., 2008). The spectrum and other parameters also show regular variations as the stress increases (Zhang et al., 2013). Moreover, AE monitoring is also used in creep (Liu et al., 2010) and three-point bending tests (Mustapha et al., 2015) for establishing the damage model and identifying the damage mechanisms.
However, mineral composition, cemented content, porosity, joint orientation, and moisture content in rock can significantly affect the generation and propagation of AE signals (Khandelwal and Ranjith, 2010; Khandelwal and Singh, 2009). Furthermore, the distribution of AE energy is related to the size of composition particles, stress levels, and the bending direction (Přikryl et al., 2003). Due to the water-weakening effect on the cemented composition and mineral particles, the water content shows a notable influence on the mechanics properties (Erguler and Ulusay, 2009) and AE energy (Qin et al., 2012). The above study on damage and dissipated energy is of great importance to understand the instability and failure of rock, but the mechanism and energy release characteristics of sandstone with different water contents during the loading process remain unclear.
Thus, in this paper, the dry and saturated calcium argillaceous cemented sandstone specimens have been selected for the uniaxial and cyclic loading experiments with the monitoring of the AE events. The mechanics parameters and dissipated energy characteristics of sandstone specimens with two water contents have been comparatively analyzed. In addition, AE energy release and density distribution characteristic during the loading process have also been discussed. The experimental result is of great help to understand the water-weakening mechanism and damage characteristic of sandstone in coal mining.
Preparation and loading schemes of the specimens
Preparation of specimens
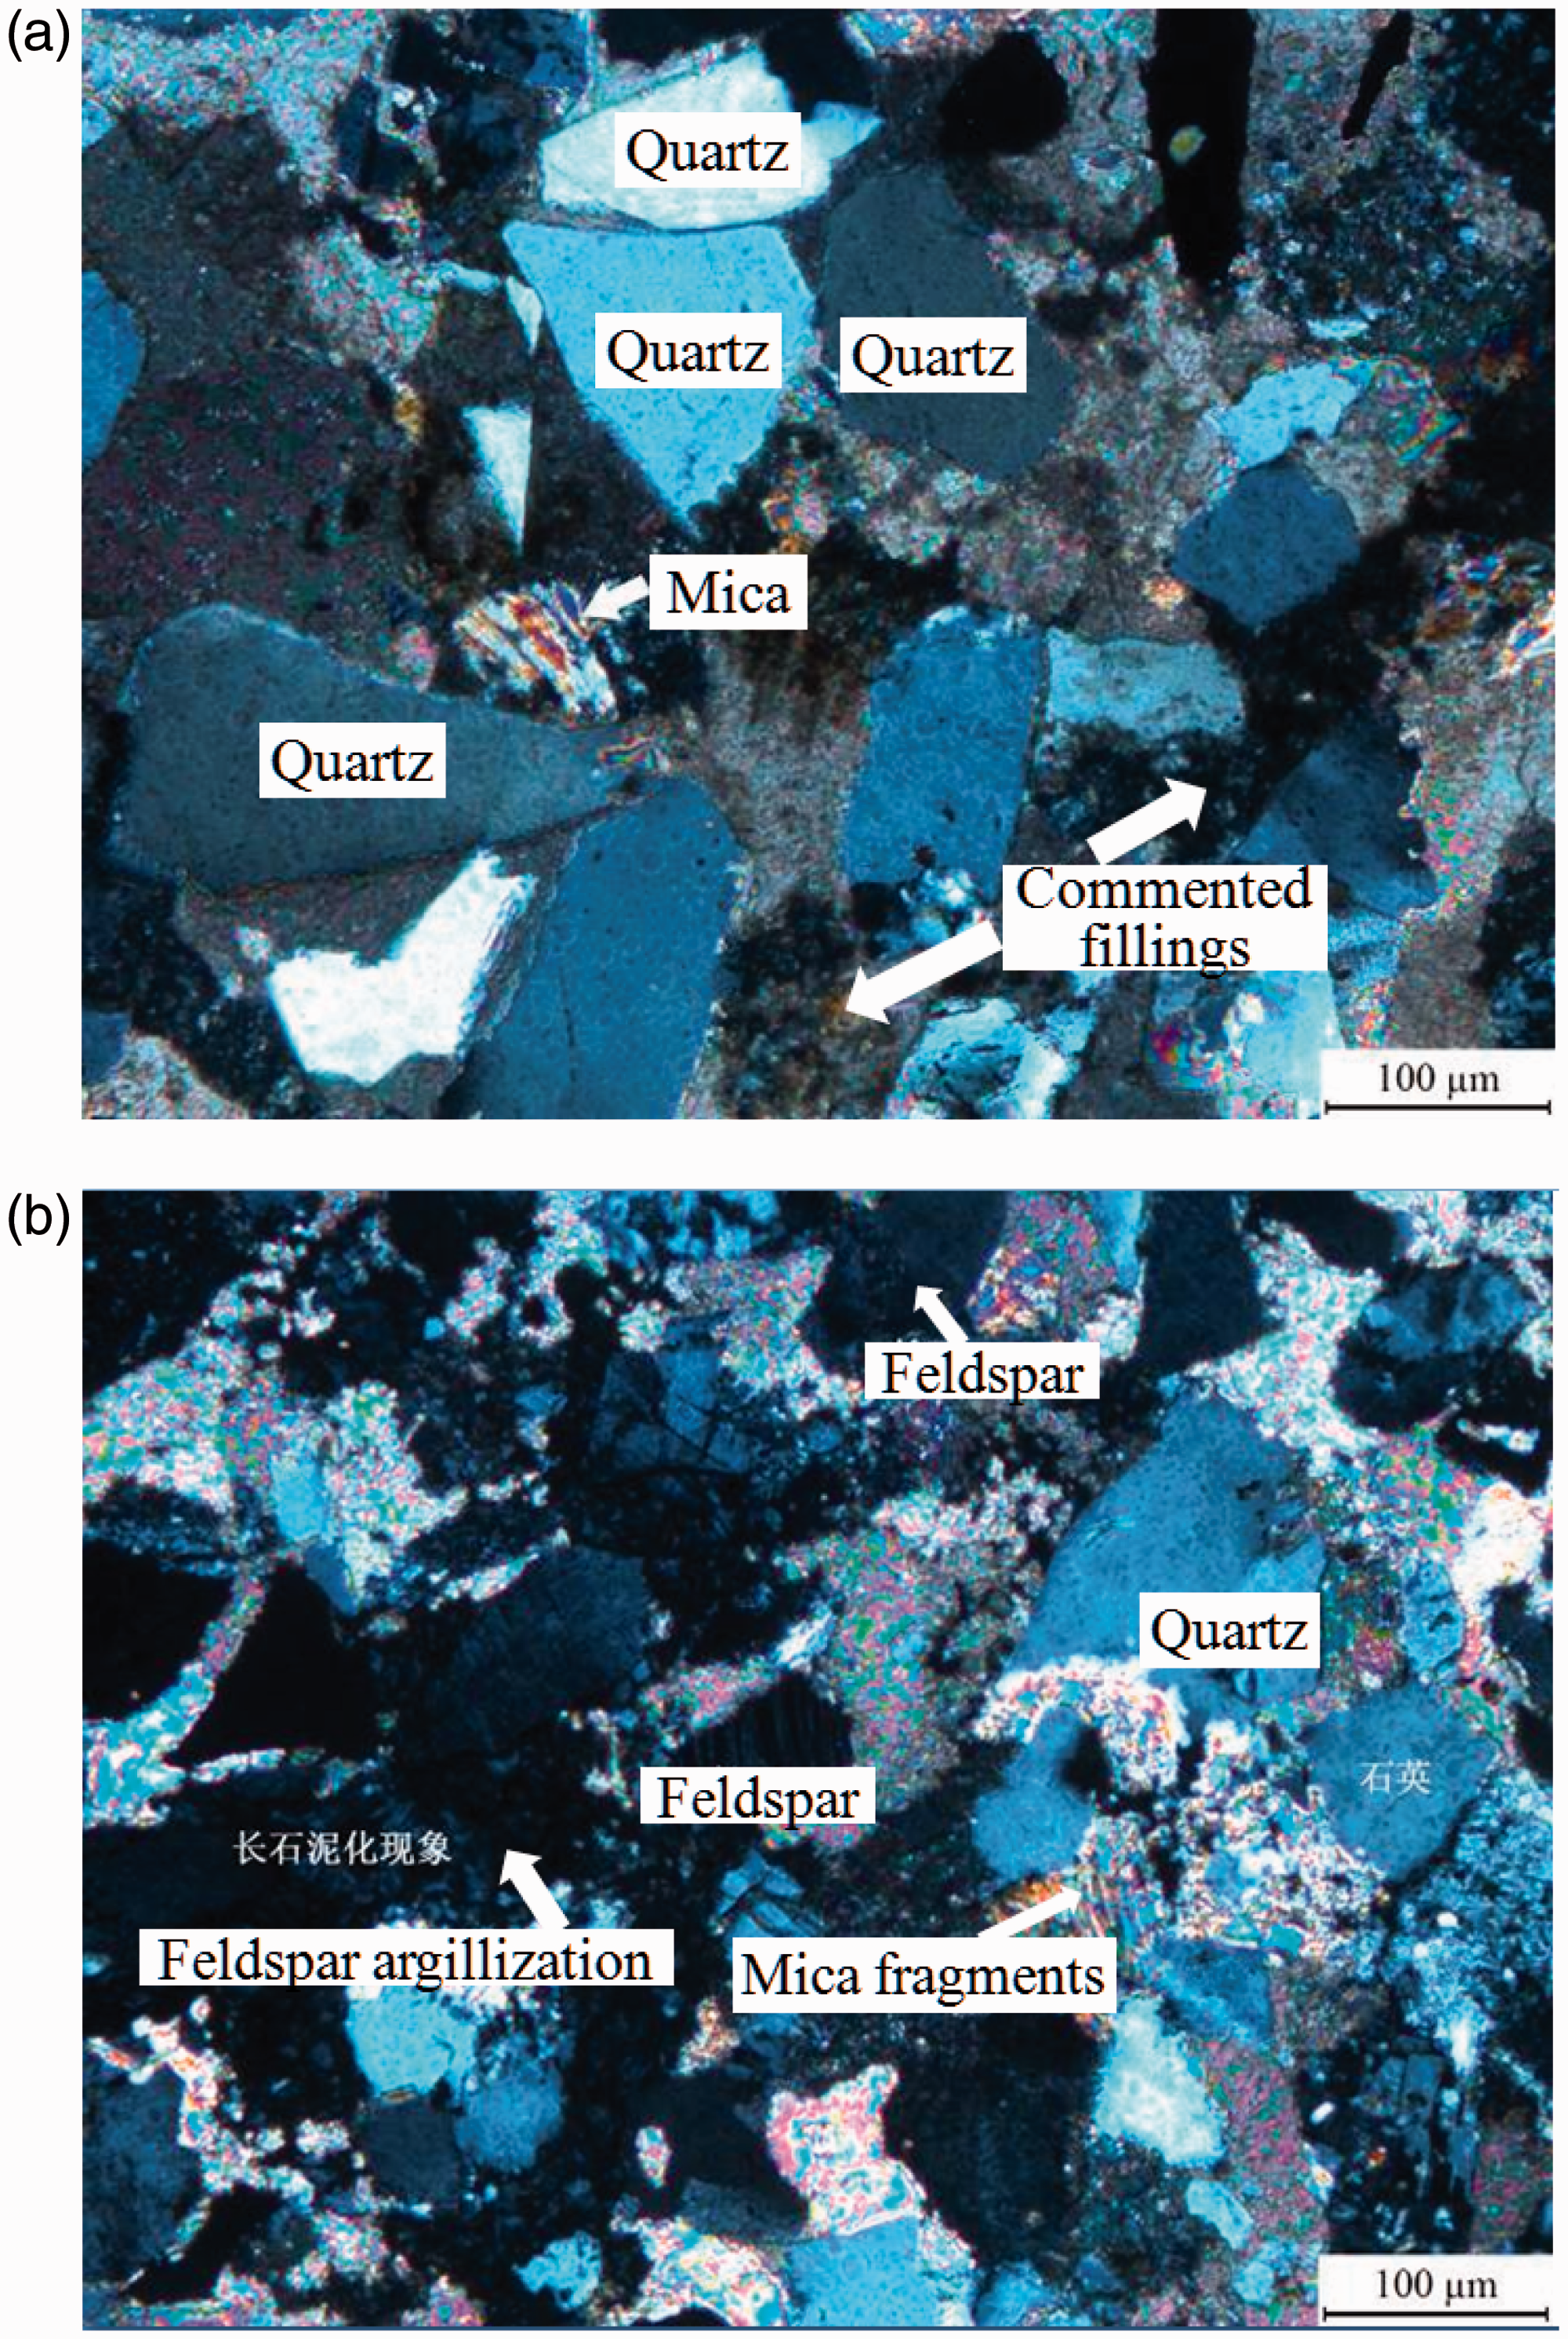
The sandstone specimens were taken from Yulin Coal mining in Shaanxi province, China, and made in cylindrical form in accordance with the ISRM standard (Figure 1). The burial depth of sandstones was about 100 m, in the roof of the coal seam. The typical slices are shown in Figure 2 in view of the photomicrograph, and it can be found that the sandstone usually consists of 60–70% prismatic and subangular quartz, 5–10% fragmentation mudding feldspar, 20–30% calcium argillaceous cemented filling (bubbles generated when hydrochloric acid is added) and a little mica fragments. The grain size is about 0.1–0.3 mm, so the specimens belong to the medium granular sandstone.
Calcium argillaceous cemented sandstone specimens. Photomicrographs of the medium sandstone: (a) quartz and cemented filling (100×); (b) feldspar and mica (100×).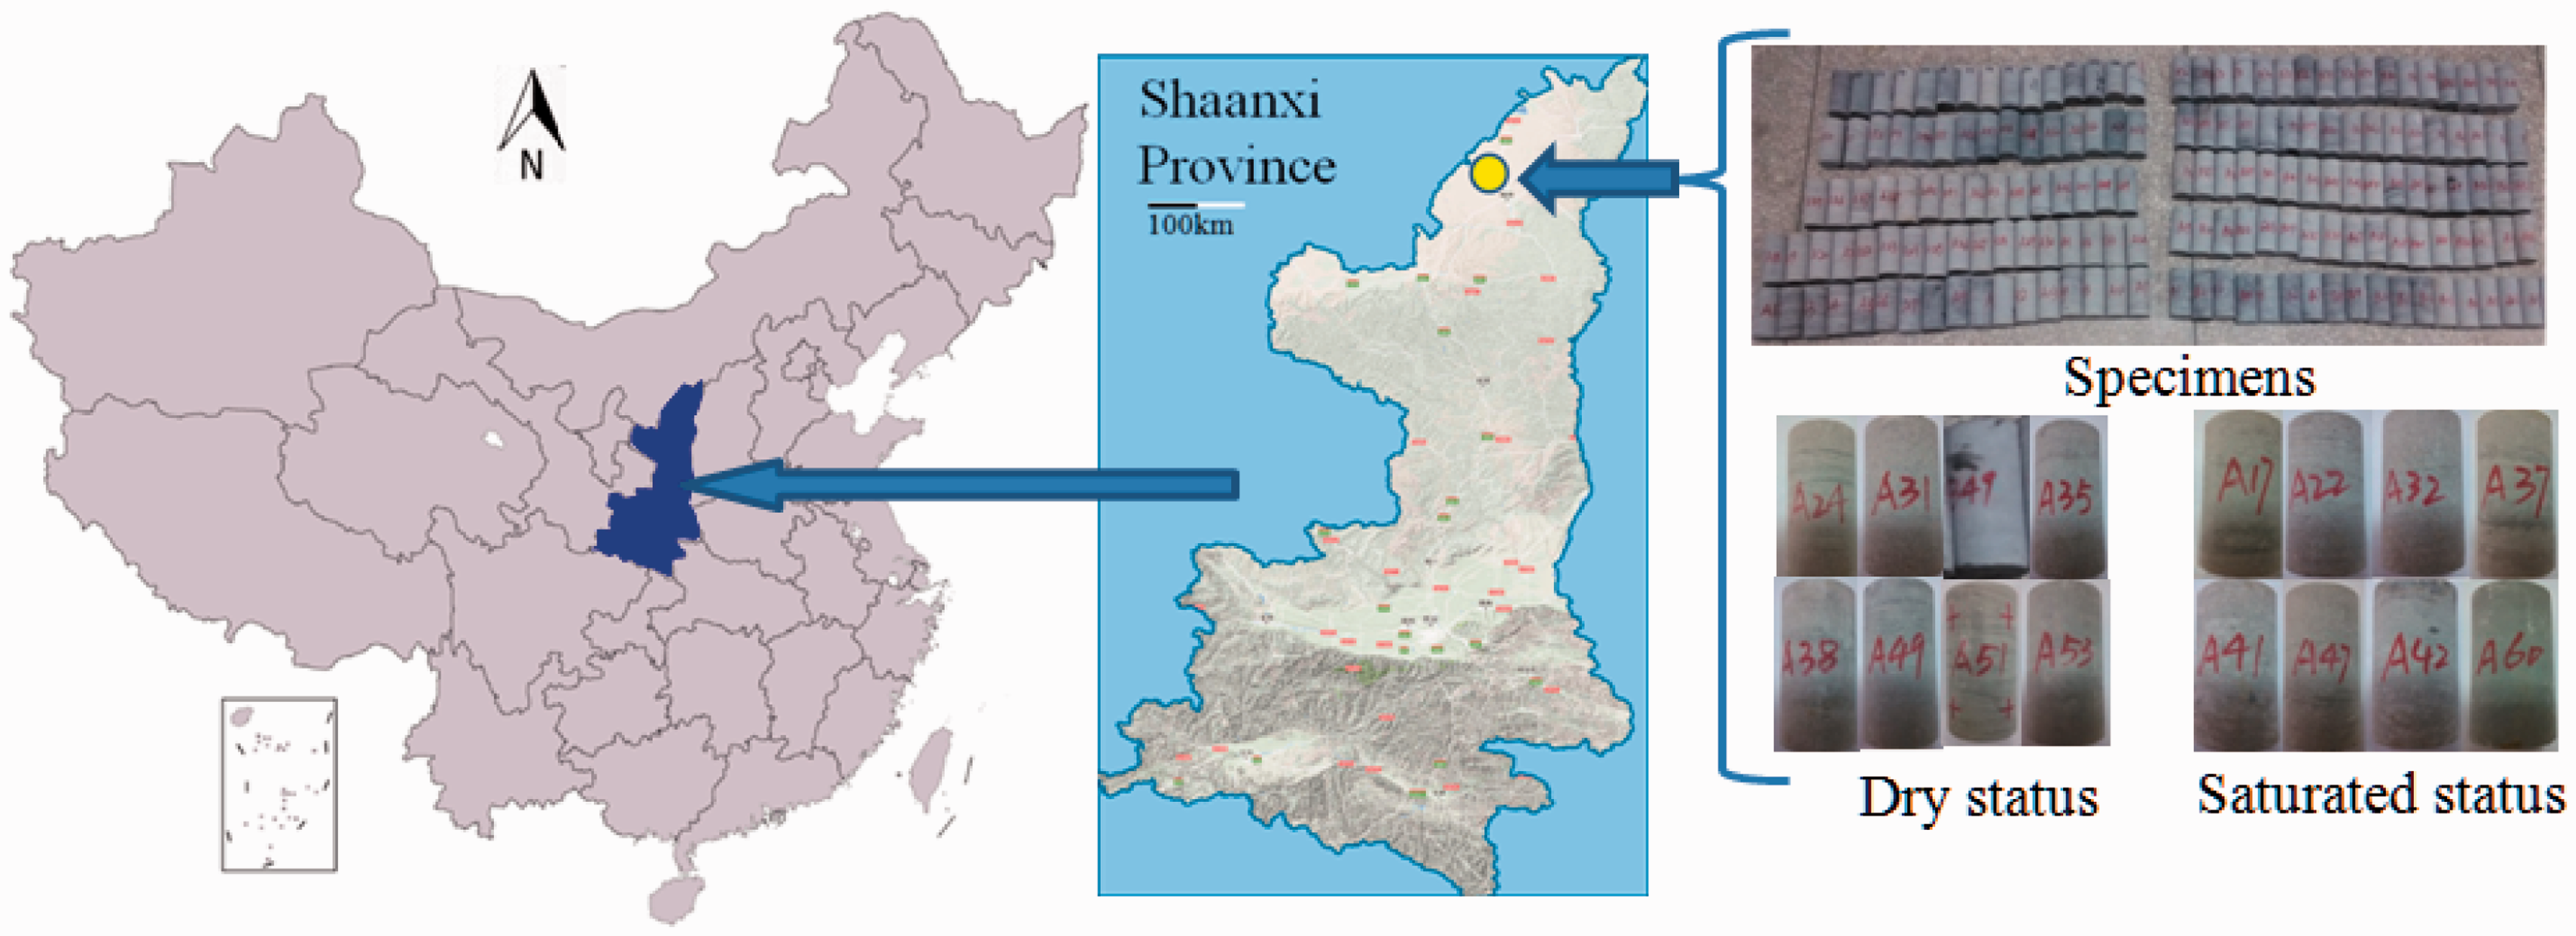
Experimental set-up
During the uniaxial loading and unloading process, the AE events are monitored simultaneously. The loading system is TAW-2000 kN servo-controlling electro-hydraulic triaxial machine, the axial force measuring range is 0–2000 kN with ±1% measuring accuracy, the displacement measuring range is 0–100 mm with ±1% measuring accuracy, and the deformation measuring resolving power is 1/200,000. The AE monitoring system is PAC PCI-II acoustic emission machine with eight acquiring channels, and the sampling frequency is 1 kHz to 3 MHz. The amplifier model is 20/40/60 dB and the gain is 40 dB. The signal sensor is Nano30 piezoelectric transducer with response frequency of 125–750 kHz. The related testing equipments are shown in Figure 3.
Loading system and AE acquisition system.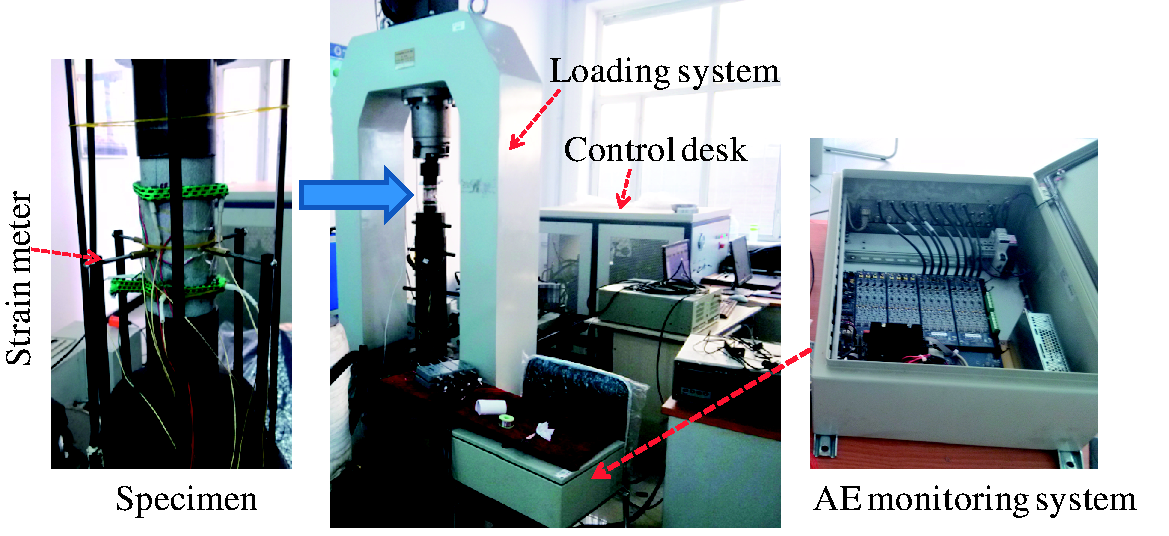
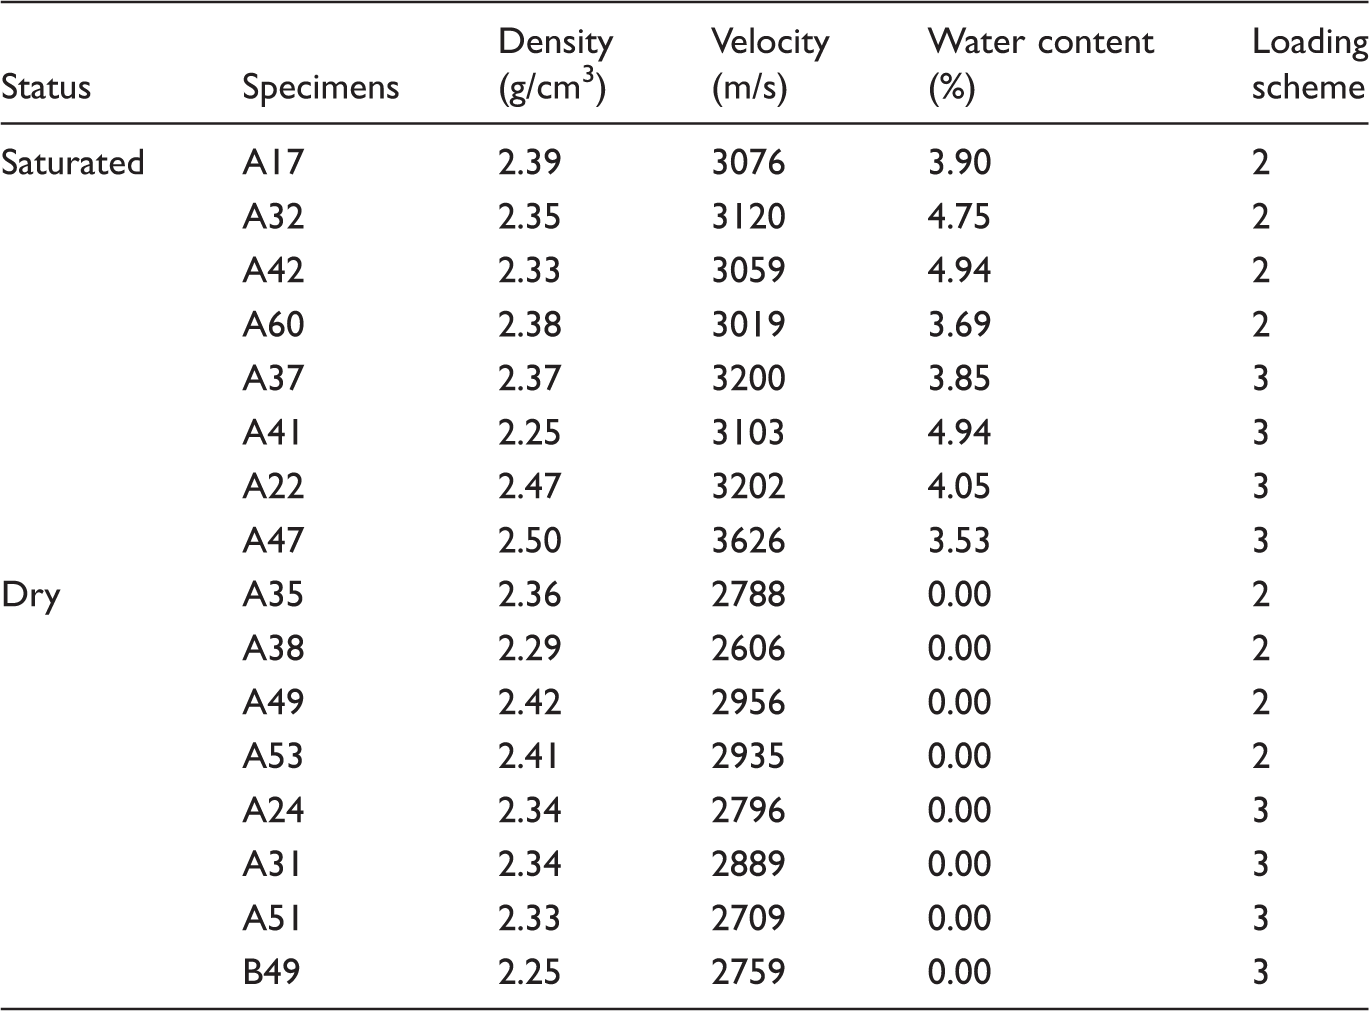
The specimens were classified into two groups according to the particle size, wave velocity, and density. The first group of specimens was kept in a drying chamber at 120℃ for 2 days to secure the specimens dry. And the second group of specimens was kept in a vacuum chamber immersed in water for 30 days to make the specimens saturated. All the experiments were conducted at room temperature (about 20℃).
Loading schemes
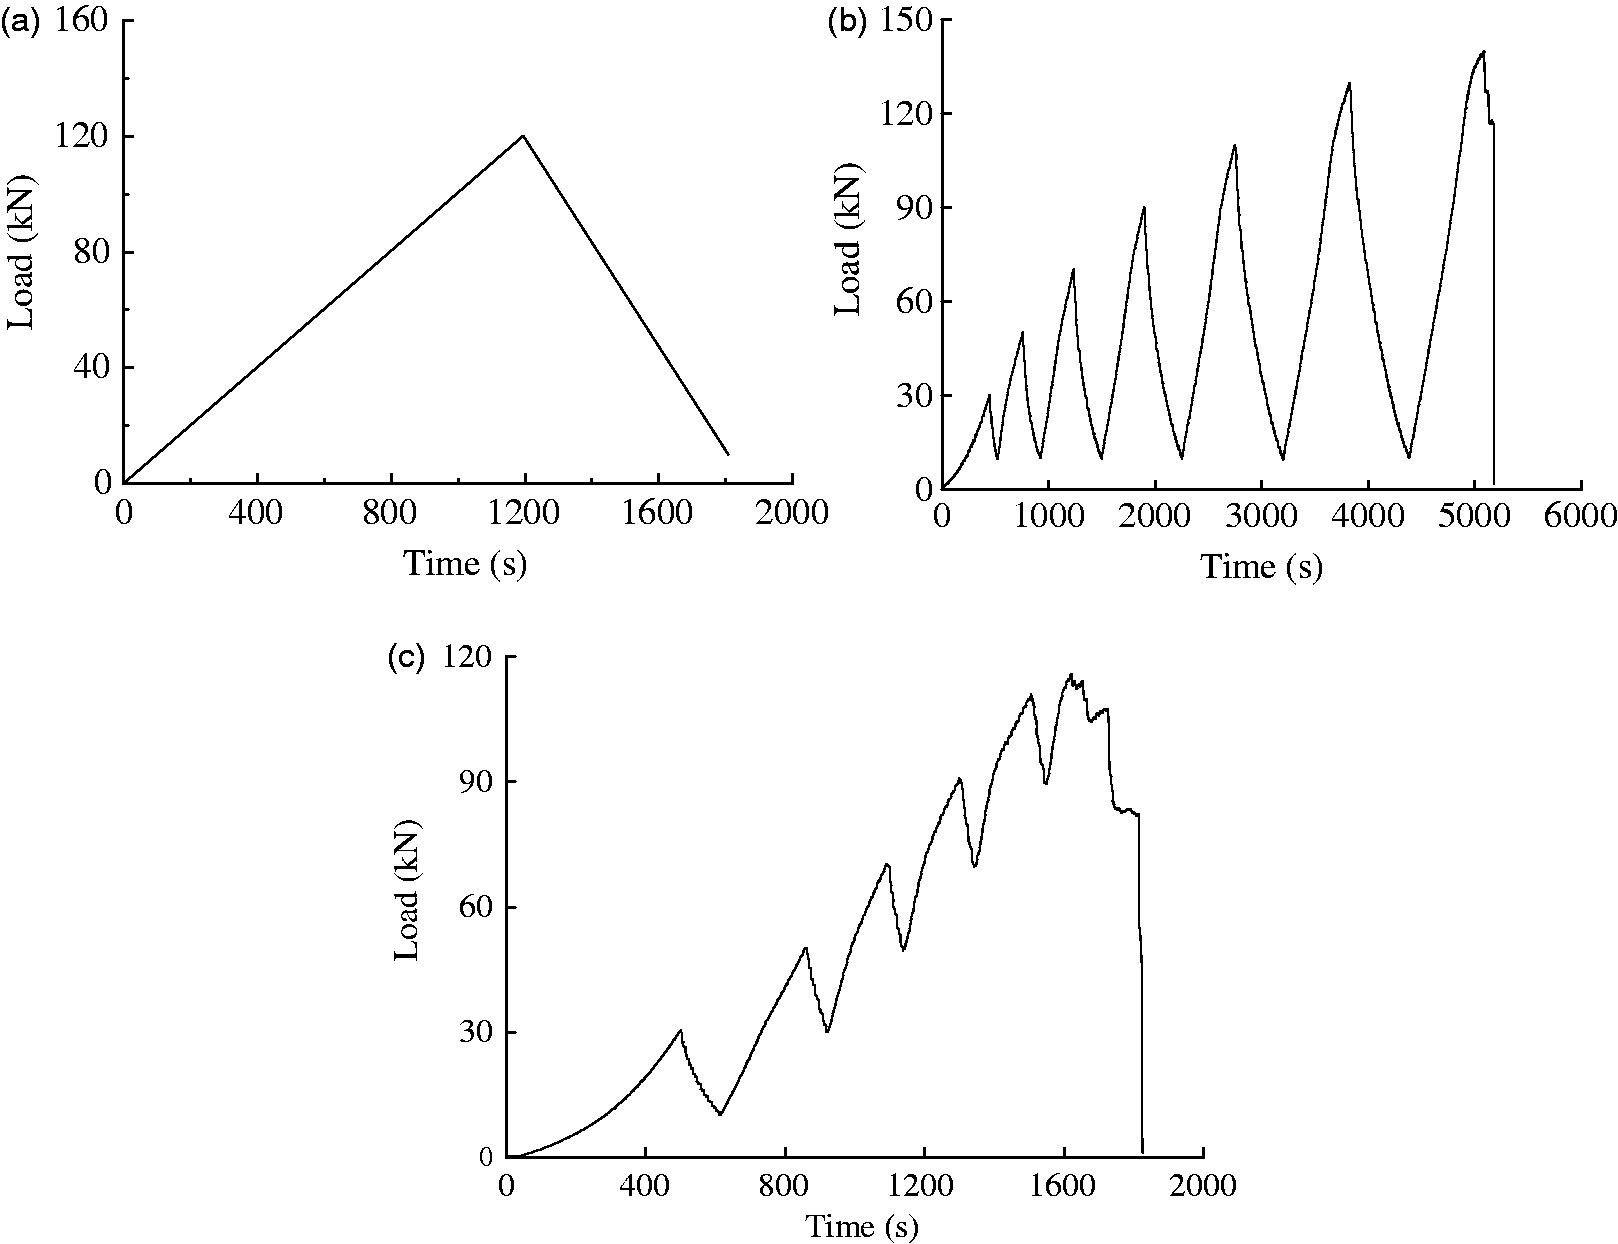
There are three loading schemes in the present study as shown in Figure 4. A loading speed of 0.001 mm/s in the axial direction is applied on the sandstone specimens in a displacement-controlled mode.
Unixial loading (Figure 4(a)) is used to analyze the water-weakening effect on the peak strength and deformation of the sandstone specimens. Interval incremental cyclic loading (Figure 4(b)) is used to study the accumulated dissipated energy variation of sandstone specimens during the loading process. Equal interval cyclic loading (Figure 4(c)) is used to study the dissipated energy generated in the sandstone specimens at different stress levels (dissipated energy generating ratio). Loading schemes: (a) uniaxial loading; (b) interval incremental cyclic loading (A53); (c) equal interval cyclic loading (A51).
Parameters of the sandstone specimens and loading schemes.
Strength and deformation properties of uniaxial loading
It is widely recognized that water is an obvious factor to weaken the strength and deformation of sedimentary rock (Erguler and Ulusay, 2009; Karakul and Ulusay, 2013). The rock mechanical parameters usually show discreteness because of the structure composition and cemented material. But the elastic wave can be used to predict the mechanical properties such as uniaxial strength, tensile strength, density, elastic modulus, and other parameters (Khandelwal and Ranjith, 2010; Khandelwal and Singh, 2009). Based on the theory that uniaxial strength and elastic modulus are linearly correlated with the wave velocity, the velocities have been measured to discuss the water-weakening effect on the sandstone specimens.
Figures 5 and 6 show the regression results of strength and elastic modulus with wave velocity. The velocities of some specimens are quite high because of the cemented material type and content. The more the calcium cemented content, the higher the wave velocity. The correlation coefficient of strength is between 0.7 and 0.9 and the correlation coefficient of elastic modulus is between 0.6 and 0.8. In order to evaluate the regression results, the F hypothesis testing has been used to examine the regression significant level. The verification principle is used where it is assumed that the two groups of testing data are randomly distributed and they do not show any linear relation. The F-value for the two groups of data is calculated as in equation (1), and then the F-value is compared with the F’-value in the testing distribution table. If the F-value is higher than F’, then the two groups of data are significantly correlative. During the F hypothesis testing, α = 0.05 (namely 95% confidence level) is chosen. The F and F’-values are shown in Table 2, all the F-values are higher than F’, so it can be concluded that the peak strength and elastic modulus of both dry and saturated specimens are significantly correlated with the wave velocity
The linear regression results of peak strength. The linear regression results of elastic modulus. The results of F hypothesis testing.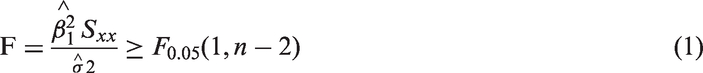
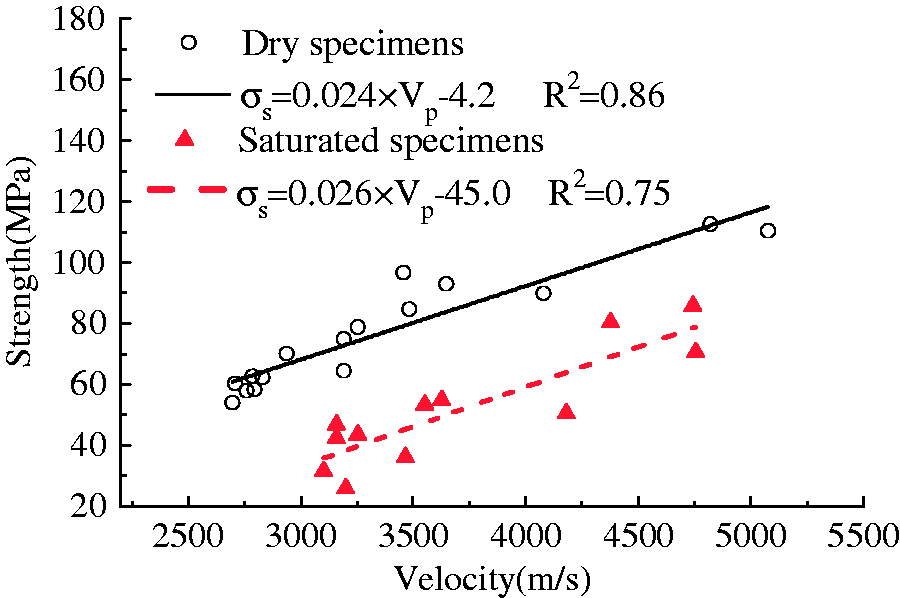
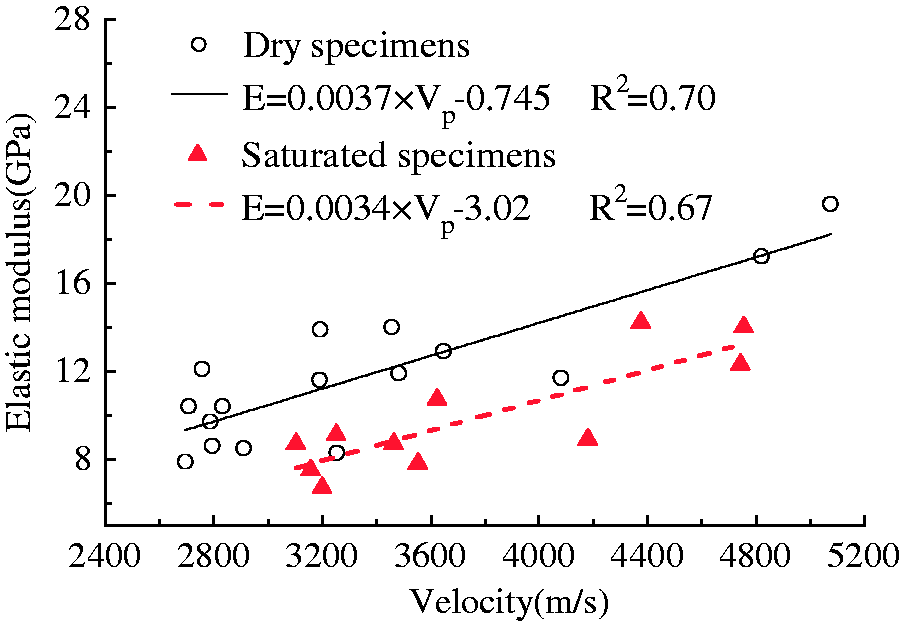
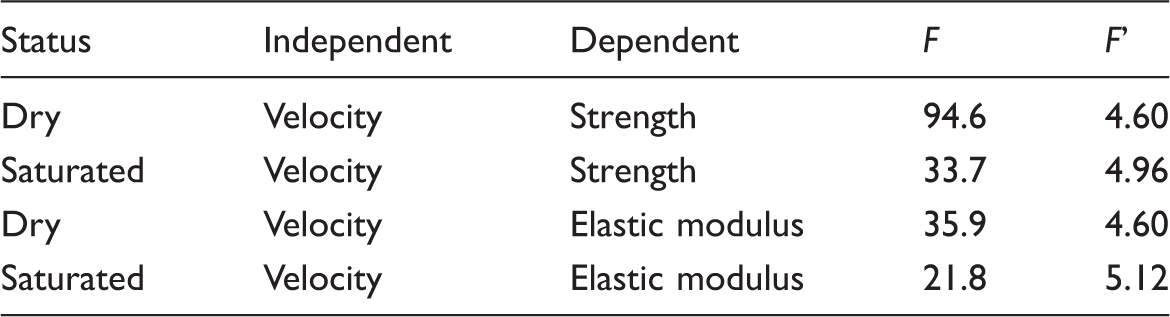
As shown in Figure 5, the strength fitting lines of dry and saturated specimens with wave velocity are approximately parallel, while the intercepts are significantly different, so it is indicated that the weakening effect caused by water weakening is the same for all specimens even though their velocities are different. The reduction of strength is almost 40 MPa, which is about 37–58% lower than that of the dry specimens. The fitting curves of elastic modulus are shown in Figure 6. The slopes of the two fitting lines are still nearly equal, but the intercept of water-bearing sandstone decreases by 2.3 GPa compared to the dry specimens. It means that the deformation increases by about 15.7–21% under the same stress level after being soaked in water.
In summary, the peak strength and elastic modulus of both dry and saturated sandstone specimens show a linear correlation with wave velocity, where the strength decreases remarkably and the deformability shows a slight increase after being immersed in water for 30 days.
Dissipated energy characteristic at different stress levels
The energy in the sandstone specimens transforms and releases continuously as the stress increases. For uniaxial loading experiment, the work done by loading system can be transformed to elastic energy and dissipated energy. The elastic energy can be released when the specimens are unloaded, and the dissipated energy contains plastic energy and inner damage energy. Furthermore, the plastic energy is the energy used for the permanent deformation, and the inner damage energy is the energy radiating outside in the form of AE, infrared, and other energies. The dissipated energy of dry and saturated specimens is different because of the water content status.
Figure 7 shows the stress–strain curves of the sandstone specimens under interval incremental cyclic loading (scheme 2, specimens ID: A53) and equal interval cyclic loading (scheme 3, specimens ID: A51). The dissipated energy can be obtained by calculating the area of the hysteresis loop in the stress–strain curves of the cyclic loading (Liu et al., 2016). The accumulated dissipated energy and dissipated energy generating ratio are respectively obtained by project 2 and 3.
Stress–strain curves of cyclic loading: (a) loading as project 2 (A53); (b) loading as project 3 (A51).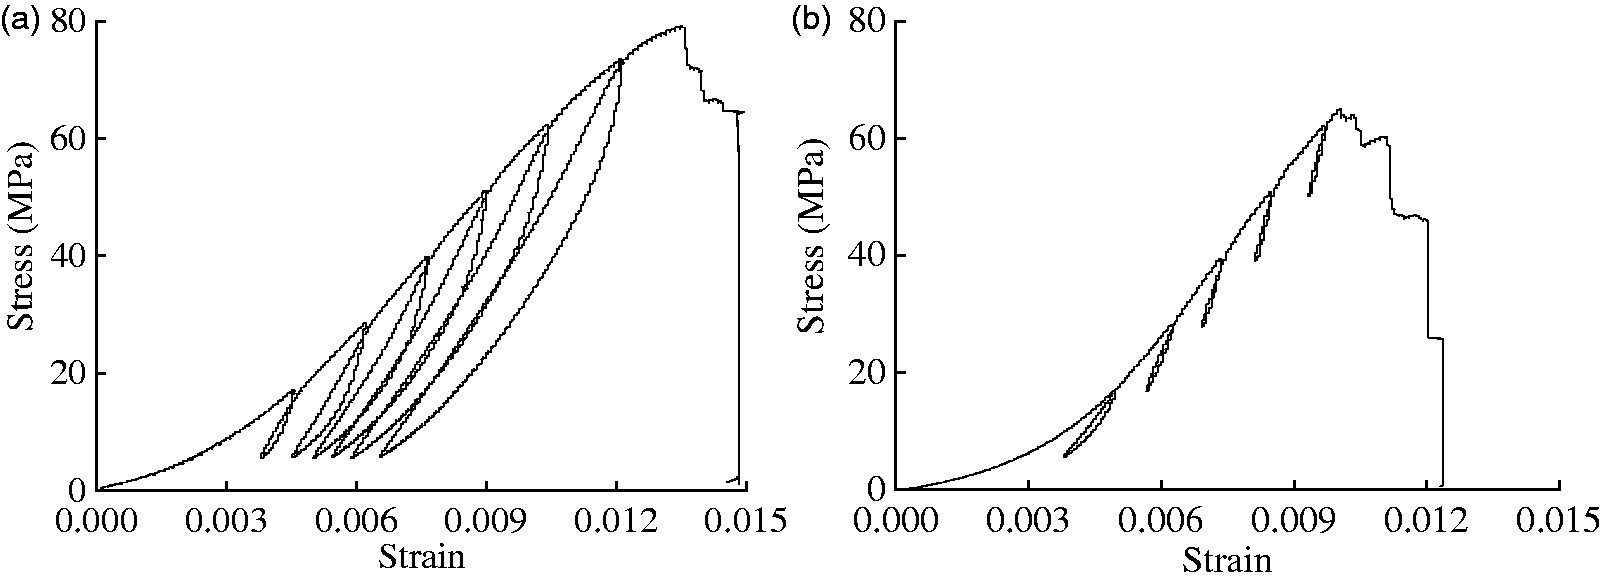
The variations of accumulated dissipated energy and dissipated energy generating ratio are shown in Figures 8 and 9. In order to avoid the accidental error, the mean value of dissipated energy is calculated to analyze the variations. In Figure 8, the increase of accumulated dissipated energy means the damage in the specimens grow obviously during the loading process, and the damage arrives at the maximum value when approaching failure. In Figure 9, the dissipated energy generating ratio decreases at first, because there are massive fractures and voids at low stress levels, and the dissipated energy is generated when fracture and void are closed. As the stress level increases, the specimens are in elastic stage with less induced damage, so the dissipated energy decreases gradually. When approaching failure, there is formation of the plastic stage and damage in the specimens increases again, so the dissipated energy increases. Dissipated energy generating ratio varies in the form of “U” shape, which is consistent with the study of Zhao et al. (2015).
Accumulated dissipated energy of different water content specimens. Dissipated energy generating ratio of different water content specimens.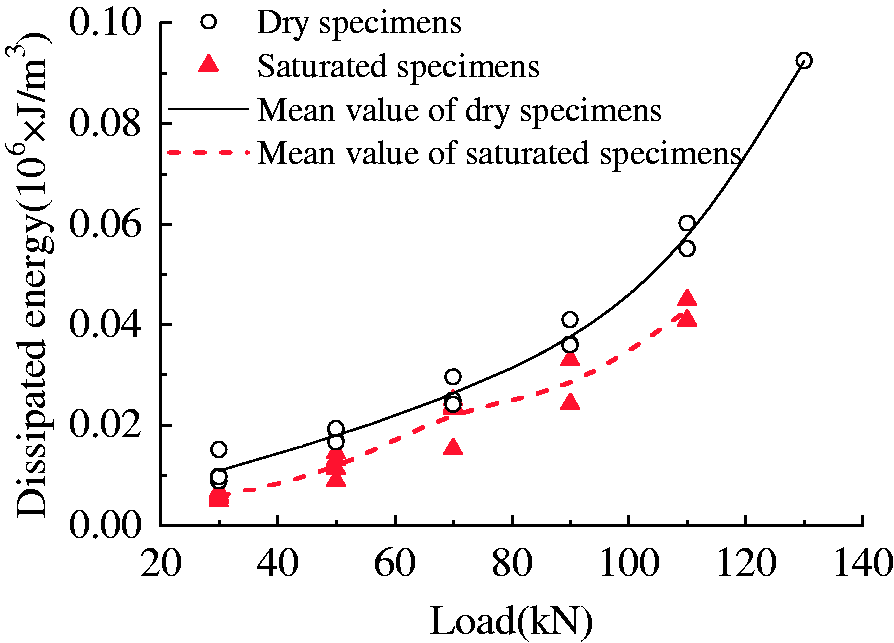
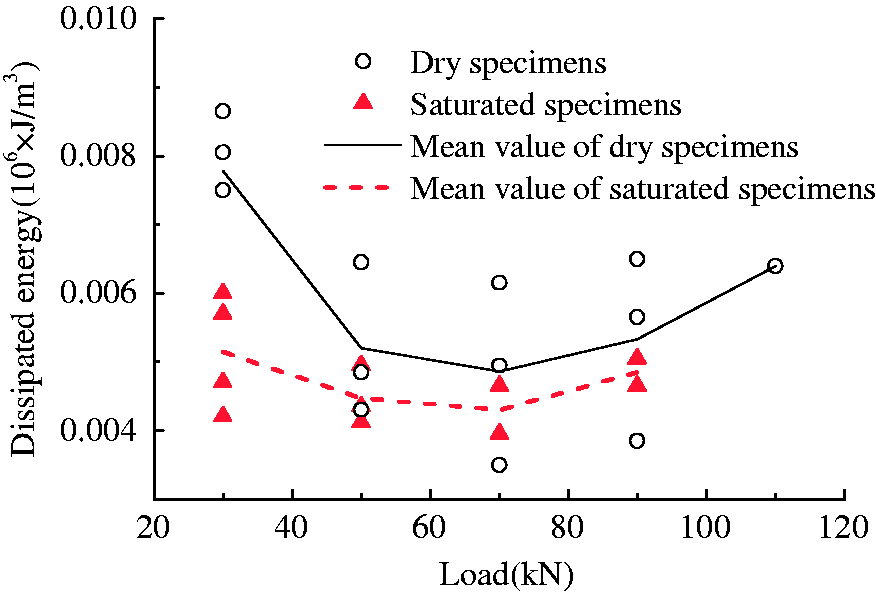
Moreover, it can be found in Figures 8 and 9 that the accumulated dissipated energy and dissipated energy generating ratio between dry and saturated specimens are obviously different. The accumulated dissipated energy and generating ratio of dry specimens are higher than those of the saturated ones. And as shown in Figures 5 and 6, it can be found that the strength and elastic modulus of the dry specimens are higher than those of the saturated specimens, which means that much more energy is released in the form of AE and thermal energy when the microcracks are generated in the dry specimens.
AE accelerating energy release characteristics
It can be concluded from the above analysis that water content has a significant effect on the dissipated energy in sandstone specimens during the loading process. However, the dissipated energy can be divided into elastic wave (AE), thermal (infrared radiation) (Zhang et al., 2014), electric energy (for piezoelectric material), and any other form of energy. In this part, we further discuss the AE energy according to the theory of accelerating energy release.
The distribution of mineral strength is in accordance with the Weibull’s distribution because of the existing heterogeneity such as mineral compositions, joints, fractures, and weak planes. As the stress level increases, the minerals with low strength will fail first, and correspondingly AE events occur simultaneously (Fang and Harrison, 2002; Tang, 1997). During the whole loading process, the AE energy shows a typical sharp increase as shown in Figure 10, a breakpoint interval is set on the vertical axis at AE blank space namely at 5 × 10⁴ to 18 × 104 in this figure.
AE energy generated in the whole loading process.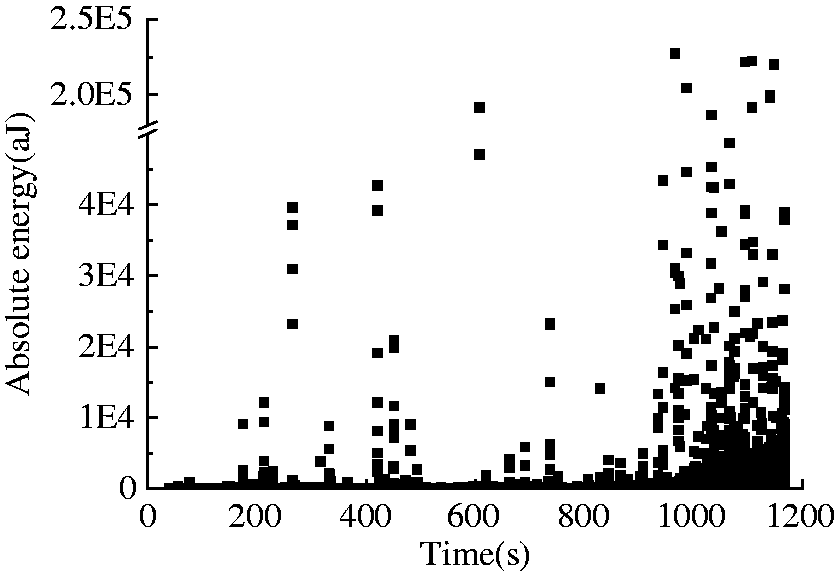
As shown in Figure 10, the release of AE energy is unsteady with nonuniform speeds, so the accelerating energy release theory is often used to depict the releasing speed of the AE energy, and the accumulated energy E(tk) recorded at tk is

The accumulated AE energy is fitted by a power-law function
During the fitting process of the energy release, z-value is always smaller than 1 and reveals the accelerating degree of the energy release. The smaller the z-value, the steeper the curve of the accumulated AE energy, indicating the AE energy release at a faster speed and in a more sudden fracture model (Yin et al., 2000; Zhang et al., 2004).
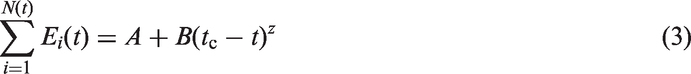
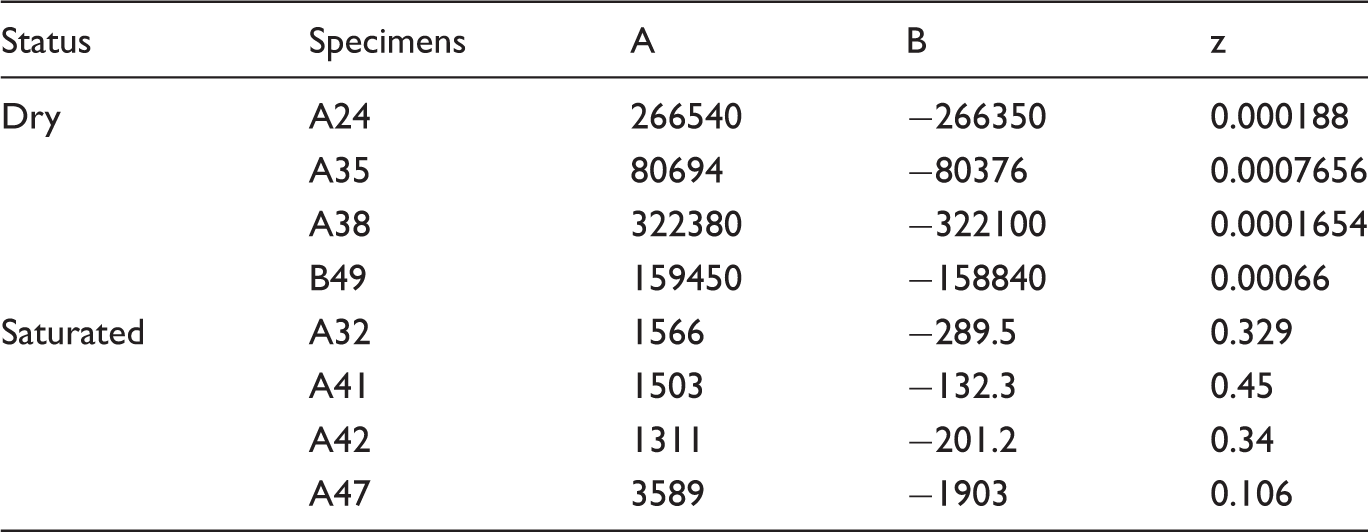
In this part, the specimens with different water contents are used to study the accelerating release speed of AE energy. The AE energy accelerating release fitting curves of dry and saturated specimens are shown in Figures 11 and 12, and the left curves are the accumulated AE energy and the right curves are the AE hit numbers with time. The fitting parameters are shown in Table 3, where A and B are position adjusting parameters, and z-value reflects the energy accelerating release speed. From the fitting curves, it can be found that the z-values of the dry specimens are much smaller than those of the saturated specimens. It illustrates that the dry specimens release AE energy at a sudden increasing speed with a centralized rupture form when approaching failure, but the saturated specimens releases energy in a progressive way. Furthermore, the right graphs of Figures 11 and 12 show that the number of AE events in dry specimens increase monotonically with only one maximum at the peak strength, but the AE events of saturated specimens release in a progressive and asymptotic way, where there are several approximate maximum values occurring near the peak strength.
The variation of AE events of dry specimens. The variation of AE events of saturated specimens. Fitting parameters of accelerating energy release.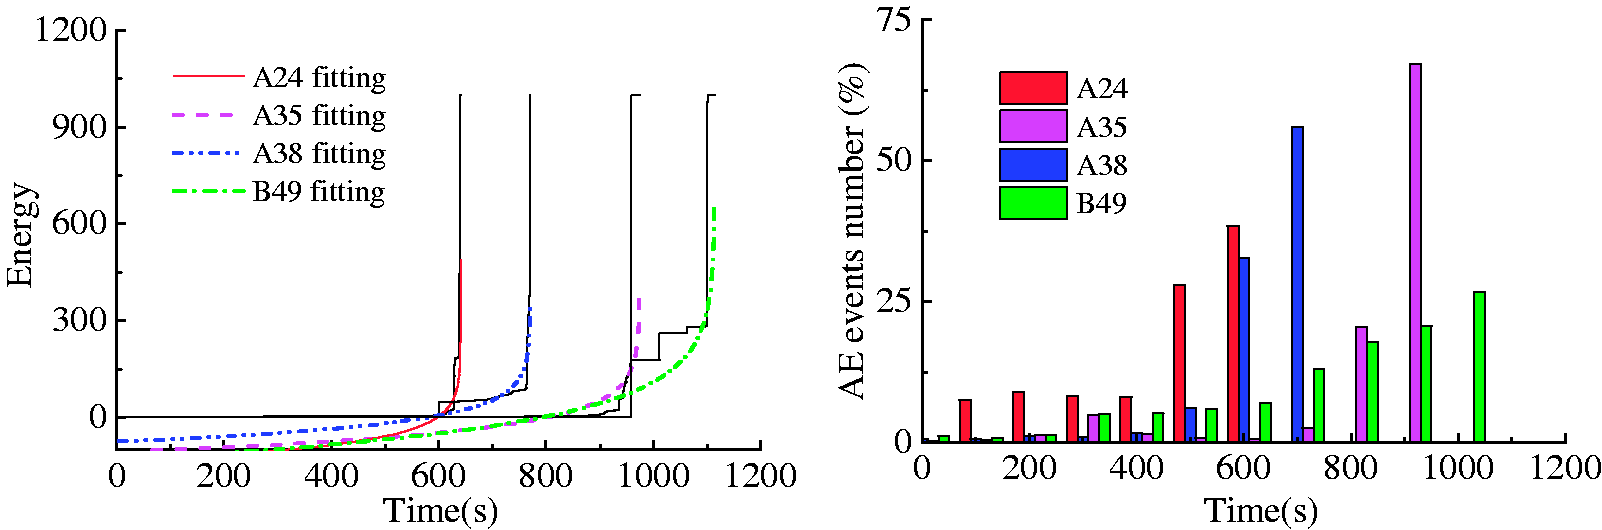
Probability density distribution of AE energy
The accelerating energy release theory reflects the energy release characteristics in the whole loading process, in order to analyze the AE energy characteristic at different stress levels, where the mathematical statistics method of normal distribution is used to fit the energy distribution. The process is conducted as the following: (1) the frequencies of different energy scales (absolute energy being taken logarithm function) in a certain stress stage are counted; (2) frequency distributions are fitted by the following normal distribution equation (4); (3) the characteristic parameters including expectation μ and standard deviation σ are obtained; (4) the variations of expectation and standard deviation have been analyzed with the stress level.

With the purpose of discussing variation of AE energy at different stress levels, the whole loading process is divided into 25 stress levels. The fitting curves of specimen B49 are shown in Figure 13, and it can be found that the frequency distributions are consistent with the normal distribution, especially at medium and high stress levels.
Normal distribution fitting results of AE energy at different stress levels.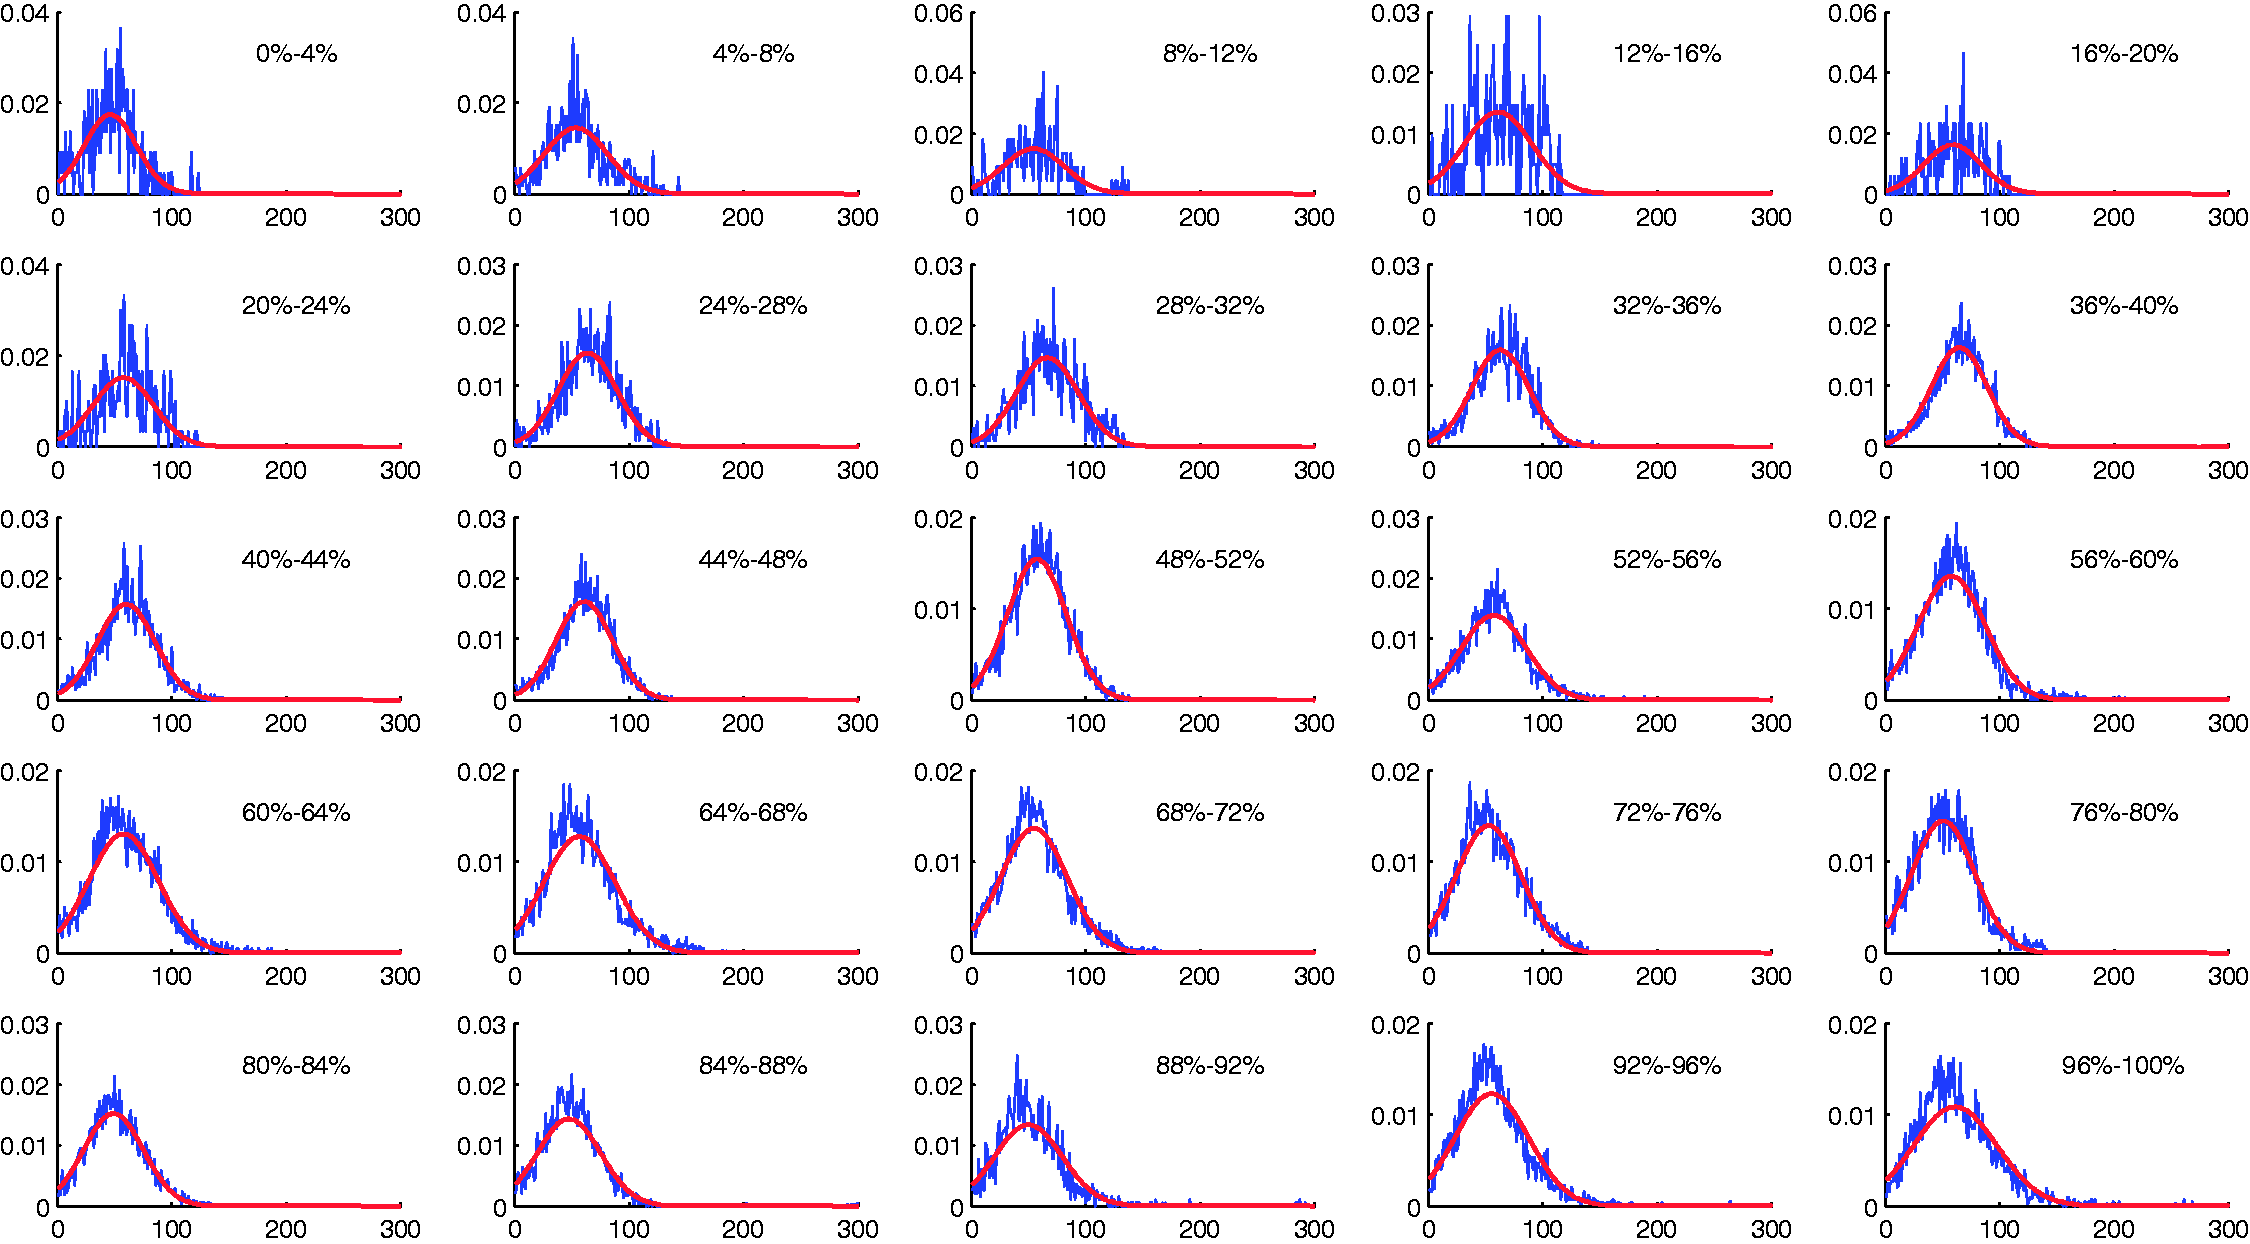
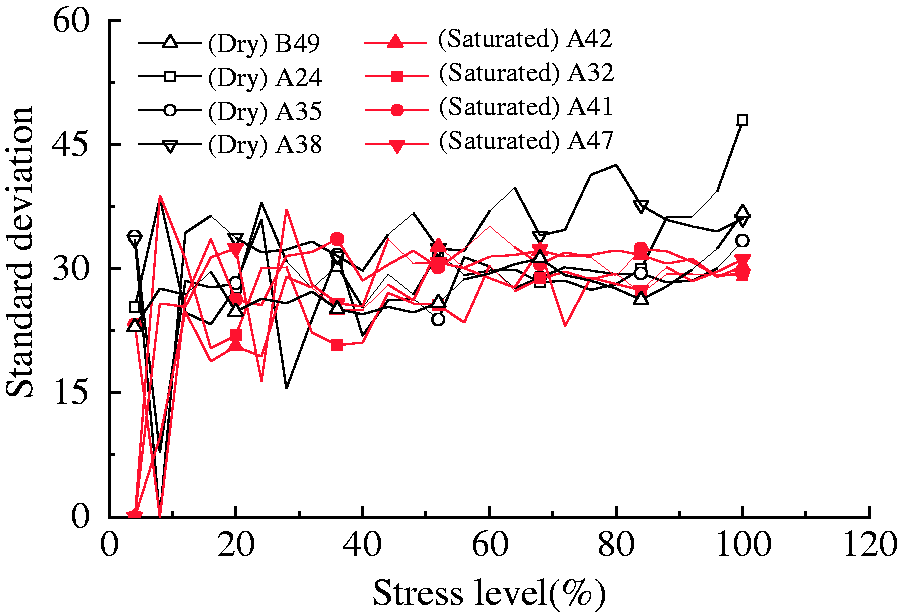
The expectation and standard deviation are obtained from each fitting curve of the energy density distribution. As shown in Figure 14, the expectations of dry specimens are higher than those of the saturated specimens generally, and the energy expectation shows a slight increasing trend when approaching peak strength, but the energy expectations of saturated specimens do not show an obvious increase in trend. In Figure 15, the standard deviations of the dry specimens do not show great difference with the saturated specimens, and the standard deviations of both dry and saturated specimens do not show a significant increasing trend. It can be concluded that the effect of water weakening on the AE energy distribution is mainly shown on the parameter of expectation, and not on the standard deviation. Compared with the saturated specimens, the AE energy of dry specimens released during the loading process are generally larger AE events. Moreover, the difference of AE events energy scale between dry and saturated specimens becomes more significant as the stress level increases.
Comparison of AE energy expectations of dry and saturated status. Comparison of AE energy standard deviation of dry and saturated status.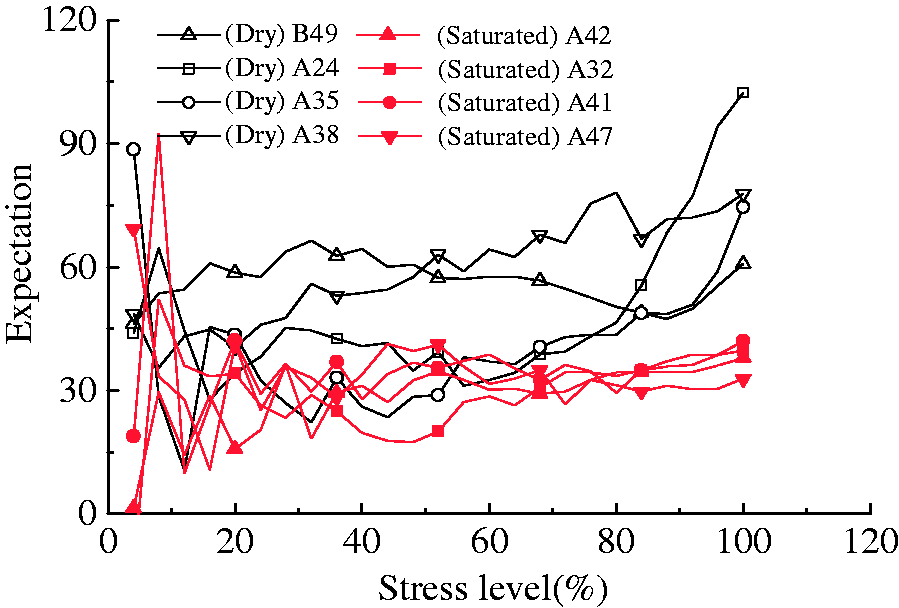
The expectation represents the mean energy scale, and the standard deviation represents the dispersed degree of the AE energy. Here, the variations of expectation and standard deviation are further discussed. As shown in Figure 16, as the stress level increases, the expectation of specimen A35 shows a fluctuant and a stable increasing trend, but the standard deviation shows smoother variation compared with the expectation. It means that during the loading process, the shapes of the energy distribution curves do not change too much, but positions of the fitting curves will change due to the change in expectation, implying that the AE events produced at different stress levels are quite different in magnitude. Moreover, the loading process can be divided into three stages: in compression phase (before 20% peak strength) the expectation of AE energy shows fluctuation due to initial fracture and crack closure; and in the elastic stage (stress level between 20% to 80% peak strength) the damage produced is quite stable, so the energy expectation varies slightly; when approaching failure (after 80% peak strength) much more damage occurs, and the expectation shows a clear increasing trend, where this result is consistent with the study of Liu et al. (2012). So the AE energy distribution can be used to reflect the stress level and damage degree.
Variations of expectations and standard deviations at different stress levels.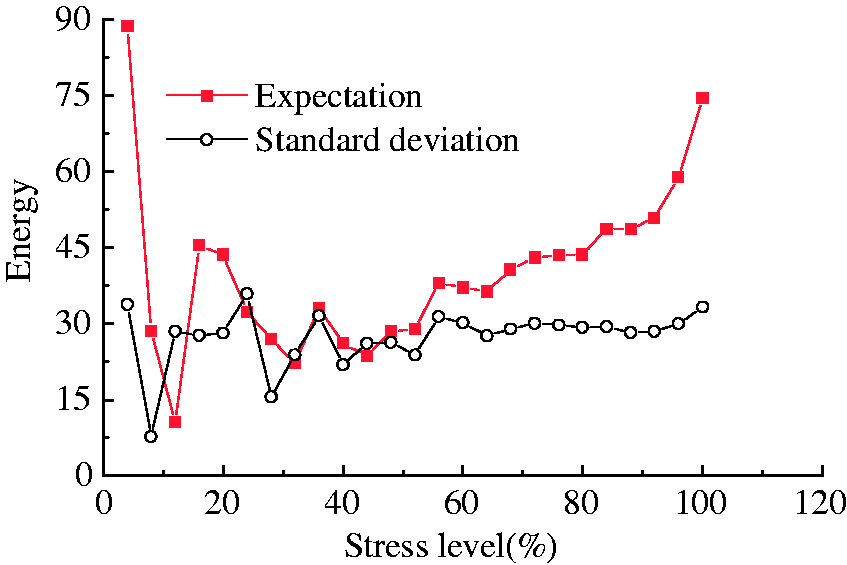
Conclusions
The uniaxial loading and cyclic loading experiments of dry and saturated calcium argillaceous cemented sandstone were conducted, and the strength and deformation characteristics were analyzed. Furthermore, the dissipated energy and the AE energy generated at different stress levels were studied according to the accelerating release theory and probability distribution. The following conclusions are drawn based on the study:
The strength and elastic modulus of dry and saturated specimens are both linearly correlated with the wave velocity, and the water content shows significant effect on the strength and deformation of sandstone. The strength and elastic modulus of saturated specimens are 37–58% and 15.7–21% lower than those of the dry specimens, respectively. During the cyclic loading process, the accumulated dissipated energy of both dry and saturated specimens increases remarkably, and the dissipated energy generating ratio varies as “U” shape. As a result of the water content, the saturated specimens produce less dissipated energy compared to the dry specimens. AE energy, as a part of the dissipated energy, shows accelerating release characteristics, and AE energy of dry specimens usually release in a sharp and centralized form, but the AE energy of the saturated specimens usually release in a progressive and distributed form. Moreover, the AE numbers of dry specimens show a sudden increasing trend and the maximums of AE numbers usually occur at the peak strength. However, the AE numbers of the saturated specimens show multiple approximate maximums nearing the peak strength. The AE energy scale is consistent with the normal density distribution, where the energy expectations are quite related to the water contents, but the standard deviations are not greatly affected by the water content. The expectations of the dry specimens are generally higher than those of the saturated specimens. When the stress level is approaching the peak strength, the expectations of dry specimens show an obvious increasing trend, but the expectations of saturated specimens just show a stable variation. Compared to the saturated specimens, the dry specimens under uniaxial loading condition usually fail with some larger AE events occurring in view of the statistic method.
Footnotes
Declaration of Conflicting Interests
The author(s) declared no potential conflicts of interest with respect to the research, authorship, and/or publication of this article.
Funding
The author(s) disclosed receipt of the following financial support for the research, authorship, and/or publication of this article: The work was supported by the National Basic Research Program of China (2013CB227902), the National Natural Science Foundation of China (51474051, 41672301), and Fundamental Research Funds for the Central Universities (N150106002).