
Abstract
Above-deck car-bomb attacks cause significant effects on engineering structures from those of explosive blasts in the free air. In this paper, a post-disaster investigation for an existing bridge under above-deck car-bomb blast loading is presented. The crack distribution and damage deformation of the blast loaded girders are systematically investigated, and the blast effect zone is proposed to describe the blast loading distributions on girders and to characterize the girder structural behavior. The girder failure is dominated by one of the three typical damage mechanisms: shear, flexural-shear, and flexural, depending on the blast effect zone where the girder is located. The study also indicates that the isolation effect of the vehicle can significantly affect the blast loading distribution on structures, even though the isolation effect is localized in a region with a small standoff distance. It is gradually attenuated by the increase of the standoff distance. Numerical analysis is conducted to verify the findings by simulating the truck isolation effect with a steel plate.
Introduction
In recent years, with the increase in accidental and violent blast events through the world, the importance of protecting the public transportation infrastructure, especially bridges, from blast collapse has become increasingly significant since bridge collapse may result in massive loss of life and injuries, as well as social and economic catastrophe. However, the current engineering design codes have almost no specific provisions or guidelines for blast protection of bridges. (ASCE, 1997; ASCE/SEI, 2002; CEN, 2006; FEMA, 2003a,b; Mays and Smith, 1995). The bridge design codes have only general and limited guidelines for progressive collapse prevention after blasts. It poses considerable challenges for bridge engineers to design a bridge withstanding blast loads largely due to the lack of necessary training to understand the fundamental principles of the blast wave propagation and its potential effect on bridge structures.
Studies of bridges subjected to blast loading are very rare compared with the studies of buildings. Williamson and Winget (2005) discussed blast effect on bridge components, and outlined a procedure for design and retrofit of bridge for security. A conclusion that bridge geometry and clearance could significantly affect the below-deck blast loads was made by Winget et al. (2005). Hu et al. (2016) investigated dynamic response for concrete piers under close-in blasts and found that the longitudinal rebar arrangements for the pier body determined its failure-mode. Experimental and computational research efforts were carried out to understand the behavior of blast-loaded concrete bridge columns (Williams and Williamson, 2011; Williamson et al., 2011a,b). The design parameters, like column cross-sectional shape, that most significantly influence the performance of blast-loaded-reinforced concrete bridge columns were identified, and results from this research were used to establish design guidelines that can be used to help improve the performance of bridge columns subjected to blast threats. Fujikura et al. (2008) and Fujikura and Bruneau (2011) conducted blast testing on ¼-scale concrete-filled steel tubular (CFST) columns, ductile-reinforced concrete (RC) columns, and non-ductile RC columns retrofitted with steel jacketing. A moment-direct shear interaction model was proposed to account for the reduction of direct shear resistance on cross sections when large moments were simultaneously applied. The seismically designed RC and steel jacketed RC columns were shown to be ineffective for the blast loading cases considered. More recently, a series of field tests, organized by a US National Cooperation Highway Research Program (NCHRP), on the blast loaded seismically designed columns, have yielded the design guidelines (NCHRP, 2010).
In contrast to the bridge substructure, the published research on the response prediction and protection of bridge superstructures under near-field blast loads are even more limited. Ibrahim et al. (2011) and Ibrahim and Salim (2013) employed both an artificial neural network method and a numerical model to predict the damage (spalling/cratering) size in a concrete deck under blast loading and the corresponding dynamic response of the damaged bridge system. Selected parameters of the analysis were the charge weight, standoff distance, charge locations, steel grade, and concrete compressive strength. The results indicated that the steel grade did not significantly affect the damage mechanism. Tai et al. (2011) conducted a numerical simulation of a free-field explosion model to investigate reinforced concrete slabs with consideration of destruction and influencing factors including the amount of explosives, the distance from the explosives to the RC slab, and the concrete slab reinforcement ratio. The performance of cable-supported bridge decks subjected to blast loads was conducted by Son (2008), who studied the behavior of steel orthotropic and composite plate girder decks subjected to blast loading. The dynamic response and damage prediction of cable-stayed bridges under blast loading were recently simulated by Hao and Tang (2010) and Tang and Hao (2010). The simulation results focused on the damage size prediction of four main bridge components (i.e. pier, tower, and back and main span decks).
Numerical simulation is one of the most effective methods for blast analysis and has definitely made great contributions to blast-resistant analysis for bridge structures. However, such simulation of blast loading is highly sensitive to the nature of the explosive material, the mesh quality and the nonlinearity associated with RC structures (Pan et al., 2013; Tai et al., 2011). Hence, experimental validation is necessary to ensure the reliability and applicability for numerical simulation of blast loading.
A number of tests, in characterizing the dynamic responses of the blast-loaded bridge structures, have been carried out by a number of governmental and academic organizations. Wang et al. (2012) addressed the scaling of the dynamic response of one-way square RC slabs subjected to close-in blast loadings caused by mass detonation. Foglar and Kovar (2013) presented results of the field experiments of 0.3 m × 1.5 m × 6 m precast slabs. The experiments focused on the effect of fibers, concrete compressive strength and its combination on blast performance of concrete. Their results show that combination of fibers and increased compressive strength proved itself to be very effective for improving the blast performance. Cofer et al. (2012) validated a finite element model of a precast and prestressed concrete girder on 6 m long specimen with above or below girder blast loading. The girder model was further expanded to a four-girder, simple-span bridge model. Three different scenarios were examined at the mid-span of the bridge: a blast between two girders above the deck, a blast centered on a girder above the deck, and a blast beneath the deck. The two load cases from above resulted in highly localized damage with the possibility for other sections of the bridge to be immediately reopened after the event. Results for the load case from below indicated that the slab would be heavily damaged but the girders will remain intact.
Pan et al. (2013) modeled a 24 -m single-span RC composite steel slab-on-girder bridge system with a multi-Euler domain method to study the blast-resistant capacity. Three different detonation scenarios were investigated, including 100 kg of TNT to model a medium-scale explosion above and below the deck and a 10-kg hand-placed bomb to model a small-scale explosion below the deck. It is noted that more investigations are required to achieve a more systematic and comprehensive scheme to counter the threat to critical infrastructures in the future.
Both numerical and experimental efforts have come up with a number of valuable recommendations in designing and retrofitting blast-loaded bridges. However, all research efforts mainly focus on single components like girders, slabs and columns. Few studies have taken the whole bridge or deck system into account, which will inevitably cause the difference of wave propagation and structural responses from scenarios of single components. The structural behavior and damage of existing bridges in blast events are rarely reported due to social concerns and lacking field data. In addition, few current studies have focused on the isolation effect of vehicles in car-bomb blast. The objective of this paper is to identify the blast effects on bridge girders with consideration of isolation effect of the truck for above-deck detonation by performing a post-disaster investigation on an accidental blast loaded bridge, and to characterize the blast load distribution and relationship between typical deformations and scaled distances for the bridge girders with the proposed concept of blast effect zone (BEZ), which can be significant for dynamic response prediction for the bridge structural system under blast loading. The results can be applicable to determine the essential blast-resistant design criteria to reduce the probability of blast-induced failures.
Structural damage analysis
Post-disaster field ınspection
The bridge under consideration is the existing Fengxingpai Bridge, a twin bridge system with a 2-meter gap between the north and the south bridges, in China (Hu et al., 2017). The design live load was Car-super 20, which consists of a 55-ton (550 kN) heavy truck accompanied by four 20-ton (200 kN) trucks arranged at 15-meter intervals. The verification live load was Trailer-120, which consisted of a pair of 60-tons (600 kN) tandem spaced 4-meter apart with total weight 120-tons (1200 kN). The designed earthquake intensity was level of 6 (Kramer, 1996). The General Plan is shown in Figure 1. The key parameters of the bridge are summarized in Table 1. On 22 August 2009, a truck that were fully loaded with firework exploded on the deck of the Fengxingpai Bridge, causing severe local damage and collapse of girders. Under the support of the Innovative Funding Program, the post disaster investigations were carried out for this accidental explosion. The accidental explosion, occurred on the 4th span center of the south bridge deck, was roughly located at the position above girders 10 and 11, as shown in Figure 1 (referred to Figure 4 for the girder layout). The truck with fireworks was totally destroyed and a neighboring truck was also heavily destroyed with the bridge deck severely damaged, as shown in Figures 2 and 3.
General plan of the bridge. Summary of existing bridge data. Blast-destroyed truck. Collapse of exterior girder (Girder 1). Damage on bridge soffits in 4th span.
Damage of bridge superstructure
According to field inspection, it was found that all severe damage was taken place in the 4th span of the south bridge, including collapse, extensive cracking, and large permanent deformation. The exterior girder was ruptured, shown in Figure 3, which caused the failure of the exterior shear keys at bent 4 and abutment 5. Both Figures 3 and 4 indicate that the blast loading produced very large permanent deformations on the structure, which caused flexural plastic hinges at midspan of Girders 2 and 3, respectively. Figure 5 depicts the girder layout and re-produced crack distribution on the bridge soffit, as shown in Figure 4. The crack widths are also denoted digitally with the unit of mm in Figure 5. The maximum crack width reached 14 mm and 10 mm on Girder 2 and Girder 3, respectively. Massive cracks were found on the soffits of Girders 4 through 8 with distributions along the whole length of the girders and a maximum opening of 3 mm that far exceeds the maximum allowed crack width specified by the design code (CTM, 1989). For Girder 9 and Girder 10, no visible crack was found in the central portion except for the regions near the supporting ends where shear cracks were found on both the side surfaces and the soffits of the girders, as shown in Figures 4 and 6. Web-shear cracks, as shown in Figure 7, were found on the web of Girder 11 near the support with the remove of Girder 10.
Girder layout and crack distribution on bridge soffit (Re-produced from field measurement). Shear cracks on (a) Girder 9 and (b) Girder10 near supports. Web-shear cracks on Girder 11.
It is noted that no damage was detected on the north bridge, which is separated by only a 2-meter gap from the south bridge. It is likely that the shock wave was dissipated by the gap between the two bridges, which significantly reduced blast effect on the north bridge.
BEZ and loadings on girders
According to the crack distributions on the bridge soffit, and on the side surfaces of the girders, shown in Figures 4 to 7, it is obvious that Girders 2 and 3 were both damaged with flexural plastic hinges at midspan, while the damage of Girders 9 and 10 was dominated with shear cracks near the support ends. In order to understand the damage features of the remained girders according to the crack distribution on the girder soffits (Girders 11 and 12 are out of consideration since no visible crack was found on their soffits), each girder is longitudinally divided into 20 segments with an equal length of 1 m. In each segment, the representation of crack condition is characterized by one typical crack that is identified according to both maximum opening width and distribution. According to the crack properties, the two quarter-points of the span are set as the watershed between flexural failure and shear failure (Collins, 1990), and then three regions, two for shear failure and one for flexural failure, are obtained for each girder. Figure 8 presents the typical crack distribution in different regions, i.e. in shear region 1 (0–5 m), shear region 2 (15–20 m), and flexural region (5–15 m), respectively. It is noted that the curves in Figure 8 were fitted with respect to average values of crack width. Both Figure 8(a) and (b) indicate the similar shear-cracking tendency that the severity of shear cracking undergoes an accrual from Girder 2 to the middle girders and a decrease happens after the girder (Girder 7) reaches the most severe shear damage. The first increasing parts, as shown in Figure 8(a) and (b), can be explained with the fact that the blast load decays with the increase of standoff distance, and the latter decrease parts may be resulted from the isolation effect of the truck, which will be discussed in detail in the subsequent section. Figure 8(c) presents the flexural cracking tendency for the mid-span of the deck. It is clear that the flexural damage becomes much more severe as the standoff distance increases. This is inconsistent with the common knowledge for structural response under blast loading and can only be explained with the fact that the isolation effect of car bombs plays important roles in above-deck detonations.
Crack distributions: (a) typical crack distribution for shear region 1 (0–5 m); (b) typical crack distribution for shear region 2 (15–20 m); and (c) typical crack distribution for flexural region (5–15 m).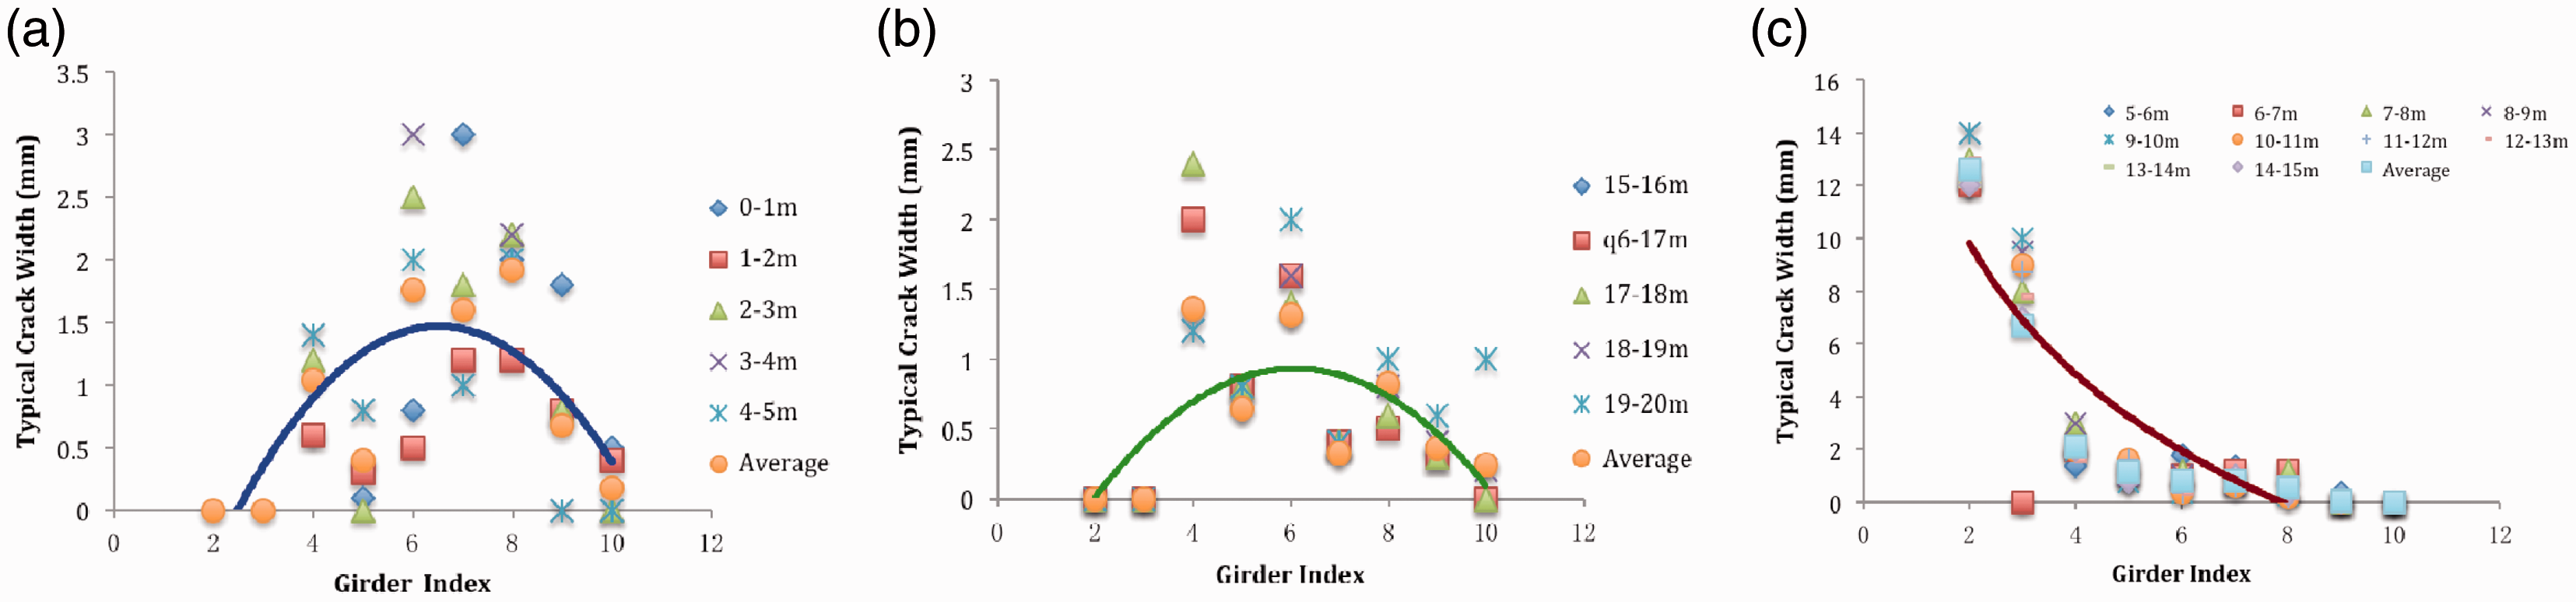
The widths of 20 typical cracks of each girder are generalized to study the failure modes of the girders because each typical crack represents the contribution of the cracking in the corresponding sub-region of the girder. Figure 9 displays the results of the maximum crack width generalization for Girders 4–8 with the longitudinal distances as the values of the x-axis. It is clear that the flexural failure is predominant for Girder 4 while shear failure begins to occur because, unlike Girders 2 and 3, cracks and damage are found at the shear failure regions. Compared to Girder 4, Girder 5 shows the same failure mode but the shear failure portion is increased slightly with some reduction of the flexural failure portion, and damage to both support end portions is observed. When the standoff distance becomes smaller, like Girders 6–8, however, shear cracks show more significant contribution to the failure than flexural cracks. In addition, no flexural crack but shear cracks are found on Girders 9–11. Therefore, it can be concluded that with the increasing of the standoff distance from the detonation point, the cracking types and failure modes for the reinforced concrete girders begin to change from shear failure dominated to flexural failure dominated.
Generalized crack distribution.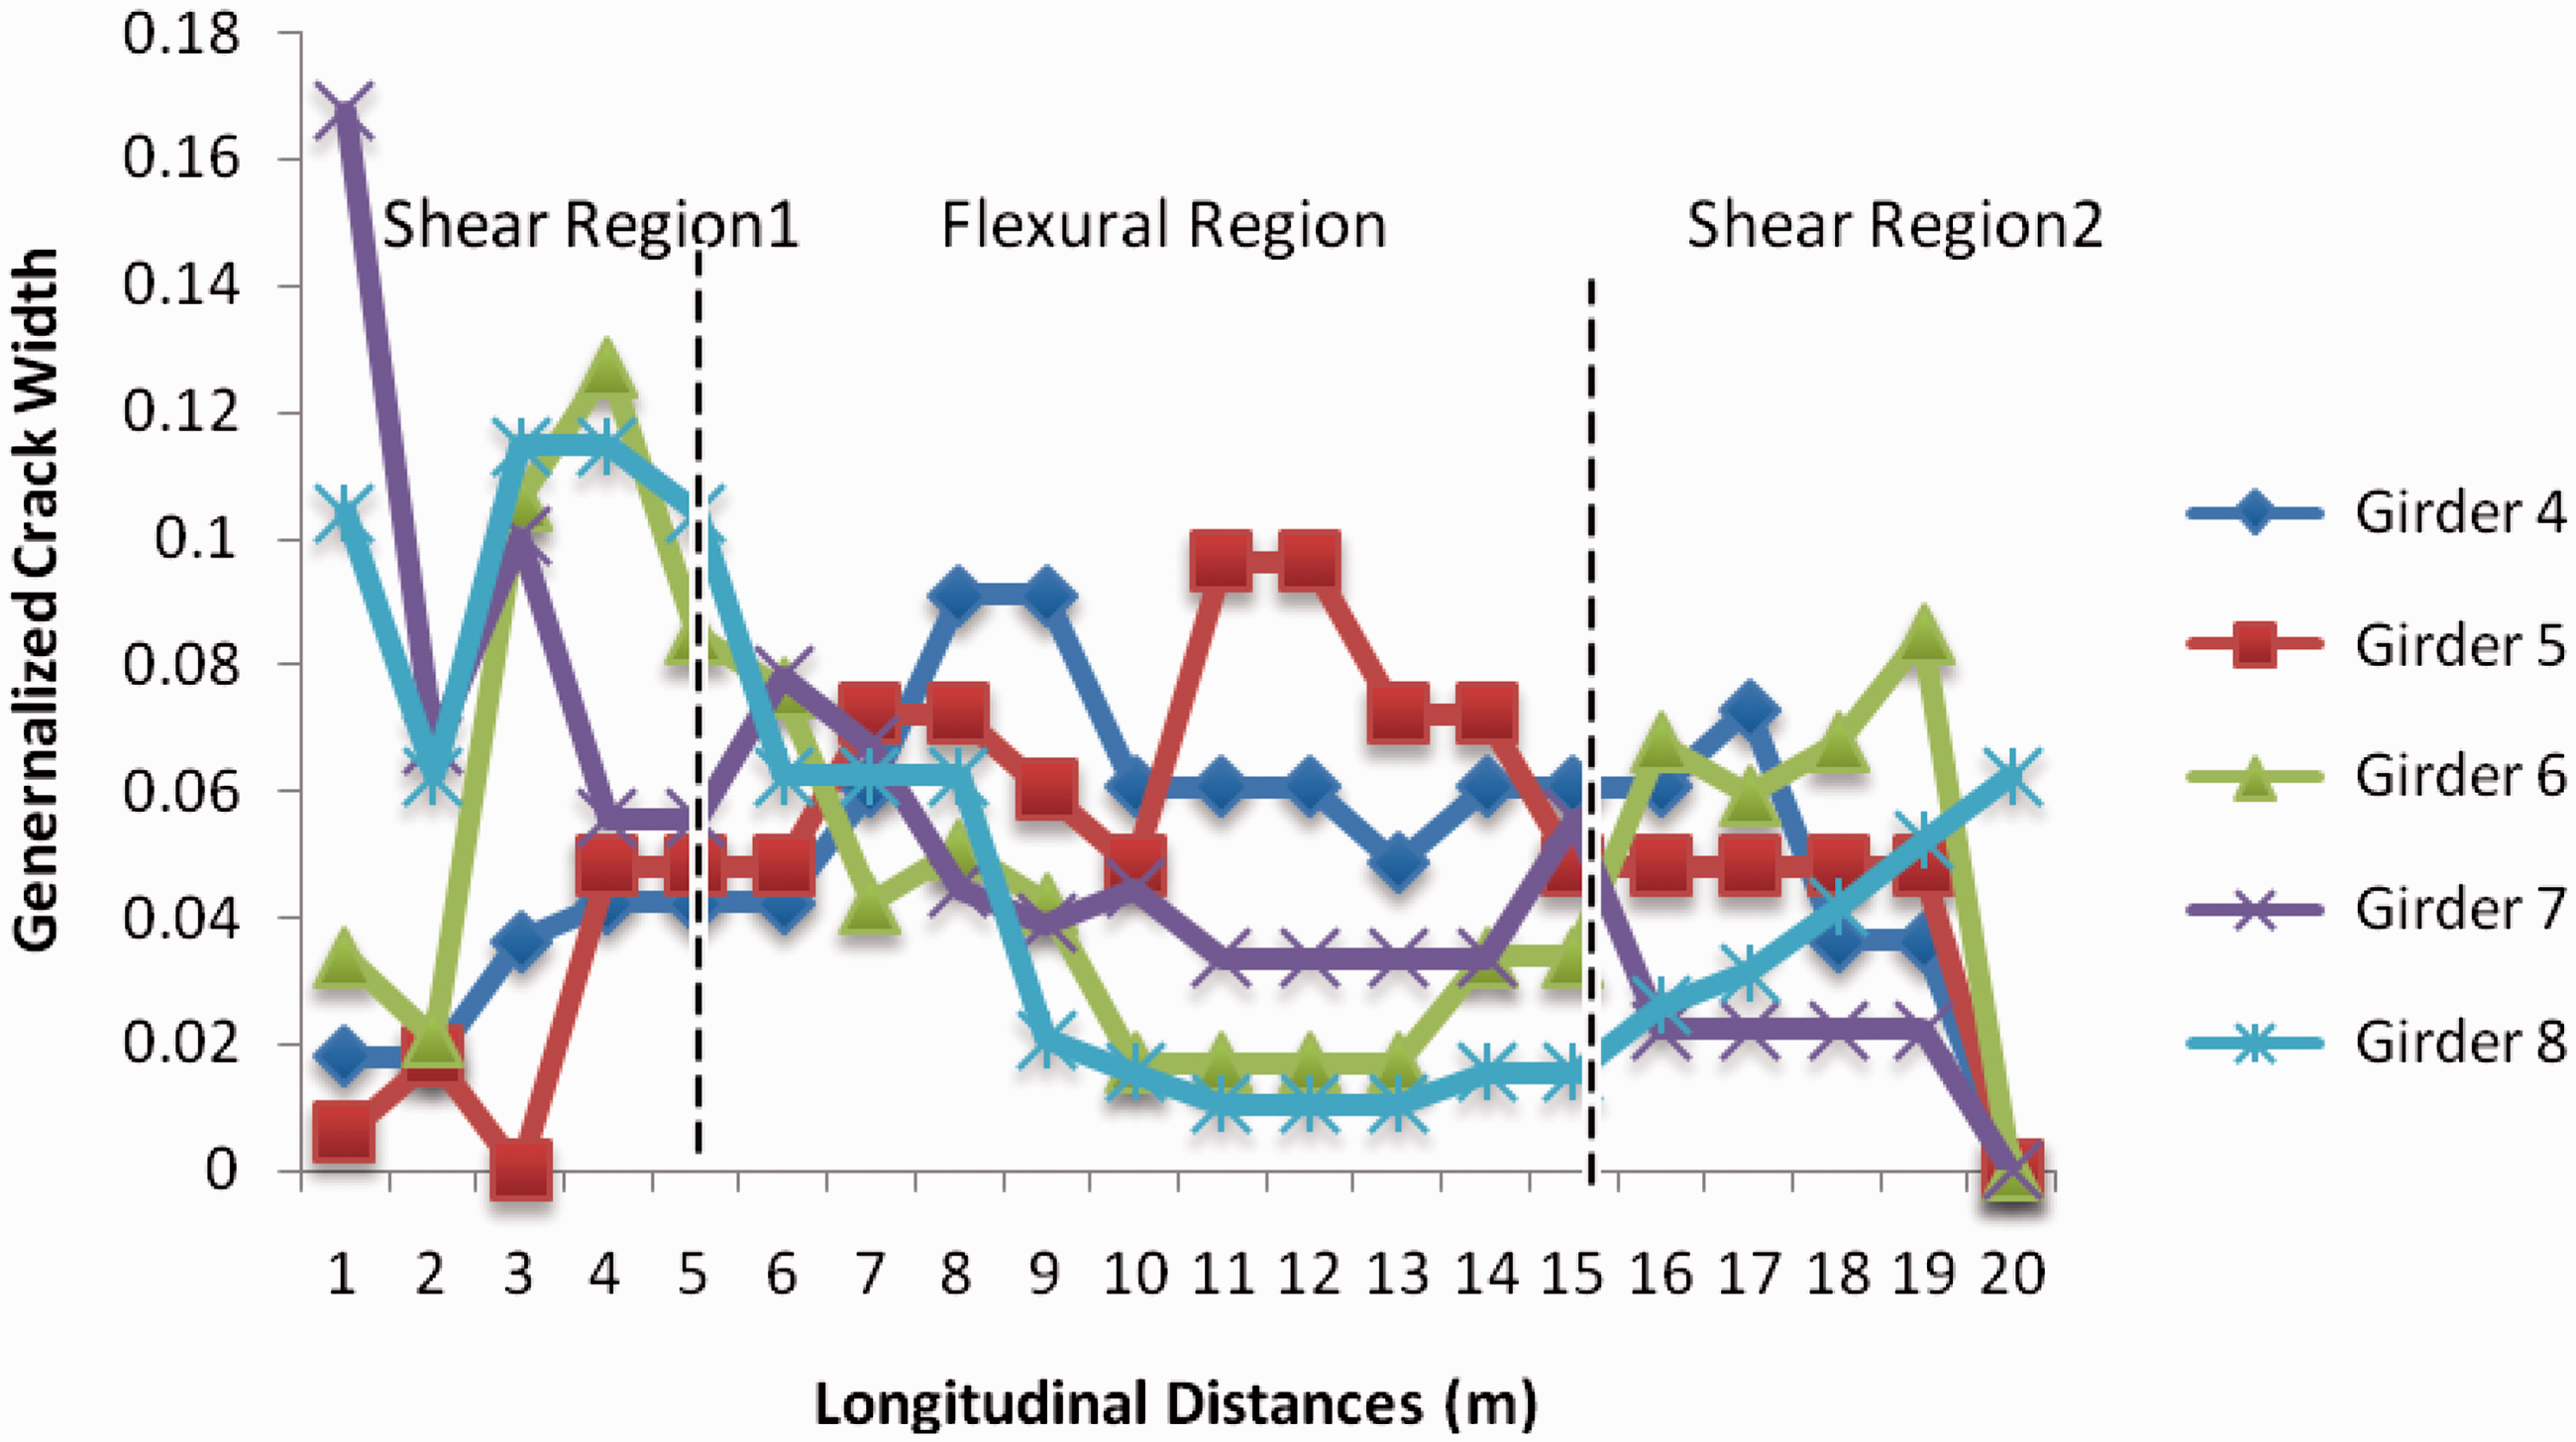
Furthermore, based on Figures 4 and 9, a symmetric or quasi-symmetric crack distribution can be found for Girders 2–5, while an asymmetric crack distribution pattern is identified for Girders 6–10, where cracks on the left half span make more contribution to each girder’s damage than those on the right half span. This phenomenon may be caused due to the asymmetric distribution of detonation (which came from unintentionally loaded firework) and the disturbance for the shockwave propagation from the completely destroyed driving cabin. Therefore, for near-field like Girders 6–10 whose standoff distance is less than 6 m, the effect of both asymmetric distribution and disturbance may play significant roles on shock wave propagation and lead to the asymmetric damage. With the standoff distance increasing, the asymmetric effect decrease and the blast loading tends to be symmetric, which then causes the symmetric damage pattern for the girders.
Based on the above analysis and the assumed rectangular shape of the explosive in the event, two elliptical boundary curves were added on Figure 4 to divide the deck into shear, flexural-shear, and flexural dominated regions, which are denoted as Zone 1, Zone 2, and Zone3, respectively. It is evident that each girder failure is dominated by one of the three failure modes: shear, flexural-shear, and flexural dominated failures depending on standoff distance ranges. The characteristics of standoff-dependent failures of the girders in this car-bomb explosion event are largely due to the isolation effect of the truck on shock wave propagation. In Zone 1, which is close to the explosion epicentre, the isolation significantly affects the blast loading on the corresponding girders. That is why no obvious damage is observed on the girder soffits, like Girders 11 and 12, located underneath the truck and its adjacent region, as shown in Figure 4. This isolation effect of the truck on the blast loading distribution gradually decreases as the standoff distance increase. The most severe damage occurs on those girders in Zone 3 where the standoff distance is relatively greater and the isolation effect is negligible. This indicates that the shock wave is significantly isolated by the deck plate and underpan of the truck. It is worth noting that the truck destroyed in the accident is a regular civic truck. This fact suggests that the steel plate and the wheel supporting system of the truck could provide an effective harden measure to protect the bridge deck from blast damage by absorbing energy during its damage process. For a car-bomb blast event, in order to characterize the standoff-dependent properties of the girder deformation and damage, the concept of BEZ is proposed to characterize the structural behavior of the girders in different standoff distance ranges, as shown in Figure 4. The BEZ and the structural behavior of girders are then discussed according to the scaled distance (Mays and Smith, 1995), Z, which is defined as a distance-mass term describing blast loads with consideration cube-root scaling for charge mass:

In Zone 1: the range of the scaled distance Z is 0 < Z < 0.28 m/kg1/3 (all the standoff distances are measured from the center lines of the girders and a distance of 0–2.15 m is selected for Zone 1). In this zone, the blast loading is isolated by the steel plate of the truck cabin. The blast loading is distributed only in small regions near the supports, in which the structural behavior of girder exhibits the property of shear dominated failure, and the shear cracks are produced in the support regions. Figure 4 shows the crack distribution on the girder soffits in this zone. The shear cracks distributed in the support regions coincide with the structural behavior of the component loaded by a close-in blast (NCHRP, 2010). In this case, the shear brittle failure must be addressed which suggests more shear reinforcement be required in support regions.
In Zone 2, the range of the scaled standoff distance Z is: 0.28 m/kg1/3 < Z < 0.70 m/kg1/3. In this zone, the isolation effect of the truck is gradually attenuated with the increase of the standoff distance. The combination of flexural and shear cracks is observed on Girders 4 to 8, as shown in Figures 4 and 9. In the regions of about 1/4 span length near the supports, the shear cracks were observed, and in the central portion of the girders, the flexural cracks were identified along a distribution length of about 10 m. This crack distribution indicates that a combined flexural-shear dominated failure is formed in this zone and that the blast loading is non-uniformly distributed along the girder since shear cracks contribute more damage to the girders, as shown in Figure 9.
In Zone 3, the range of the scaled standoff distance Z is: Z > 0.70 m/kg1/3. The isolation effect of the truck on the shock wave propagation can be neglected. It can be seen from Figures 4 and 5 that the flexural cracks on Girders 2 and 3 were roughly uniformly distributed in the central regions, and the plastic hinges were also formed at midspan of the girders. This indicates that the blast loading is mainly distributed in the central regions of the girders and creates flexural dominated damage. In this case, the shear effect on the girders is insignificant and a typical flexural deformation induced by explosion is observed.
Deflection
The blasting also induced severe vertical deformation on the girders of the fourth span of the south bridge. Since no historical girder deformation data have been restored for the Fengxingpai Bridge, it was eventually decided to derive the deflections from elevations of the girder soffits in the process of in-site inspection. An electronic total station system free from prisms was employed to obtain the elevations at the soffits of both ends and midspan of each girder. The girder deflection was deduced by subtracting the average value of the bottom elevations of both ends from that of the midspan. All the 4th span girders of both the north–south bridges of the Fengxingpai Bridge were measured for the deflections and the final results are shown in Figure 10, where minus sign means upward camber. It can be seen that little influence has been brought about on the girders of the north bridge by the blasting, since all the related deflections of the north bridge in Figure 10 are minus. But for the south bridge, the girders present heavy deformation and the deformation values indicate an increasing tendency from the interior girders to the exterior. Beside the fallen girder (Girder 1), Girders 2 and 3 provide the most extreme deflections of 756 mm and 676 mm, respectively. The severe deformations of Girders 2 and 3, which are completely consistent with the characteristics of the flexural crack distribution, also indicate that the plastic hinges are formed on these two girders and the integrity of the deck has been destroyed between Girders 3 and 4, as shown in Figure 5.
Measured deflections for the 4th span of Fengxingpai bridge.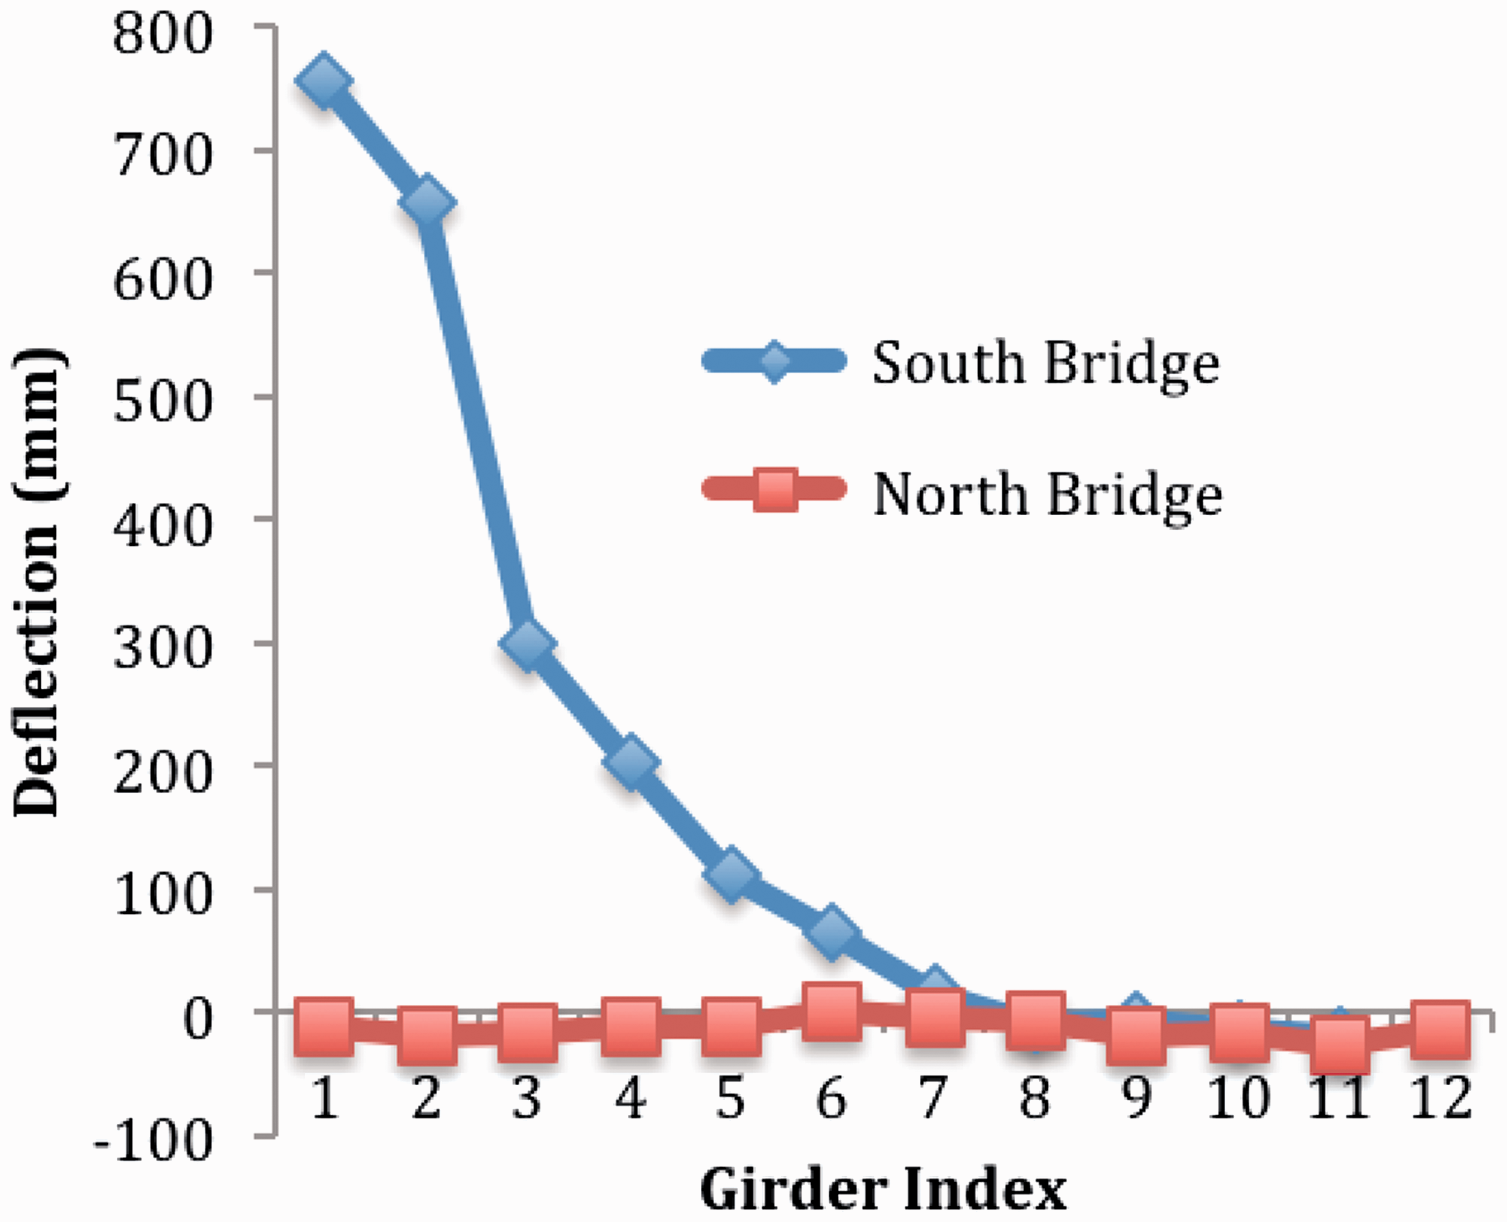
Numerical investigation
In this section, the details of the finite element (FE) modeling and the geometry for the bridge studied were described. The material models for concrete, conventional steel, air and explosive (TNT) were also presented. The numerical simulations were conducted using the commercial software AUTODYN, which, as one of the most well-known explicit FE packages developed for weapons-scale phenomena, has been widely used for blast and ballistic analysis because of its outstanding graphical interface and the advanced remapping techniques in modeling the coupled Euler-Lagrange interaction. The details of the material properties and FE models are discussed in the subsequent section.
Numerical model description
The south bridge deck of the 4th span of the Fingxingpai Bridge was composed of 12 void slab girders, as described in Table 1. Both the disturbing effect and energy dissipation of the truck were not considered independently because they were unable to be identified with current simulation techniques. They were then, in this case, incorporated with the isolation effect by providing a simple supported steel plate in the numerical model. It was also assumed that the concrete deck was perfectly bonded between void slab girders.
Based on the truck type and available field information, the charge size in this event was estimated to an equivalent TNT mass of 450 kg, which is coincident with the explosive weight range of 450 kg to 1800 kg defined for truck bomb (Winget, 2005). The height of detonation epicenter was estimated to be 1.4 m above the deck level (which is 0.2 m higher than the height of 1.2 m proposed as the standard center of mass for most vehicle explosions) with consideration of void ratio of firework. A steel plate with dimensions of 4 m × 4 m × 0.0 6 m (regarding dimensions of the truck and its isolating effect) was placed 0.2 m below the charge in the AUTODYN model to simulate the isolation effect of the truck in the above-deck car-bomb explosion event. The ends of the deck model were pin- and roller-supported effectively on a knife edge. The bridge deck, the reinforcements, and the steel plate were modeled as Lagrangian solid elements, while the high-explosive materials and the ambient air were modeled by Eulerian elements. By conducting a numerical convergence test on various mesh sizes (i.e. 1 mm, 5 mm, 10 mm, 20 mm and 25.0 mm), it is found that the 10-mm mesh yields similar results with the smaller meshes tested under the close proximity explosion load but with less simulation time. Fluid–structure interaction between Eulerian elements and Lagranian elements was considered using the arbitrary Lagrange-Euler (ALE) method which effectively combined a fluid solver and a structural solver. Detailed description for the numerical modeling can be found in the document of Hu et al. (2017).
Material properties
The material responses under dynamic loading at high strain-rates are significantly different from those under static loading. Because blasts create very high strain rates, in the range of 102 to 104 s−1, the strain-rate effect must be included in these types of investigations. Although, for simplicity, one can apply dynamic amplification factors to the materials of all the finite elements, such an approach may not be realistic because not all elements of the structure are exposed to the same strain rate. Naturally, elements close to the explosion experience much a higher strain rate than those away from the explosion area.
Material properties.
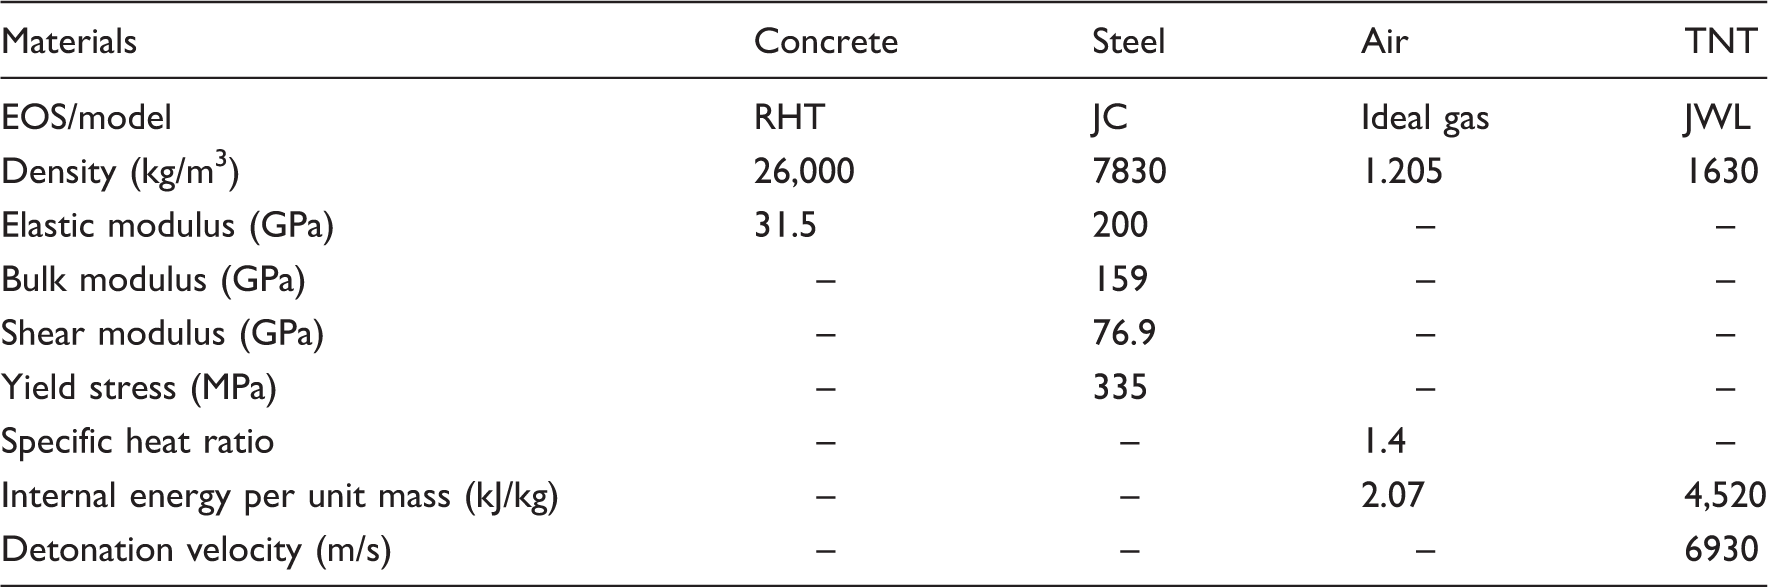
The FE material used to model both the reinforcement and the steel plate is called the Johnson and Cook EOS model (Hu et al., 2017; Pan, 2013). Many studies have been conducted on this EOS model to obtain the accurate yield and ultimate stresses of steel considering the strain-rate effect (UFC, 2008). In this analysis, the material parameters are based on the original data for steel 4340, as shown in Table 2.
In the numerical model, the ambient air is generally assumed to be an ideal gas with static initial internal energy. To model the infinite space detonation, the boundary condition adopted in the previously mentioned Euler domain in this study is the nonreflecting flow-out boundary. In contrary to ambient air, the explosive material was assumed to have much higher internal energy and density. After detonation, the huge energy and density are released suddenly with initial high velocity and move through ambient air, resulting in high pressure. As the blast wave propagates into the ambient air, the pressure, velocity, density, and energy are spread out. The high explosives (TNT) are modeled with the Jones–Wilkins–Lee (JWL) equation of state in this simulation. The properties of air and the explosive used in our analysis are shown in Table 2.
Figure 11 shows the damage occurred on concrete deck in numerical simulation, where red color represents complete damage, while blue color means no damage. Compared to Figure 5, a similar damage tendency which does not follow common knowledge of blast in free air was observed for both numerical and field investigations, i.e. the numerical failure is consistent with the failure identified in the post-disaster investigation.
Damage distribution of the girders.
Figure 12 presents the maximum deflection comparison between the measured values and the numerical results. It is seen that, except for Girders 2 and 3, the numerical results are coincident with the measured deflections obtained in the field investigation. The measured midspan deflections of Girders 2 and 3 are, however, much higher than those of numerical simulation. This can be explained in two aspects: (a) the estimated TNT equivalence is lower than the weight in practice, and (b) the deck integrity has been destroyed in practice, whereas in numerical simulation, this characteristic has not been modeled effectively.
Comparison of girder deflections.
From the distribution of both the overpressure and the deflection, it can be concluded that the presence of a steel plate is effective for isolating the propagation of overpressure on the deck. Therefore, the isolation effect of the truck body and its underpan has a great influence on the amount of damage to the concrete girders. If the girder is located in Zone 1 with a small standoff distance, the shear failure occurs in the support regions of the girders. With the standoff distance increased, damage will occur at both the support and midspan, or only at midspan. In other words, the failure to the concrete girders may be changed from shear controlled to shear-flexural or flexural controlled gradually as the standoff distance increases.
Results and discussion
Gauges are set along the girders at a longitudinal interval of 1 m to obtain the pressure-time histories in the different BEZ. Typically, the overpressure distributions on Girders 2, 6, and 10, are illustrated in Figure 13, which correspond to the three BEZs with scaled standoff distances of 0.81 m/kg1/3, 0.38 m/kg1/3, and 0.13 m/kg1/3, respectively. It shows the overpressure distribution along the girder in zone 1 (Scale distance Z = 0.13 m/kg1/3). The numerical analysis indicates that the overpressure is concentrated in the support regions with a peak value of about 6.0 MPa, and rapidly decreased towards the midspan of the girder due to the isolation action of the steel plate, as the red line shown in Figure 11(a). Referred to Figure 13(a), the blast loading can be assumed to be uniformly distributed in two 4.0 m length regions near the both supports. Therefore, only shear damage can occur under this kind of loading since it is merely distributed in the support end regions. It should be pointed out that the failure shown in Figures 7 and 8 are typical shear failures which are consistent with the failure for Zone 1 identified in post-disaster damage analysis.
Peak overpressure distributions along the girders. (a) Overpressure distribution for the girder in Zone 1. (b) Overpressure distribution for the girder in Zone 2. (c) Overpressure distribution for the girder in Zone 3.
Figure 13(b) displays the overpressure distribution along the girder in Zone 2 (Z = 0.38 m/kg1/3). The blast loading is un-uniformly distributed along the whole length of the girder. Since the isolation effect of the steel plate on the shock propagation is less significant in support regions than that in the central region, the higher loading is distributed near the two support regions with a magnitude of 6.5 MPa and is rapidly decreased to less than 1.0 MPa at midspan of the girder. Similar to that in Figure 13(a), this loading distribution can also be approximated to be uniformly distributed in two kinds of regions, the 12 -m long central region and the 4 -m long support end regions. Therefore, both shear and flexural failure may occur in this zone but shear damage may be more significant due to the higher overpressure in the support regions than that in the central part.
With the increase of the standoff distance, the isolating effect of the steel plate on the blast loading is relatively insignificant. In this case, the blast loading is decreased with the increase of the standoff distance. Therefore, the blast loading may be intensive in the central region of the girders and decay toward the supports due to the increasing standoff distance from the midspan to the support ends. Figure 13(c) shows the overpressure distribution along the girder in Zone 3 (Z = 0.81 m/kg1/3). The highest pressure is 6.45 MPa at the midspan, and the lowest pressure is about 1.0 MPa at the supports. Neglecting the effect of the relative small loading on the girder, it is assumed that the average pressure is distributed in the 6 m central region of the girder. It is noted that the localized deflection occurs at the midspan of the girder with a maximum value of 457 mm, which corresponds to the plastic hinge induced by localized blast loading.
Therefore, according to both the field investigation and numerical simulation, it is evident that typical BEZs are formed in the near-fields of explosion due to the isolation effect induced by deck plates and underpan of the truck. The concept of BEZ can be employed to determine blast loading for bridge design which has not been specified by current design standards or regulations in detail. On the other hand, with the knowledge of BEZs, bridge administration can use it to minimize any lost and damage for accidental blast events on bridge structures by guiding specific lanes for potentially dangerous vehicles.
Concluding remarks
This paper presents the findings in a post-disaster study on an existing bridge above-deck blast accident, which focuses on overpressure distributions and damage characteristics of the deck girders. Based on the field data, the correlation between the standoff distance and the girder failure modes is investigated. The analysis of the crack distribution on the girders indicates that the girder failure modes are dominated by one of the three modes: shear, flexural-shear, or flexural failure. To characterize this relationship, the concept of the BEZ is proposed. The numerical simulation is conducted to simulate the car-bomb explosion and the structural responses in each BEZ. The numerical results are consistent to those obtained from field investigation.
Based on the analysis of cracks and deflections, the conclusions are made as follows: for car-bomb blast events, the isolation effect of the vehicle can significantly affect the loading distribution on structures, but these isolation effects are localized within a region with a small standoff distance, and are gradually attenuated by the increase of the standoff distance. It is pointed out that the failure of the girder is dominated by one of the three types of failure: shear, flexural-shear, and flexural dominated, depending on the BEZ where the girder is located.
Since the conclusions made in this paper are based on the analysis of one accidental car-bomb explosion, the following open questions need to be further investigated: (1) The effect of the gap between the bridges on the shock wave propagation, and (2) The boundary curves between each BEZ are roughly assumed to be ellipses based on the rectangular shape of explosive in the event. To confirm this assumption, further field tests and computational fluid dynamics (CFD) investigations are suggested.
Footnotes
Acknowledgements
The authors would like to thank Jiangxi Provincial Center for Traffic Engineering Quality Inspection for the field inspection.
Declaration of conflicting interests
The author(s) declared no potential conflicts of interest with respect to the research, authorship, and/or publication of this article.
Funding
The author(s) disclosed receipt of the following financial support for the research, authorship, and/or publication of this article: The financial support for this study is provided by the Fundamental Research Funds for Central Universities (Project No. 2013-IV-016).