
Abstract
In this paper, a multi-disciplinary analysis method is proposed for evaluating the fatigue life of railway vehicle car body structure under random dynamic loads. Firstly, the hybrid fatigue analysis method was used with Multi-Body System simulation and finite element method for evaluating the carbody structure dynamic stress histories. The dynamics stress is calculated from the longitudinal load using longitudinal train dynamics. Secondly, the nonlinear damage accumulation model was used in fatigue analysis, and carbody structure fatigue life and fatigue damage were predicted. The mathematical model simulations are compared with results produced experimentally, showing good agreement. Finally, the mode is determined after the finite element model is established. To achieve the dynamic stress at each node, the modal response is used as excitation. The carbody damage was obtained by combining dynamics stress with the NMCCMF damage accumulation model. As a result, the effect of longitudinal load on carbody fatigue damage is investigated. The longitudinal load contributes significantly to the fatigue damage of the carbody.
Introduction
In India introduction of high-speed locomotive trains may not only just help in the saving of energy but also the protection of the environment. Being one of the longest railway networks in the world, it is used most extensively providing high comfort to its passengers. As the speed of these trains is increasing day by day, the need for safety measures and reliability is also increasing proportionally during its operations (Sharma, 2019; Sharma and Kumar, 2017, 2018). For passenger railway vehicle's most critical feature is their safety. A vehicle loading structure's fatigue strength has a significant effect on its stability, so it must be considered. In last decades (Amitesh et al., 2016; Dai et al., 2020; Sun et al., 2020), many fatigue strength measurement techniques for rail vehicles have been proposed including fatigue analysis for uniform loading by the endurance limit, analysis of fatigue test programs by cumulative damage, and analysis of simulated multiple body systems by cumulative damage. These techniques have been widely used by railway organizations (Palli et al., 2018; Sharma and Kumar, 2018; Sharma et al., 2020; Sharma and Sharma, 2018).
Han et al. (Han et al., 2013) implemented a static load model and experimentally assessed the static strength of the bogie frame of the urban maglev line. Linhart et al. (Linhart and Černý, 2011) conducted large-cycle fatigue experiments assessing the endurance limit for massive model elements of bars with pressurized hubs consisting of three rail axle steels. Wu et al. (Wu et al., 2016) suggested an advanced crack closure model focused on fatigue crack development in low-cycle fatigue activity and increased threshold stress factor range at various loading factors. The expected findings are found to be very similar to the experimental evidence of the steels used in railway axles (Bhardawaj et al., 2020; Sharma and Kumar, 2017, 2018). The fatigue strength of a conventional weld joint used in the production of rail bogies was investigated by Bertini et al. (Bertini et al., 2014). The high-speed train axes of the reconstructed railway tracks and intercity Jingjin line have been tested to evaluates stresses by Zhou et al. (Zhou et al., 2015). The S-N curve parameters were determined through various notches and fatigue thresholds. Milovanović et al. (Milovanović et al., 2013) have been studying the methodology used to find reasons for the splitting of a joint welded near the container and swap bodies under the carriage using strategic goods movement network.
For the endurance test of the high-speed rail CB, the conventional approach mostly accounts the first type of load, however, this measurement technique neglects the effect of the longitudinal load on the CB system (Goyal et al., 2019; Sharma and Kumar, 2017; Sharma and Lee, 2020, 2021) while the vehicle is in traction and braking mode. A country like India has several stations on a railway track, therefore a conventional endurance fatigue design system may not correctly evaluate the load condition where the high-speed train arrives and leaves the station regularly. Furthermore, the coupling of the two different types of loads causes the problem of fatigue durability of the high-speed train carbody, it is important to examine the longitudinal load. Ling et al. (Ling and Jin, 2014) discovered that the entire vehicle-track model and one car-track model generated substantially different results as applied to certain dynamic simulation output parameters. Yang et al. (Chu and Yup, 2016) carried out a longitudinal resistance test on the track fastening mechanism to assess the difference in track resistance that resulted when subjected to repeated vertical loads. Guo et al. (Guo et al., 2021) to perform the structural integrity assessment of high-speed maglev vehicle components with defects subjected to complex VA fatigue loads.
In last decades of fatigue damage analysis, damage accumulation has been shown to rely on loading parameters, i.e., stress factor, average stress, and the loading sequence. Thus, the Miner linear damage rule is therefore unavoidable for miscalculating fatigue life because accumulated damage/cycle is not a function of load (Zhang et al., 2018). Nonlinear damage rules were used to compare damage aggregation with loading parameters. To research tribo-fatigue, Sosnovskiy (Sosnovskiy and Sherbakov, 2017) examined the principle of entropy in continuum mechanics and thermodynamics, and a nonlinear damage model based on damage accumulation as an irreversible mechanism was developed.
In general, damage models do not influence load within material endurance limit. Therefore, if only loads below the fatigue cap are added, the life will be limitless. Low-amplitude loads within the endurance limit are very common in engineering, and this type of low-amplitude load can also make up the bulk of the loading history. The low/high-amplitude relationship in this situation may alter the damage accumulation mechanism, and the low-amplitude load may also lead to significant damage. Thus, to accurately evaluate the fatigue life and damage evaluation, low amplitude load within the endurance limit must be considered. Hence, the longitudinal load for the carbody is important to consider to evaluate the fatigue damage analysis.
In this paper, longitudinal train dynamics is longitudinal load spectrum is considered to evaluate carbody fatigue damage and its calculated using longitudinal train dynamics. This paper is divided into three part. First, longitudinal load spectrum is calculating by longitudinal train dynamics model considering WAP 5 locomotive with 14 LHB coaches using universal mechanism and validated using experimental analysis. Second, nonlinear modified chaboche with Cauchy membership function model is considered to evaluate the effect of low-amplitude load cycles within endurance limit on the damage accumulation. The effectiveness of damage accumulation model was evaluated by comparing with experimental result. Thirdly, the finite element model of a carbody is formulated to evaluate the fatigue damage caused by longitudinal load of a rail vehicle.
Longitudinal train dynamics
Figure 1 depicts the total flow diagram of the methodology used in this paper. Train longitudinal behavior is determined by locomotive control inputs, coach connection characteristics, track topography, train brake inputs, etc. A series of differential equations may be used to model a train's longitudinal dynamic behavior. For mathematical modeling, it is generally believed that coaches should not shift laterally or vertically (Garg and Dukkipati, 1984).
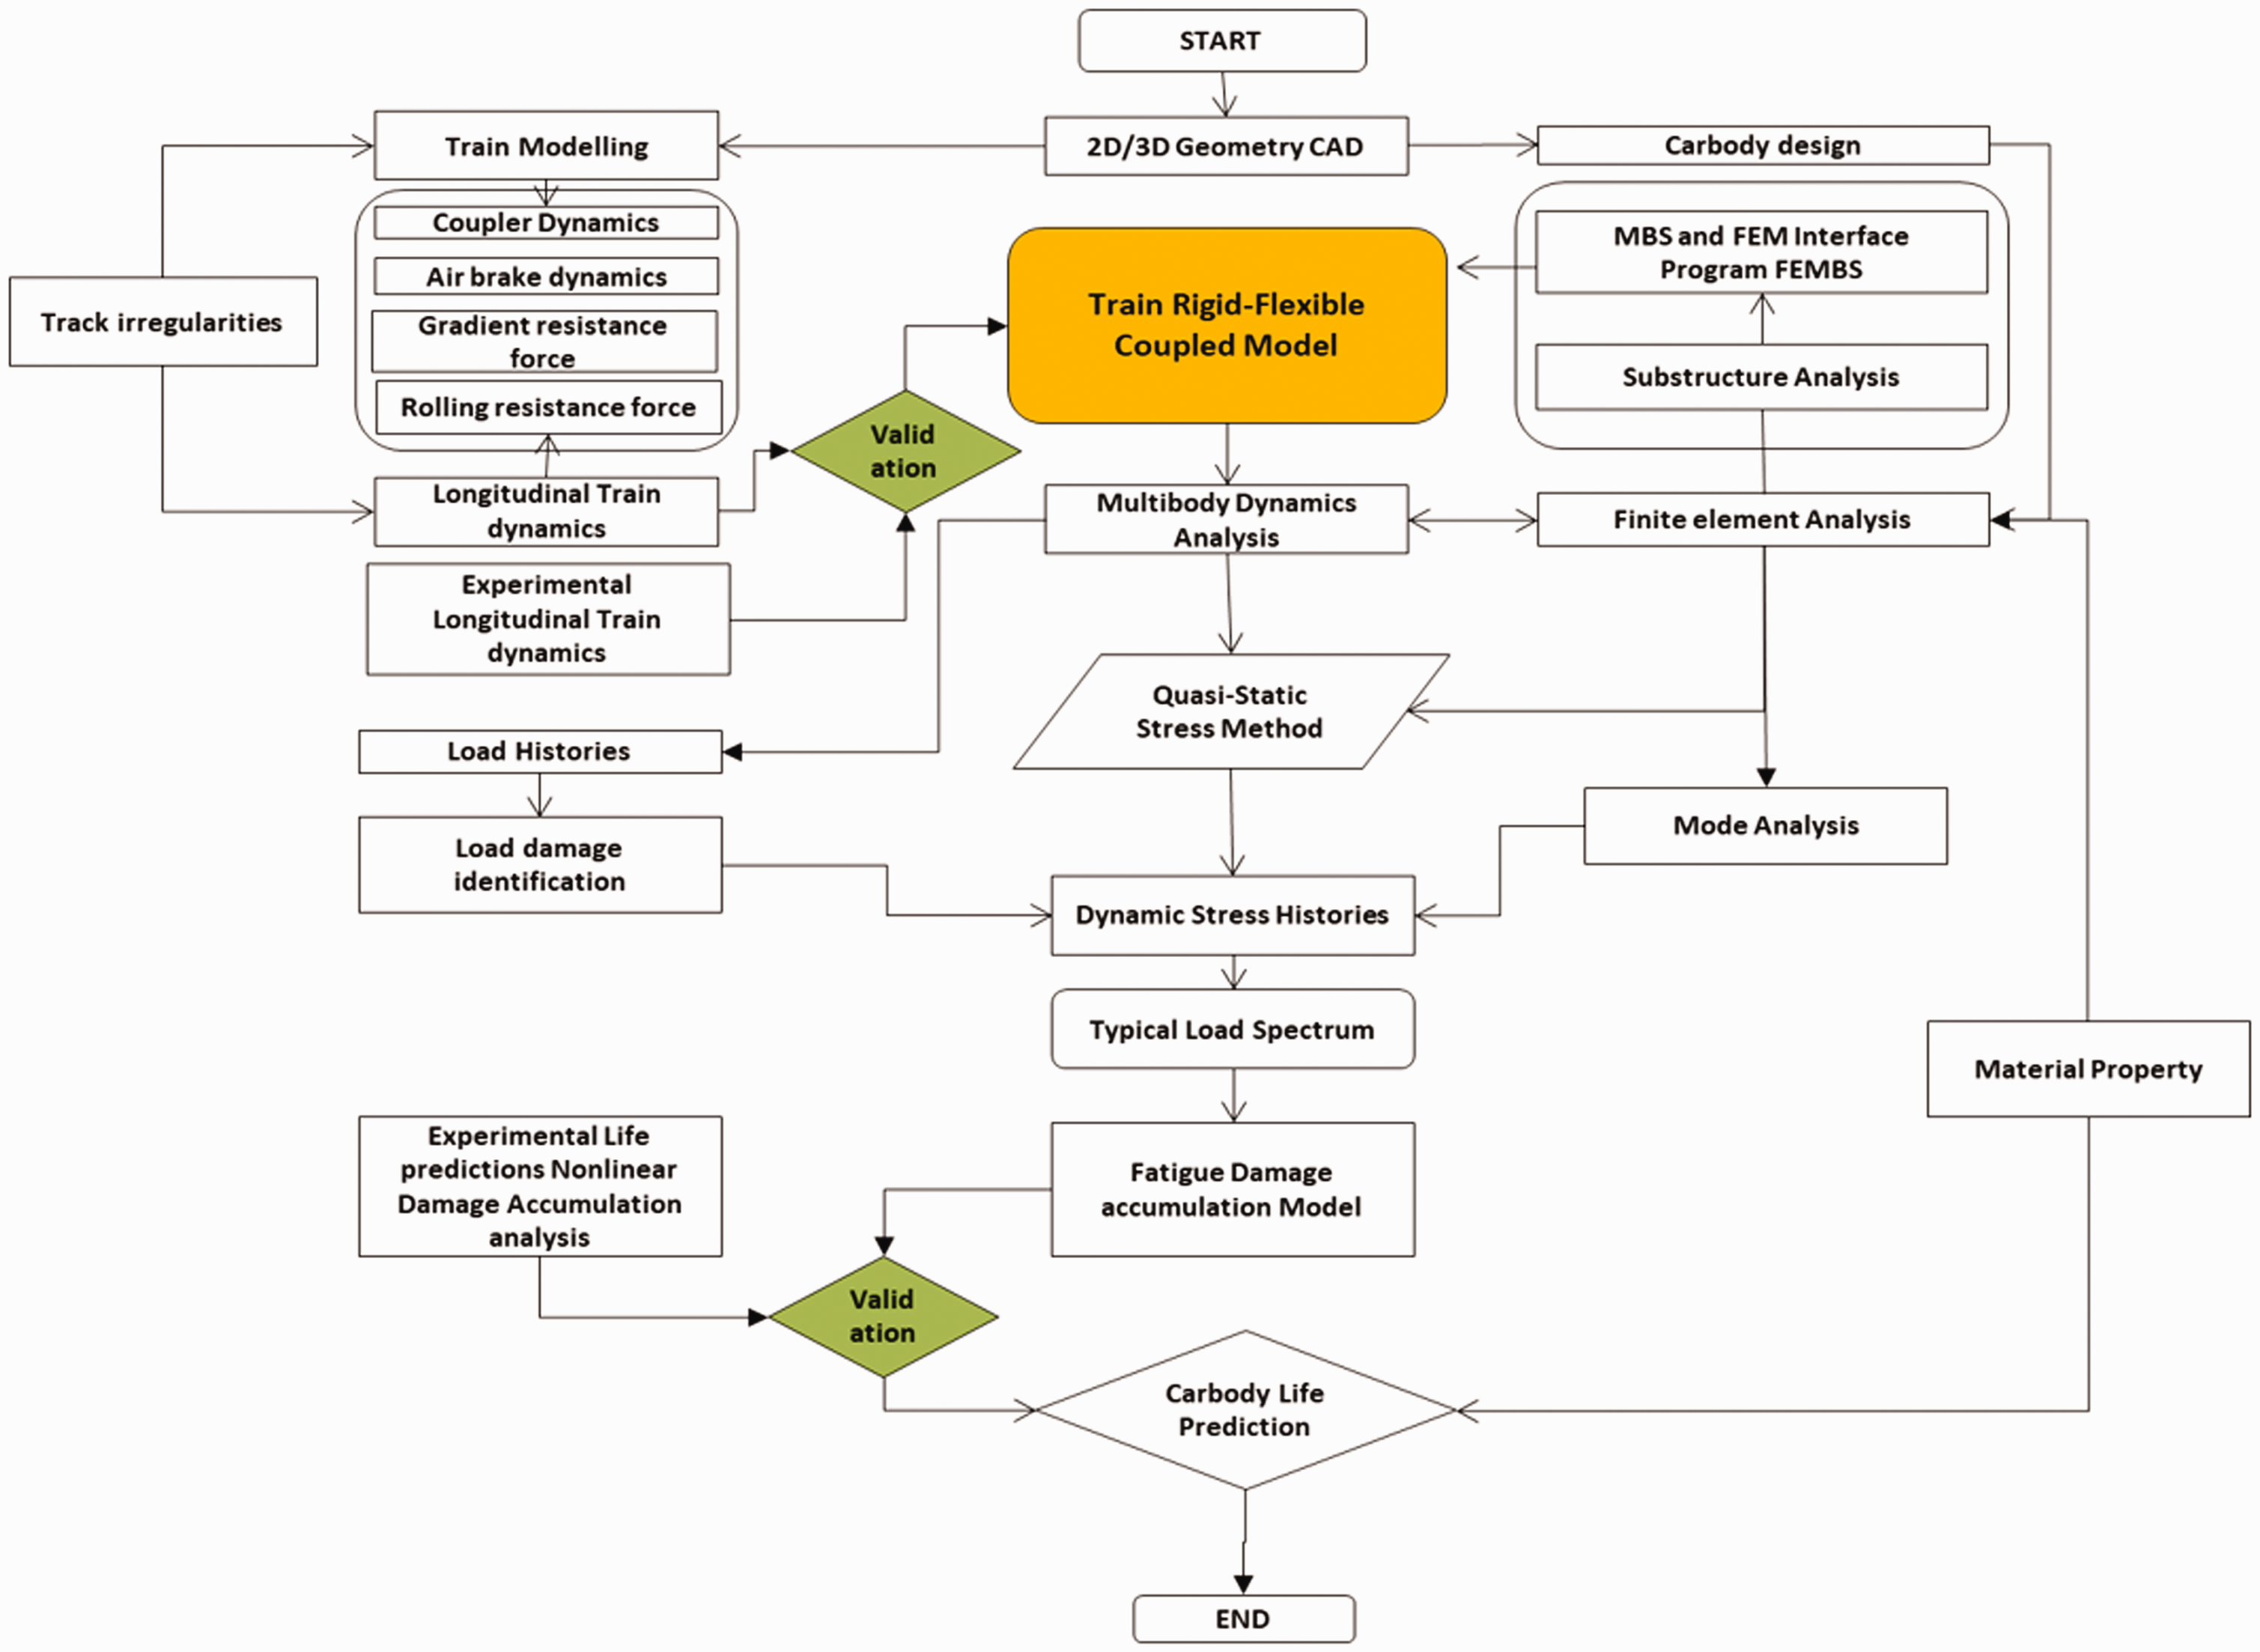
Overall flow chart of methodology.
The longitudinal train dynamics differential equations can be developed by considering general mass train as shown in Figure 2 (Cruceanu et al., 2015; Iwnicki, 2006). The train model is consists of n number of mass bodies i.e.
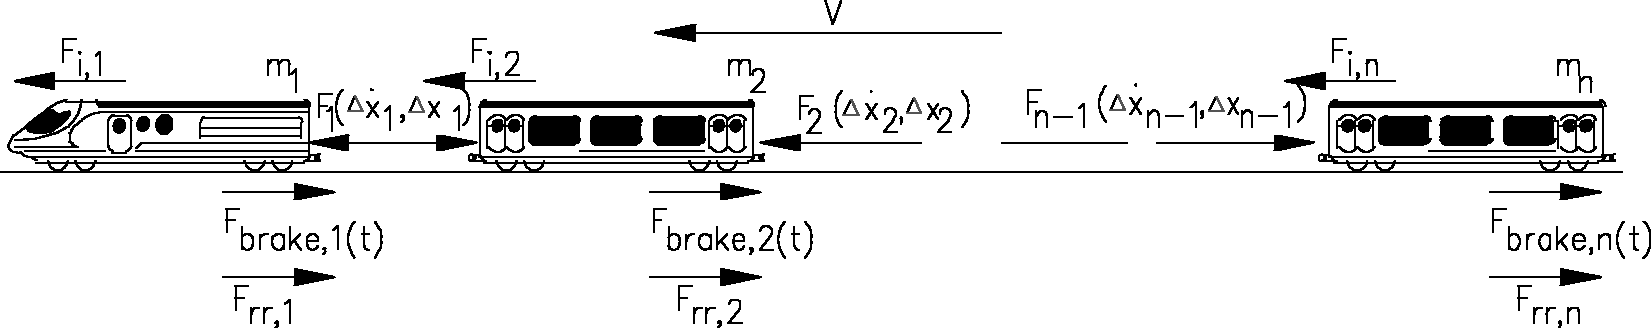
Forces acting in longitudinal train dynamics.
The equation of motion (EOM) of nth coaches is given in equation (1):
Nonlinear damage accumulation
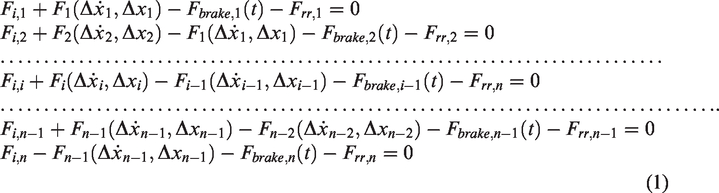
The material's fatigue performance can be observed as a continuum mechanism that continually accumulates damage before failure occurs. The (Low amplitude-Load) L-aL below the endurance limit also leads to the accumulation of damage, but the influence depends on the damage that occurs. With increasing initial damage, the influence of the L-aL on-damage accumulation increases. Therefore, the NMCCMF model (Sun et al., 2016) is considered to see the effect impact below endurance limit (Figure 3) on the damage accumulation (Xi and Songlin, 2009). Therefore, in this analysis, fuzzy mathematics theory as membership functions (MFs) is considered to assist in determining whether low-amplitude loads should be used in damage accumulation (Sosnovskiy and Sherbakov, 2017; Zhang et al., 2018). It is not necessary to achieve an utter conclusion of causing damage or not in the ‘fuzzy area' near to the fatigue boundary, but only to describe the damage degree (Cruceanu et al., 2015; Garg and Dukkipati, 1984). The applicability of the fuzzy set theory is not restricted to circumstances in which no details are accessible for mathematical study. MFs may specify a fuzzy variable to represent the indeterminacy of damage. In the full load range from 0 to the maximum stress

Low-amplitude Load below fatigue limit.
Damage accumulation rate is given by
Experimental analysis of IRSM-41 corten steel for fatigue life
The car body shell is made of cost-effective steel construction with interlocking developed technique by M/s Alstom. The roof is made of beaded sheets and the corrugated floor sheet is made of austenitic stainless steel. Ferritic stainless steel is made from the structure of the roof, sidewall, and end wall. For the under-frame and other parts, IRSM-41 Corten steel was used. High cycle fatigue experiment is performed with a 100 kN power Instron machine (Figure 4) on IRSM-41 CORTEN steel to analyze the behavior subjected to axial tension loading as per EN 10080 and EN 1421-3. This controller is entirely compact and made especially for researchers in materials testing. This controller has advanced features including load, position, and strain control capability. A low cycle fatigue test was performed on 12 specimens to assess the material's fatigue ability. The load cycle frequency is maintained as 25 Hz (Sim et al., 2015).
Experimental set up for fatigue life testing.
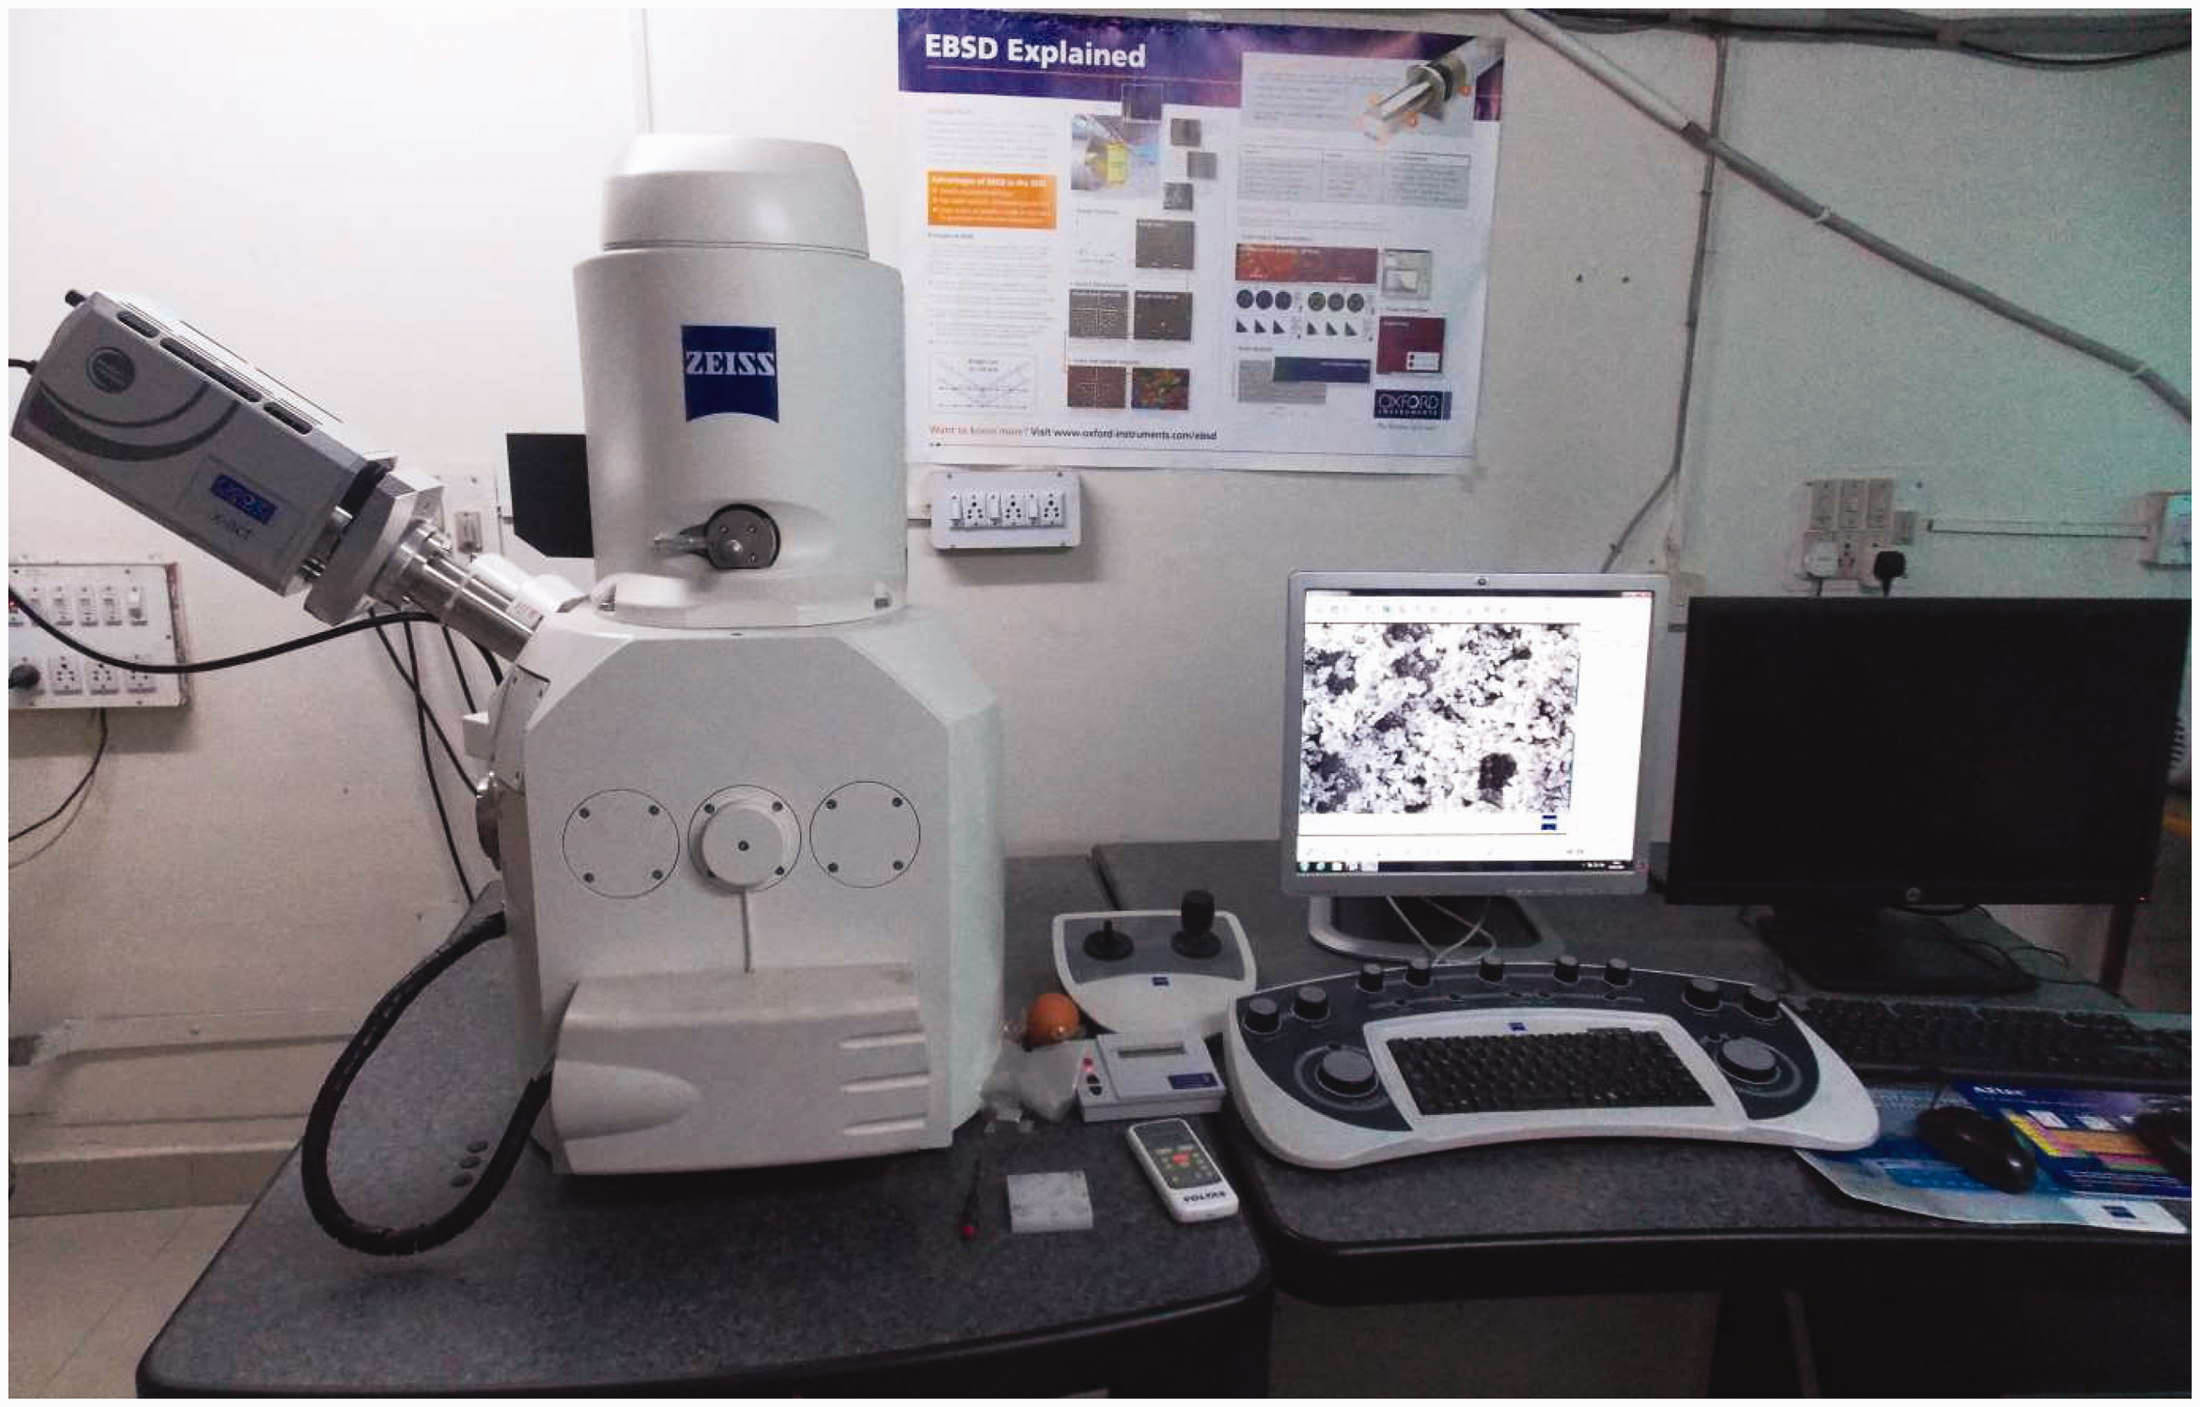
The Zeiss EVO18® LaB6 filament SEM will provide high-resolution topographic and compositional images of metallic and non-metallic surfaces with high contrast. It is fitted with an Oxford energy dispersive (EDS) spectrometer. It has an Oxford® NordLysan® electron diffractometer for micro-textural research. It uses HKL proprietary post-processing tools for creating orientation charts, post-calculation of pole figures, and MODF/ODF calculations. The results obtained in this way were the basis to build the SN curve. Table 1 shows the chemical composition of the measured IRSM-41 CORTEN steel. They comply with the EN requirements, such that no-fault during testing may be due to poor material quality.
Chemical composition of the IRSM-41 Corten steel.

Case study and longitudinal load calculation
The traction and braking features of high-speed locomotive trains indicate the correlation among speed and (a) traction or braking force and (b) train running resistance, respectively. Therefore, the train is modeled using universal mechanism software and the longitudinal load spectrum is calculated. The model for the train consists of a locomotive, i.e., WAP-5, double-decker coaches, generator/luggage van, and AAR ‘H' Type Tight Lock Couplers with balanced type draft gear in train connections. Also, a total of 14 coaches and a locomotive are part of the train. Figure 5 demonstrates the arrangement for both the train with the locomotive and coach location. Where L represents the locomotive, the Ac double-decker chair car is C1–C12 and the generator/luggage van is EOG (Sharma et al., 2021, 2021; Sharma and Kumar, 2018; Sharma and Lee, 2020, 2021). Tractive effort (TE) is the force generated by a locomotive to generate motion through tractive force and braking effort (BE) is a measure of the braking power of a vehicle. The model is universal mechanism is shown in Figure 6.
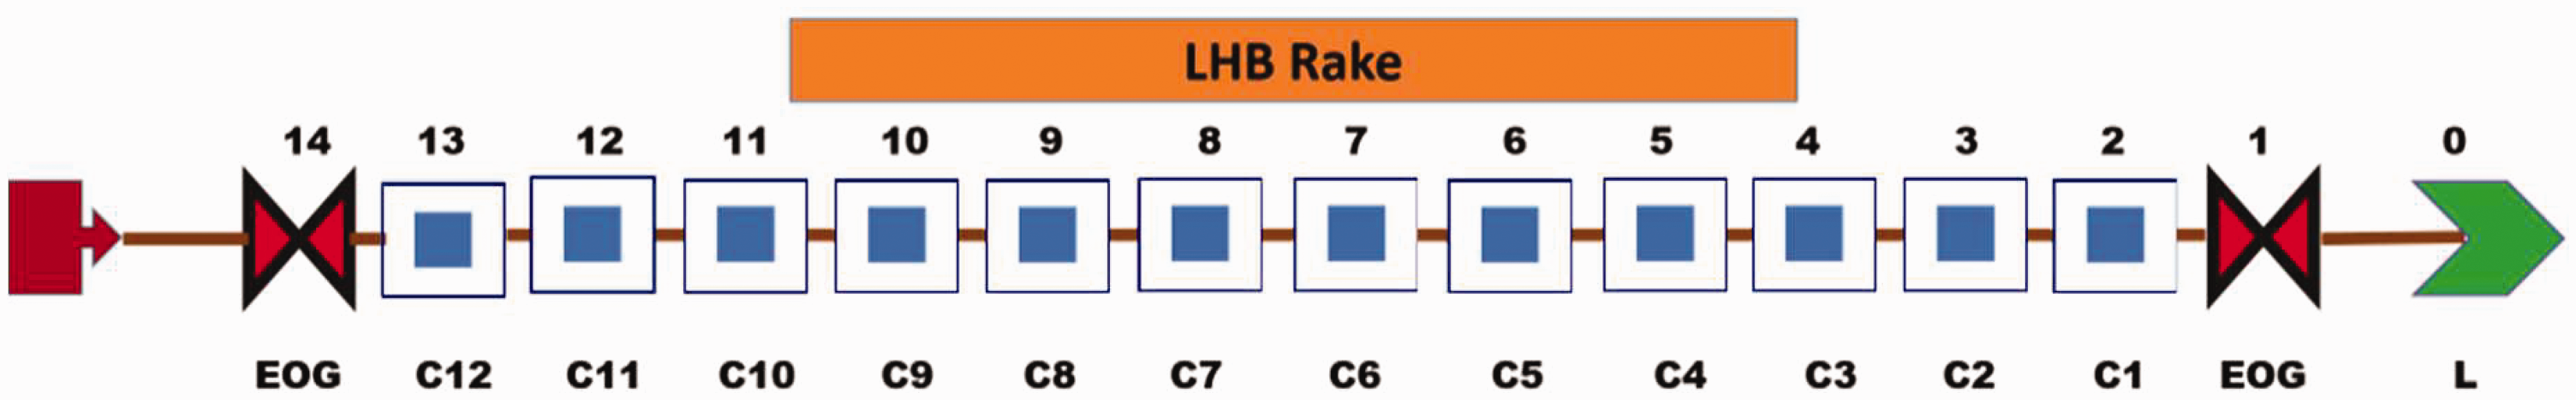
Position of cars in train model.
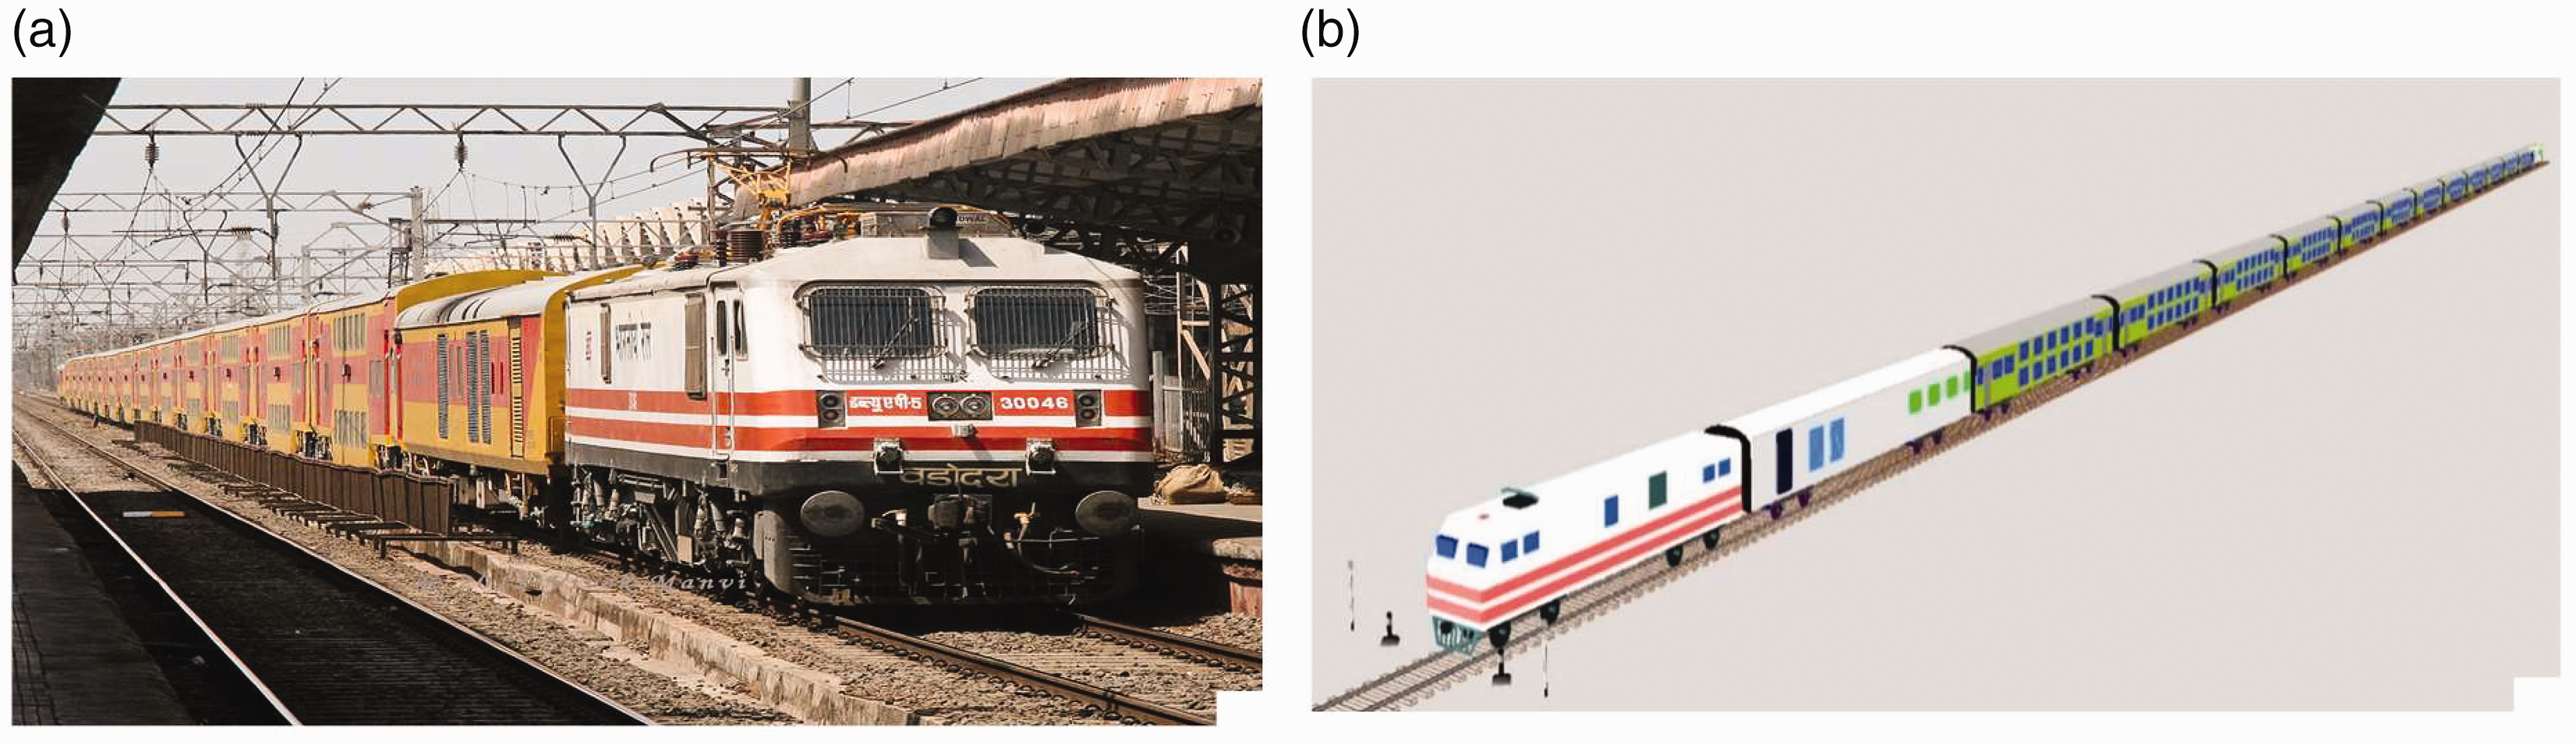
(a) shows the actual train 1 hauled by WAP-5 and (b) shows its model in UM software.
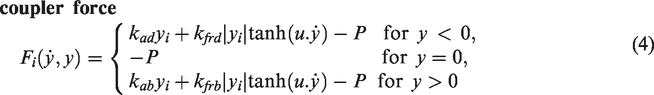
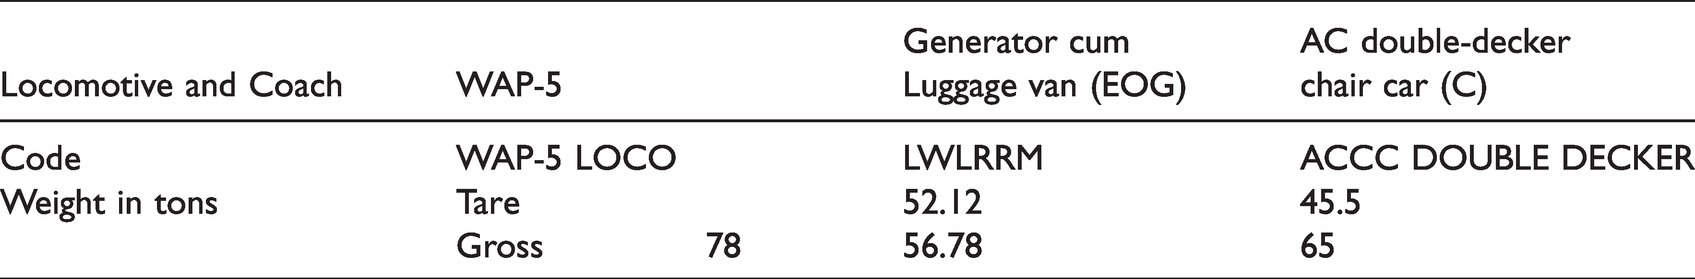
As shown in Figure 7, TE and BE were tested experimentally by RDSO, and equations (4) to (7) is used to measure the coupler force, air brake force, gradient resistance, and rolling resistance force. However, in Table 2 (Sharma et al., 2021), the train parameters, i.e., code and weight, were given. The state of the track considered was a track from Mumbai to Ahmedabad. The length of the track is about 492.7 km long and has a two percent maximum slope. The track is very straight, so the curvature of the track does not affect the measurement much. The track elevation is shown in Figure 8 (AC Double Decker Express, 2014).


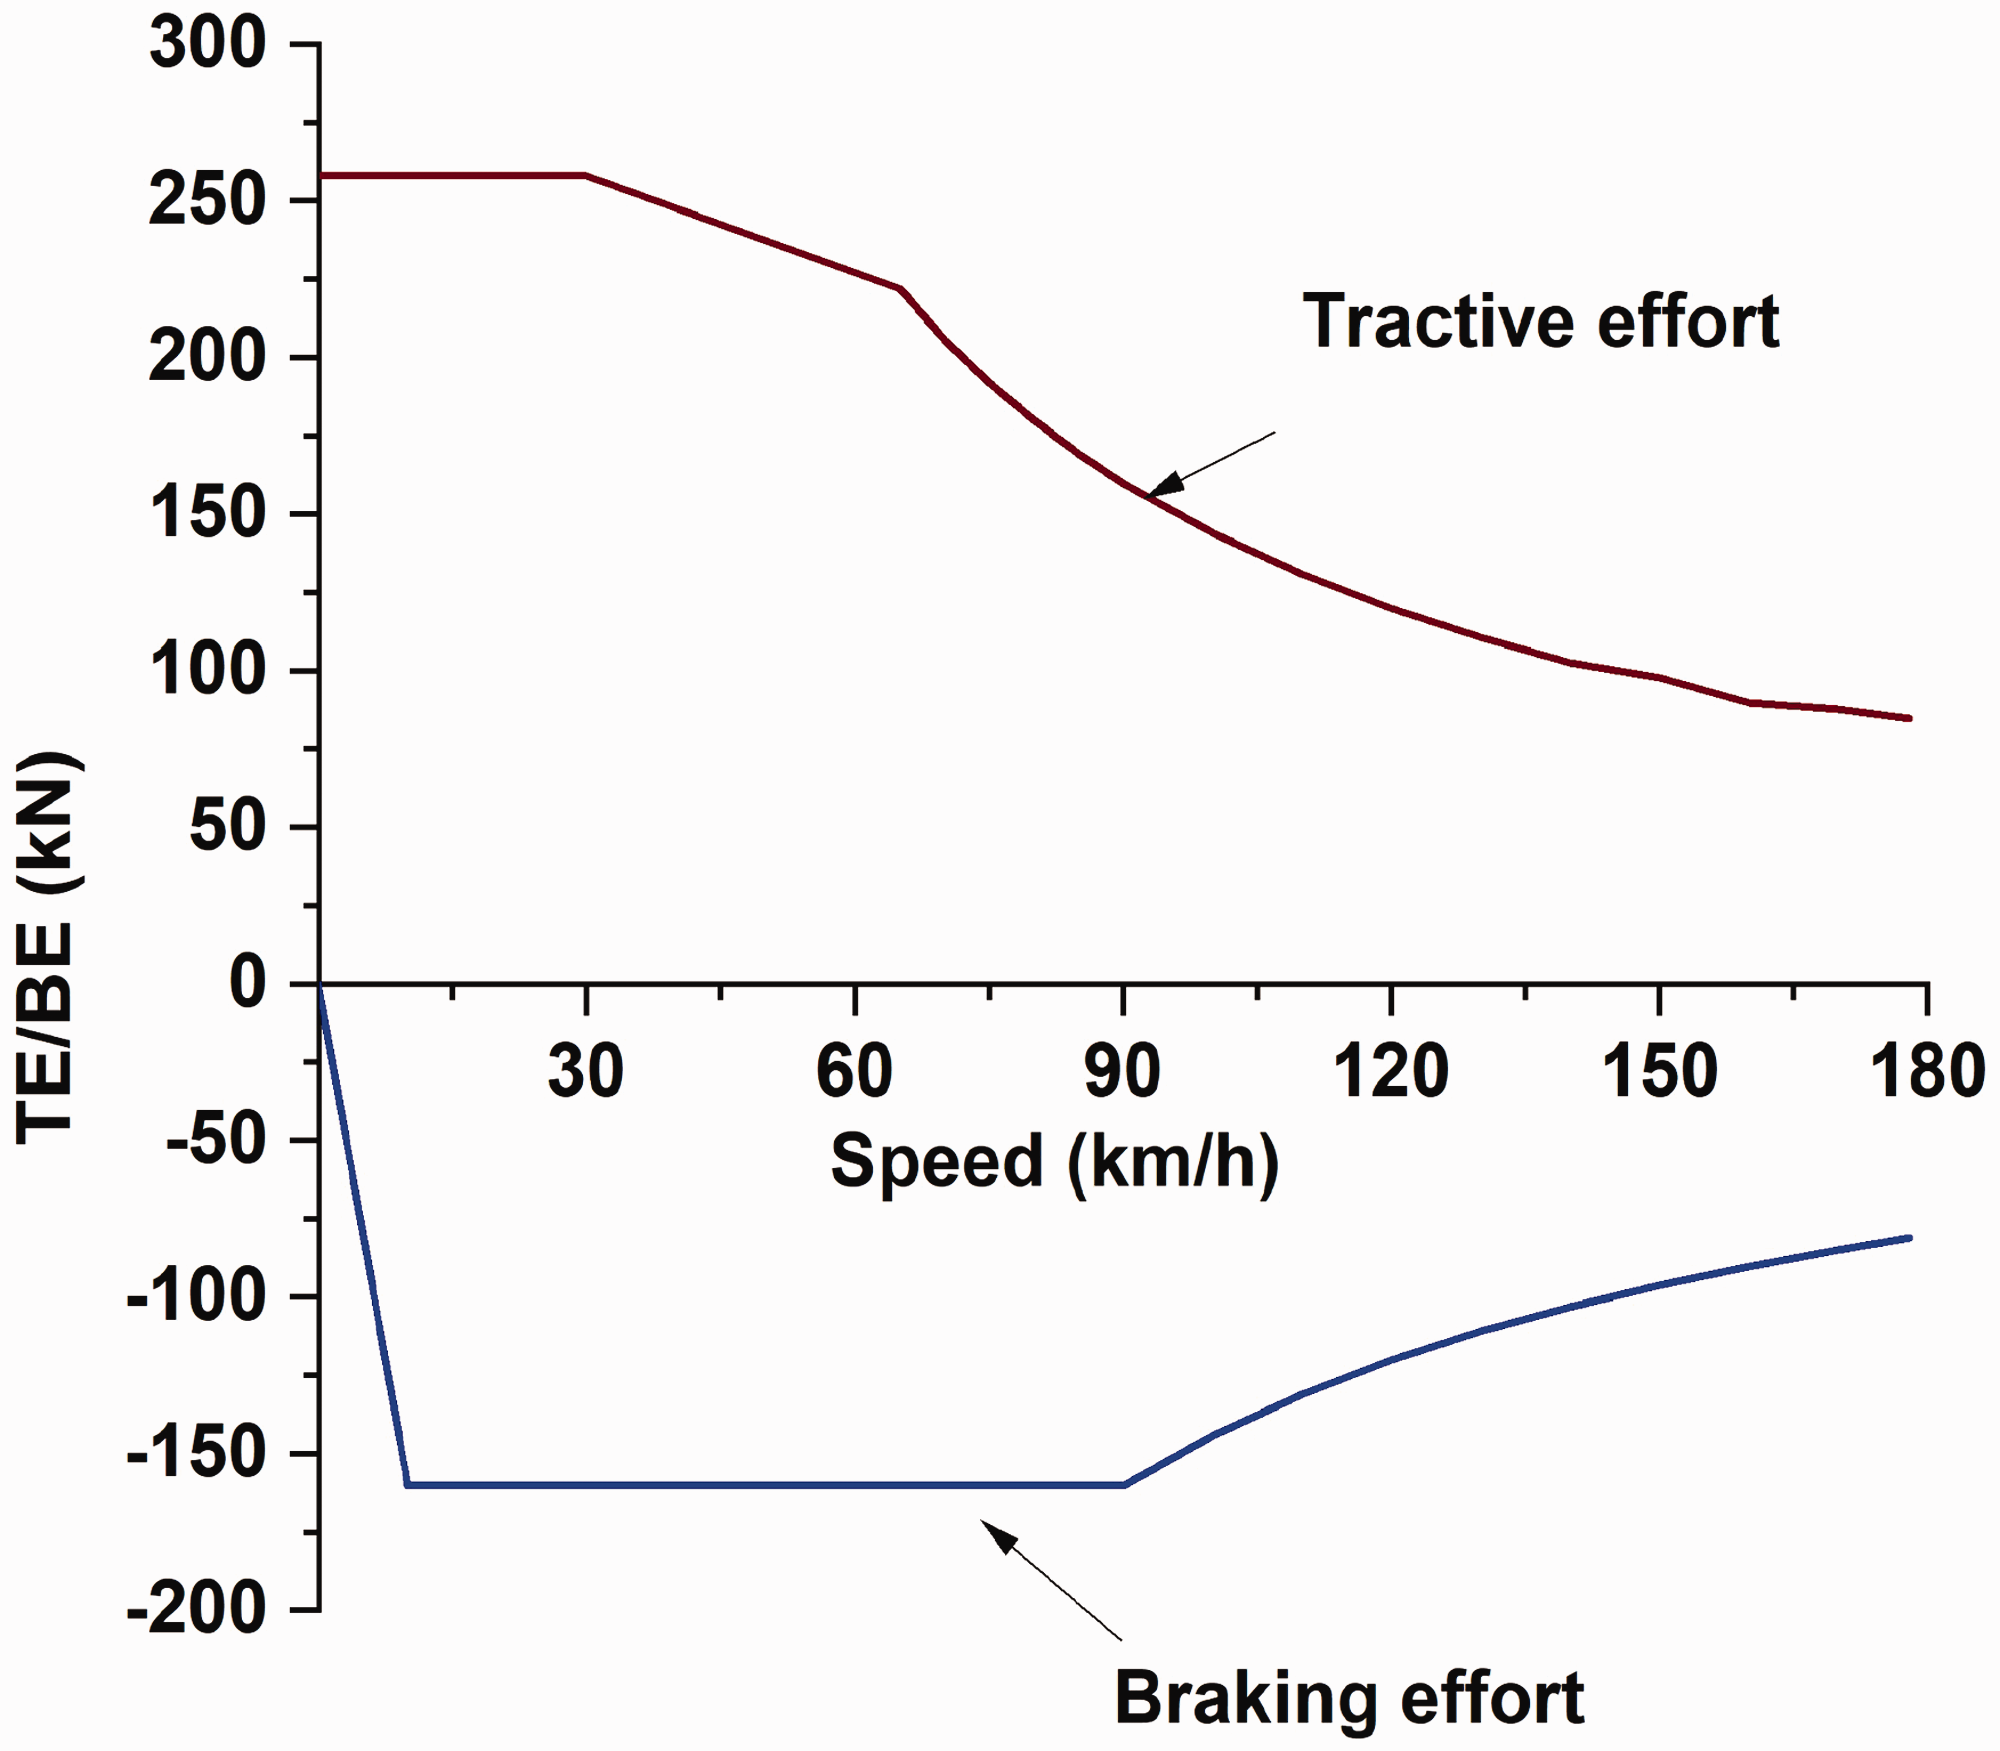
TE/BE v/s Speed for WAP-5 locomotive.
Types of coaches and their respective weight (Chandra, 2002).
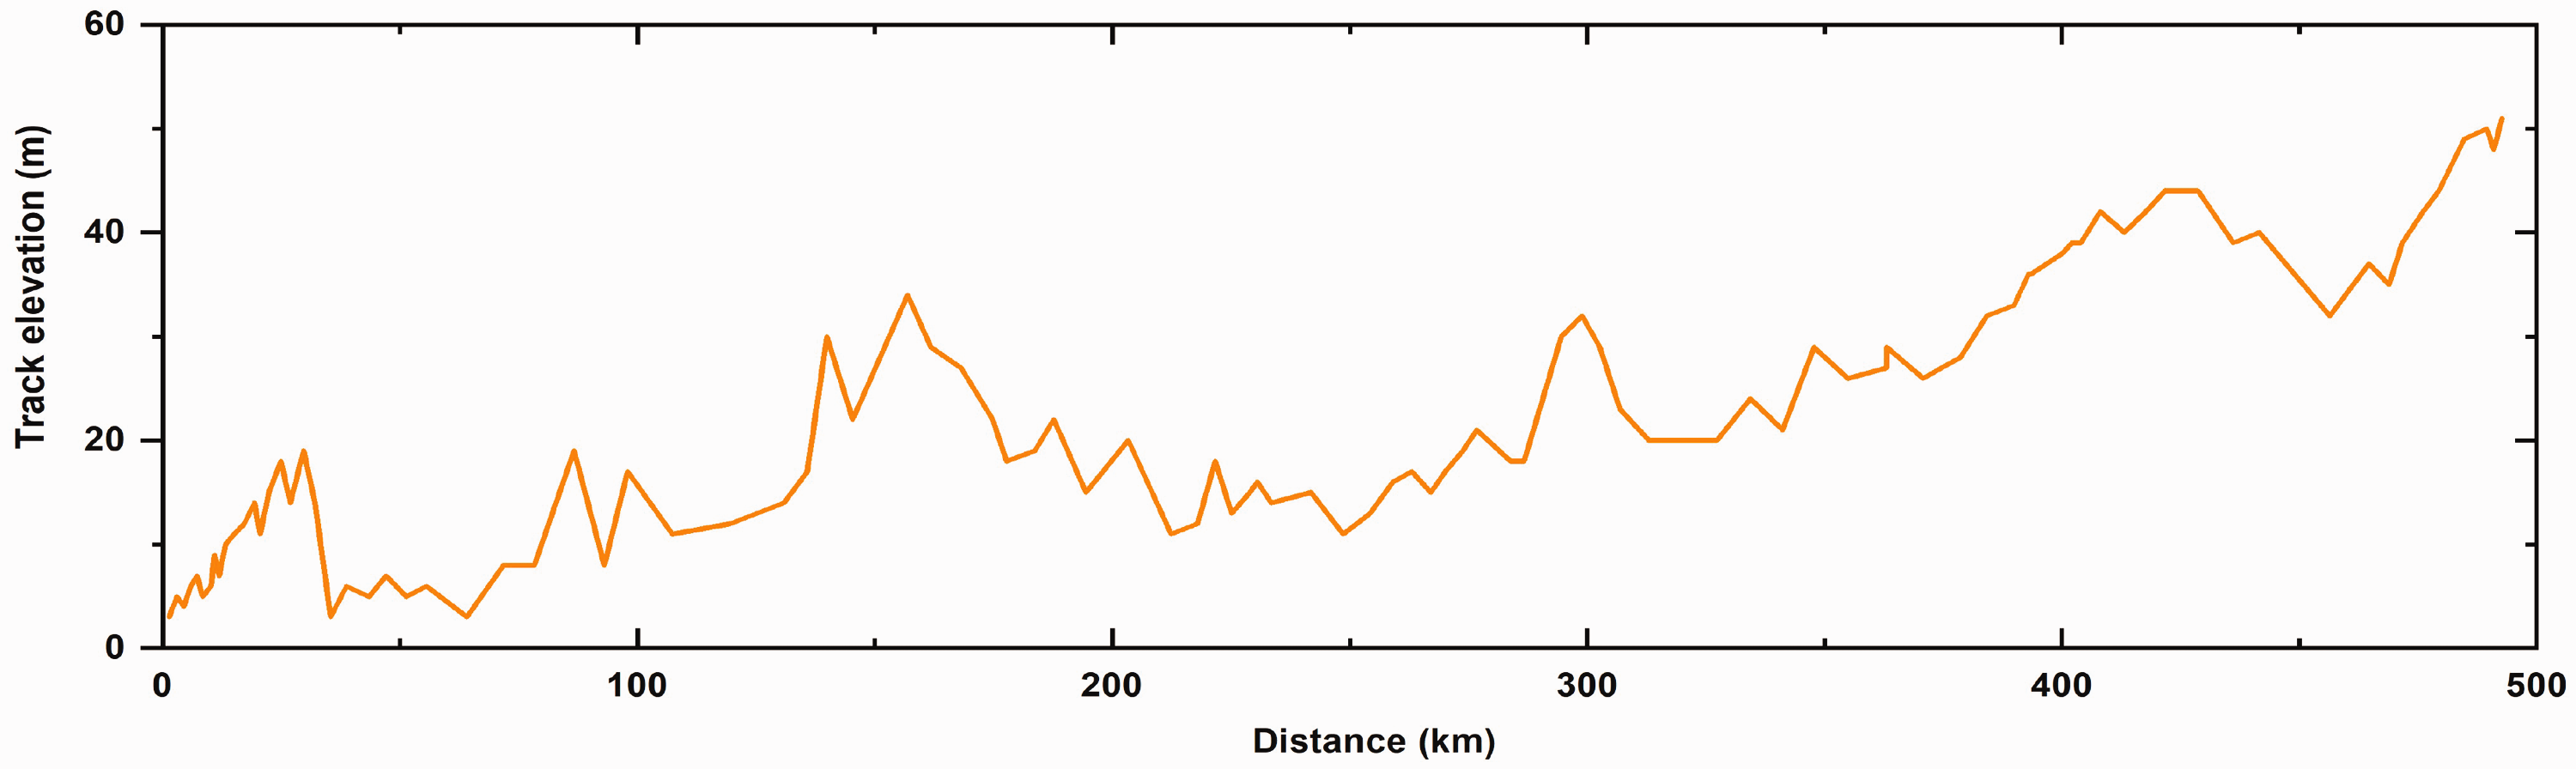
Track elevation of Mumbai to Ahmedabad track.
Numerical experimental validation
Comparison of multibody model and experiment analysis
Validation is done by comparison the universal mechanism model and experimental analysis conducted by RDSO (see Figure 9). In the trial, the acceleration and deceleration were carried out with a 24-coach, 1430 tonne passenger rake. In experimental testing, WAP-5 would take 287.9 s to hit 0–110 km/h and 535.2 s to reach 0–130 km/h, in comparison with WAP-5 with a universal mechanism of 287.9 and 535.2 s, respectively.
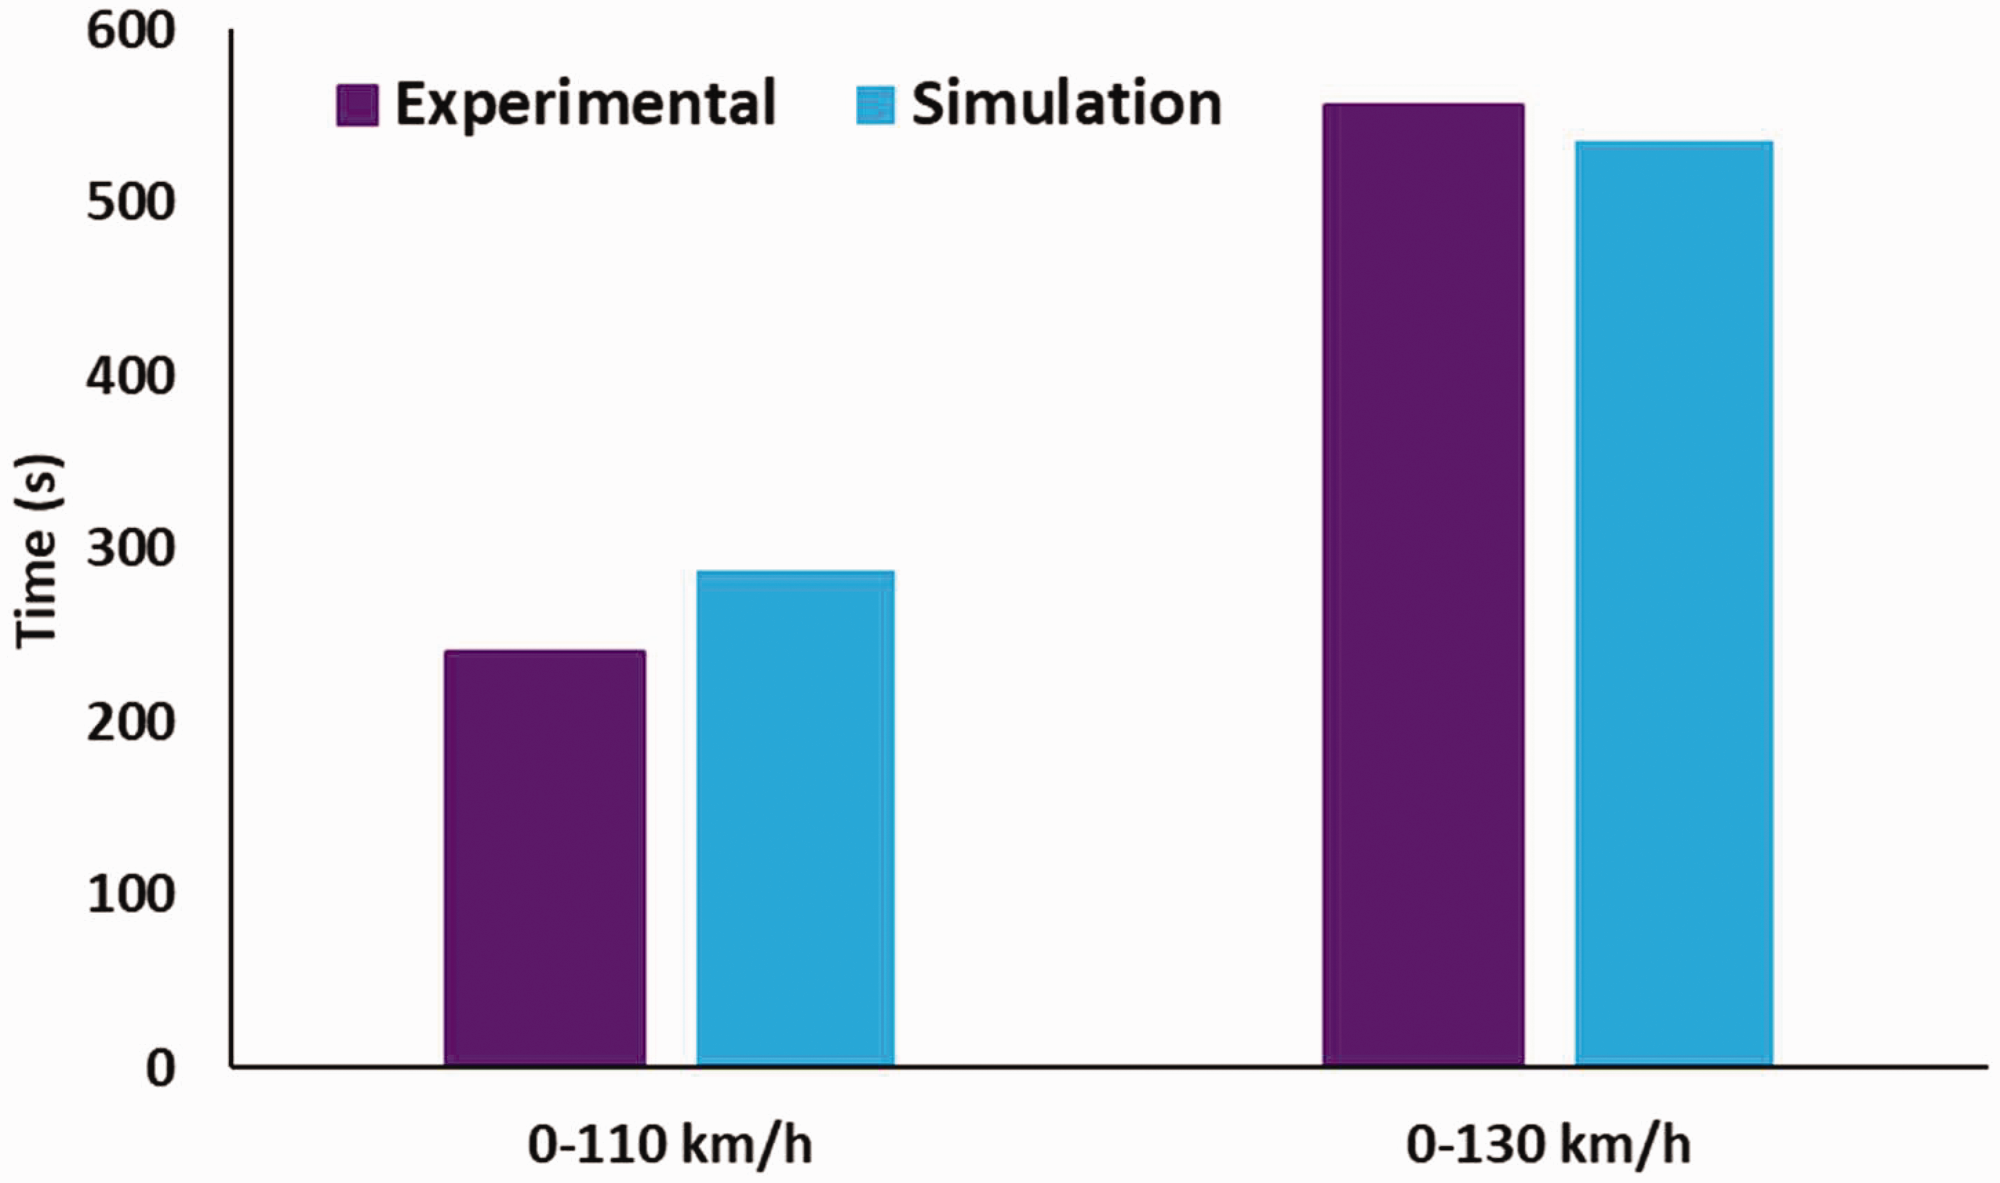
Numerical experimental comparison of Universal Mechanism model.
The disparity in the simulation study was largely due to the consideration of factors such as track irregularities in the x-axis and lack of consideration of factors such as suspension forces etc. This resulted in an ability to verify LTD simulations by comparative experiments, maintaining the conditions that RDSO has maintained in its test trail. The findings indicated that the observed data were well aligned with the simulated results. The variation in the result is mainly due the elements not considered to reduce the complexity of the mathematical model. This validated model is consider for further analysis.
Nonlinear damage accumulation analysis
IRSM-41 CORTEN steel is experimental testing to validate the NMCCMF model so that it can be further considered for the evaluation of carbody damage using a longitudinal load. A comparison of the fatigue life of metallic specimens subjected to multi-level uniaxial loads is also measured using the Wöhler model, the Leipholz model, the Chaboche model to validate the efficiency of the considered model (Zhang et al., 2018). Figure 10 shows the life predictions of the experimental analysis along with different damage models with SEM Image. According to the experimental results, the failure occurred in the center of the specimen's reduced portion, suggesting that no buckling deformations were present. The crack initiation took time to grow from the smooth-surface specimen, as shown in Figure 10. Following that, the crack developed at a particular fatigue crack growth rate, and the clamshell markings on the fatigue surface varied in magnitude, in this case, in relation to the stress phase scale. Finally, the catastrophic region, as shown by the specimens' rapid failure, can be seen. Other than a classic fatigue fracture caused by slip band dislocation, there is no evidence of a specimen defect or premature failure.
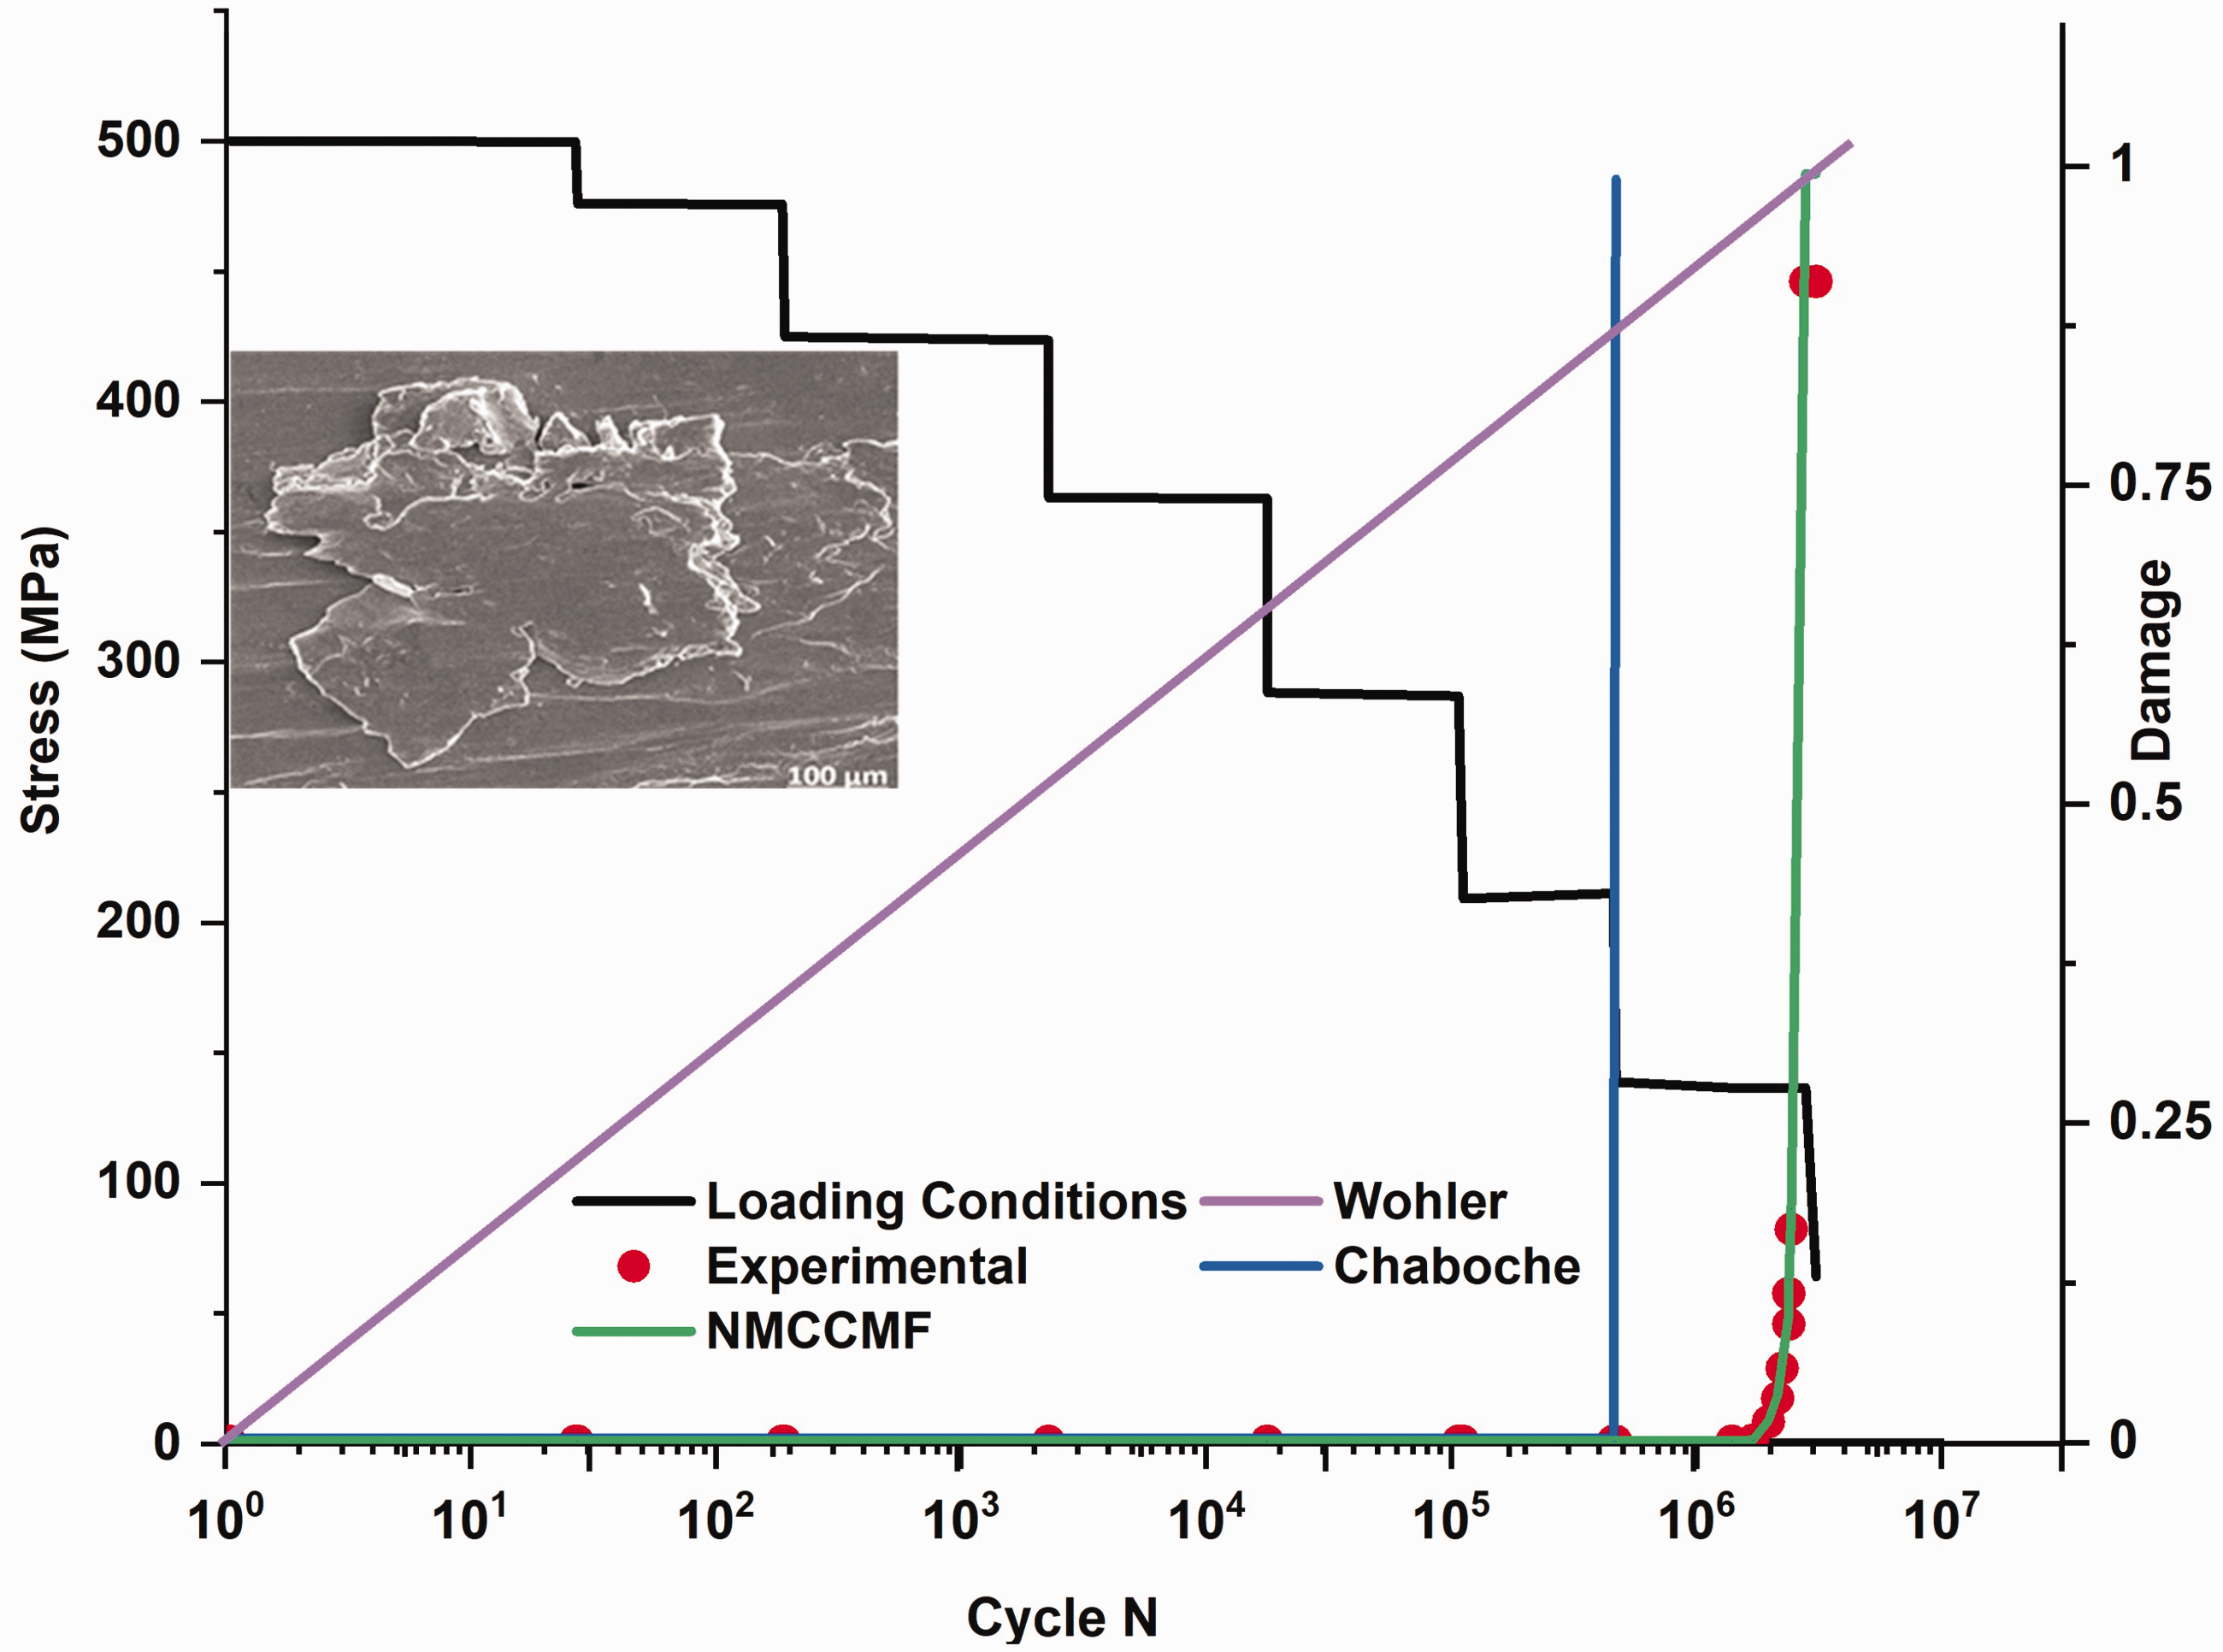
Life predictions of the experimental analysis with the different models along with SEM Image (Zhang et al., 2018).
The position of the fatigue crack initiation, which begins at the surface's edge, demonstrates this. Fatigue strength is determined by material structure barriers and is closely related to material physical damage. Loading mode, stress level, and environmental effects all have an impact on these barriers. The Wöhler model (with S–N curve) gives the longest life forecast with the lowest precision, while Leipholz's model has better outcomes, but the forecasts are still over-optimistic. To cope with low-amplitude loads, the Chaboche model is updated by adding a strengthening factor and a fuzzy membership feature. The amplitude of load is used to determine if the loading interval can be included in damage accumulation using the fuzzy membership function (Zhang et al., 2018). The damage accumulation is then multiplied by the strengthening component, and the extension impact of the low-amplitude load on fatigue life is applied.
The comparisons between different fatigue models and experimental results are shown in Figure 11. The relative error is 48.64%, 26.87%, 16.59% and 8.64% for Wöhler, Leipholz’s, Chaboche's, and NMCCMF Model compare to the experimental result, respectively. The NMCCMF model predicts the experimental outcome very closely. Hence NMCCMF model is further considered for fatigue evaluation of the carbody.
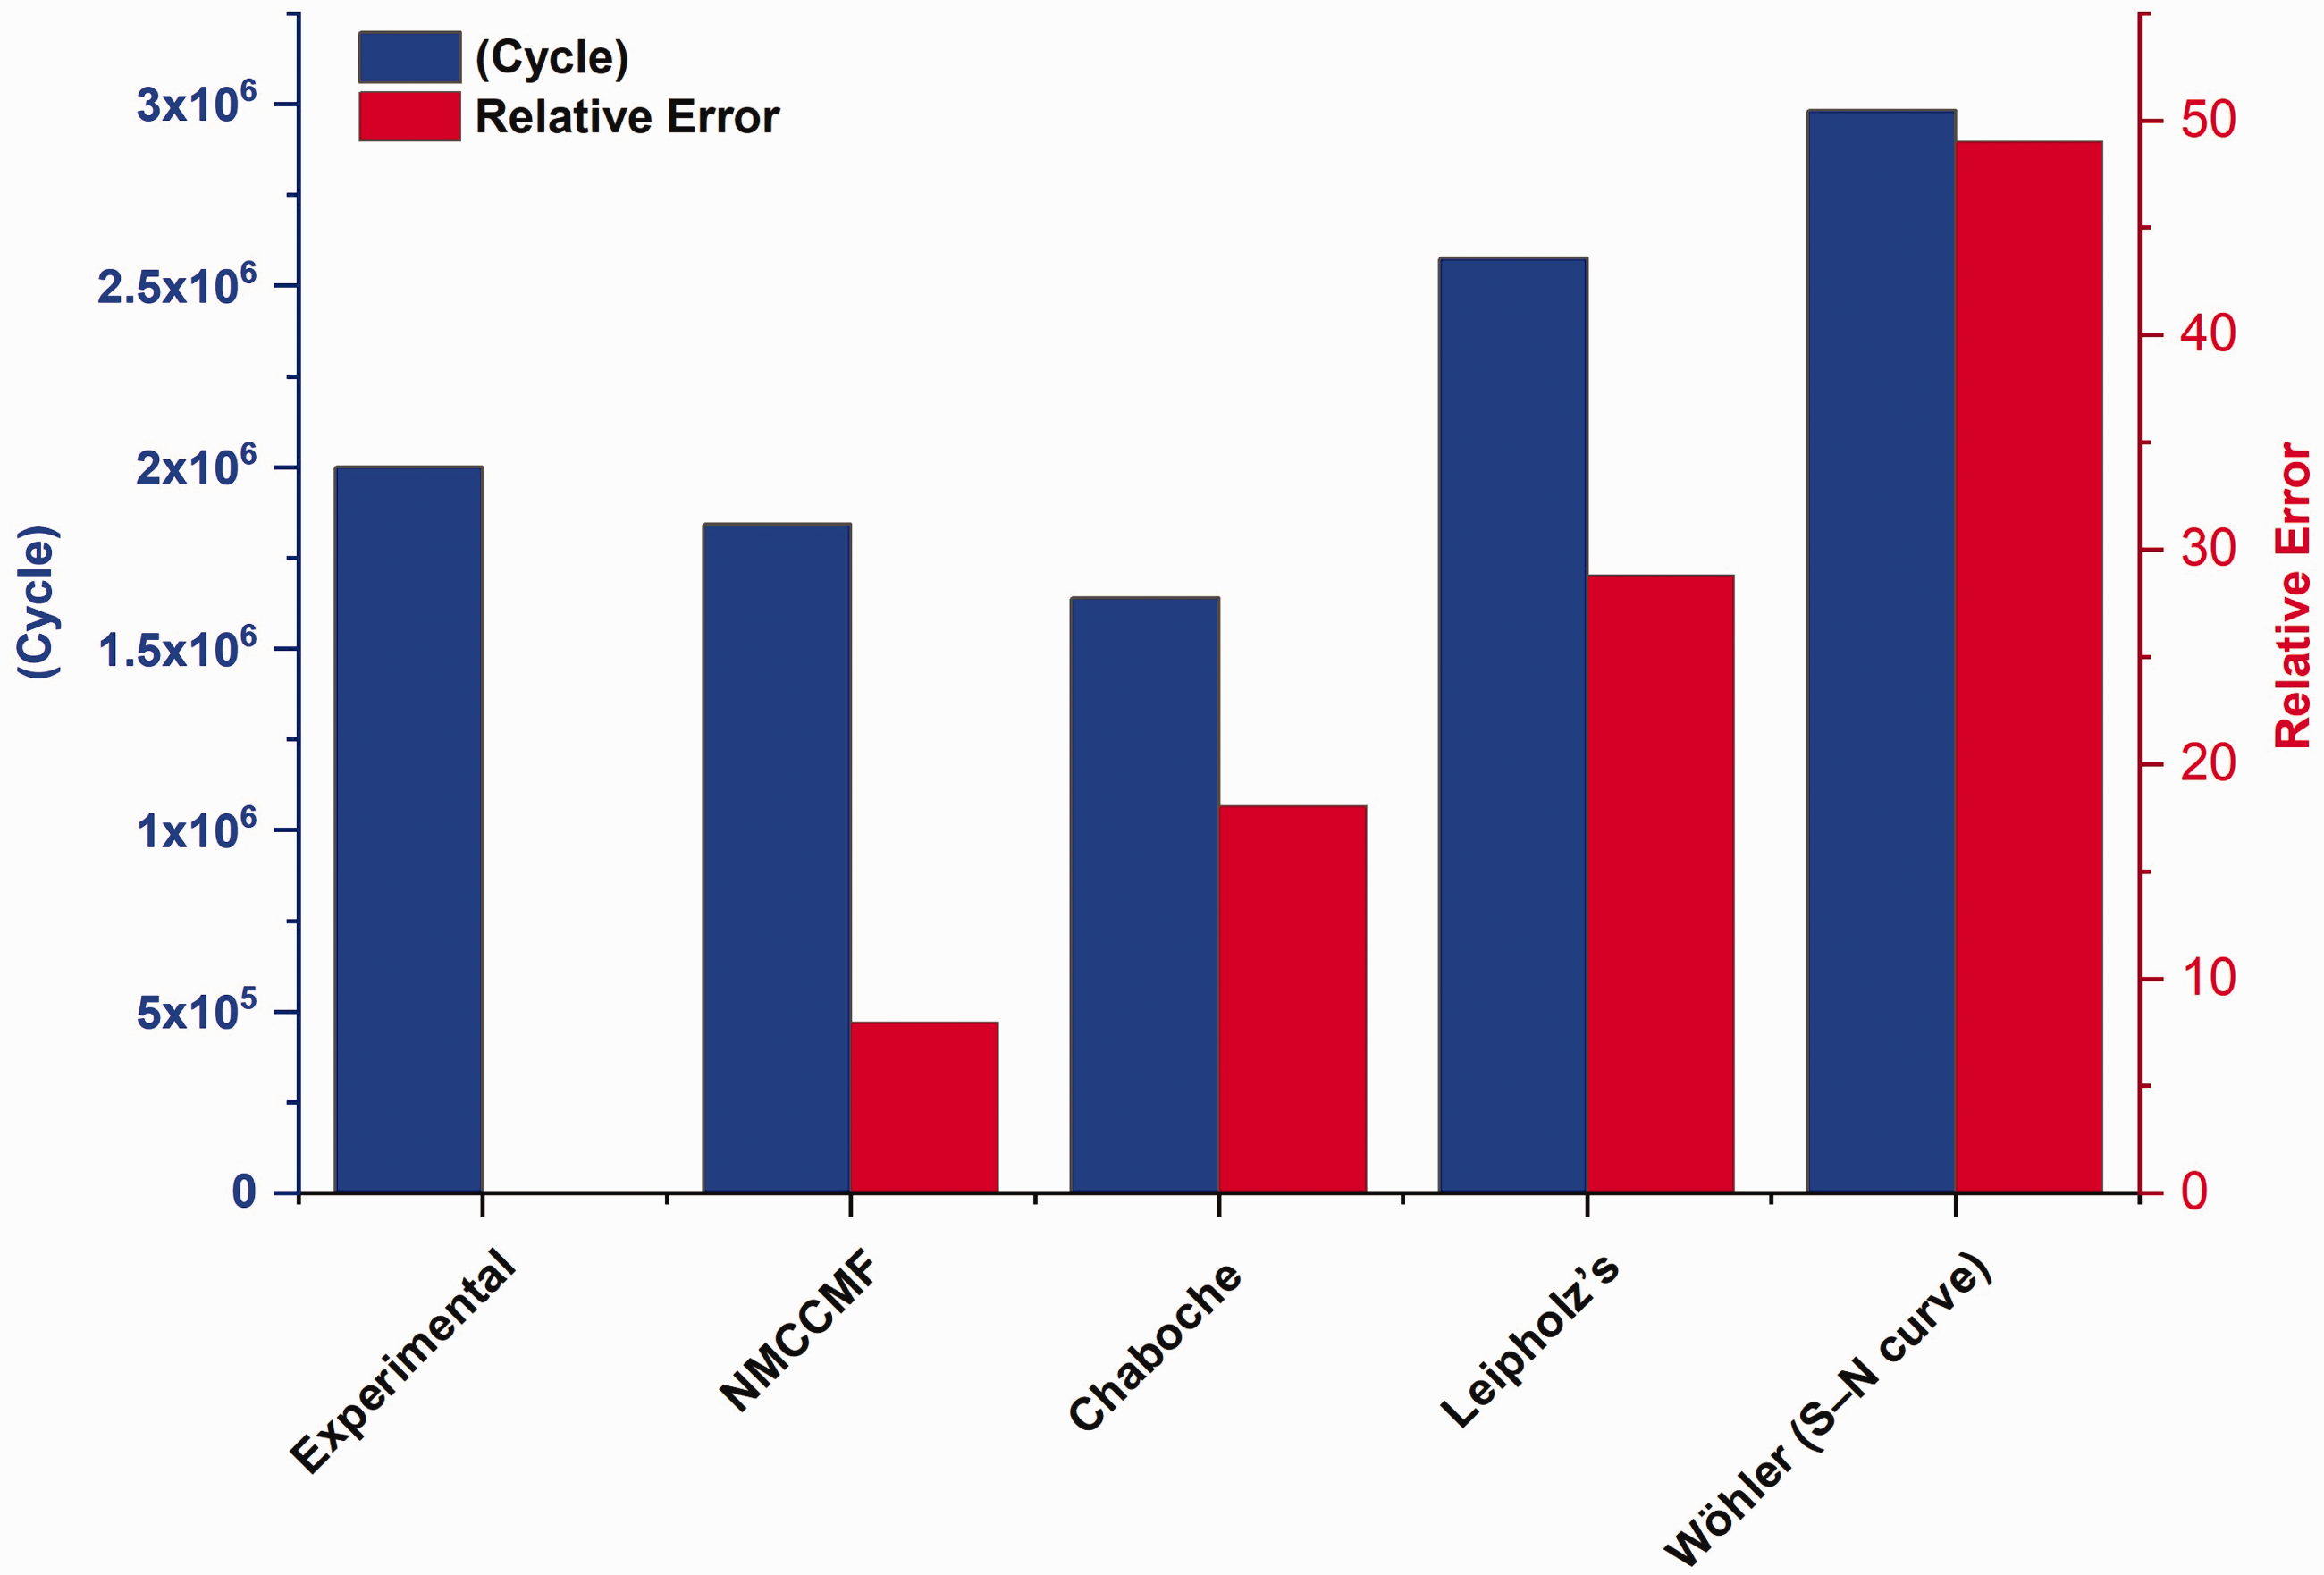
Comparisons between different fatigue models and experimental analysis.
Result and discussions
In this article, the carbody is modelled by means of the commercial finite-element software ANSYS (Lu et al., 2020). Finer meshes are used to prevent any possible stress concentration effects. Orthotropic shell elements represent the corrugated plate. Non-structural masses, such as equipment and furniture, constitute about two thirds of the total mass. In this analysis subspace method clubbed with preconditioned conjugate gradient (PGC) solver consider because this method is used for large models up to 10,00,000 degrees of freedom (DOF). The FE model has 543737 nodes and 268393 elements, such as shell63, mass21, and combin14 elements (Figure 12). Meshing checking is done by orthogonality test and Skewness quality. A mesh with quality metrics was generated. Of the many metrics orthogonal quality, aspect ratio, and skewness were given special attention. Statistics of the orthogonal quality for the passenger coach gives a major (approximately 70%) of the total elements lie in the ‘very good’ zone followed by remaining (approximately 27%) in the ‘good’ zone and a meagre amount (approximately 3%) in the acceptable zone. A very negligible amount of elements fall in the ‘bad zone’, i.e. from 0.01–0.001. Since, there are no elements in the ‘unacceptable zone’ of 0.001–0.00 as the minimum value obtained is 0.0117, thus the mesh quality has passed the orthogonality test.
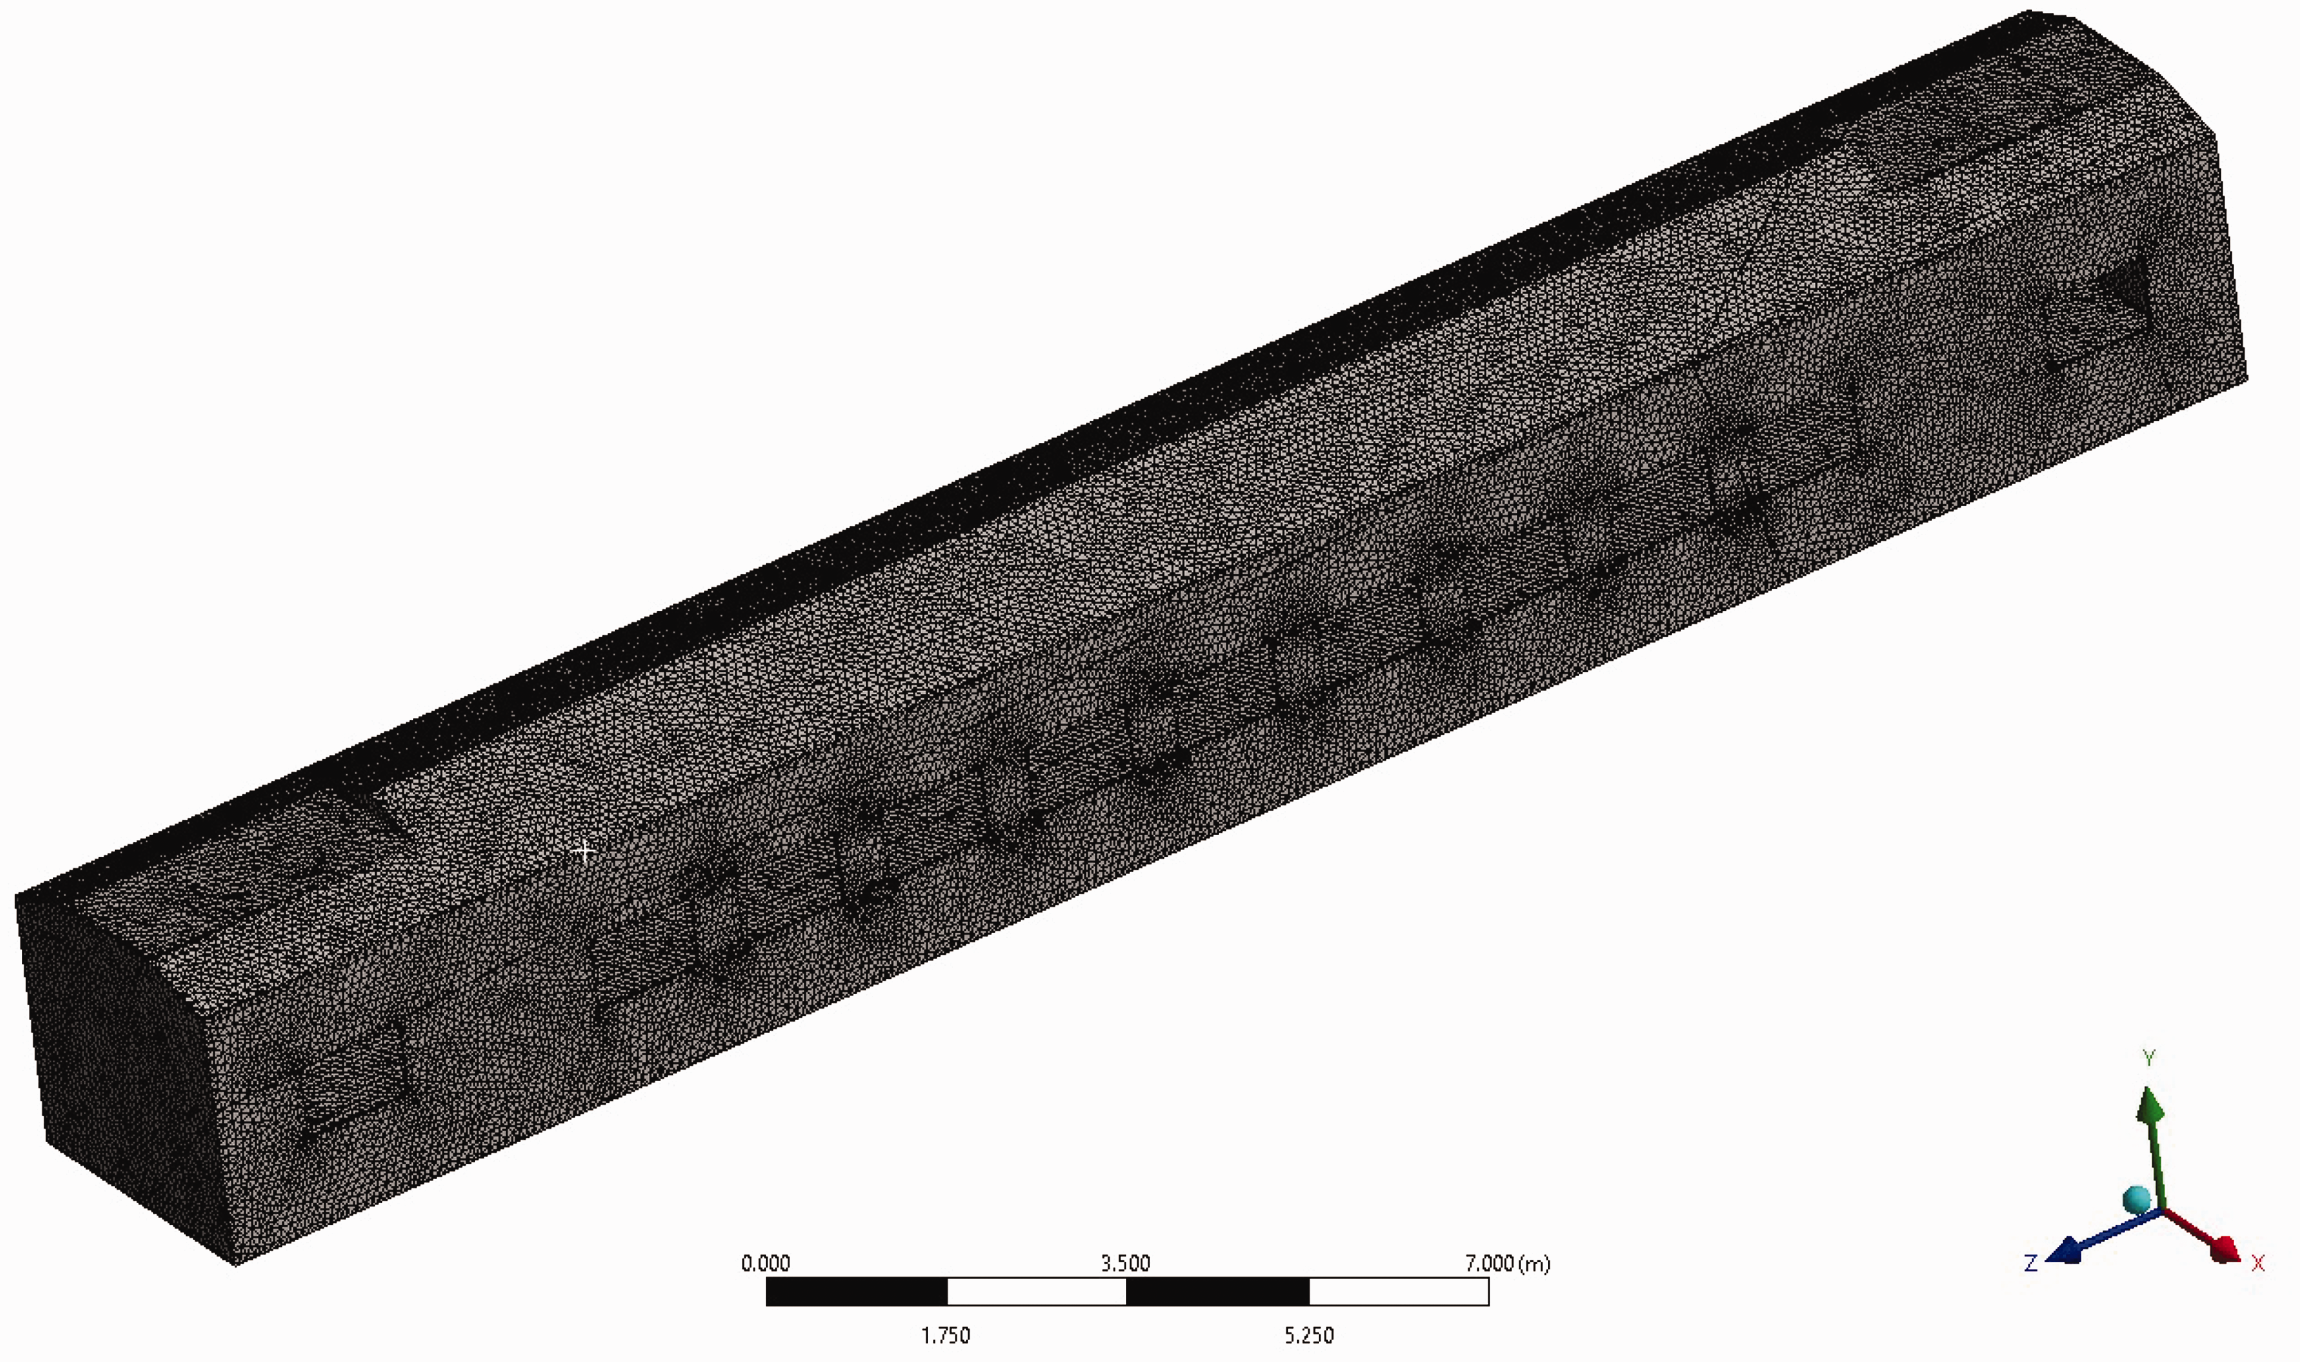
FEA mesh model of passenger carbody.
The Skewness quality of the discretized elements is expressed in terms of the percentage of volume/area of the total elements. The Skewness quality of nearly 50% of the elements is ‘excellent’ whereas nearly 28% of the elements have ‘very good’ skewness quality, followed by nearly 12% with a ‘good’ skewness quality tag. Nearly 9% are tagged as ones with ‘acceptable’ quality level. A mere 1% fall in the category of ‘bad’, there being extremely negligible elements with ‘unacceptable’ level ‘1’. Thus the Skewness quality of the elements is to be hailed. The fatigue of the carbody was investigated using structural vibration fatigue analysis. The dynamic stress time history of each node is obtained by first calculating the mode of the carbody with maximum loading, and then using the modal response as an excitation. Then, the carbody damage is evaluated by combining dynamic stress with NMCCMF theory.
Modal analysis of carbody
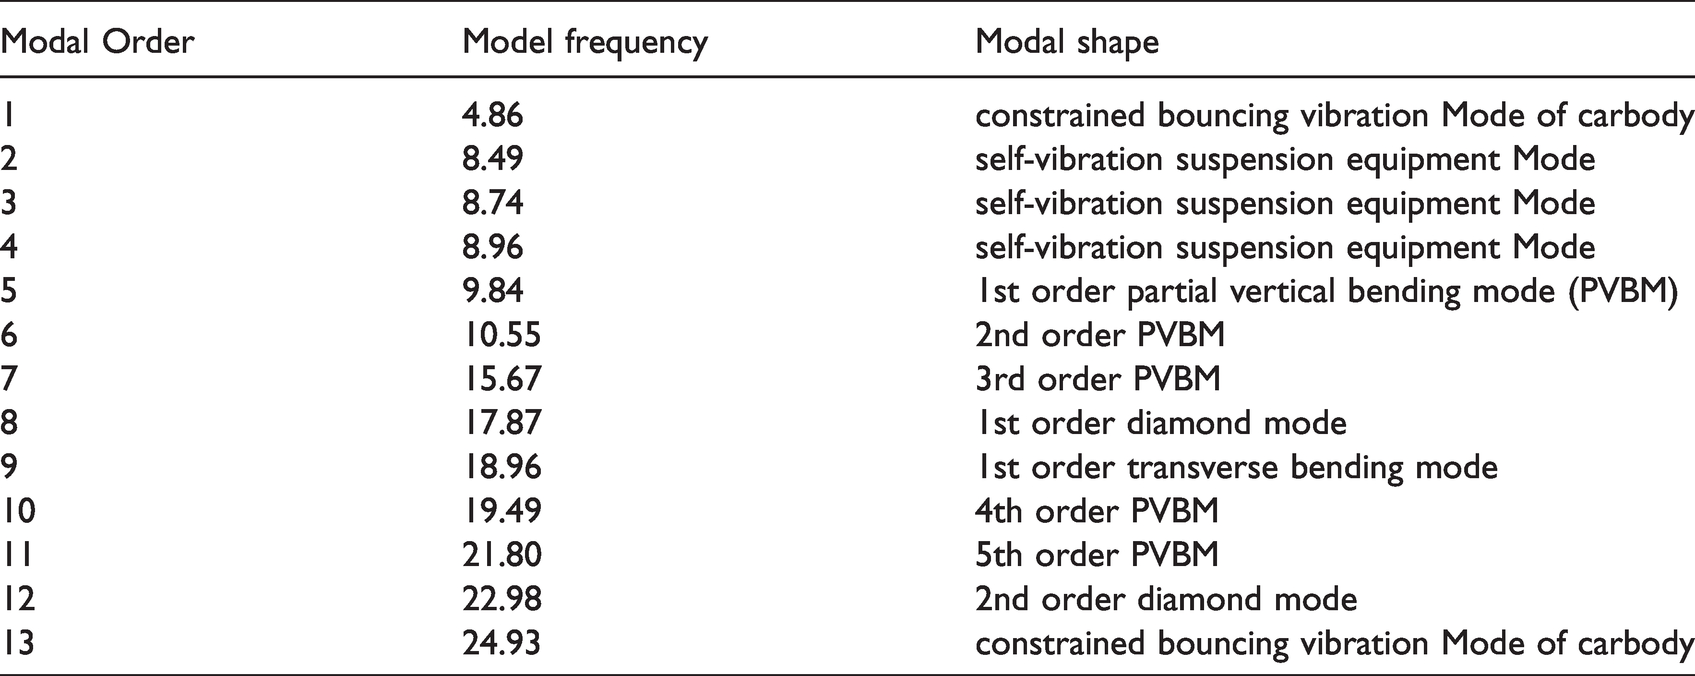
The carbody modes of the adjustable suspension equipment are determined in this article and Table 3 depicts the modal shapes corresponding to the modal frequency. Partial modal forms are depicted in Figure 13. From the details in Table 3, it can be shown that the frequency of self-vibration of the vehicle suspension device is 8.49 Hz. The modal shapes show that the suspension equipment's self-vibration doesn't resonate with the car body modes. The carbody vertical bending frequency is greater than 10 Hz, which complies with RDSO architecture specifications for carbody dynamics. The undercarriage on the passenger coach of the train is primarily comprised of longitudinal beams and profiles, leading to more localized modes at the car body's frame.
Model Frequencies and modal shapes of carbody.
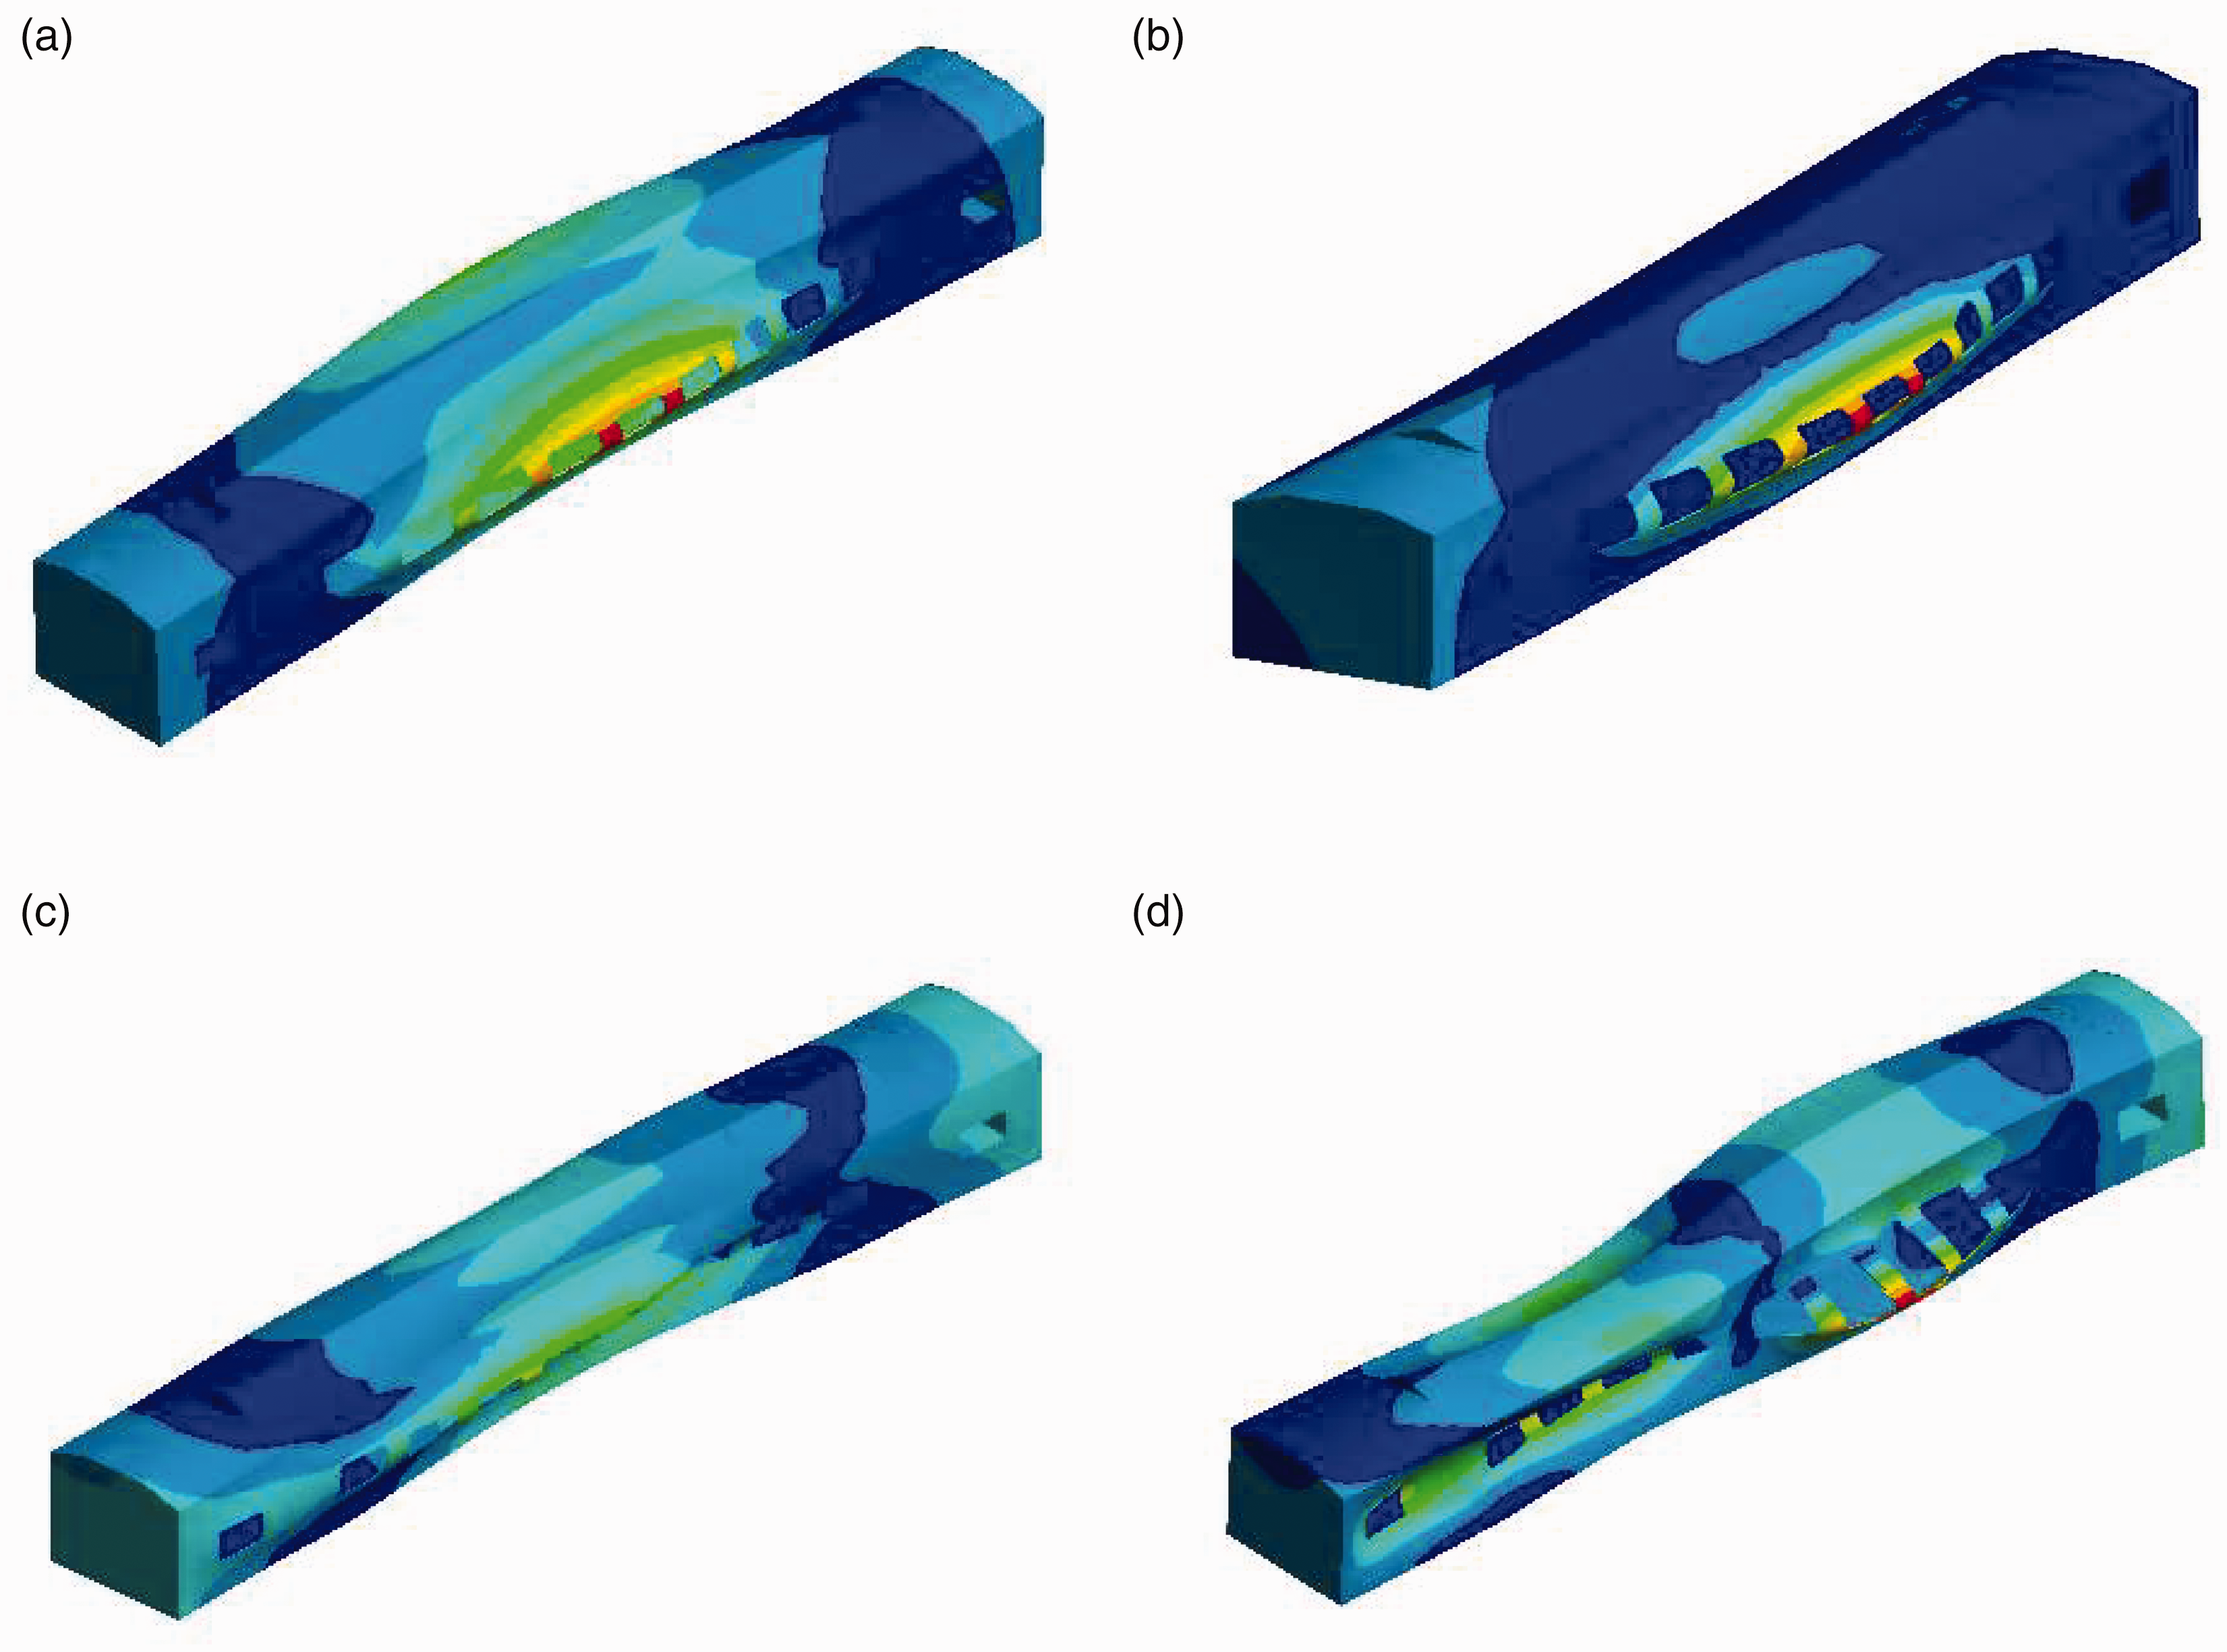
Modal shapes of carbody (a) 1st order partial vertical bending mode (b) 2nd order partial vertical bending mode (c) 1st order transverse bending mode and (d) 1st order diamond mode.
Investigation of Dynamic stress response
From the modes of carbody, the modal shape matrix 
The modal displacement response can be derived from the literature, (Sharma and Kumar, 2017). Then the stress response can be obtained according to the modal superposition equation (9)

Fatigue damage calculation
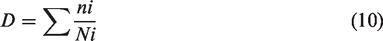
For calculation of carbody damage dependent on the material content or the S–N structural curve, an NMCCMF model is used. When the structure is cycled several times in a stress range, Damage will be produced. Equation (10) defines the amount of damage caused by this operation. When D = 1, it is commonly assumed that the structure would fail (Lu et al., 2020).
Carbody fatigue damage due to longitudinal load
The longitudinal load is applied to the carbody for calculating the damage using finite analysis. It has been also used to obtain the modal superposition factors. (Ferhatoğlu et al., 2016, 2018). The longitudinal load effects to fatigue damage are evaluated and compared. The primary 8 points with the biggest structural damage are selected as the focus points, and distributed on the right and left sides of the carbody. Figure 14 shows the distribution schematic of the concerning points on the left side. The distribution of the points of concern on the right side of the carbody corresponds one-to-one with the left side. Figure 15 shows fatigue damage considering the longitudinal load of a carbody (a) Meshed model (b) concerned area and (c) Capped isosurface isolines.
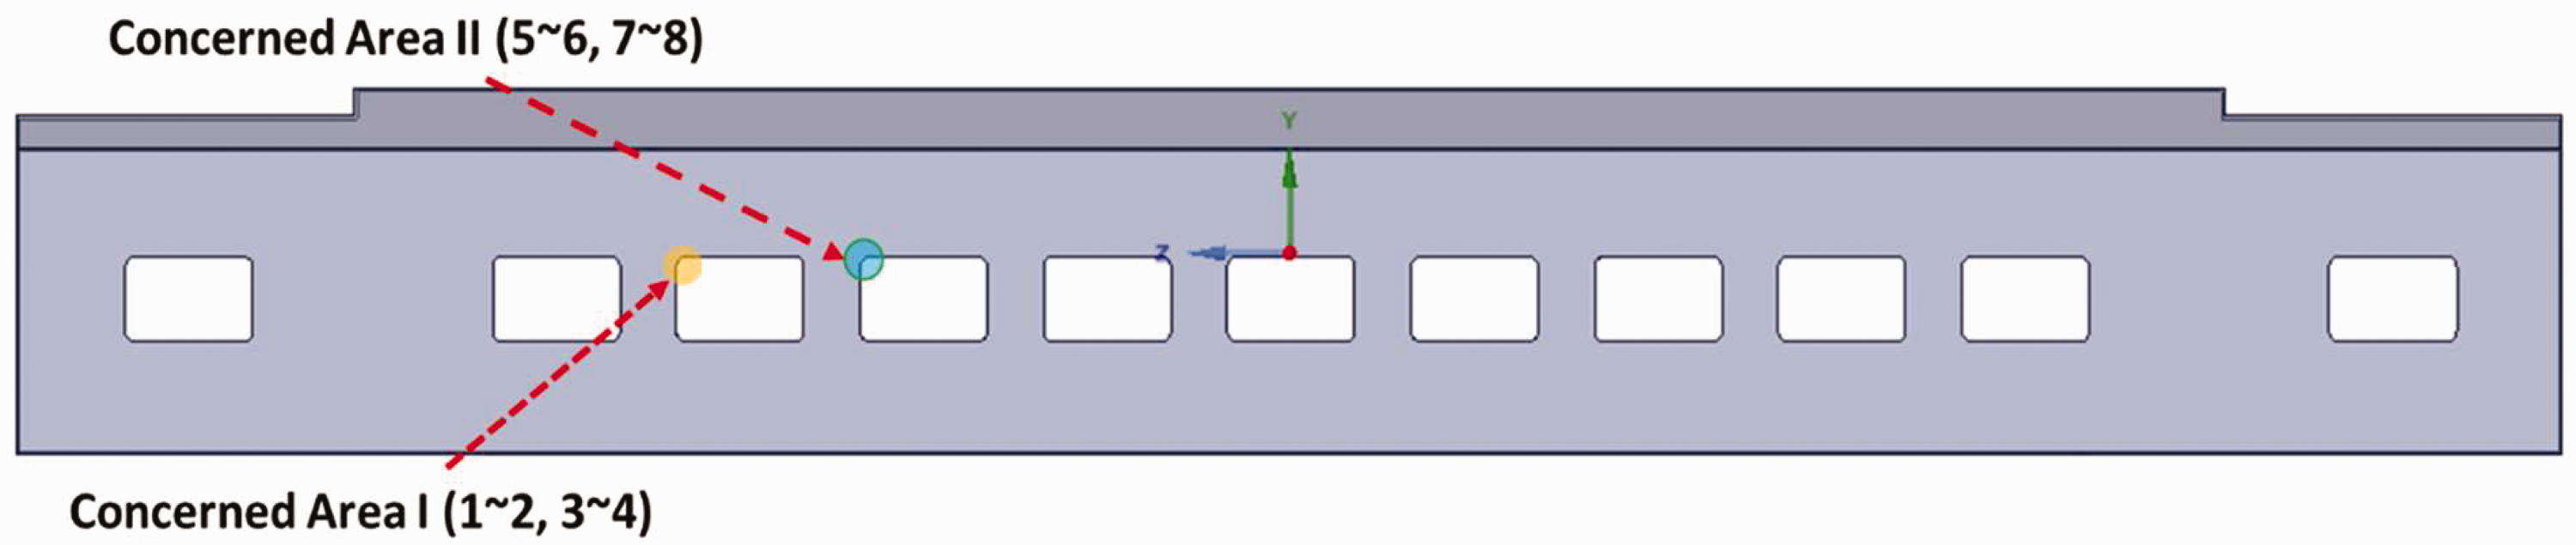
Concerned point of distribution of carbody.
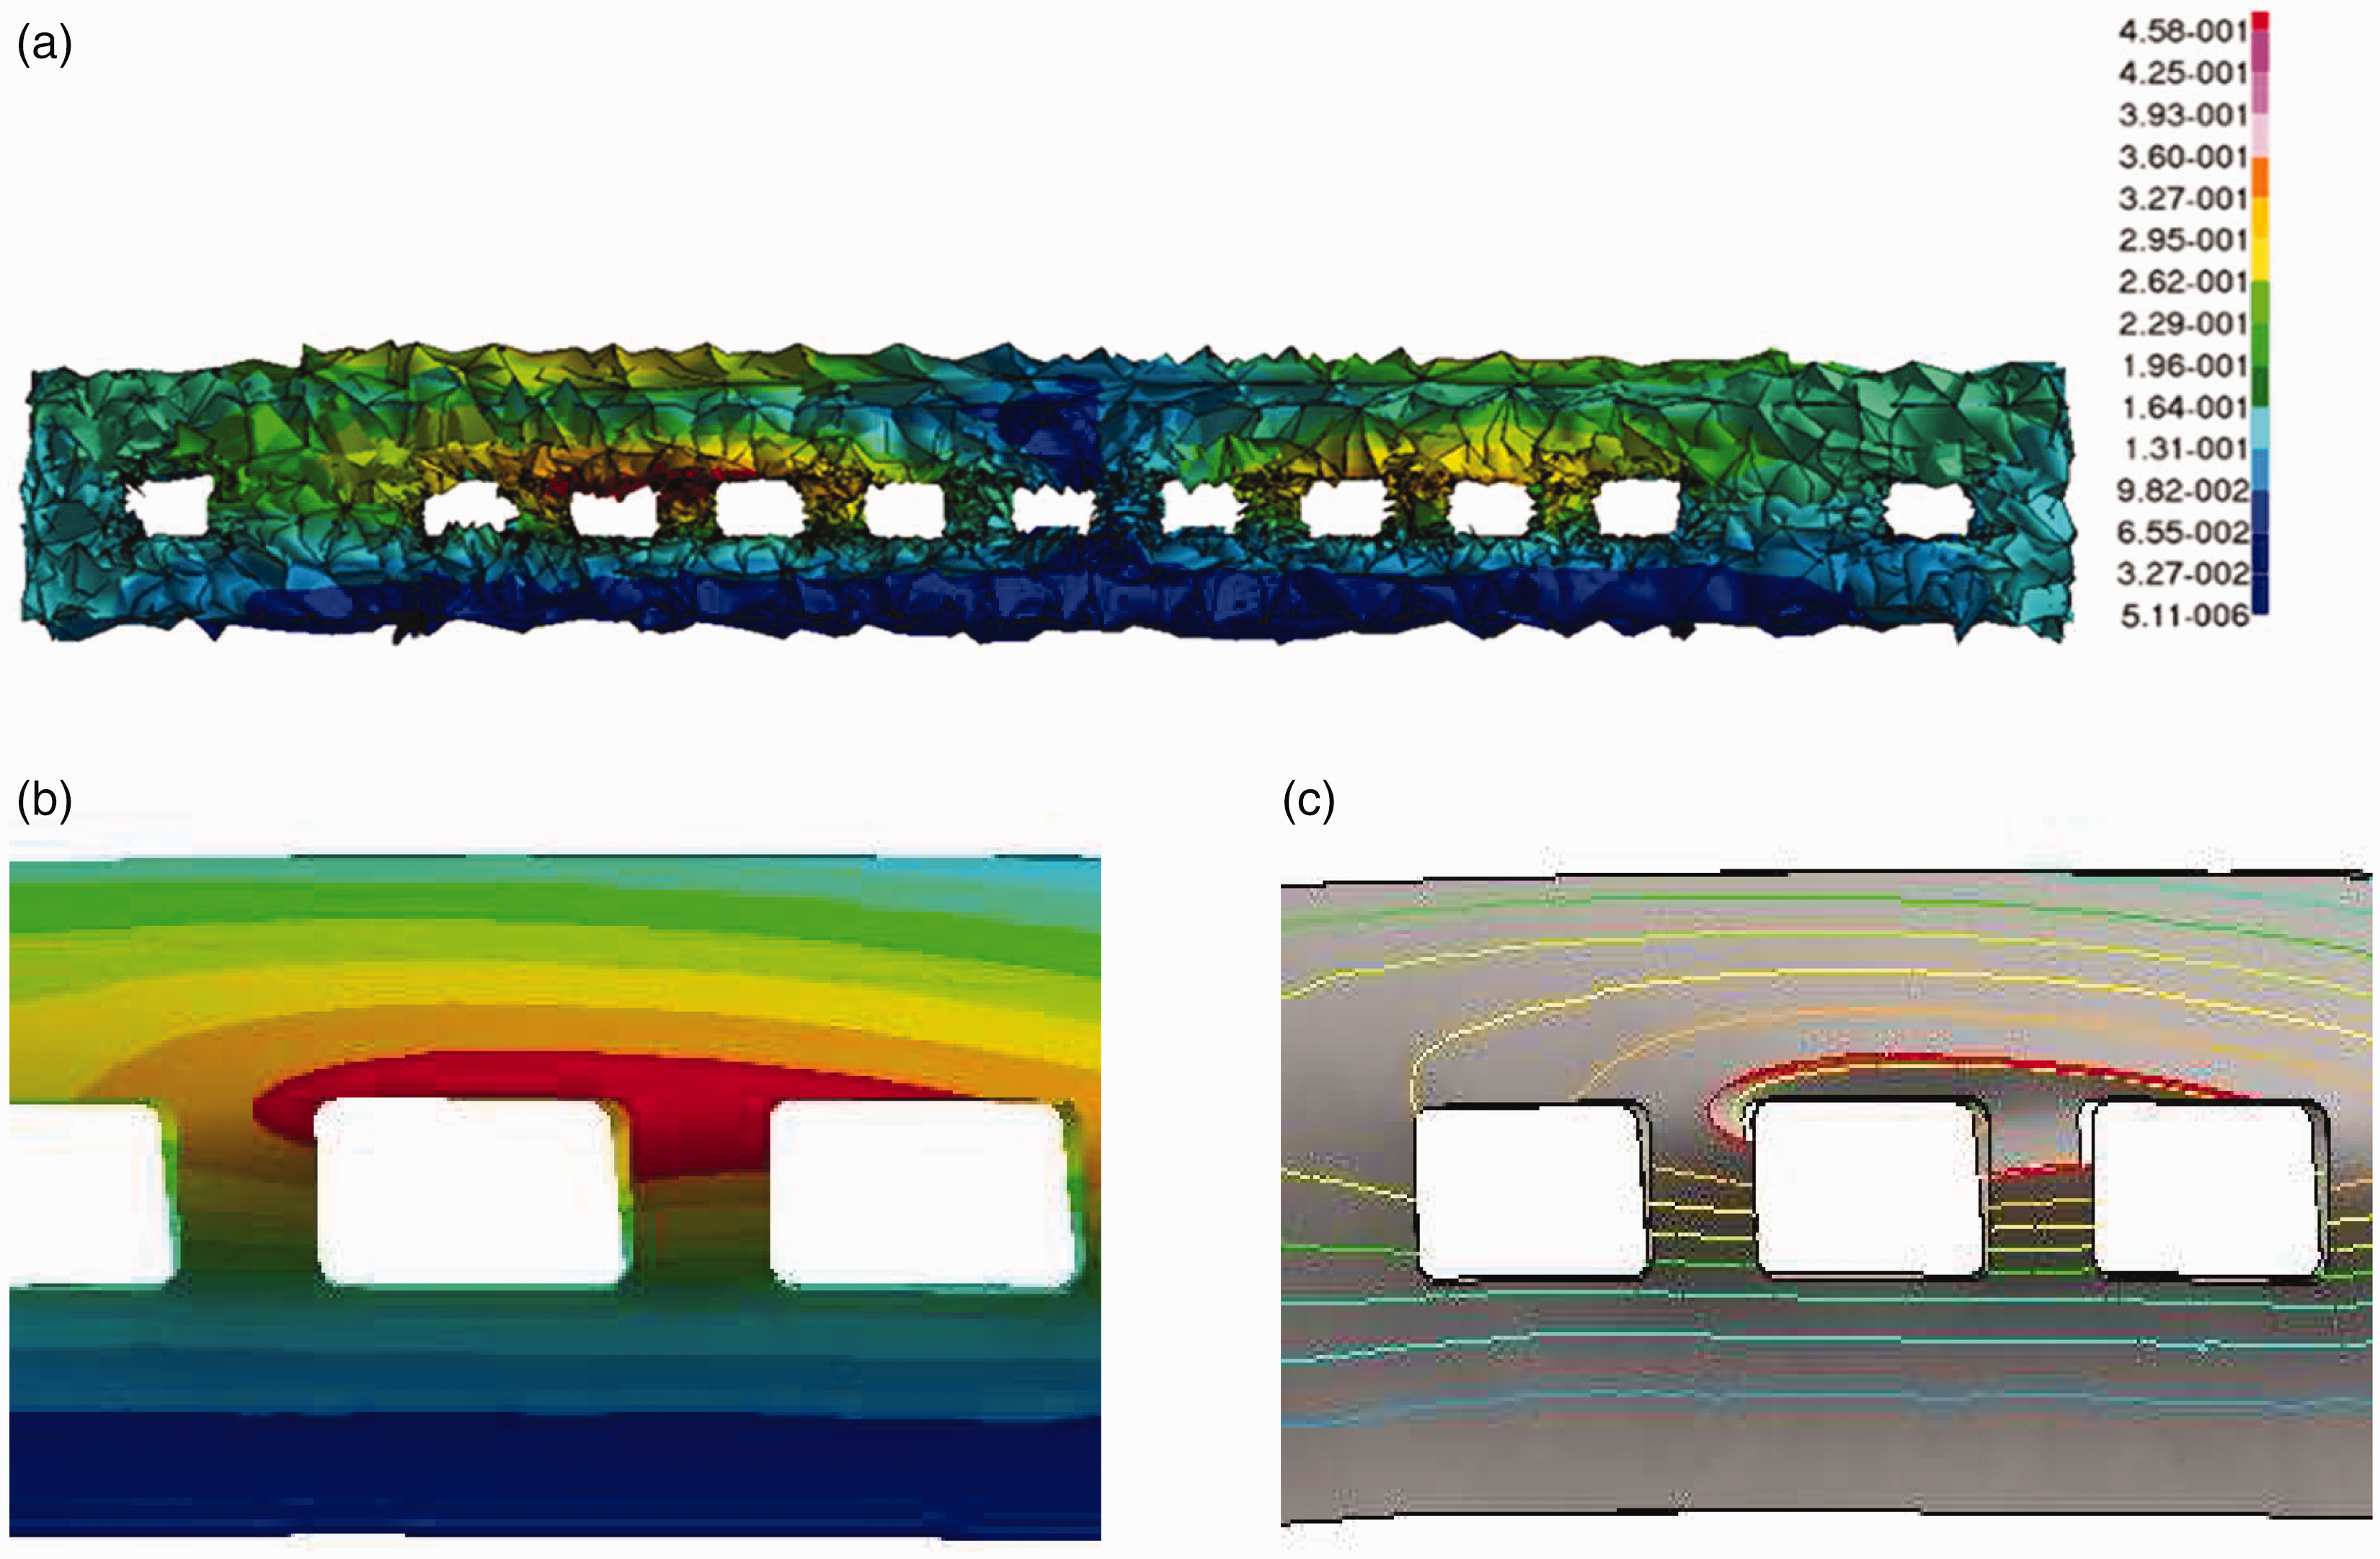
Fatigue damage considering the longitudinal load of a carbody (a) Meshed model (b) concerned area and (c) Capped isosurface isolines.
Figure 16 depicts the two varieties of fatigue damage i.e., carbody damage (Loading and Unloading longitudinal load) and error analysis (absolute and relative error) at the concerned point. For the Concerned area I, the relative error is about 42.44% to 42.70%. Similarly, for concerned area II, the relative error is about 41.78% to 41.94%. It can be observed that fatigue damage in a concerned areas I and II is significantly larger. This is due to the effect of the mode shape that the local mode shapes of the partial mode appearing at area I and area II.
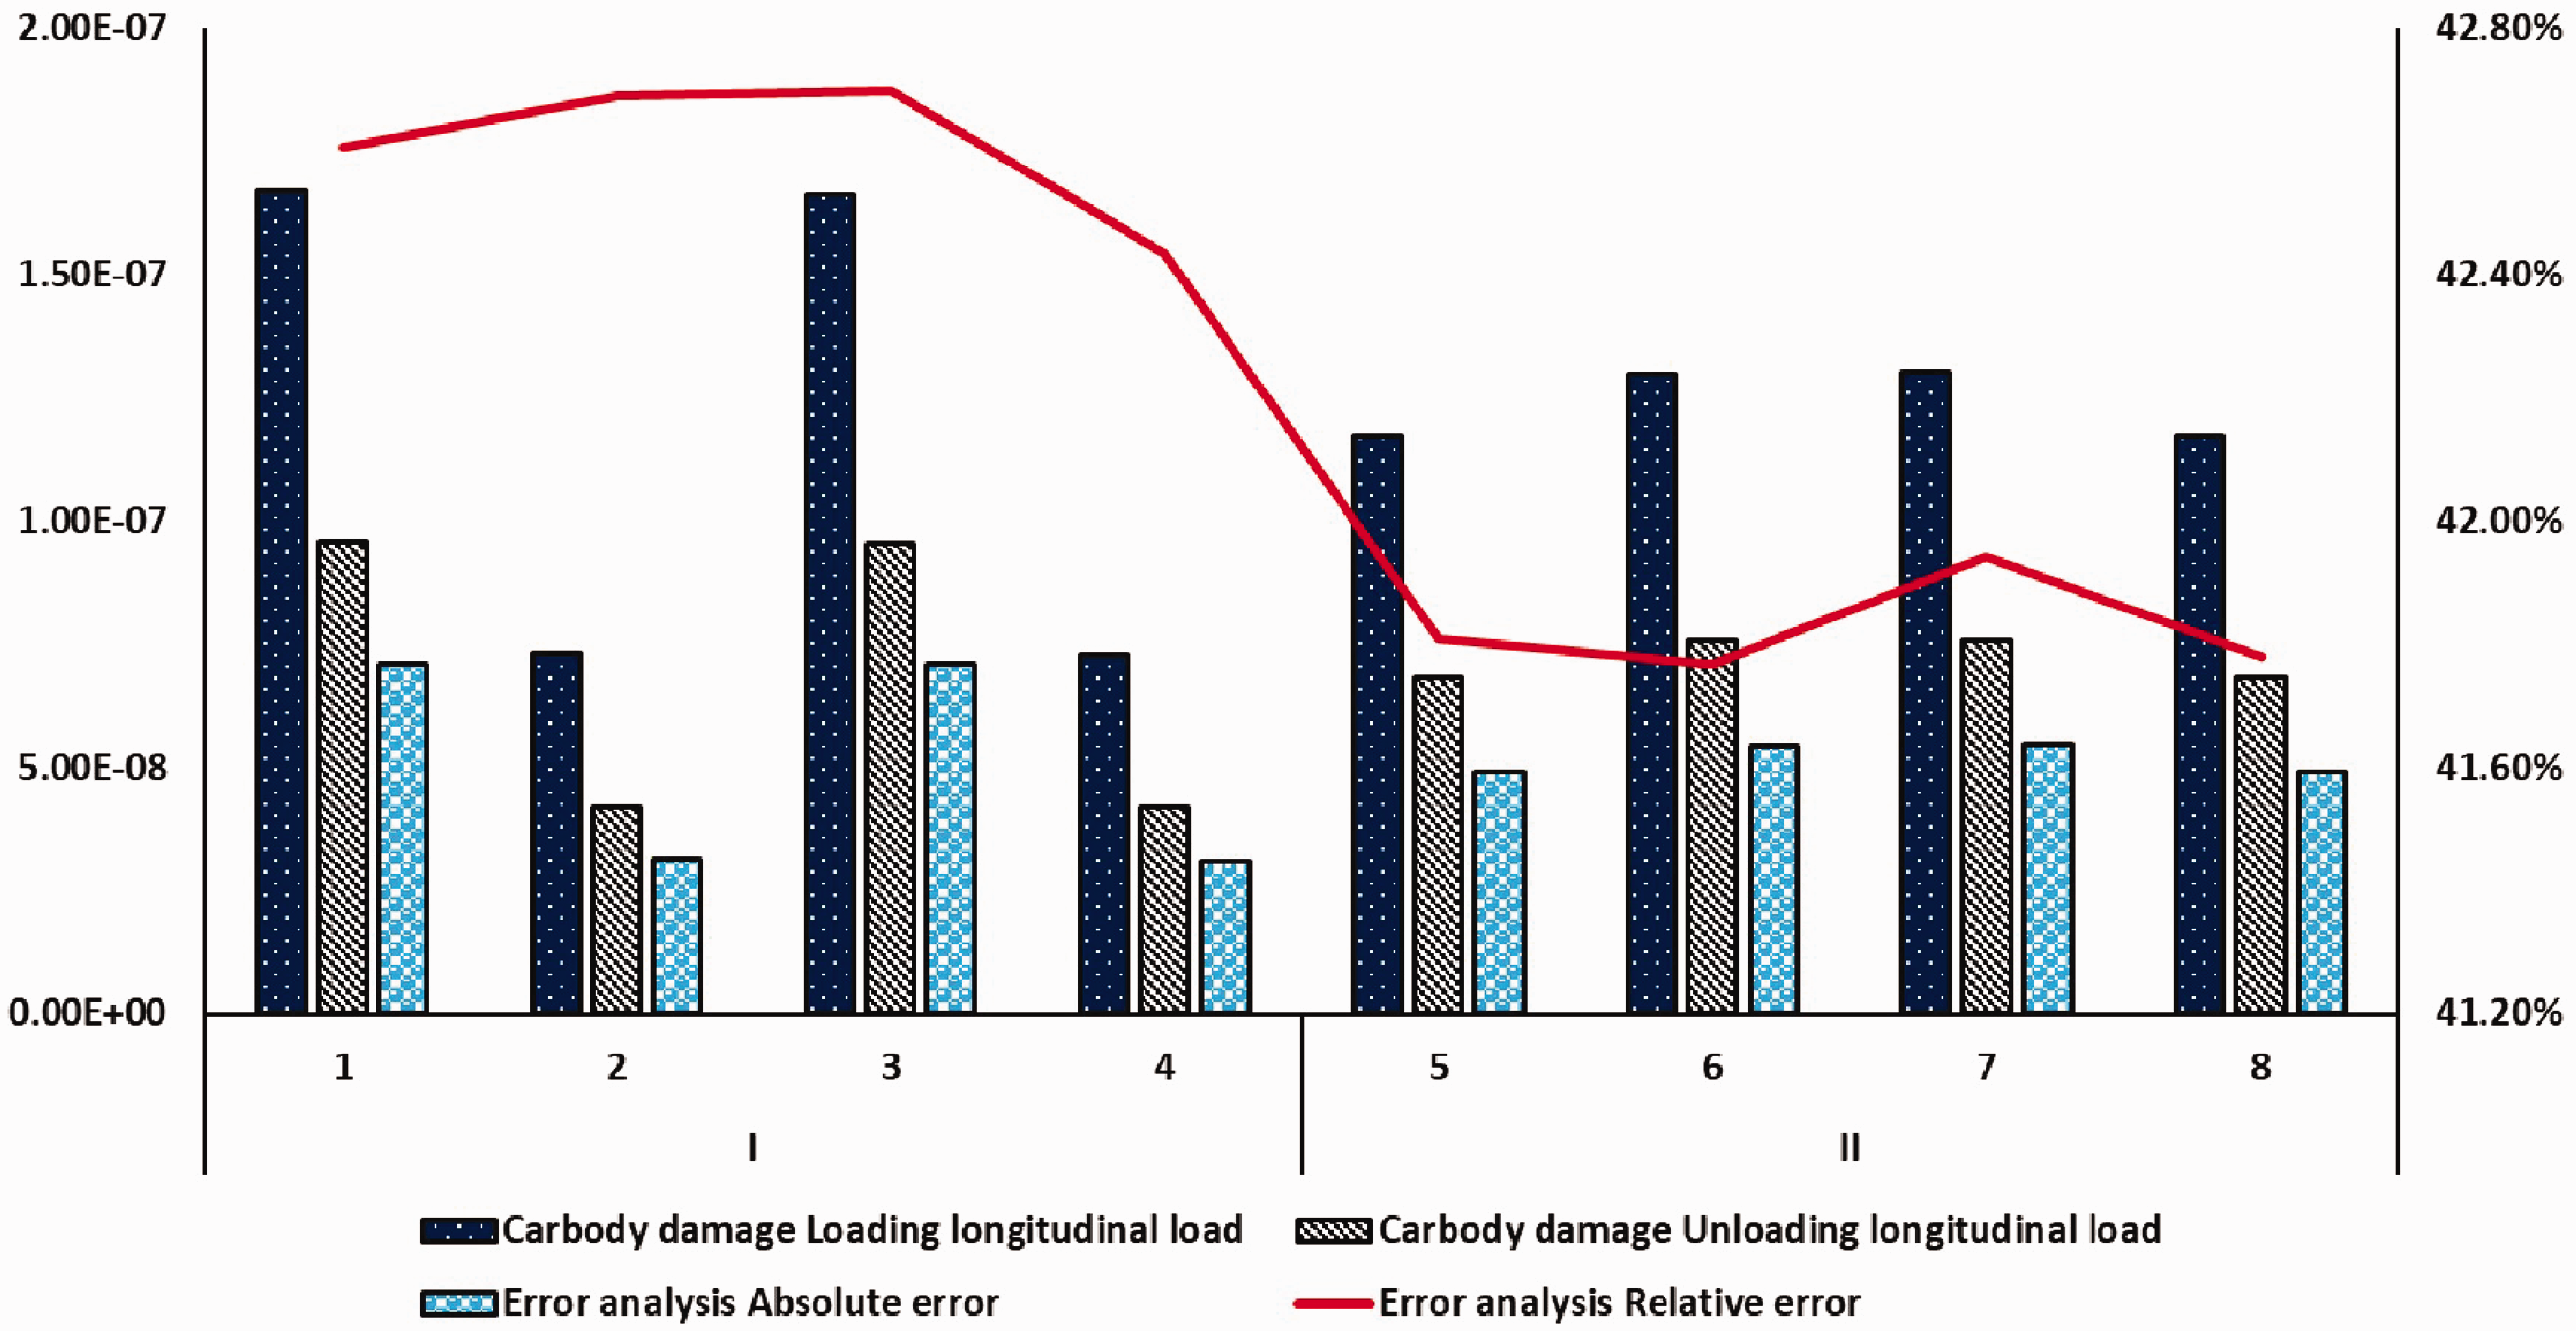
Carbody damage load and error analysis.
The damage accumulation rates (See Figure 17) of the NMCCMF model are small for the first 150,000 cycles because of the strengthening effect and the damage caused by the low-amplitude load is very slight in the early stage of fatigue with low initial damage. Beyond 160,000 cycles, the damage started, and at 189563 cycle damage values go to 1. Generally, the fatigue damage of a carbody increases significantly when the longitudinal load is considered. So, it can be analyzed from the above results the longitudinal load has a huge impact on the fatigue damage of a carbody.
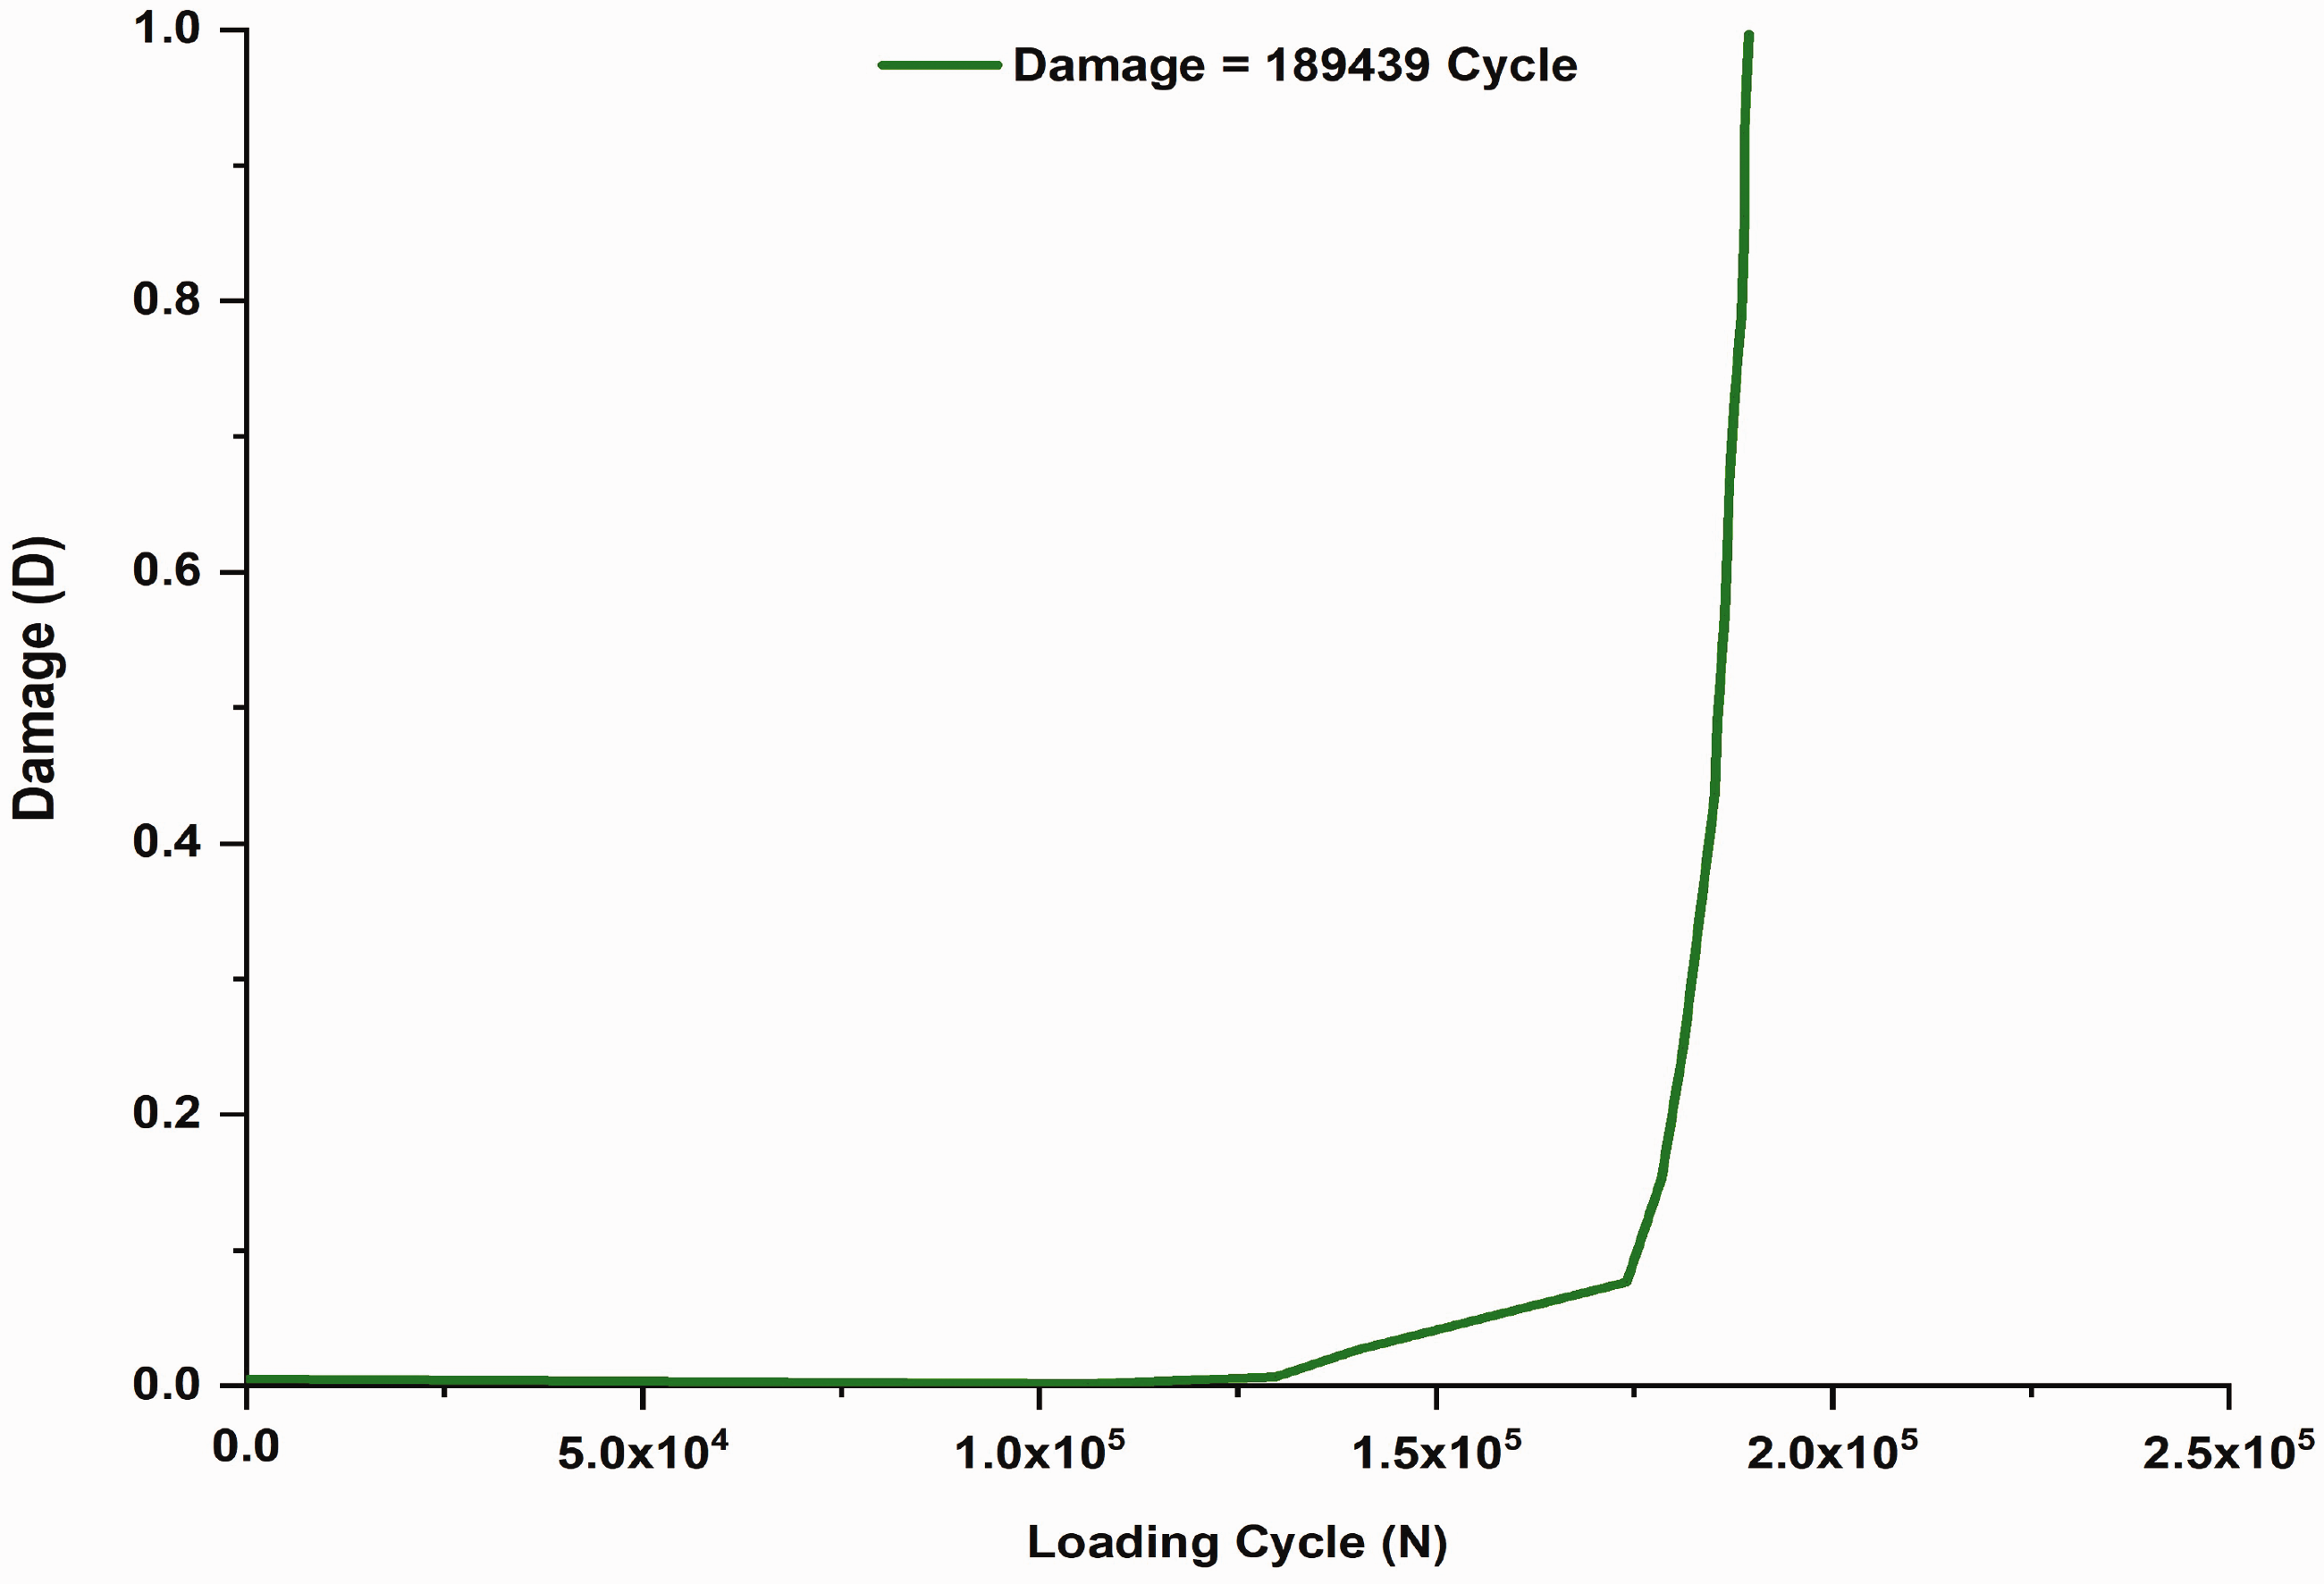
Damage accumulation rates of the NMCCMF model.
Conclusion
In this article, the longitudinal load of the carbody is calculated based on the traction and braking characteristics of the locomotive. The mode is calculated, and then the modal response is used as an excitation to obtain the dynamic stress time history of each node. Combine them with the Modified Chaboche with Cauchy MF model damage accumulation theory to obtain carbody damage. The safety critical concerned area were identified by the damage accumulation life assessment procedure. From foregoing studies, the following conclusions can be drawn as:
This nonlinear model has most satisfying precision in life prediction compared with experimental results, which can consider the L-aL effect properly to extend the predicted. Thereby, the influence of longitudinal load on the fatigue damage of the carbody is compared and analyzed. The modal superposition method is employed for evaluating the fatigue damage acting on the carbody after the longitudinal load spectrum. It is found that the concerned area I shows the relative error is about 42.44% to 42.70% and concerned area II, the relative error is about 41.78% to 41.94%. The damage accumulation rates of the NMCCMF model are small for the first 150,000 cycles because of the strengthening effect and the damage caused by the low-amplitude load is very slight in the early stage of fatigue with low initial damage. Beyond 160,000 cycles, the damage started, and at 189563 cycle damage values go to 1. It means that fatigue damage in a concerned area I and II is significantly larger. The load acting longitudinally has a major influence on the fatigue damage of the carbody.
Footnotes
Declaration of conflicting interests
The author(s) declared no potential conflicts of interest with respect to the research, authorship, and/or publication of this article.
Funding
The author(s) disclosed receipt of the following financial support for the research, authorship, and/or publication of this article: This work was supported by National Research Foundation of Korea (NRF) grant funded by the Korea government (MSIT) (No. NRF-2019R1G1A1004577 and No. 2019R1A5A808320112).