
Abstract
This study aims to establish a strain instanton equation and damage factor evolution law for gypsum specimens by considering damping. First, damping energy is calculated based on the single-degree-of-freedom vibration model, and the instantaneous strain equation is obtained based on the stress balance equation. Second, the dissipation energy is divided into damping and damage energies, and a damage-factor correction algorithm is obtained. Third, cyclic loading and unloading tests were performed at different loading rates and stress amplitudes to verify the accuracy of the strain equation. Finally, the specimens’ magnitude curves and crack characteristics were monitored using moment–tensor acoustic emission simulations. The factors influencing the damping energy and strain equations, energy and damage evolution laws of the specimens, and damage patterns of the specimens at different loading rates were analysed. The results show that the instantaneous strain equation and the modified damage factor considering the damping effect can effectively reflect the deformation law and damage state of the specimens. In contrast, the damage to the specimens in the lower limit of the variable stress experiment was lower than that in the lower limit of the constant stress experiment. As the loading rate increases, the damage energy density of the specimen decreases, and the damage factor within a single cycle gradually decreases. As the loading rate increases, the number of crack events in the model increases significantly, size becomes more uniform, and sequentially exhibits dense and sparse distribution patterns, percentage of shear cracks decreases significantly, number of mixed cracks increases significantly, brittle behaviour of the specimen becomes obvious, and a complete damage state is attained known as the ‘crushed’ state. This study provides a theoretical reference for damage assessments of viscoelastic–plastic materials subjected to perturbing loads.
Introduction
Gypsum exhibits excellent fire resistance and rapid hardening properties, rendering it indispensable in geotechnical engineering and mining projects (Haba et al., 2022). These projects are frequently subjected to dynamic fatigue loads, which exert a significant impact on structural stability. Particularly in coal mining environments, cyclic pressure and seismic activities possess the characteristics of repetitive loading and periodicity. The influence of these dynamic loads on the long-term stability and durability of underground projects cannot be overstated (Chongyang et al., 2022; Guo et al., 2022). Consequently, investigating the fatigue life of gypsum under cyclic loading is profoundly significant.
Cyclic loading and unloading experiments are effective for the investigation of the mechanical properties of materials subjected to perturbed loading and can provide a basis for the analysis of the service life and stability of components in geotechnical, civil, and mining engineering under perturbed conditions (Meng et al., 2016, 2021; Momeni et al., 2015; Peng et al., 2019; Wang et al., 2021; Yang et al., 2022). In cyclic loading and unloading experiments, the characterisation of material damage has been extensively studied based on dissipated energy (Jiang et al., 2017; Liu et al., 2016; Meng et al., 2018). In viscoelastic materials, energy dissipation is reflected from two aspects: first, the damage energy owing to the dislocation of the material and the expansion of the crack surface, and second, the damping energy owing to the viscous effect of the material. However, the energy dissipation due to damping does not damage the material; therefore, it is important to consider the strain equation and damage evolution due to the damping effects.
The energy evolution of materials under cyclic loading has been extensively studied over the past few decades. The effects of the loading conditions and material properties on the energy evolution of materials were investigated using constant- and variable-amplitude cyclic loading experiments. For example, Song (Song et al., 2018) used the energy dissipation method to analyse the magnitude of energy dissipation at different loading levels and suggested that the energy dissipation of concrete is related to the stress path. Wang (Wang et al., 2021) investigated the energy evolution of barite at different cyclic cycles and ambient pressures and suggested that the elastic energy stored in the rock continued to decrease and the dissipated energy increased as the cyclic cycle increased. Ding (Ding et al., 2022) studied the energy evolution of coal rocks and showed that the total input, elastic, and dissipation energies increased as a function of the axial stress before the coal body was fractured. In a study on material properties, Kong (Kong et al., 2022) investigated the energy evolution of shale at different joints and constructed a corresponding energy evolution model. Zheng (Zheng et al., 2022) investigated the energy evolution at different roughness states and showed that the elastic energy storage capacity of tested specimens increased at increasing roughness.
In addition to cyclic loading and unloading experiments, acoustic emission experiments (Alexakis et al., 2020; Dexing et al., 2019; Fan et al., 2017; Li et al., 2020; Meng et al., 2018; Shen et al., 2020; Wang et al., 2021) and numerical simulation analyses (Sinaie et al., 2018; Song et al., 2019; Tian et al., 2021; Wang et al., 2023; Xia et al., 2019; Zhang et al., 2022) have contributed to the study of the cyclic loading energy evolution of materials. For example, Zhou (Zhou et al., 2019) used an acoustic emission detection system to study the fracture process of granite during cyclic loading and unloading experiments and analysed the energy evolution of the post-peak phase of granite. Shi (Shi et al., 2021) used the PFC numerical software to fit the experimental curves and analysed the energy and damage evolution of sandstone.
In the study of cyclic loading and unloading, models at the macroscopic level can be classified into three categories: elastic, plastic, and continuous damage models (Sima et al., 2008). Among the elastic–plastic models, Lee et al. (Lee and Fenves, 1998) developed a plastic damage instantiation for cyclically loaded concrete to simulate the effects of damage on elastic stiffness and its recovery during crack opening and closing. The fatigue and yield parameters were introduced by Cerfontaine et al. (Cerfontaine et al., 2017) to characterise the degradation of material properties, which reflected the relationship between the strain and the number of cycles. Zhou et al. (Zhou et al., 2020) proposed a modified cohesion weakening and frictional strengthening model to investigate the effects of cohesion softening and frictional hardening.
In continuous damage models, scientists have introduced induced damage processes to describe fatigue and cyclic damage based on different damage distribution functions. For example, Xiao et al. (Xiao et al., 2011) used a linear exponential formulation to model the fatigue behaviour of rocks under cyclic loading conditions and clarified the meaning of the coefficients. He et al. (He et al., 2019) constructed an exponential cumulative damage model and predicted the fatigue damage to salt rocks. Liu et al. (Liu et al., 2016) proposed the concept of compaction coefficient and used a recursive approach to develop an intrinsic damage model under cyclic loading conditions. In addition, several loading-condition models have been proposed. For example, damage models consider the loading rate (Moreo et al., 2007) and frequency (Ren et al., 2022; Wang et al., 2016). In addition, models based on micro-structures (Baktheer et al., 2021; Sandoval et al., 2020) and discrete-element methods (Liu et al., 2017; Yu et al., 2022) have been developed. Sandoval et al. (Sandoval et al., 2020) conducted micro-dynamic fatigue experiments to modify crack extension mechanisms. Yu et al. (Yu et al., 2022) proposed a dynamic binary medium constitutive model based on fracture mechanics and homogenisation theory. In fatigue experiments, scholars found that the strain-time curve of the material and creep in fatigue experiments and the strain-time curve of the material remained highly consistent with the creep curve and inspired the development of new damage instantiation models, such as Zhang et al. (Zhang et al., 2023), who proposed a micro-structural degradation model based on equivalent creep deformation.
The theoretical, experimental, and simulation studies described above have advanced significantly the study of the deformation characteristics of materials under cyclic loading conditions, as well as the evolution of energy and damage. However, these studies uniformly classified damage and damping energy as dissipative energies without fully considering the damping effect; this resulted in large deformation and damage factors, which in turn misjudged the stability and service life of the structure and thus caused economic waste.
Therefore, this study employs two loading paths and three loading rates to conduct cyclic loading and unloading tests on gypsum samples in order to investigate the influence of damping on the mechanical behaviours and damage evolution of the samples. By establishing the relationship between damping force, effective stress, and actual stress, a stress-strain equation for cyclic loading and unloading is derived. Furthermore, the dissipation energy is separated from the damping energy, and modifications are made to the formula for calculating the damage factor. To establish a theoretical foundation for predicting the service life of structures subjected to perturbation loads in geotechnical engineering.
Materials and methods
Damping energy calculation method
Cyclic additive and unloading models have been studied extensively (Martínez-Rueda and Elnashai, 1997; Mroz et al., 1976; Wang et al., 2022; Wasantha et al., 2021; Xia et al., 2005). In general, these models are effective combinations of elasticity, viscosity, and plasticity. Plasticity interferes with the calculation of damping energy; therefore, in this study, when the damping energy calculation model was constructed, the material was simplified to a single-degree-of-freedom forced vibration model, that is, the entire system was simplified to equivalent mass, elastic, and damping units. The simplified model is shown in Figure 1.
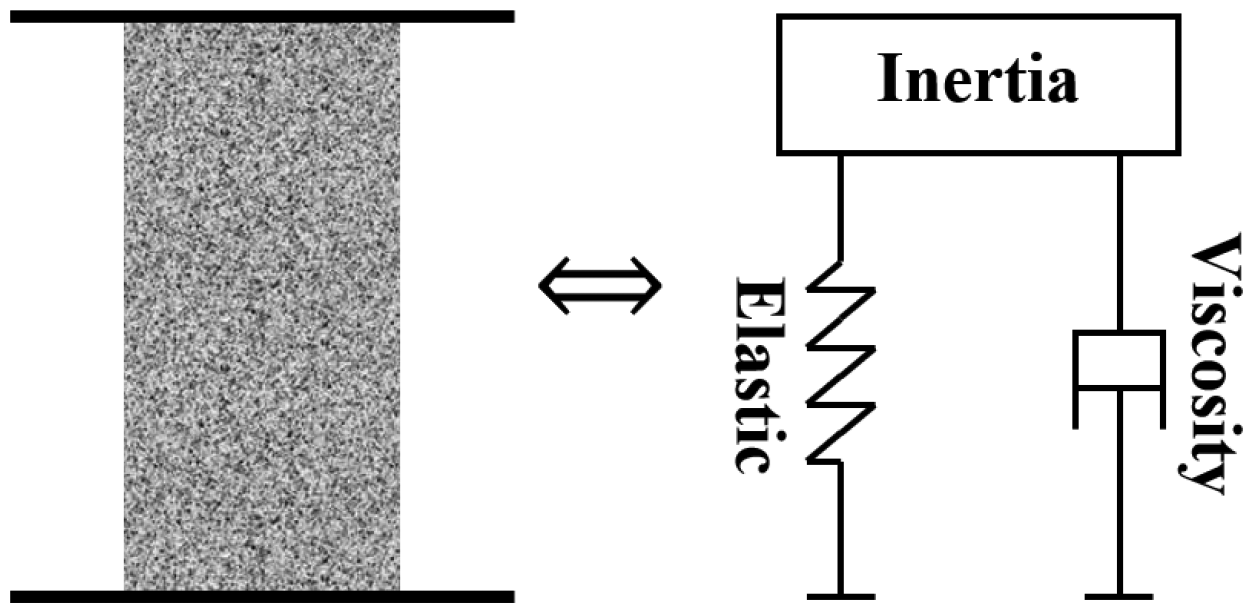
Simplified model diagram.
In the simplified mechanical model combined with D’Alembert's principle, inertial forces were applied to the equivalent mass unit to obtain the mechanical calculation model shown in Figure 2.where
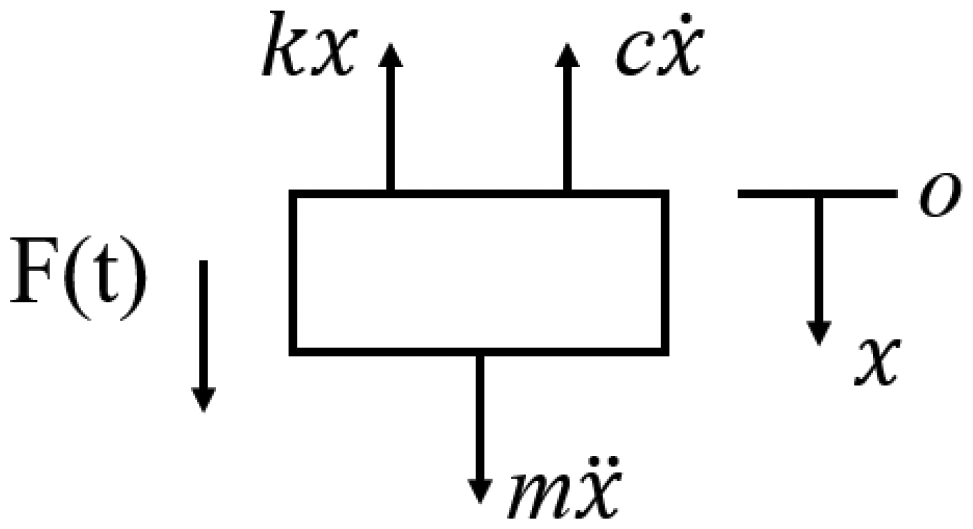
Stress analysis diagram.
The equation for achieving a balance of forces is shown below.

Using a Fourier series expansion for the cyclic loading and unloading excitation, the excitation force equation is as follows,
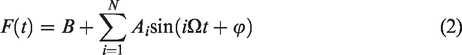
By studying a single expansion term, equation (1) can be expressed as follows,

New variables are introduced as shown below.
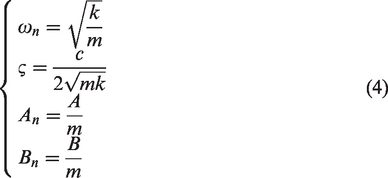
Equation (3) can be simplified further as shown below.

The roots of formula (5) are shown below.

Using the characteristic root form presented in equation (6), the hysteresis curve is constructed as follows,

Substituting equation (7) into the differential equation (5) yields the following expression for the coefficients,
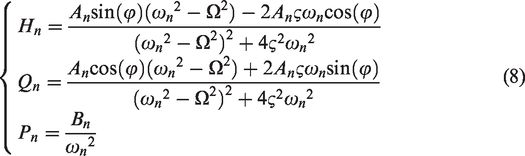
The area of the hysteretic loop plotted based on equation (7) represents the damping energy.
Strain equations
Subject to the effect of damping, the deformation of the material is subject to the superposition of the actual stress and the damping force, where the direction of the damping force is always opposite to the direction of the deformation of the material. The force diagram is shown in Figure 3.
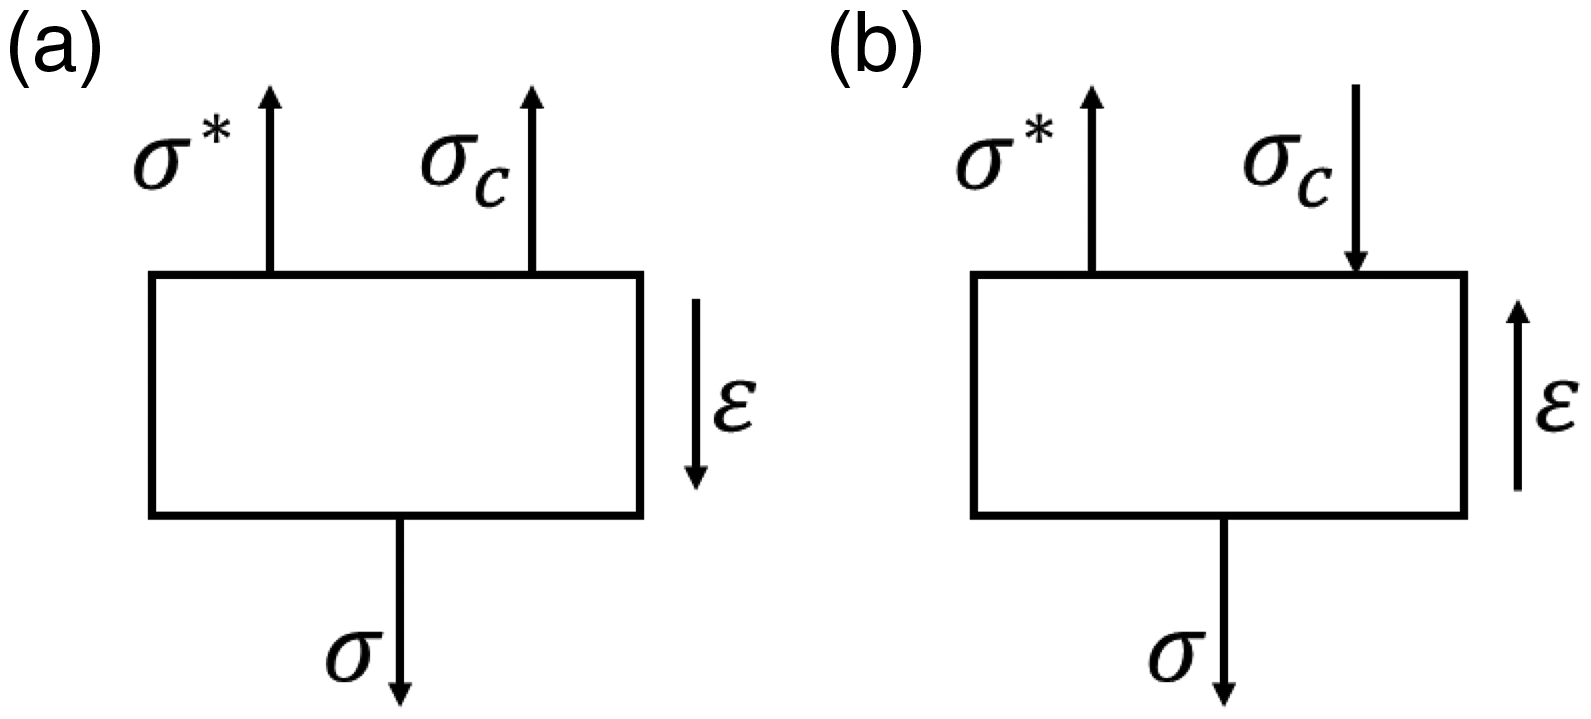
Stress analysis during loading and unloading diagrams. (a) Loading and (b) unloading configurations.
Based on the force conditions shown in Figure 3, the equilibrium equation for the load path is obtained as follows,

The equilibrium equation of the unloading path is obtained according to

Substituting this into equation (9) yields the following equation:
Simplification gives the following equation for the principal structure under the loading path.
Integrating equation (12) gives the strain equation under the load path, as follows,
Set

Equation (9) can be simplified further.

Equation (13) shows that the axial strain of a loading path is related to the stress amplitude, stress level, loading frequency, material elastic modulus, and damping coefficient.
Following the same process, the strain equation of an unloading path can be obtained.
Integrating equation (12) yields the strain equation of the unloading path.
The simplified equation is as follows.

As the experiment progressed, the bearing stiffness and damping coefficient of the material gradually degraded, and the unknown coefficients in the equation degraded continuously. However, the basic parameters in equation (14) can be measured experimentally, and there are only a few coefficients; therefore, it has a certain level of applicability.
Experiment
Specimen preparation and uniaxial compression experiments
The selected gypsum powder used in this study is Grade A α-type gypsum powder, produced by Shanghai Huaxing Co., LTD., China. The particle size of the gypsum powder is 0.075 mm, with its main component being Mold preparation: A cube mold with a side length of 150 mm was used and lubricating oil was applied on the inner surface to facilitate mold release. Production of the block: Gypsum powder was evenly poured into water, and the mixture was poured into the mold after full mixing for 90 s with a mixer. The mixture was placed on a vibrating table for 2 min to eliminate bubbles in the slurry and after heat loss, demodulation started. Standard sample treatment: After demoulding, the test block is shaped into a cylindrical standard sample measuring 50 mm in diameter and 100 mm in height. Subsequently, it is placed inside a curing chamber at a temperature of 25°C and relative humidity of 40% for a duration of 7 d. The two ends of the cured sample are meticulously polished to ensure they are smooth and flat, with an allowable deviation between samples not exceeding 2 mm. Grouping and weighing: dividing the sample into three groups for subsequent uniaxial compression tests on specimens S-1, S-2, and S-3. LLCS tests were performed on specimens CL-1, CL-2, and CL-3 while CH-1, CH-2, and CH-3 underwent LLVS testing. Each group consisted of ten samples resulting in a total of thirty samples obtained. The weight of each individual sample was measured to determine an average gypsum density of
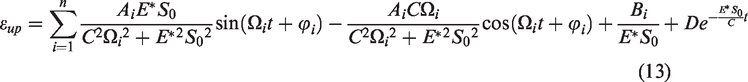
The DDL-200 electronic universal testing machine, manufactured by Changchun Machinery Institute, was employed for the test. It enables precise control of stress loading speed and measurement of axial deformation using a grating extensometer. The system has a maximum axial load capacity of 200 kN and can acquire data at a maximum frequency of 100 Hz. To ensure accurate testing, the specimen is loaded according to the predetermined loading rate and stress path, while the acquisition frequency is set to 20 Hz. The gypsum samples exhibited an elastic modulus of approximately 3 GPa, thus enabling effective manipulation of the strain rate by selecting a force loading gradient of 300 N/s. Considering the high viscosity of gypsum, employing a higher loading rate may result in prominent end effects. Therefore, opting for the loading rates of 200, 500, and 800 N/s not only accomplishes the desired objective but also mitigates errors arising from end effects. Uniaxial compression experiments were conducted on specimens labelled S, with loading rates of 200 N/s for S-1, 500 N/s for S-2, and 800 N/s for S-3. The stress–strain curves are shown in Figure 4.
Stress–strain curves of uniaxial compression specimens.
By conducting uniaxial compression tests, the uniaxial strengths and elastic moduli of the samples were determined at various loading rates, as presented in Table 1.
Mechanical parameters of specimens subjected to uniaxial compression tests.
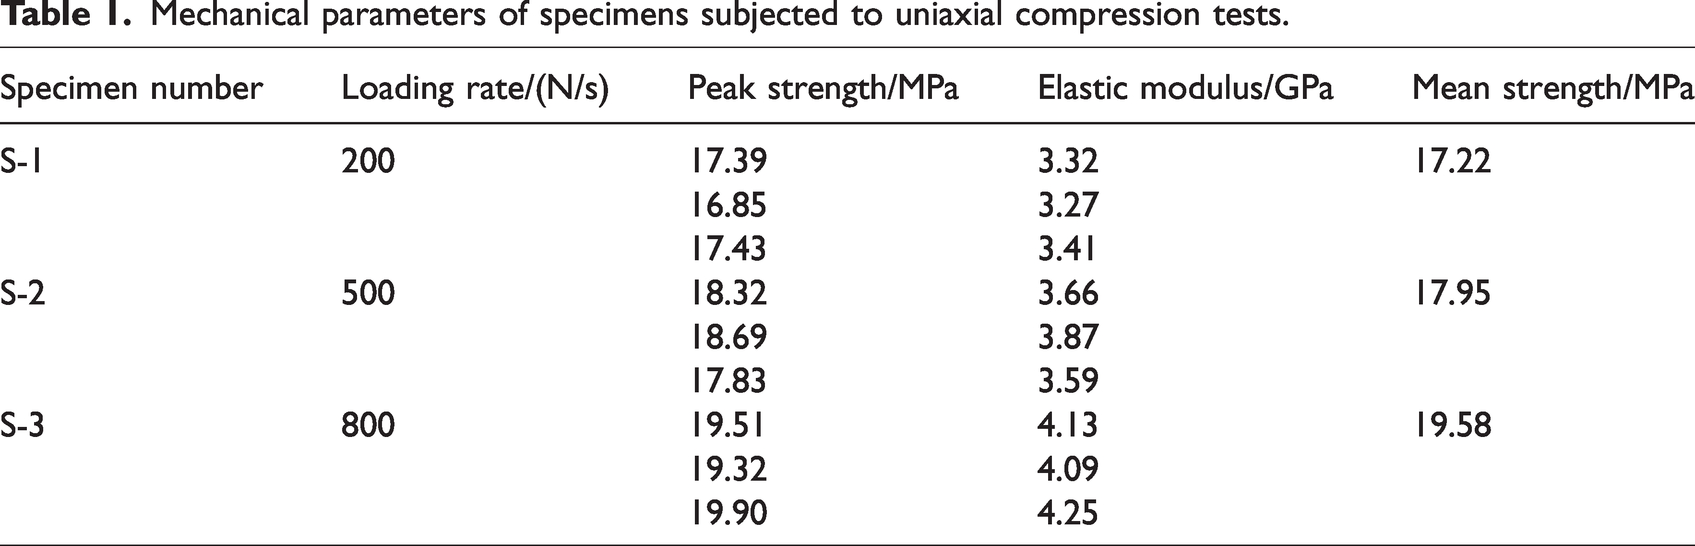
The results presented in Table 1 demonstrate a consistent increase in both the peak strength and elastic modulus of the sample at increasing loading rates. However, Figure 4 reveals a noticeable shift in the curve’s peak towards the upper left, thus indicating a gradual decrease in the sample’s peak strain as the loading rate increases, thus highlighting its increased brittleness.
Experimental cycling and unloading scheme
To analyse the influences of different loading rates and stress limits on the stress–strain curves of the specimens, two experimental schemes were designed.
Scheme 1: Lower limit of constant stress (LLCS) (Wang et al., 2022). Conducted experiments on specimen CL with the loading rates of 200 N/s, 500 N/s, and 800 N/s, set the upper limit of the contact force of the press to three levels of 15 kN, 20 kN, and 25 kN, with each level cycled five times. In the 16th cycle, the loading was sustained until the specimen was destroyed. To ensure full contact between the specimen and the testing machine, the lower limit of the contact force of the press was set to 1 kN.
Scheme 2: Lower limit of variable stress (LLVS). Conducted cyclic experiments on the specimen labeled CH with the loading rates of 200 N/s, 500 N/s, and 800 N/s, set the upper limit of the contact force of the press to 15 kN, 20 kN, and 25 kN, and the lower limit to 1 kN, 15 kN, and 20 kN respectively; each level was cycled five times, and in the 16th cycle, the loading was continued until the specimen was destroyed.
The residual strain of the sample decreased nonlinearly with an increasing number of cycles during the same stress stage. Therefore, conducting a single-stage cycle five times not only effectively reflects the deformation behaviour of the sample, but also significantly enhances the test efficiency. In subsequent loading periods, there was a notable increase in both the sample instability and failure probability as the cyclic testing increased. Based on uniaxial compression tests, setting 75% strength as the upper limit for stress cycles ensured complete cycle completion reliably. Hence, employing a cyclic loading and unloading test scheme consisting of three stress stages with upper-stress limits of 15, 20, and 25 kN, along with five cycles per stage, comprehensively accomplished the test objectives, and ensured site reliability and improved efficiency.
Two cycles of loading and unloading stress paths are shown in Figure 5.
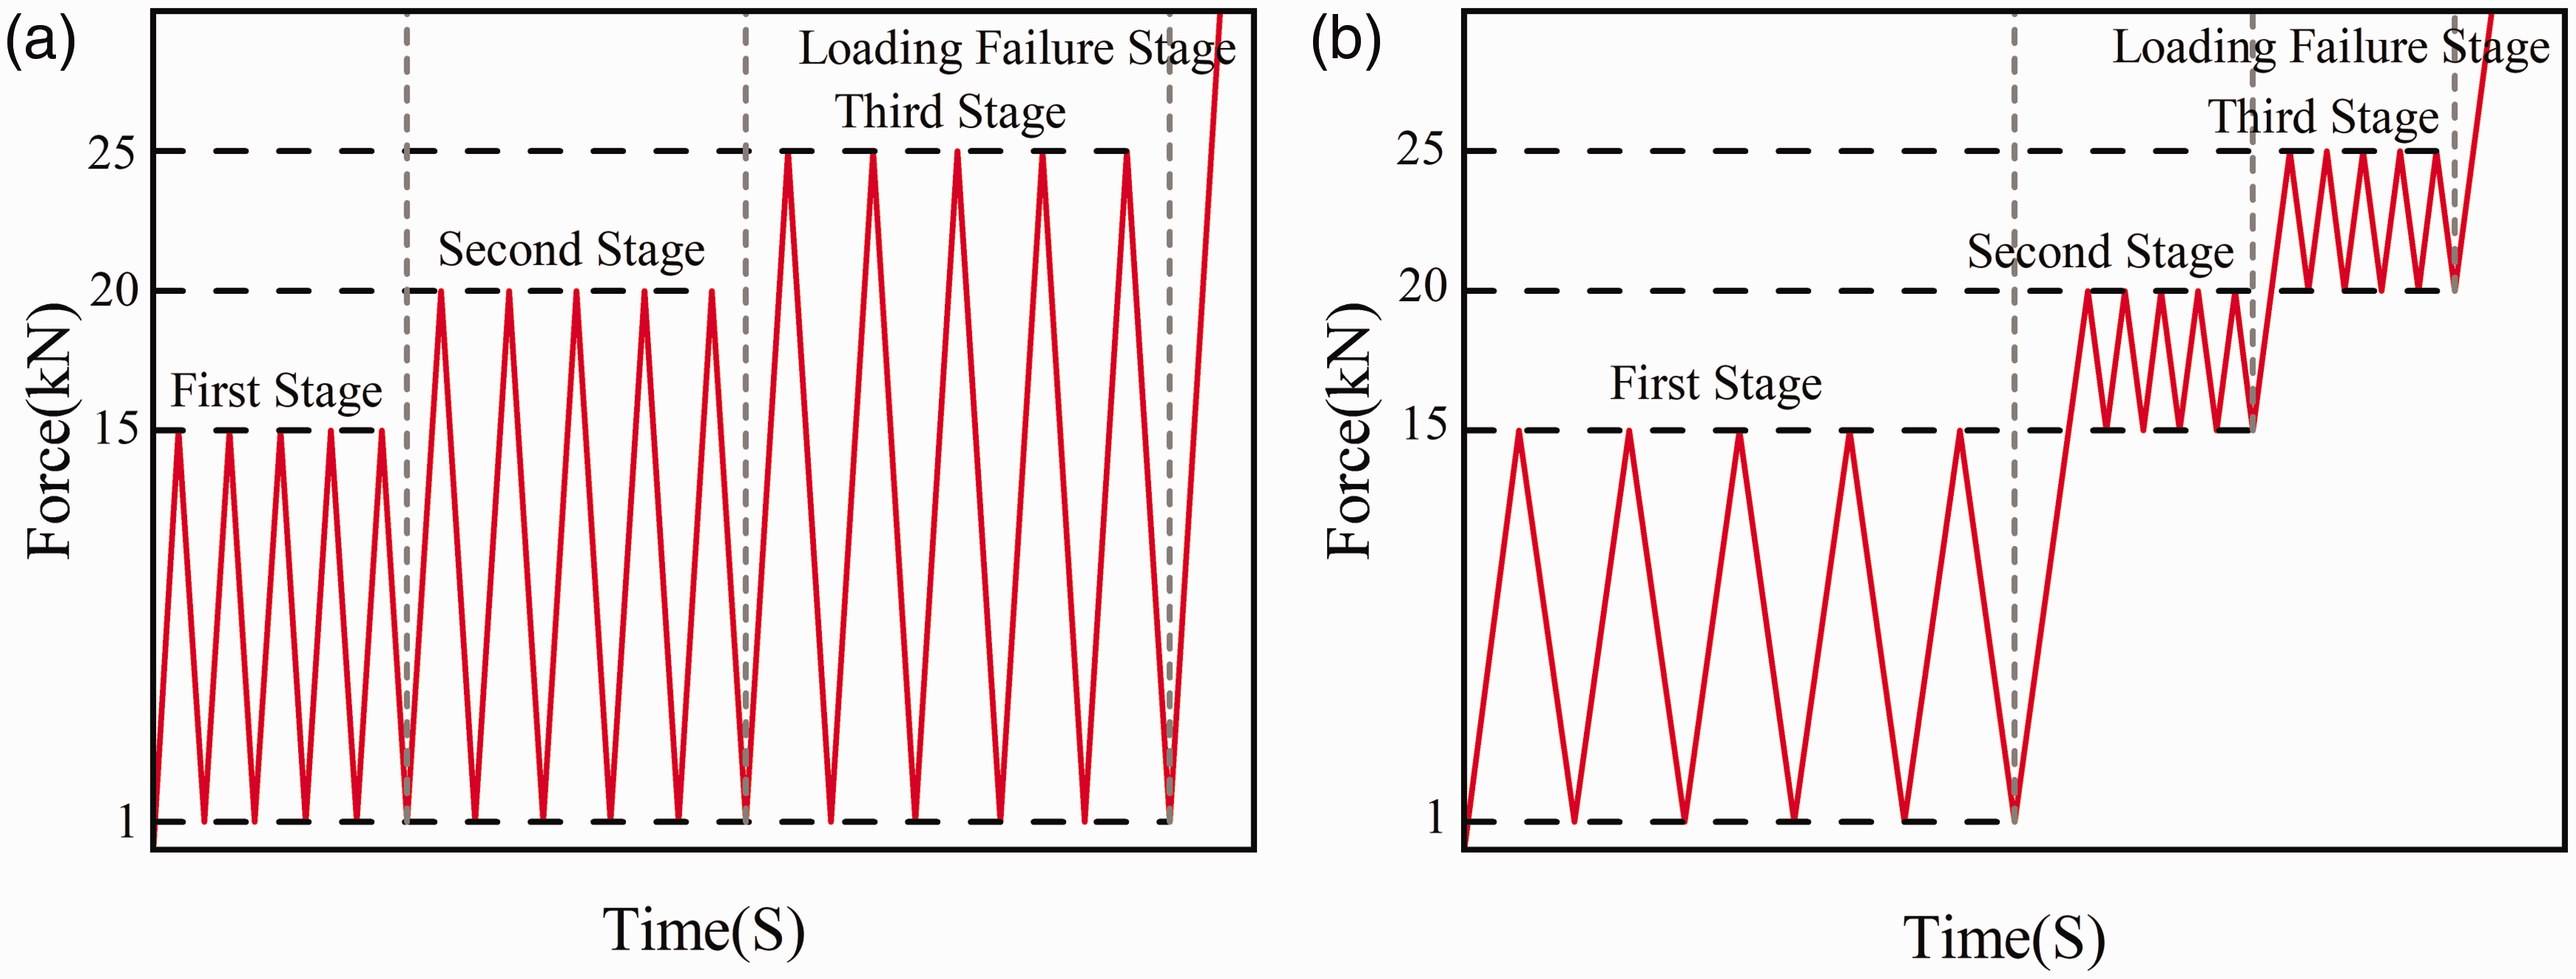
Stress loading and unloading paths. (a) Lower limit of constant stress and (b) lower limit of variable stress.
Mechanical properties
Specimen strengths
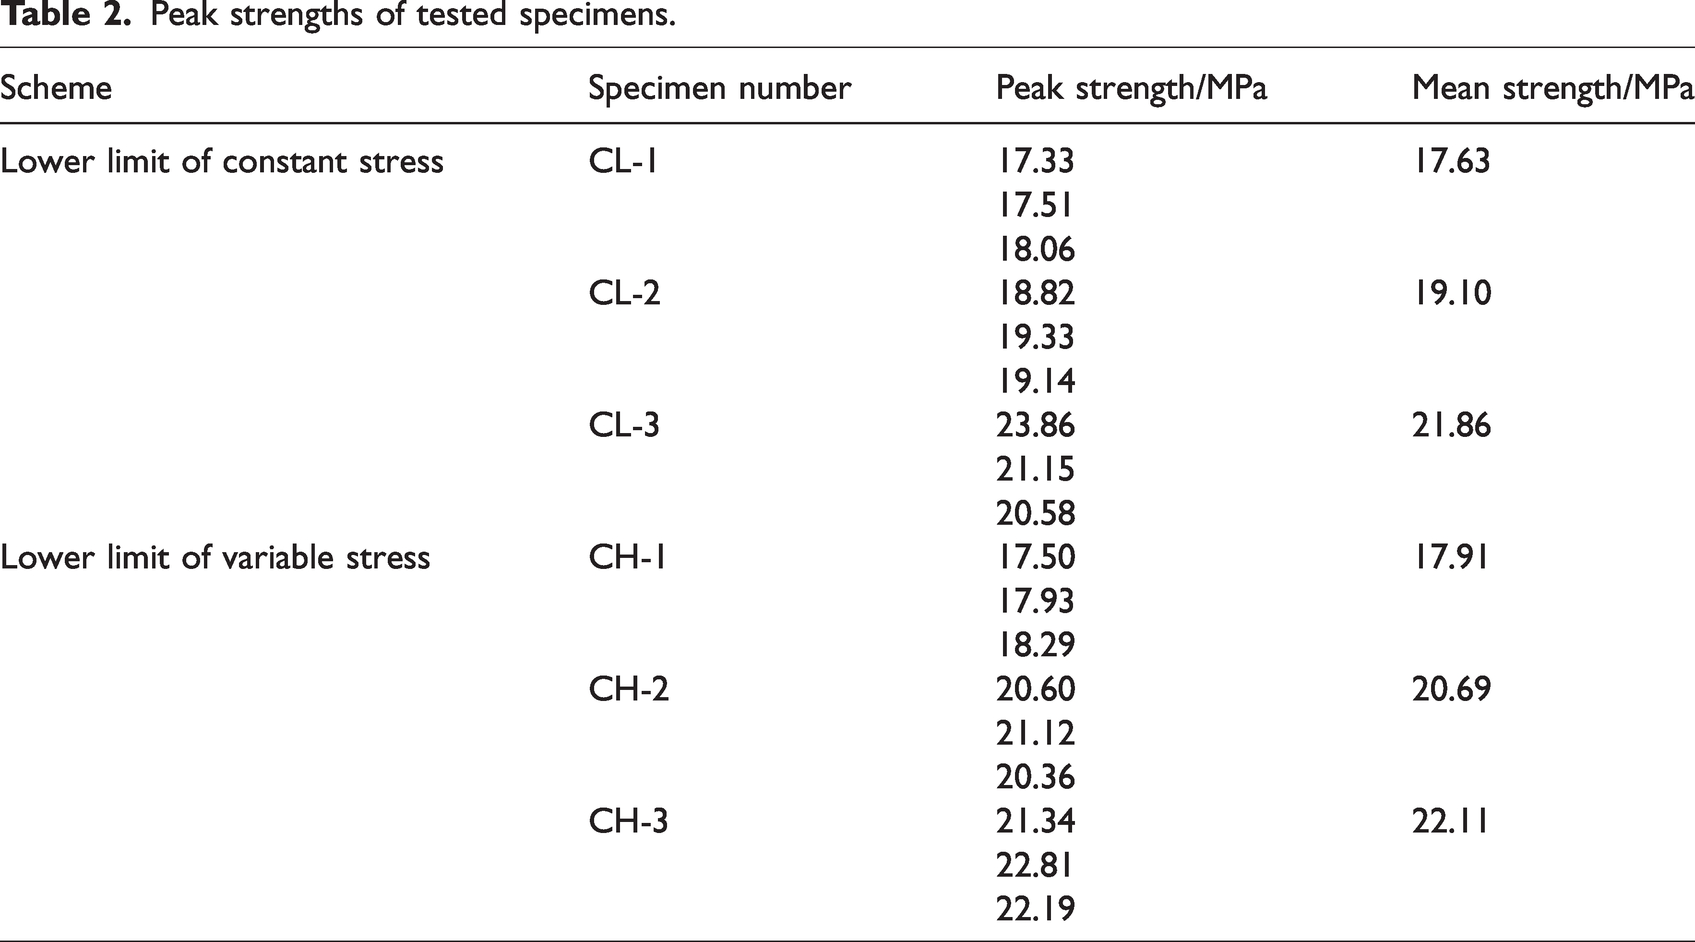
The strengths of the specimens at different loading paths are listed in Table 2, and the stress–strain curves for the LLCS and LLVS experiments are shown in Figure 6.
Peak strengths of tested specimens.
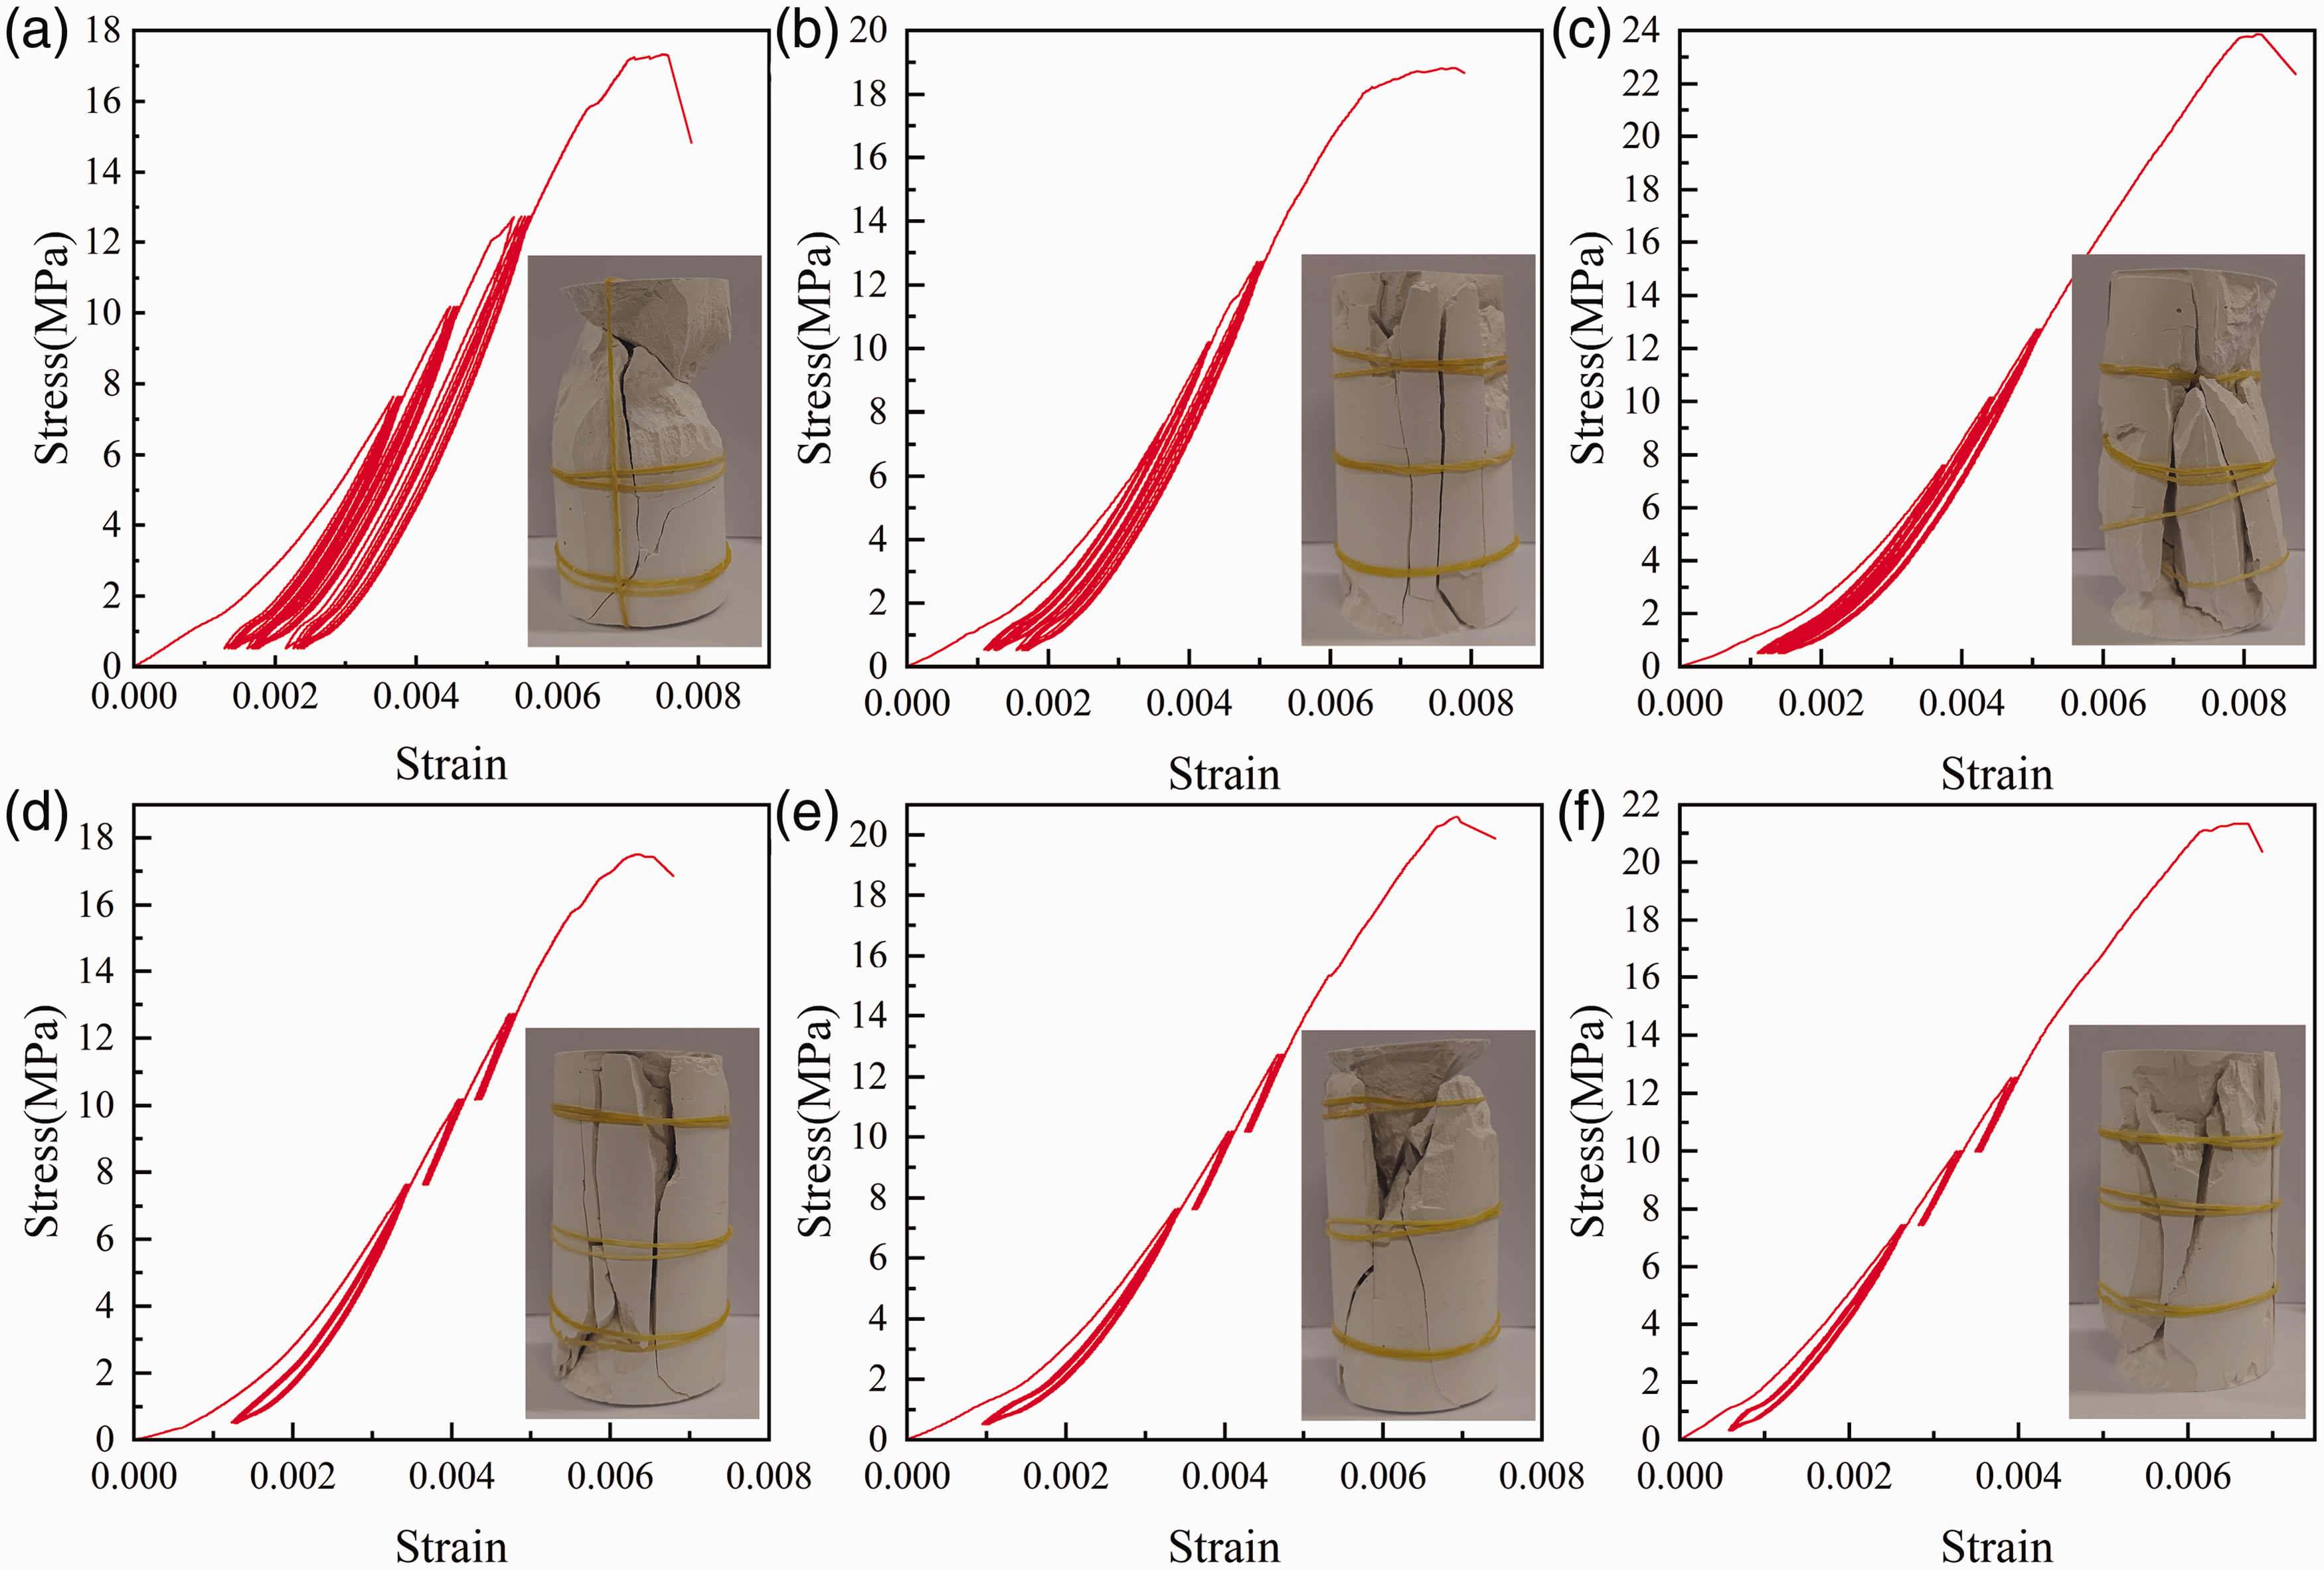
Stress–strain curves. (a) CL-1, (b) CL-2, (c) CL-3, (d) CH-1, (e) CH-2, and (f) CH-3.
By comparing the LLCS, LLVS, and uniaxial compression experiments, it was found that the peak strength of the specimens improved after cyclic loading and unloading. This indicated that during the loading process, the pores and micro-cracks inside the specimen gradually closed, the bearing area of the specimen improved, and the internal stress was relieved, thereby enhancing the bearing capacity of the specimen.
Comparison of the LLCS and LLVS experiments showed that the strengths of specimens CH-1 and CH-2 were slightly higher than those of specimens CL-1 and CL-2, indicating that with an increase in the lower limit of the cyclic stress, the expansion of micro-cracks and micro-pores in the specimens was reduced, thus causing less damage to the specimens. However, the strength of the CH-3 specimen was lower than that of CL-3, and the peak strength of CL-3 was significantly higher than those of CL-1 and CL-2 owing to the high viscosity of gypsum. In the experiment, the friction between the two ends of the specimen and press fixture provided an effective radial protection stress when the loading rate was high; this resulted in an abnormal peak strength of the CL-3 specimen. However, this did not affect the overall structure because the damping work gradually increased when the viscosity effect was evident, and the damage ratio remained stable.
A distinct hysteresis loop was observed in the cyclic loading–unloading curve. As the area of the hysteresis loop increases, the energy dissipation during the cycle increases. In the LLCS experiment, the hysteretic loops of CL-1, CL-2, and CL-3 became denser in succession, and the area of the hysteretic loop decreased continuously, thus indicating that with an increase in the loading rate, the energy dissipation and damage to the specimen decreased gradually, and the peak strength increased gradually; these findings are consistent with the analysis presented above. At each cycle level, the energy dissipation of the specimen increased as the stress amplitude increased. Using the specimen CL-1 as an example, the hysteretic loop gradually became sparse as the stress limit increased continuously, thus indicating that the damage to the specimen in the cycle with a higher stress amplitude was more obvious. At the same cycle level, the area of the hysteretic loop decreased gradually as cycle time increased, thus indicating that the internal pores of the specimen were further compressed, and the damage rate of the specimen was further reduced.
In the LLVS experiment, the hysteretic loop in the first stage was relatively sparse, and the hysteretic loops in the second and third stages were not significantly different, thus indicating that the stress amplitude was the main factor responsible for specimen damage. Increasing the lower stress limit can effectively reduce the stress amplitude, such that the energy dissipation of the specimen gradually decreases, and the damage to the specimen gradually decreases. Therefore, the strength of the specimen during the LLVS experiment was higher than that during the LLCS experiment; this finding is consistent with the above analysis.
Energy evolution
Gypsum is a viscoelastic material. In cyclic loading and unloading experiments, the energy can be divided into total mechanical, elastic recovery, damage, and damping energies. The density of the total mechanical energy is the area of the loading curve, the density of the elastic energy is the area of the unloading curve, and the sum of the densities of the damping energy and damage energy is the hysteresis loop area. Energy partitioning is shown in Figure 7.


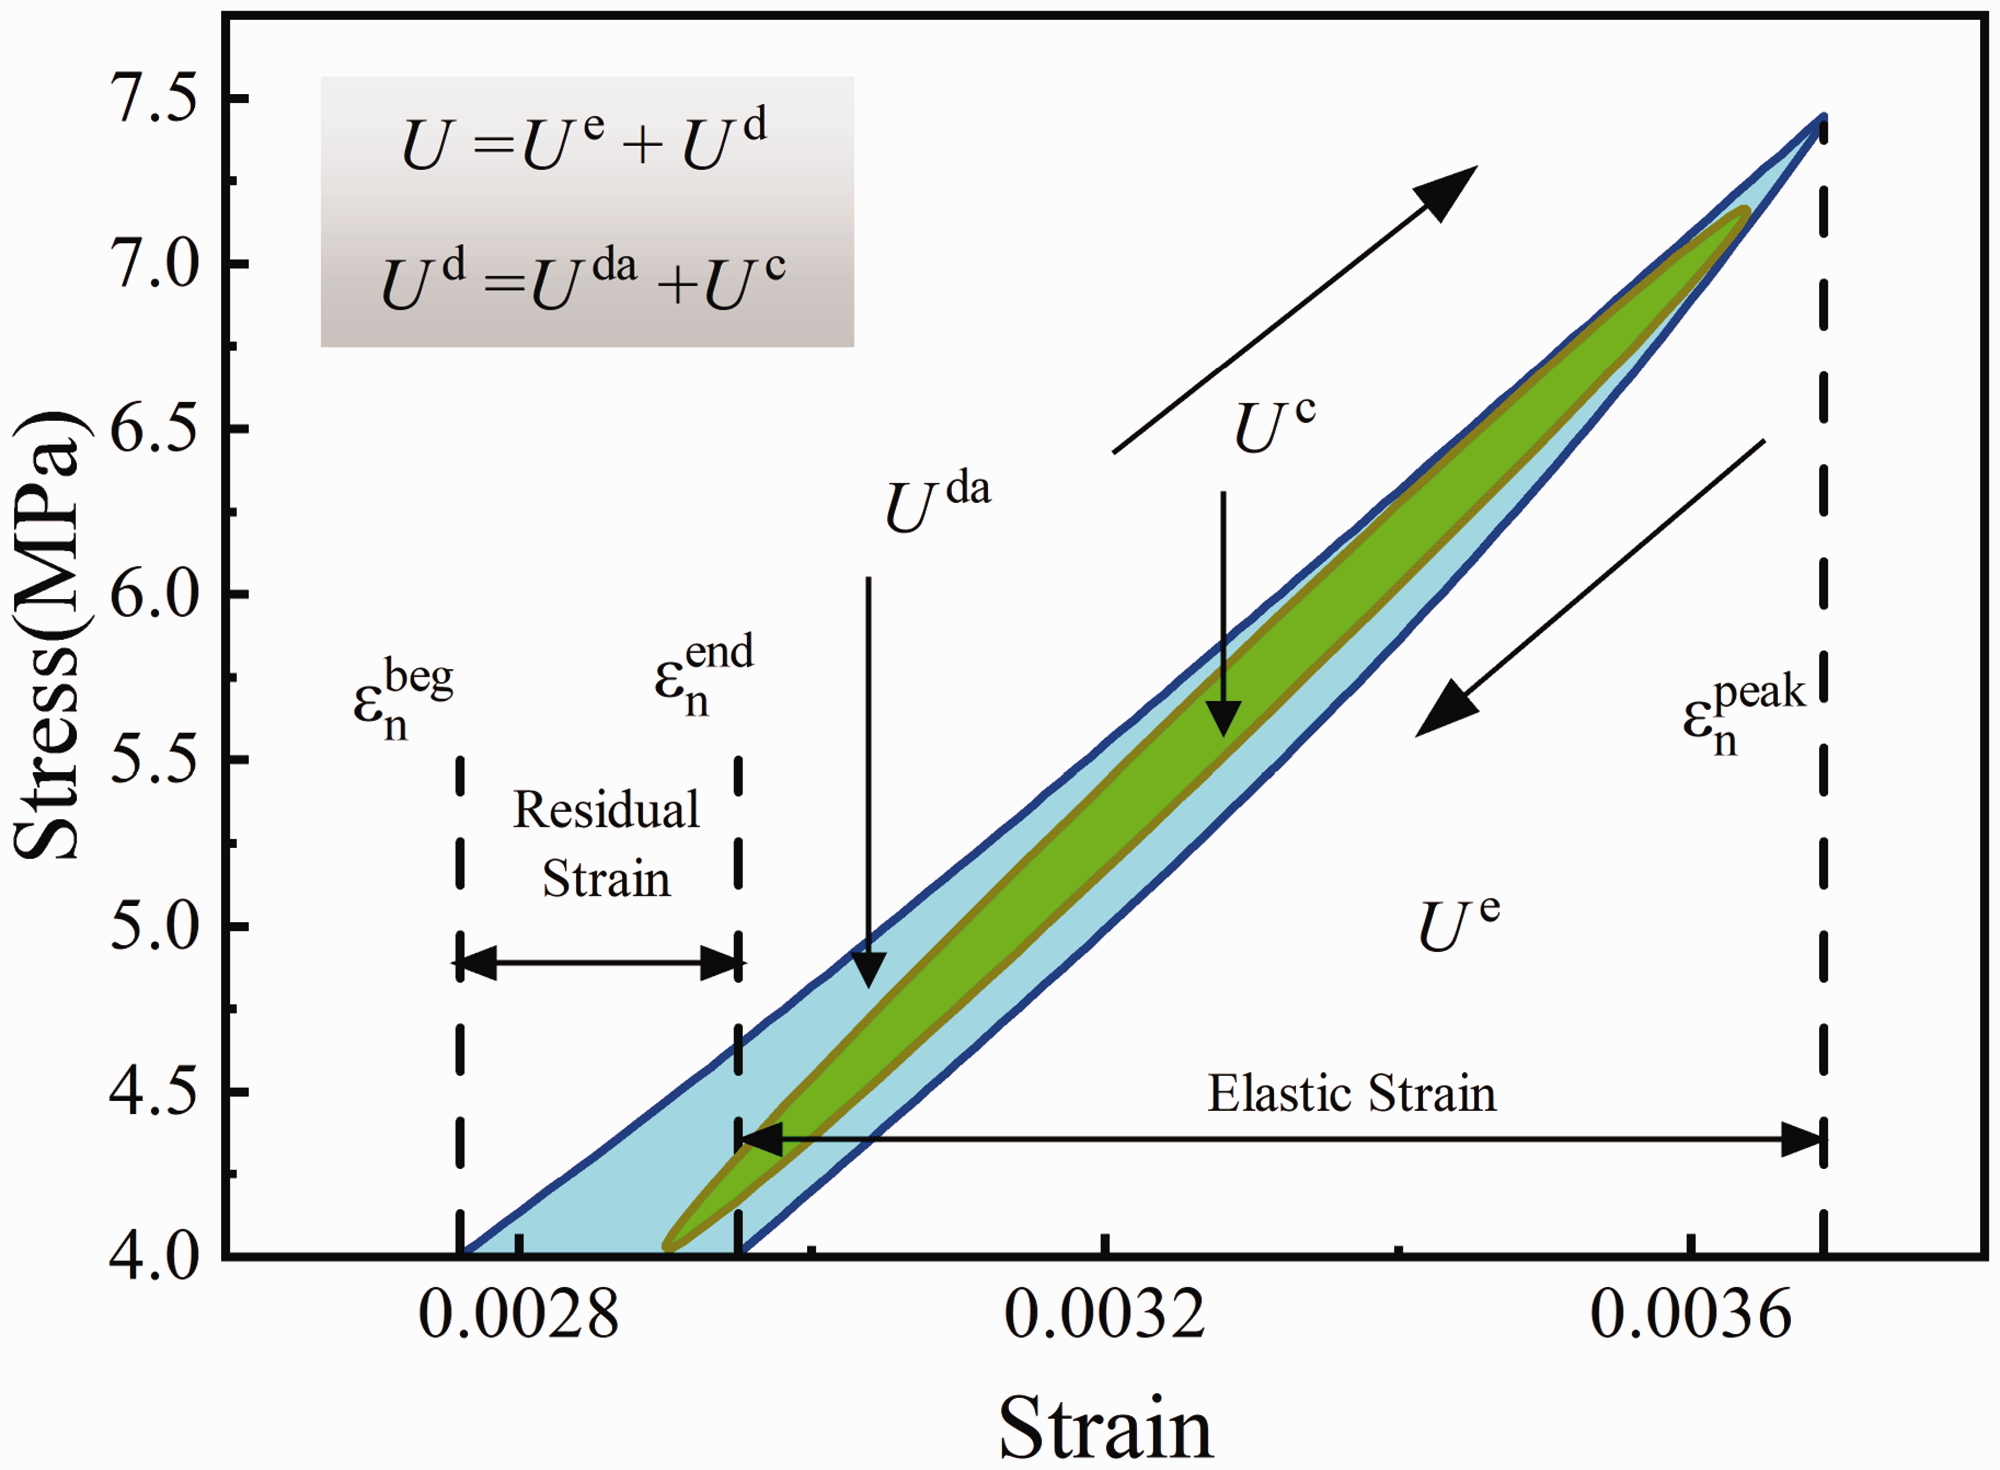
Energy partition.
By fitting the unloading curves from the cyclic loading and unloading experiments and obtaining the constants in equation (7), the energy density of the specimen after cyclic loading and unloading was calculated, as shown in Table 3.
Energy evolution.
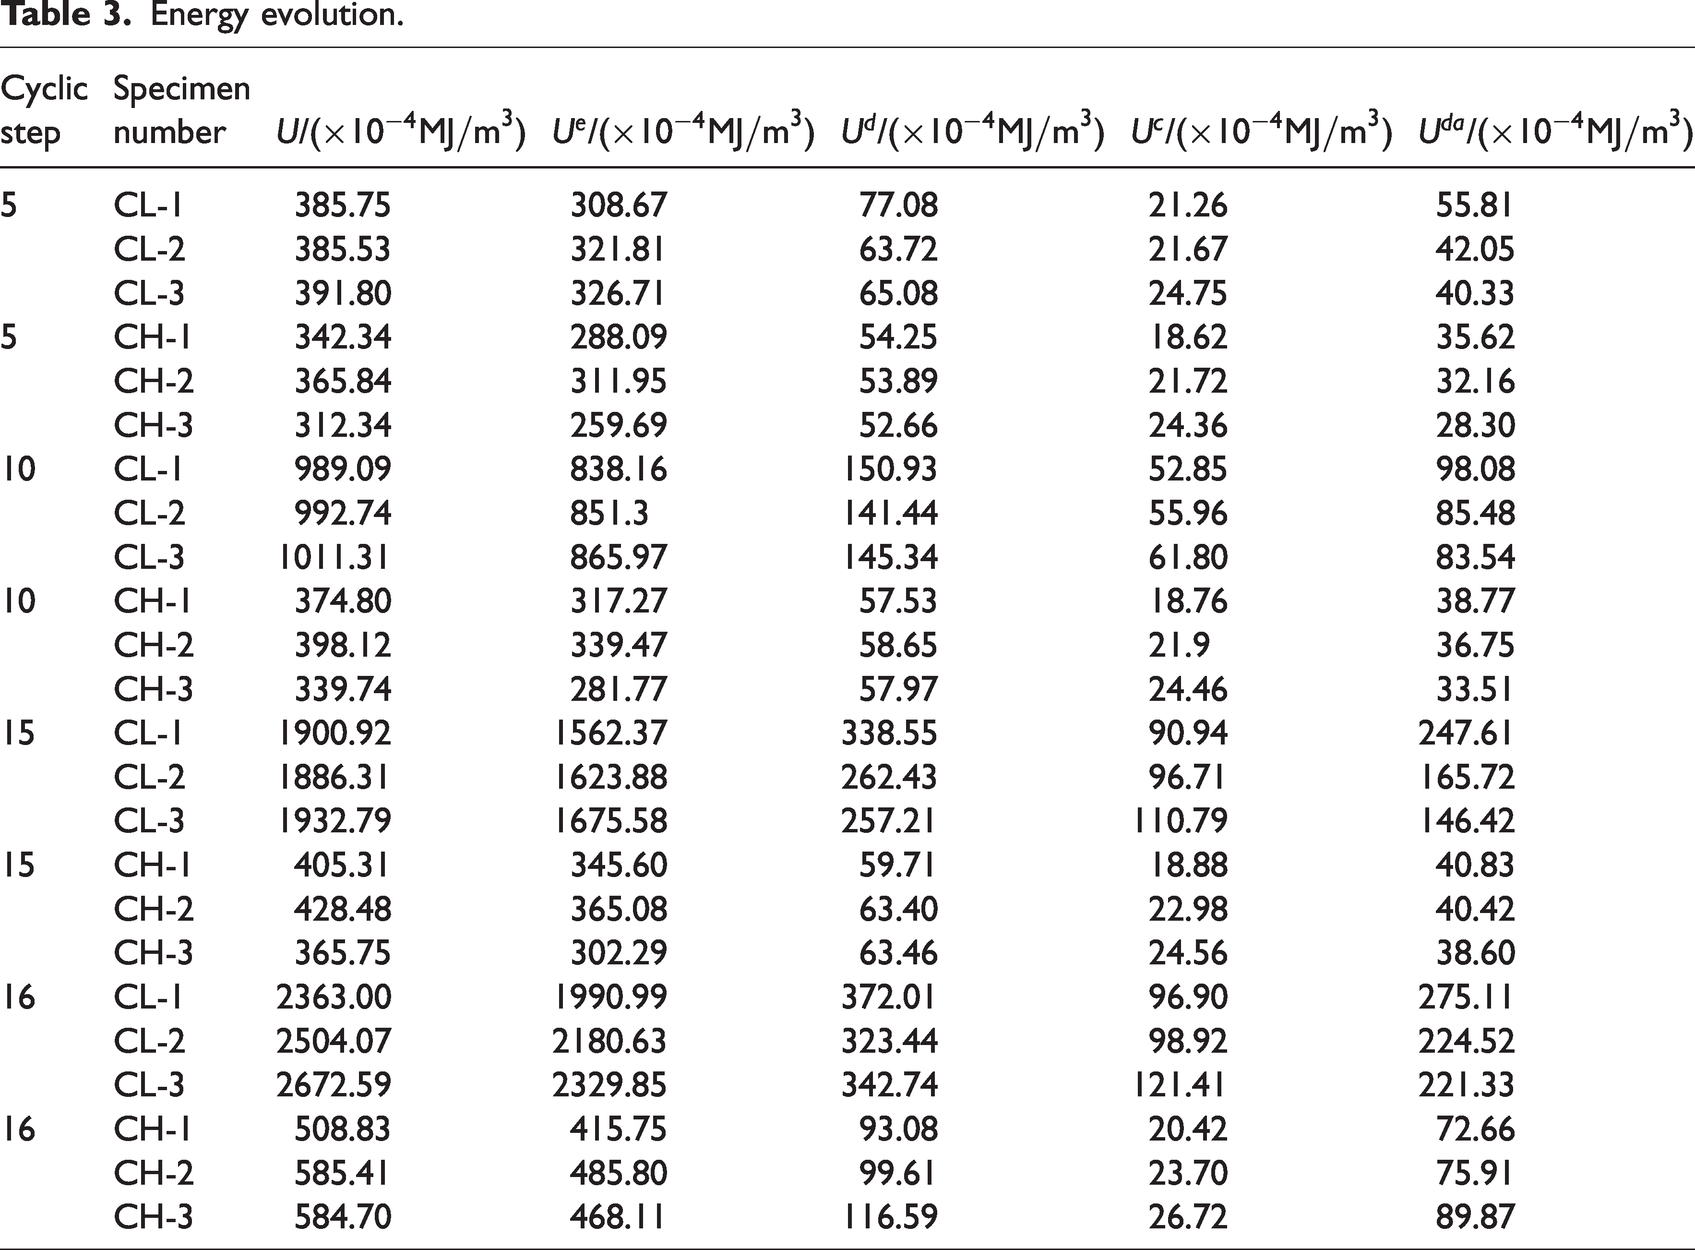
Because of the lower stress amplitude in the LLVS experiment, the mechanical energy density of specimen CL was much higher than that of specimen CH. The same rule applies to the elastic and dissipative energy densities. For the same number of cycles, the damping energy density of the specimen at a higher loading rate was higher; for example, CH-1 had a higher damping energy density than CH-2, and CH-2 had a higher damping energy density than CH-3. The 16th cycle led to the destruction of the specimen, and the damage energies of the 16th and 15th cycles were compared. In the LLCS experiment, the difference between the two cycles was small, whereas in the LLVS experiment, the difference between the two cycles was large. This shows that in the LLCS experiment, the previous cycles caused greater damage to the specimen. Compared with the LLCS experiment, the damage caused by the previous cycles in the LLVS experiment was smaller, which is consistent with the rule that the strength of the specimen in the LLCS experiment is lower than that of the LLVS experiment.
In comparison to the regular evolution of the damage energy density, the evolution of the dissipated energy density appeared to be more chaotic, such as in the fifth cycle, where all six specimens showed that the dissipated energy density decreased when the loading rate increased; this rule was violated in the subsequent cycles. From this perspective, it can also be proven that the damage representation considering the damping work has a better rationality.
Moment tensor acoustic emission simulation
Acoustic emission technology can effectively monitor the entire experimental process of a specimen continuously and non-destructively. Factors such as the noise of the electrically controlled pressure machine and the flatness of the specimen in indoor experiments reduce the comparability of the results. However, numerical simulations can effectively overcome this deficiency. Additionally, the particle flow discrete element software PFC has significant advantages in the field of rock fracture and damage evolution. By monitoring the particle kinetic energy around the bonding key fracture and using it to quantify directly the acoustic emission energy of the seismic source radiation, the acoustic emission characteristics of the specimen could be obtained using a clustering analysis of multiple bonding key fractures in space and time. The vibration intensity cloud maps of the specimens at different loading rates are shown in Figure 8.
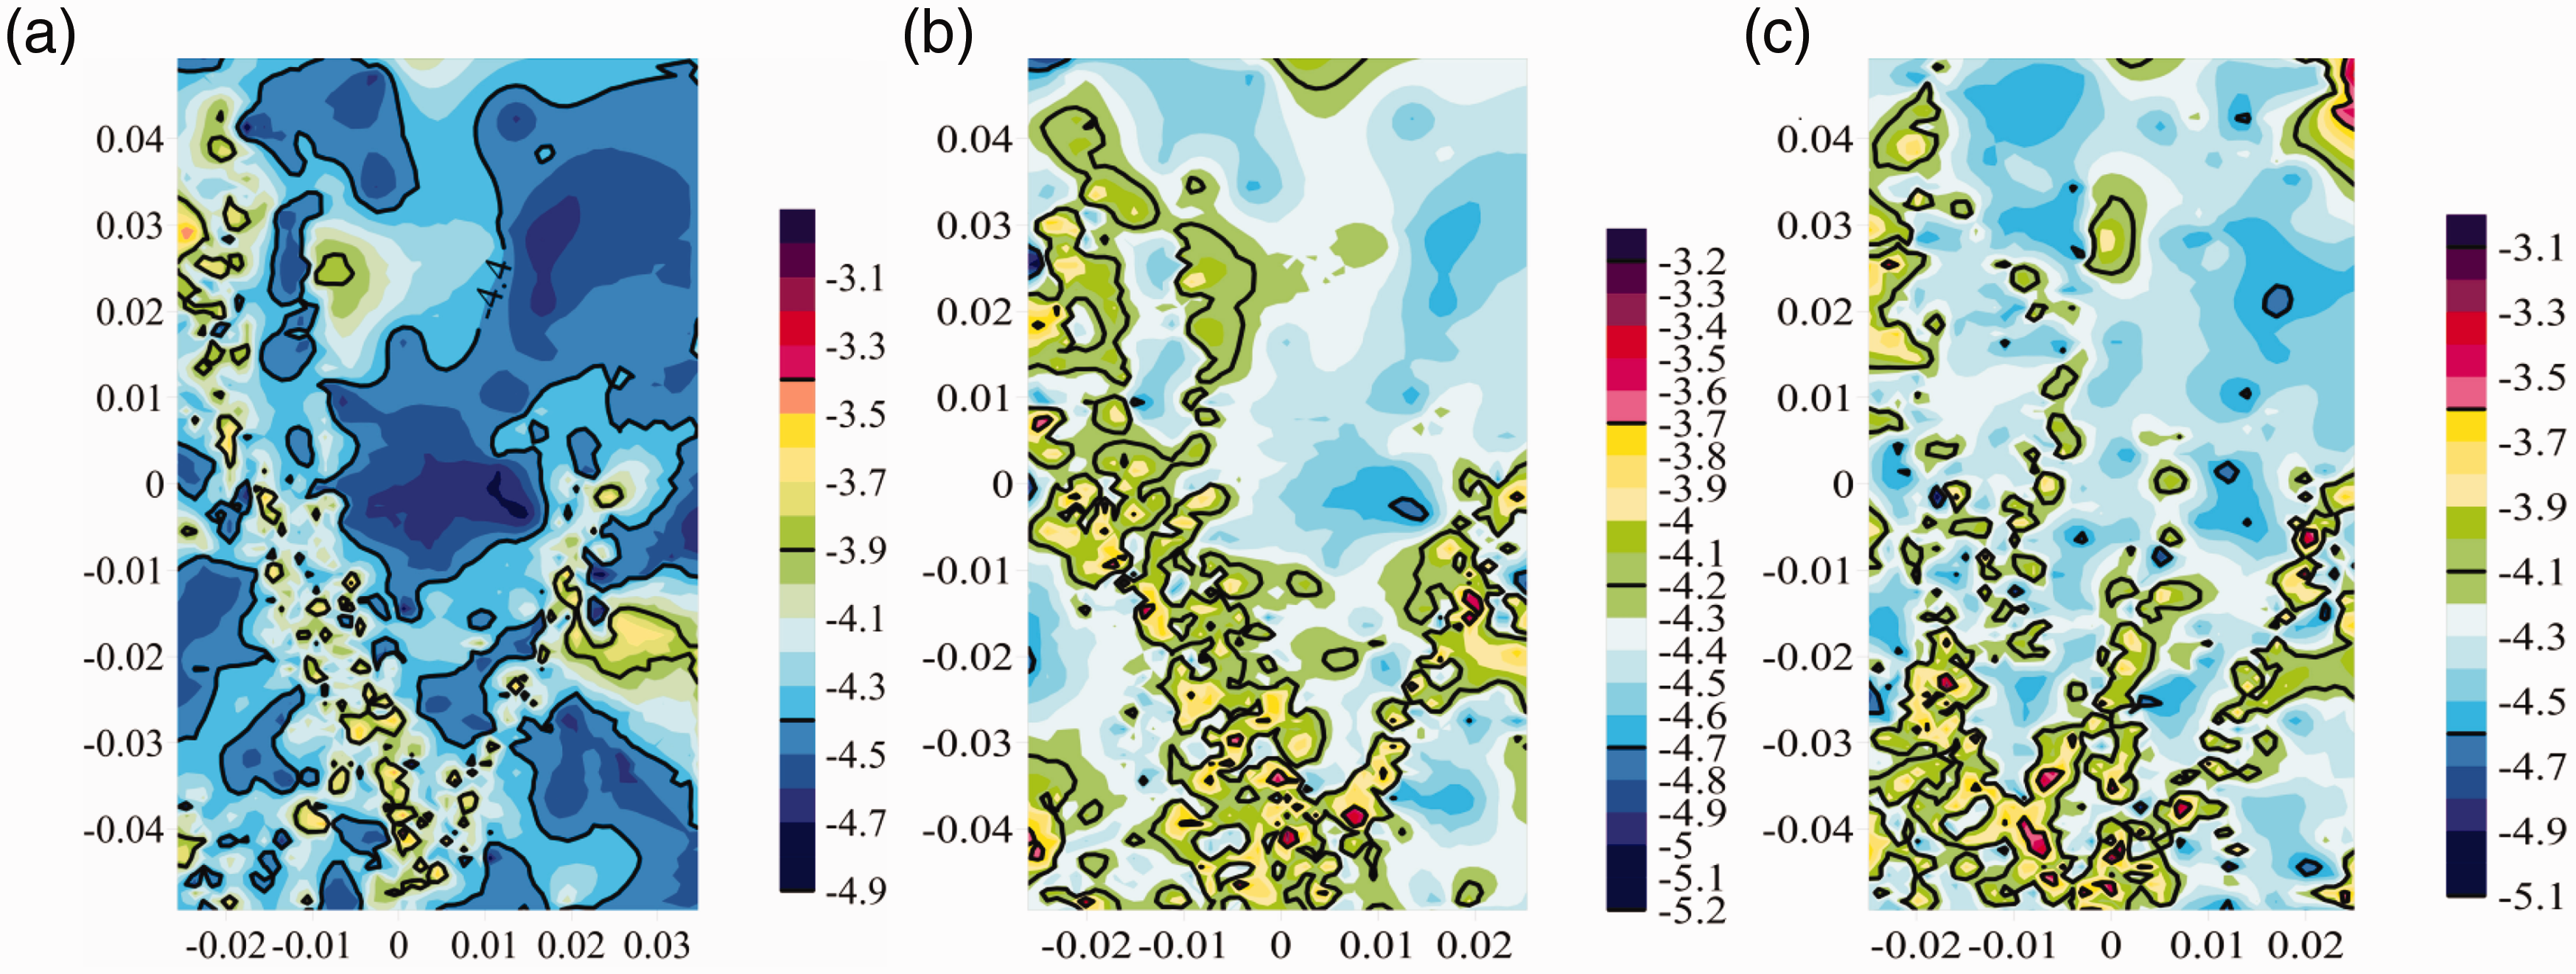
Vibration intensity cloud maps. (a) Low speed, (b) medium speed, and (c) high speed.
By examining the seismic intensity cloud map, it can be observed that as the loading rate increases, the locations of the specimen cracks become more uniform. When the loading rate is low, the specimen has obvious macroscopic cracks, while when the loading rate is increased, the development of macroscopic cracks is suppressed and micro-cracks develop rapidly, thus resulting in the specimen’s destruction and a ‘fragmented’ state. The AE monitoring was conducted to investigate the fundamental causes of this phenomenon. The resulting magnitude curves and fracture-type proportions are shown in Figure 9.
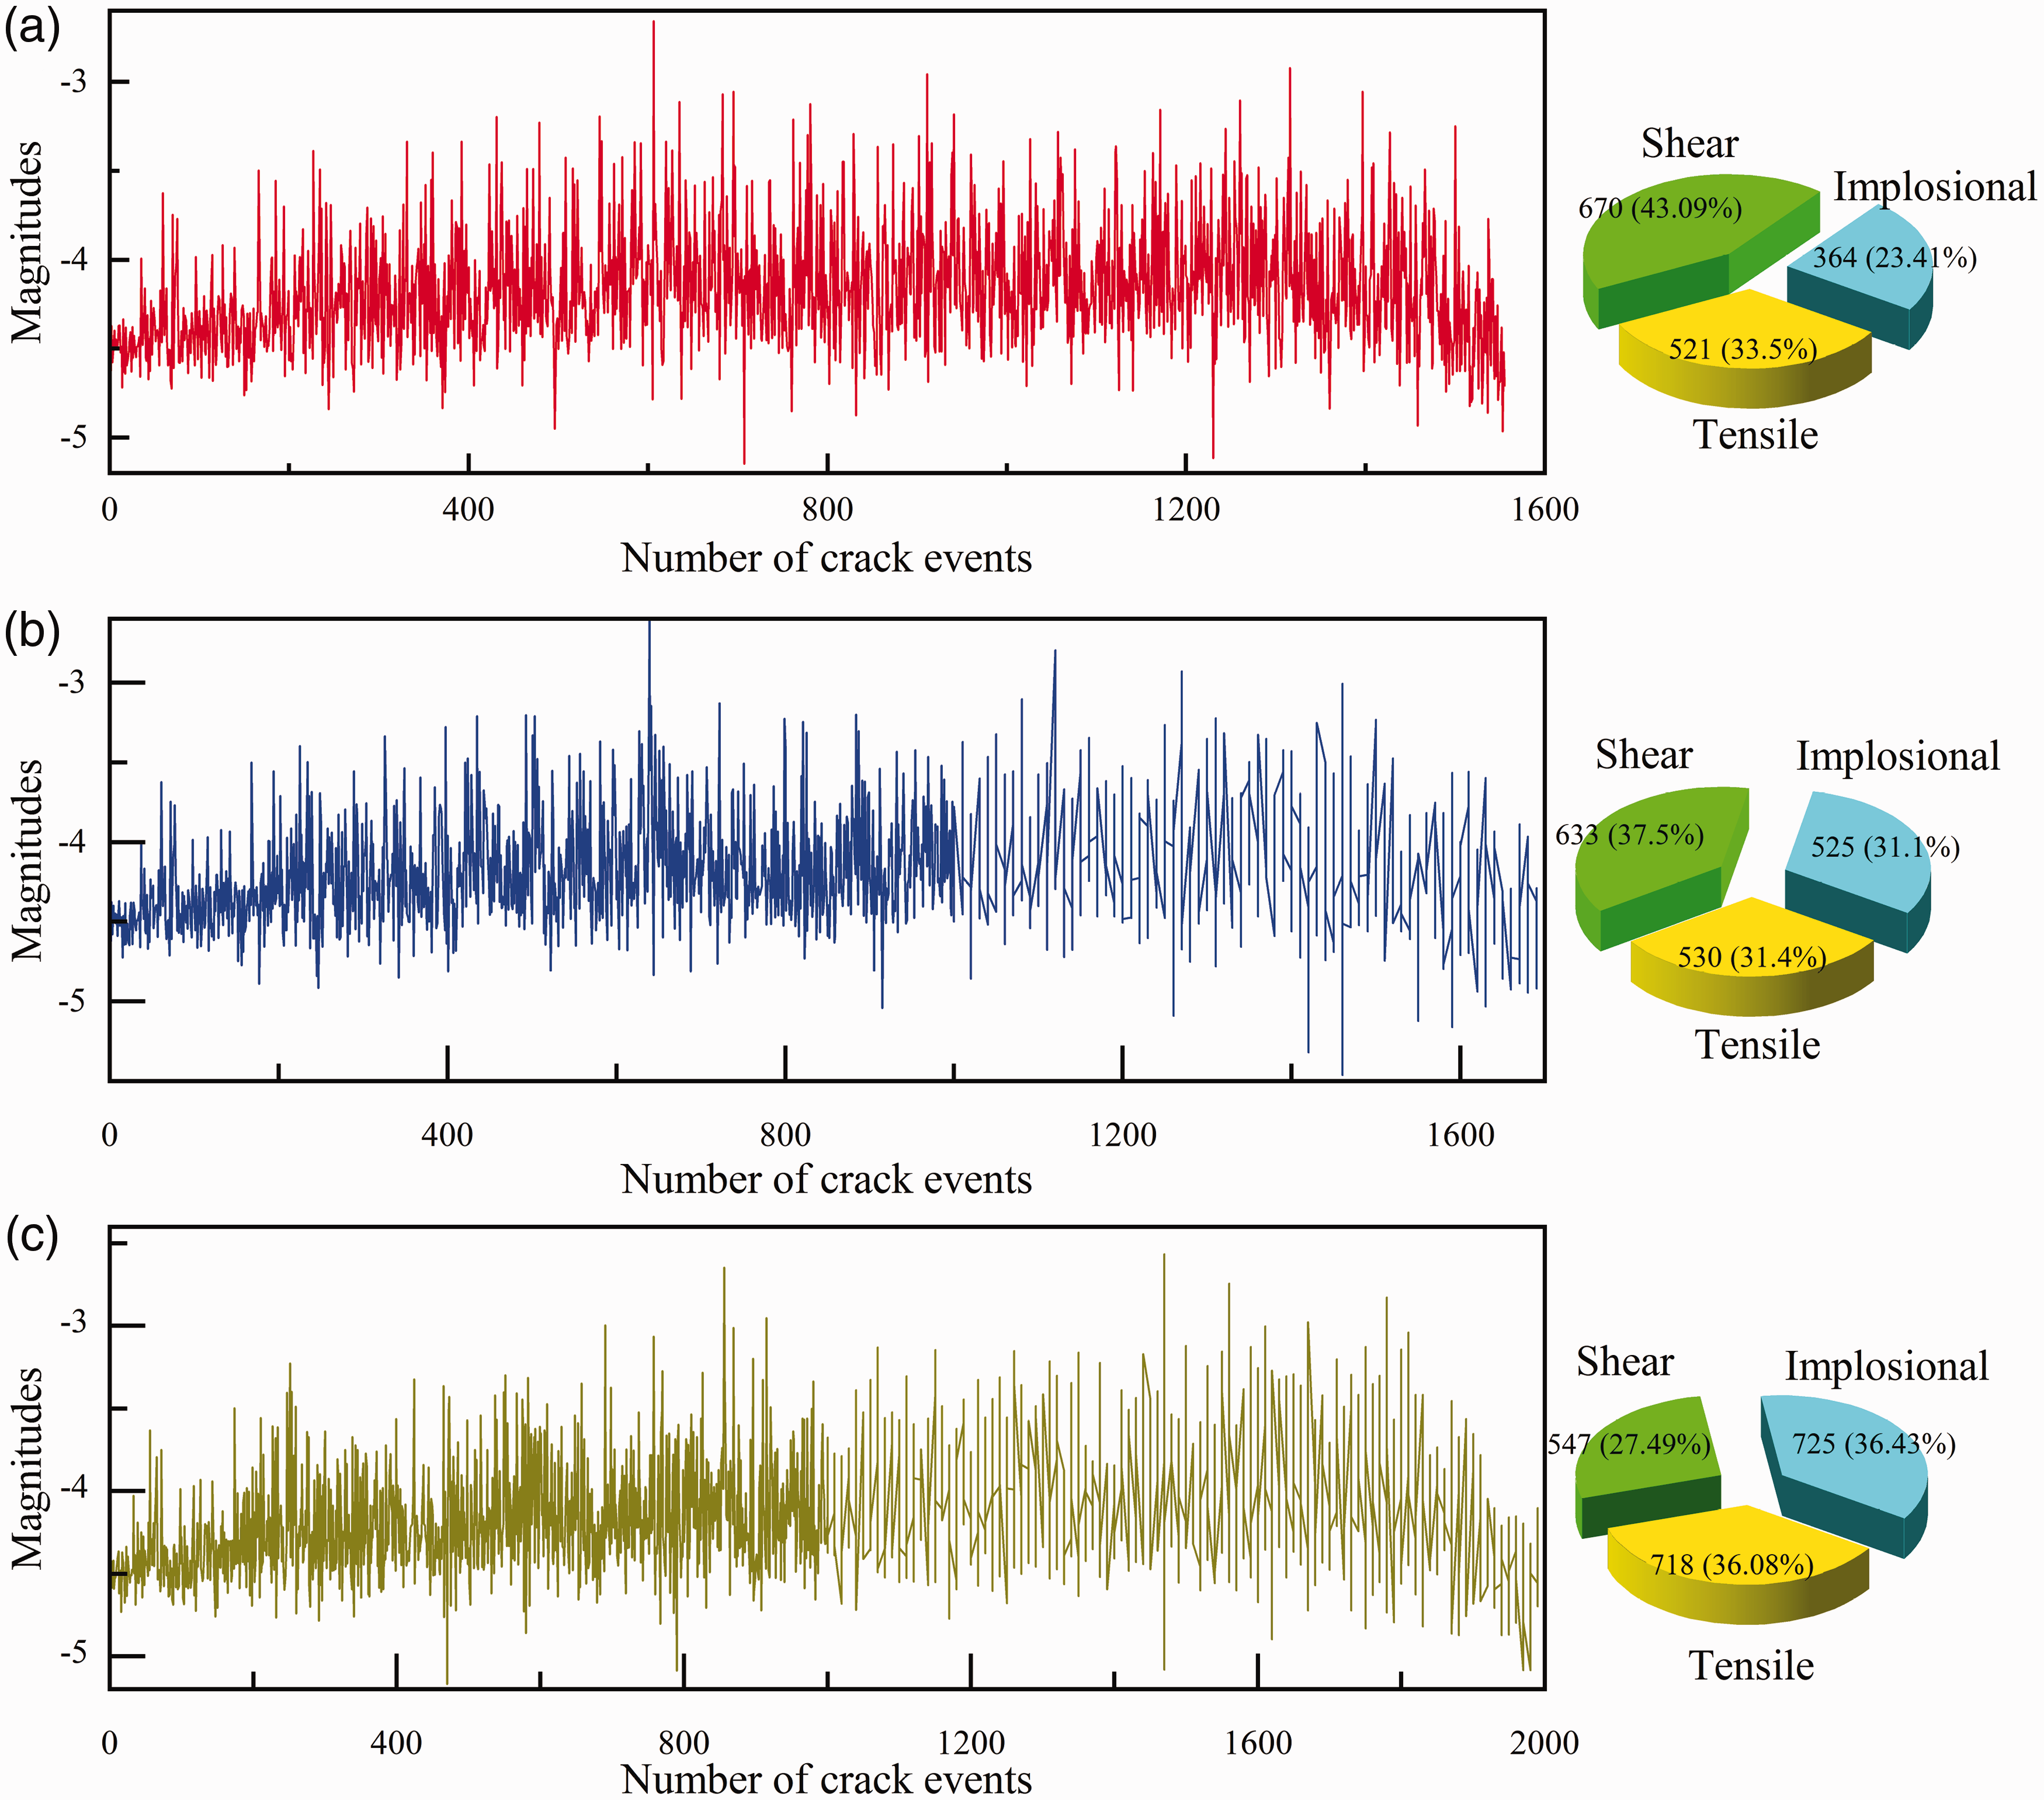
Magnitude curves and crack types. (a) low speed, (b) medium speed, and (c) high speed.
As the loading rate increased, the number of cracks generated by the specimens continued to increase. When the loading rate was low, the crack extension time was long and the energy release was relatively uniform and tight throughout the loading process. When the loading rate was high, the initial energy release of the specimen was low and dense, whereas that in the later stage was high and sparse. In terms of the crack type, the number of shear cracks decreased significantly as the loading rate increased, number of implosion cracks increased significantly, and the number of tensile cracks fluctuated slightly. The decrease in the number of shear cracks was the main reason for the increase in the brittleness of the specimen, which was consistent with the results of the experiment.
Discussion
Influencing factors of damping energy
Equation (8) shows that the damping capacity is related to the external excitation and intrinsic material properties. The influence of the stress amplitude and loading rate on the damping capacity was discussed earlier. This section discusses the intrinsic properties of the material, and the hysteresis curves under different circular frequencies and damping ratios are shown in Figure 10.
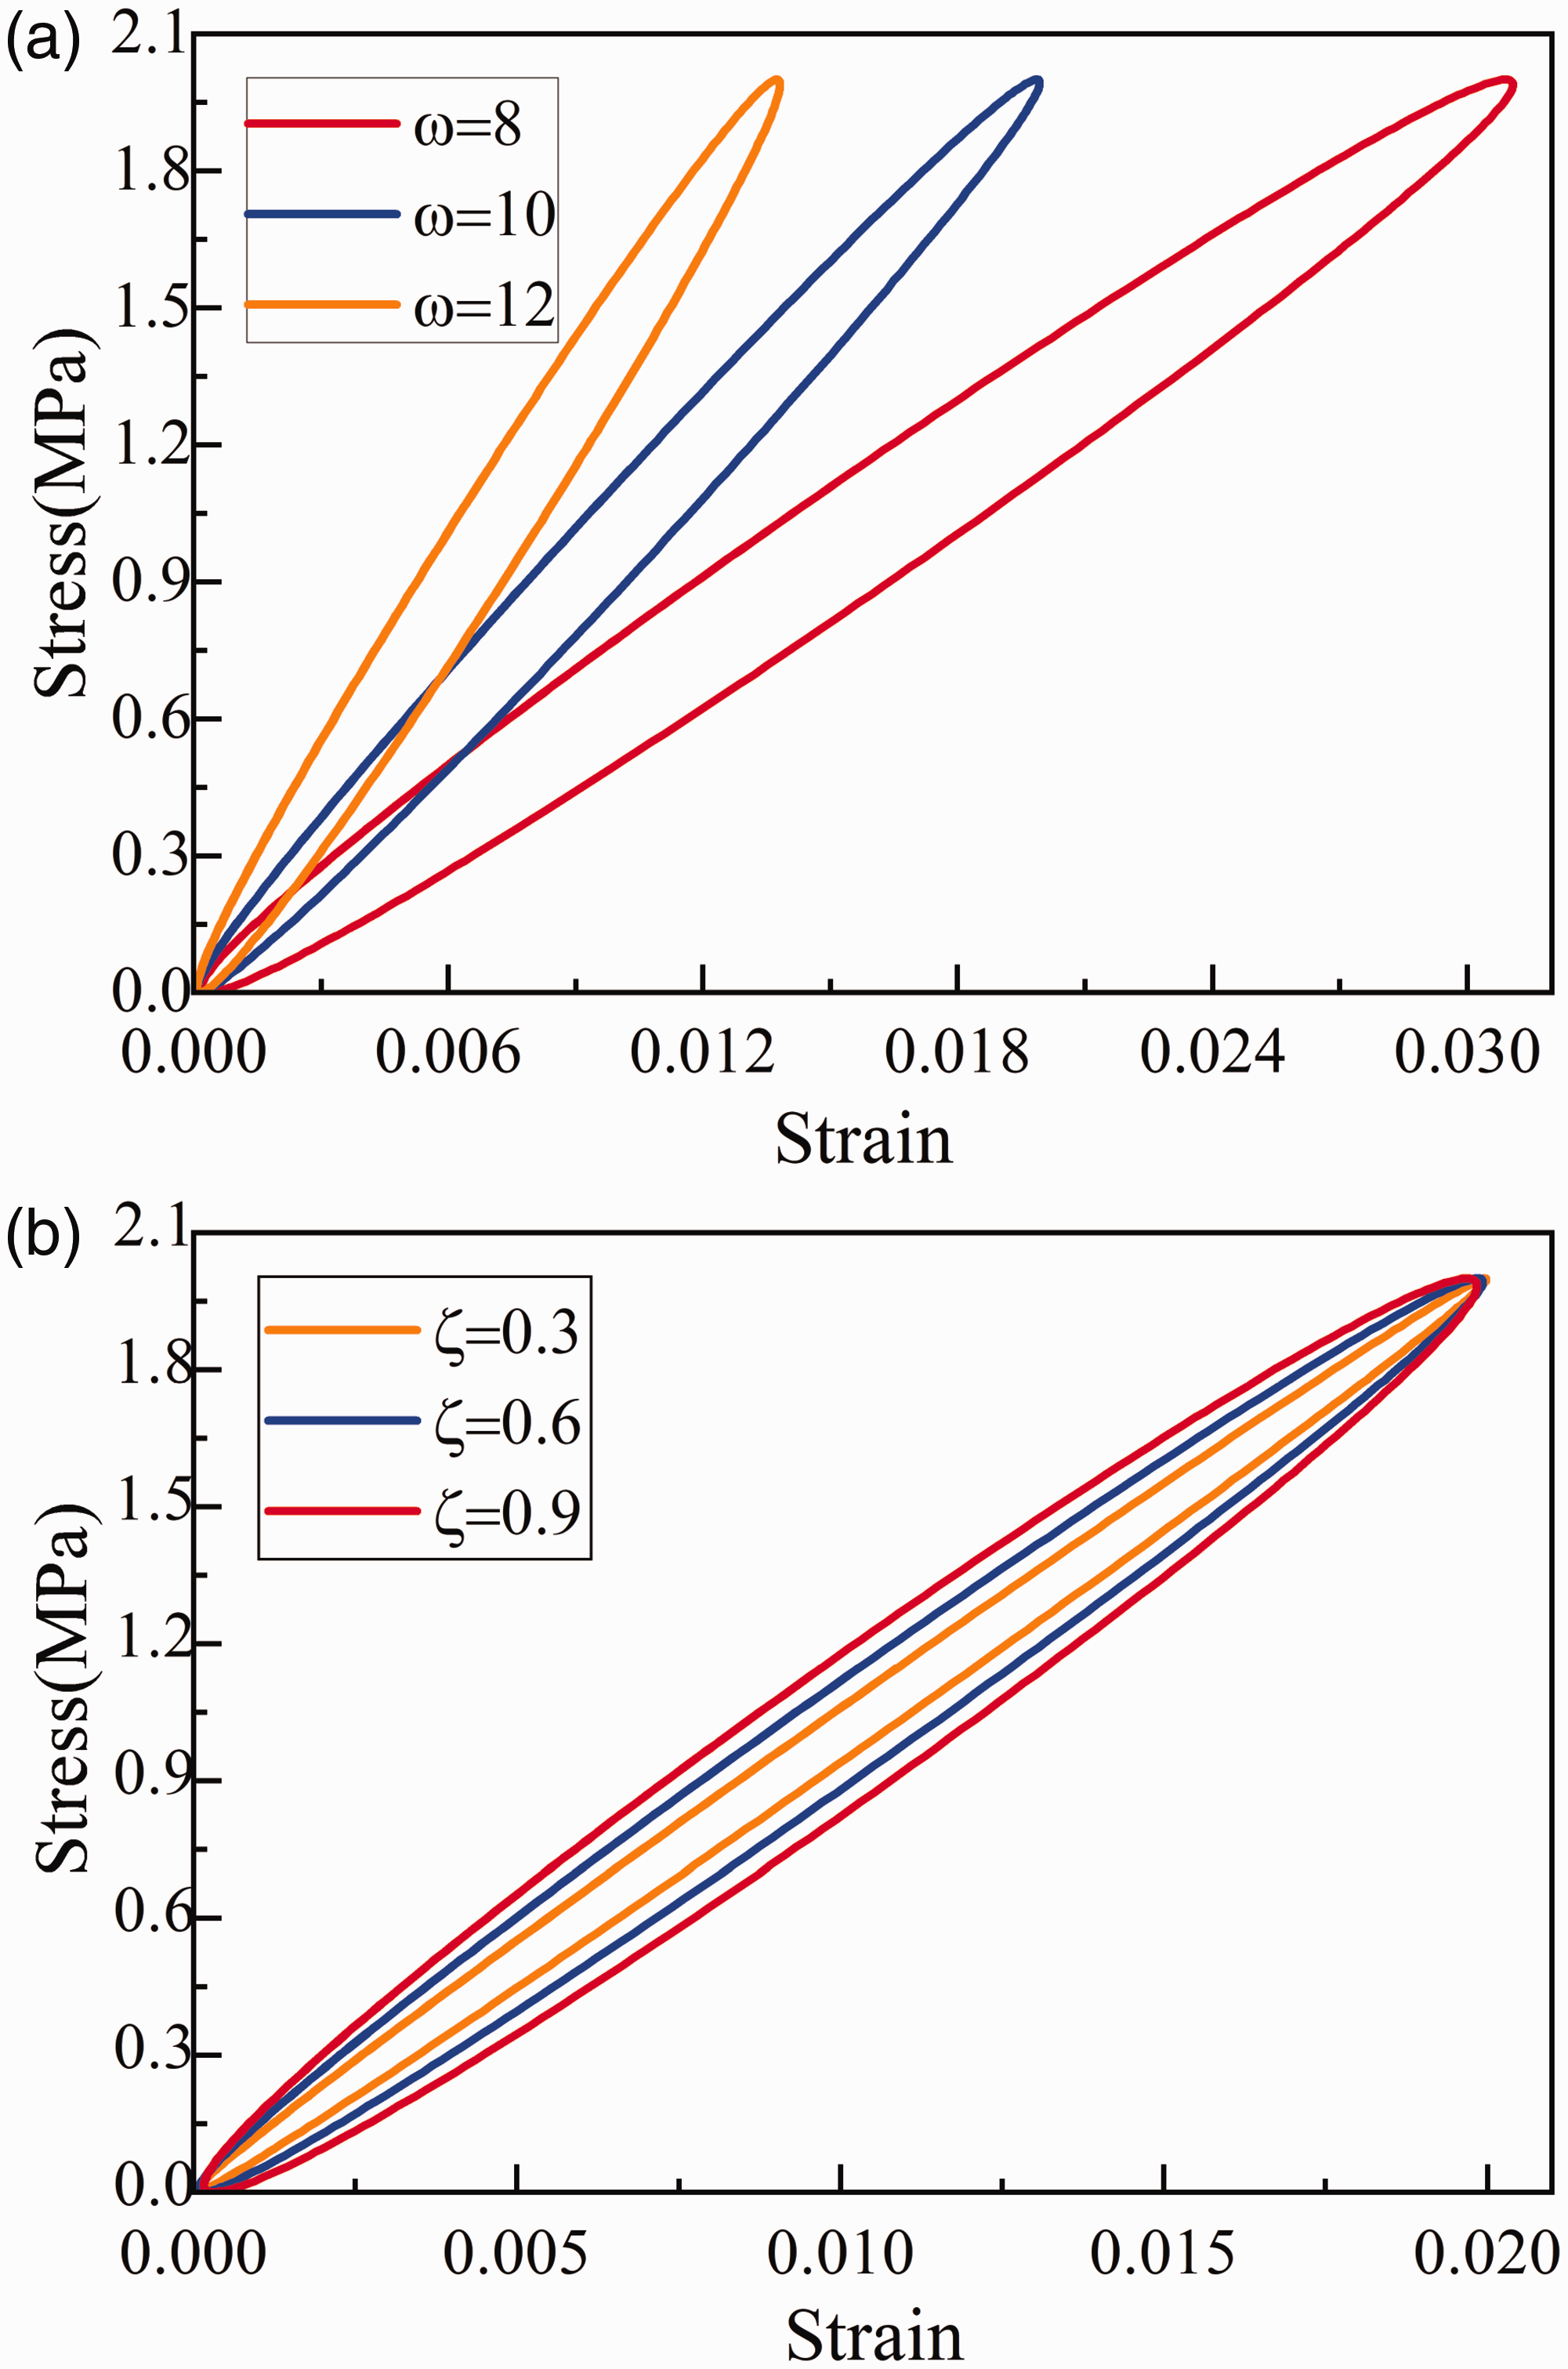
Factors affecting damping energy. Stress–strain plots at different (a)
In the stress–strain plots showing the effects of the circular frequency on the hysteretic loop, the hysteretic loop rotates counterclockwise as the circular frequency increases, and the strain decreases continuously, thus indicating that the stiffness of the material is continuously enhanced, which conforms to equation (4). Therefore, in actual engineering applications, when the load generated by a structure remains unchanged, a structure with greater stiffness exhibits less deformation and damping energy.
As the damping ratio increases [see Figure 10(b)], the area of the hysteretic loop increases (appearing larger in the figure), and the stress and strain at the peak point of the curve both decrease as a function of the damping ratio. This indicates that when the material stiffness and external load remain constant, an increase in the damping ratio makes the damping effect more evident, and the proportion of the damping force increases continuously.
Damage factor
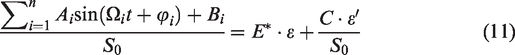
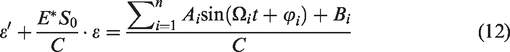
Damage factors are important physical parameters of damage mechanics and can objectively reflect the degree of damage to materials at different cyclic stages. After a long period of development, scholars have proposed different damage factor expressions based on the residual strain and tangent modulus. However, these expressions cannot accurately reflect the damage of strain-hardening materials. Therefore, a damage factor expression based on dissipated energy is proposed, which can be expressed as follows,
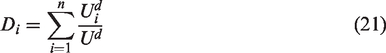
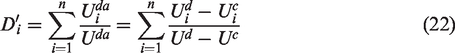
Because equation (11) does not consider damping effects, this study proposes a revised damage factor calculation method that considers damping effects, as follows,
The damage factors were obtained using two calculation methods, as shown in Figure 11.
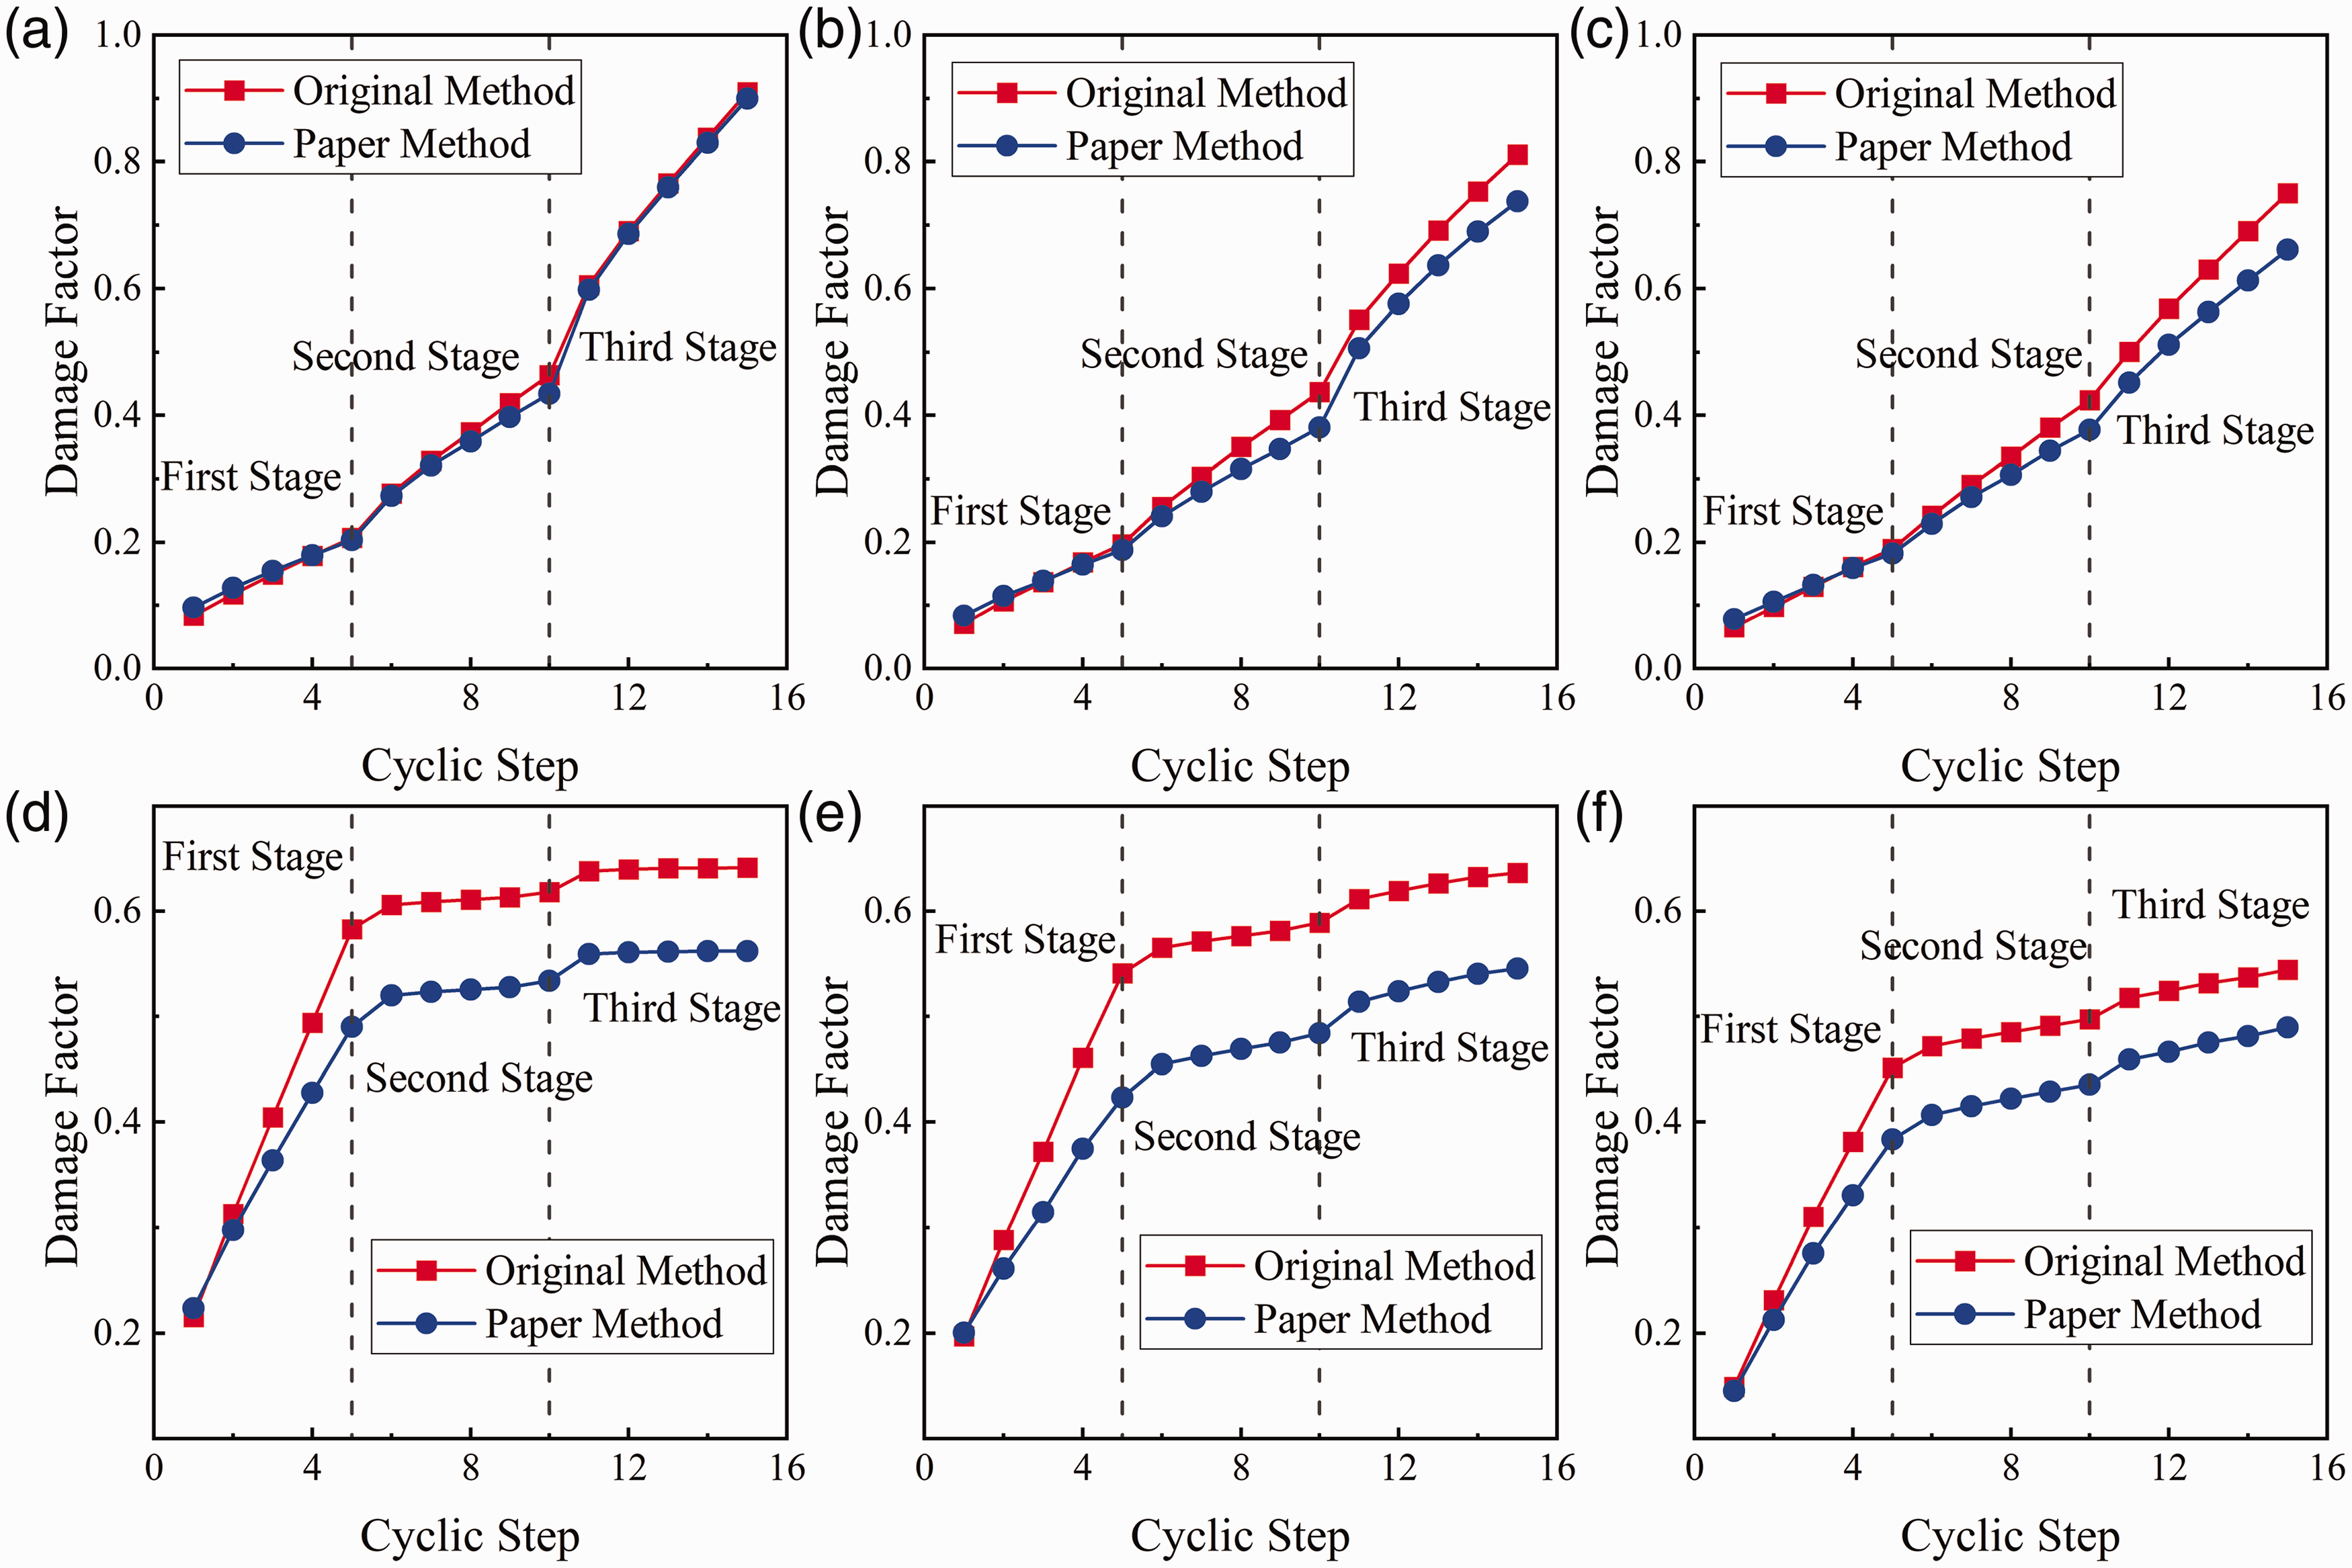
Damage factor curves. (a) CL-1, (b) CL-2, (c) CL-3, (d) CH-1, I CH-2, and (f) CH-3.
In the LLCS experiment, the difference between the two damage factors displayed by CL-1 was not large because of the slow loading rate and small proportion of the damping work. CL-2 and CL-3 were able to reflect fully the two calculation differences, and as the loading rate increased, the damage factor calculated by this method was lower than that calculated by the traditional method, thus indicating that the proportion of damping work gradually increased as the loading rate increased. At the same time, the damage factor calculated using this method has a higher starting point, thus indicating that the proportion of damage in the first cycle can be improved because the distortion caused by the inherent defects of the specimen in the first cycle can also be considered as damage, which can be improved in the follow-up test.
In the LLVS experiment, the damage factors obtained by the two methods showed obvious differences in the first stage but remained parallel in the second and third stages. This phenomenon can be expressed in terms of the energy evolution. Under high-stress amplitude conditions, the proportion of damping energy (which expends work) is large, and the influence on energy dissipation is significant; when the stress amplitude is small, the proportion of damping energy expending work is small, and the influence on energy dissipation is small. Therefore, in engineering practice, when a structure is subjected to disturbance loads with a small stress amplitude, the dissipated energy can be used to characterise the damage factor; however, when the stress amplitude is large, the use of dissipated energy to characterise the damage factor causes economic waste.
Comparison of LLCS and LLVS showed that the starting point of the damage factor in the LLVS experiment was higher and the endpoint was lower, thus indicating that the damage suffered by the specimen in the first stage of the LLVS experiment was greater and the damage suffered in the subsequent stages was smaller. This is consistent with the rule that the strength of the LLVS specimen was higher than that of the LLCS in the two experimental groups, thereby verifying the rationality of the damage factor calculation.
Strain equation curves
To verify the correctness of the construction proposed in this study, the same problem was analysed using equations (15) and (18), and the analytical solution curve and experimental curve were obtained, as shown in Figure 12.
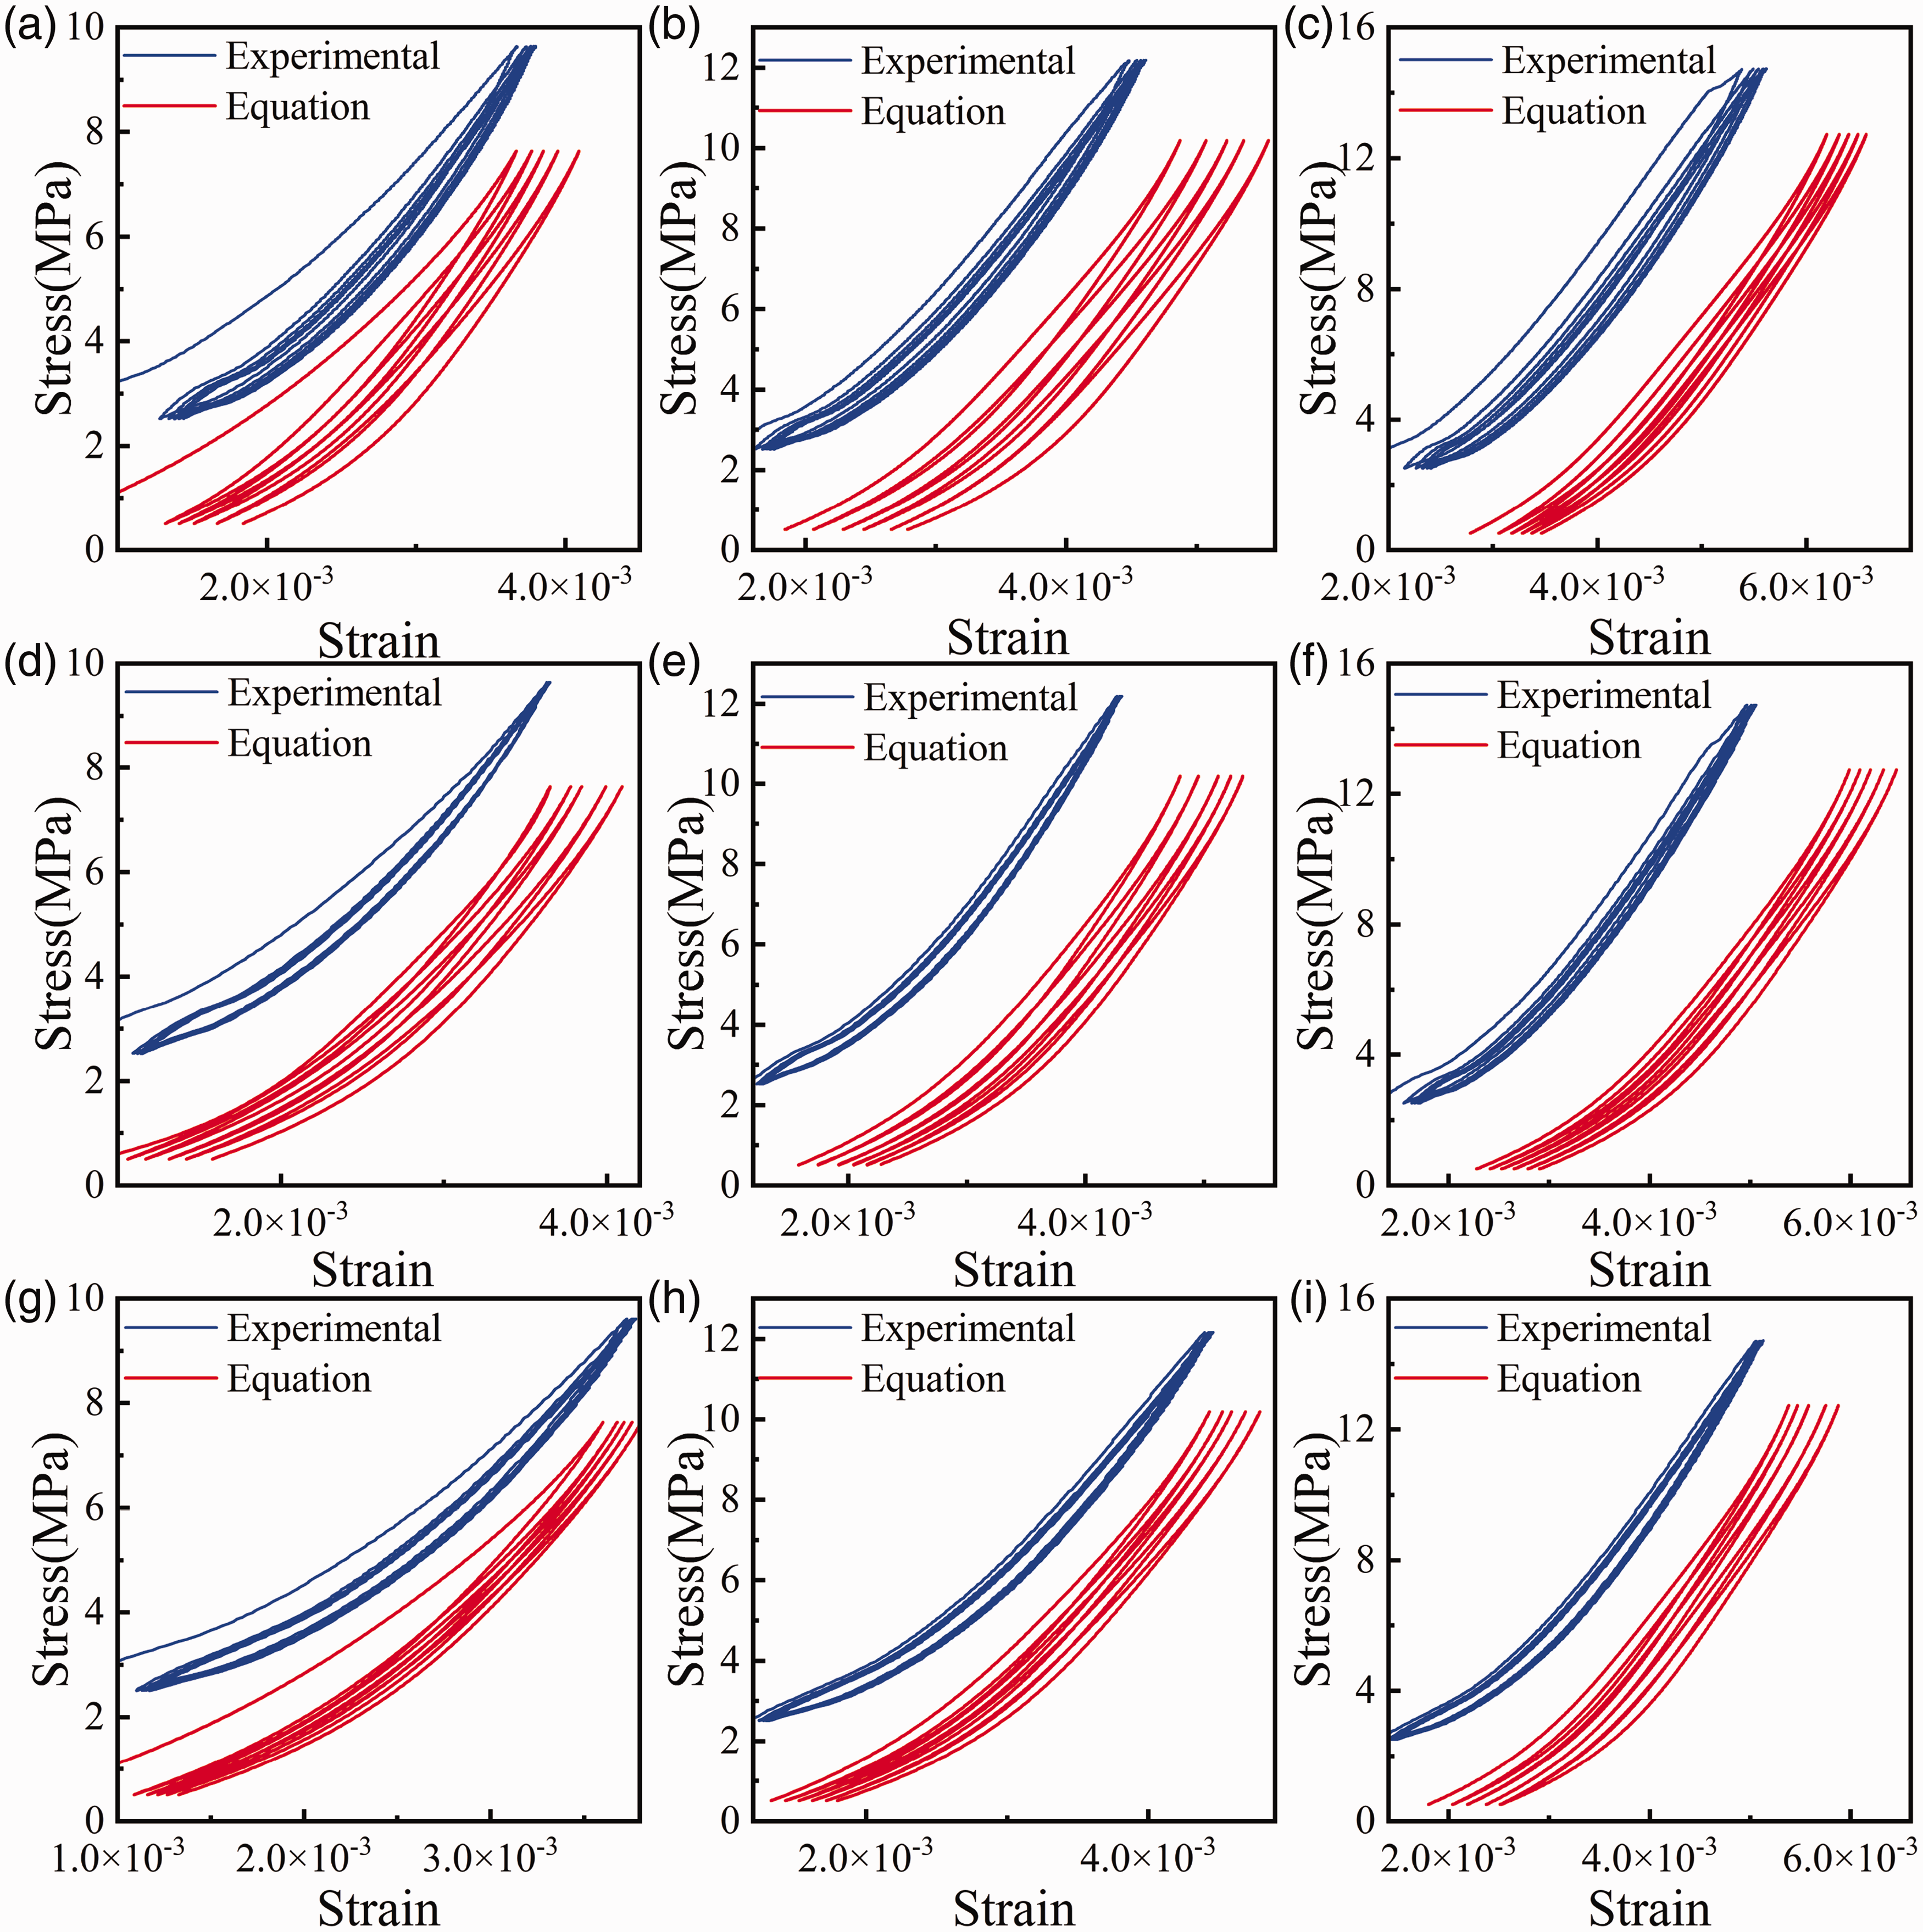
Comparison of constitutive equation curves with experimental curves. (a) CL-1-First stage, (b) CL-1-Second stage, (c) CL-1-Third stage, (d) CL-2-First stage, (e) CL-2-Second stage, (f) CL-2-Third stage, (g) CL-3-First stage, (h) CL-3-Second stage, and (i) CL-3-Third stage.
The experimental curves were shifted upward by 2 MPa to facilitate observation of the variability between the experimental and equation curves.
At the same loading rate, as the stress level increased, the equation and experimental curves showed the same pattern of change, that is, the hysteretic curve gradually became thinner, and the residual strain of the specimen increased. This indicates that the model can effectively express the effect of the stress level on specimen deformation. At the same stress level, as the loading rate increased, the hysteretic curve represented by the equation curve became denser, and the residual strain became smaller, thus proving that the model can effectively express the effect of the external loading frequency on the deformation of the specimen.
Although the model effectively reflected the effects of the stress level and loading frequency on the specimen deformation, the strains in the equation curves were significantly higher than those in the experimental curves. This was particularly noticeable at low-loading rates and improved as the loading rate increased. The reasons for this are twofold. The model misjudged the localisation of the initial parameters owing to the presence of defects, such as micro-cracks and holes in the specimen, which gradually compacted during the loading process. Secondly, the model overestimated the damping effect of the specimen under working conditions at low-loading frequencies, thus resulting in high-specimen deformation.
The standard values for the load phase were
The correctness of the model was further quantified by utilising the residual strain as an indicator to analyse the discrepancy between the model and experimental results. To mitigate the error caused by the compaction stage, the residual strain of the initial cycle was reduced to zero. Figure 13 illustrates the experimental and model error curves.
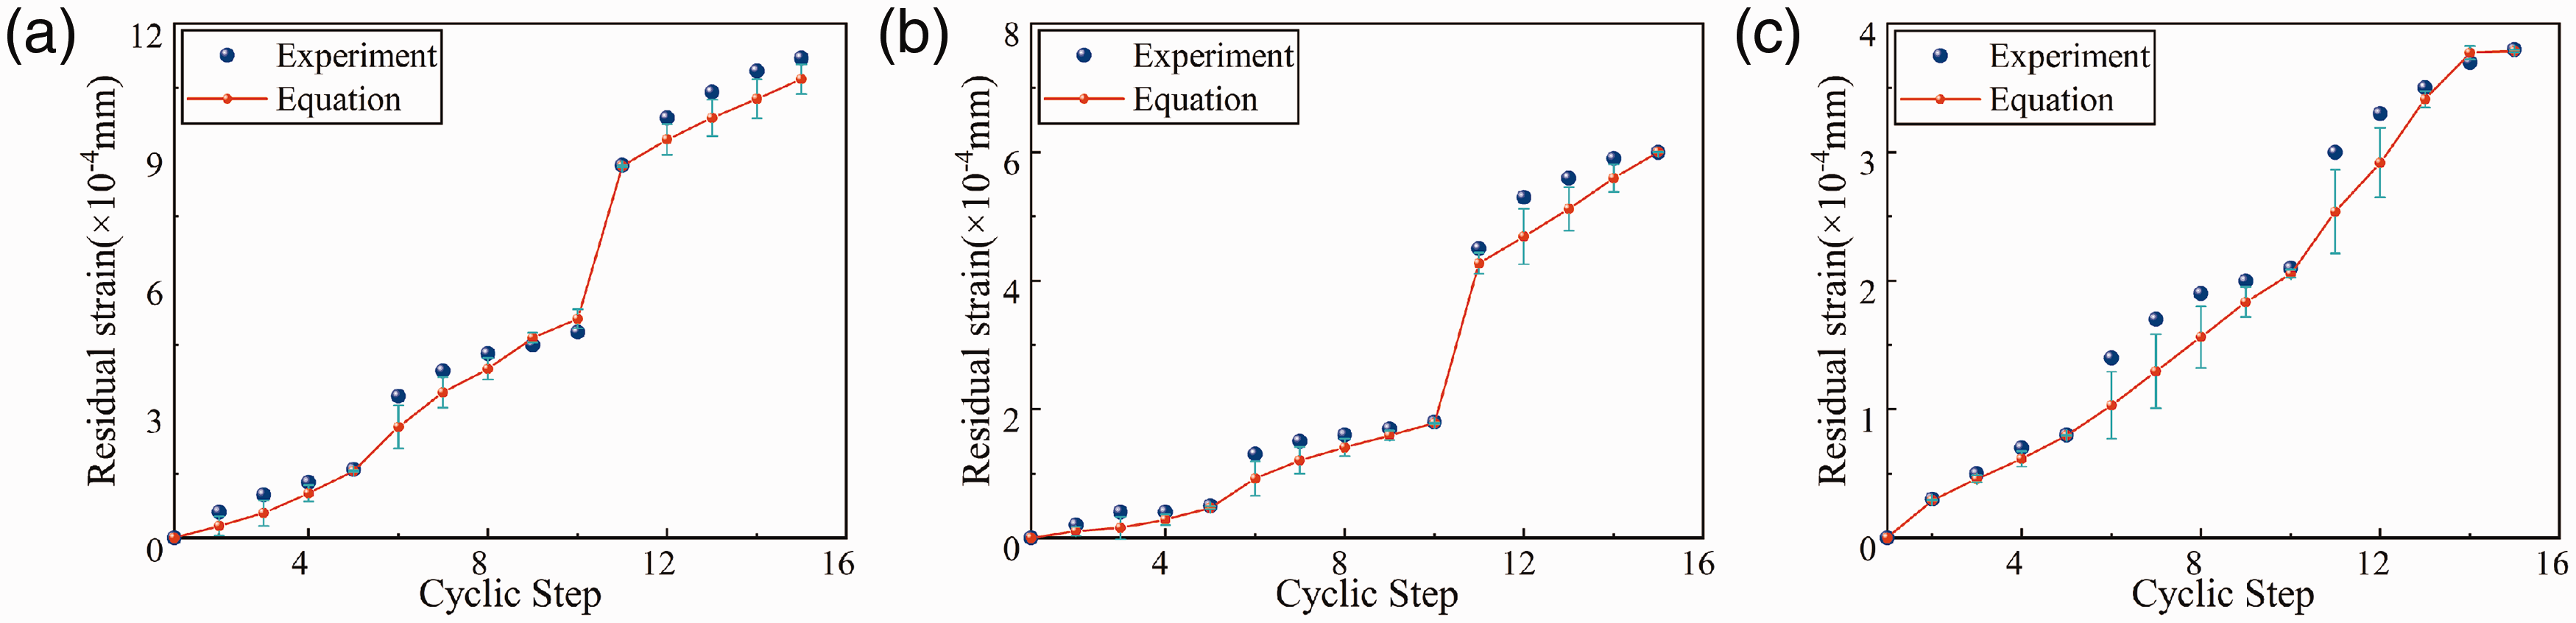
Residual strain error curves of model and equation. (a) CL-1, (b) CL-2, and (c) CL-3.
In the residual strain error curve, theory (equation) fitted well the test results. The CL-1 sample yielded a maximum error of 27.49% in the 6th cycle, while the CL-2 sample yielded a maximum error of 24.52% in the 7th cycle; additionally, sample CL-3 sample yielded a maximum error of 31.35% in the 8th cycle. In the final cycles, errors for CL-1, CL-2, and CL-3 were respectively measured and were found to be equal to 4.59%, 0.06%, and 0.36%. During middle-stage loading, there was a greater discrepancy between samples owing to incomplete compaction during the initial stages that led to more prominent unrecoverable deformation during testing, as shown in Figure 13, where scatter points have residual strain values larger than those of the models (equation); however, the discrepancies decreased subsequently, thus indicating that the equations effectively reflected axial deformation during cyclic loading/unloading, thus verifying their correctness.
Equation influence factors
To investigate further the effect of the pending coefficient on the strain curve, the values of the pending coefficient were varied separately, and the stress–strain curves for different pending coefficients were obtained, as shown in Figure 14.
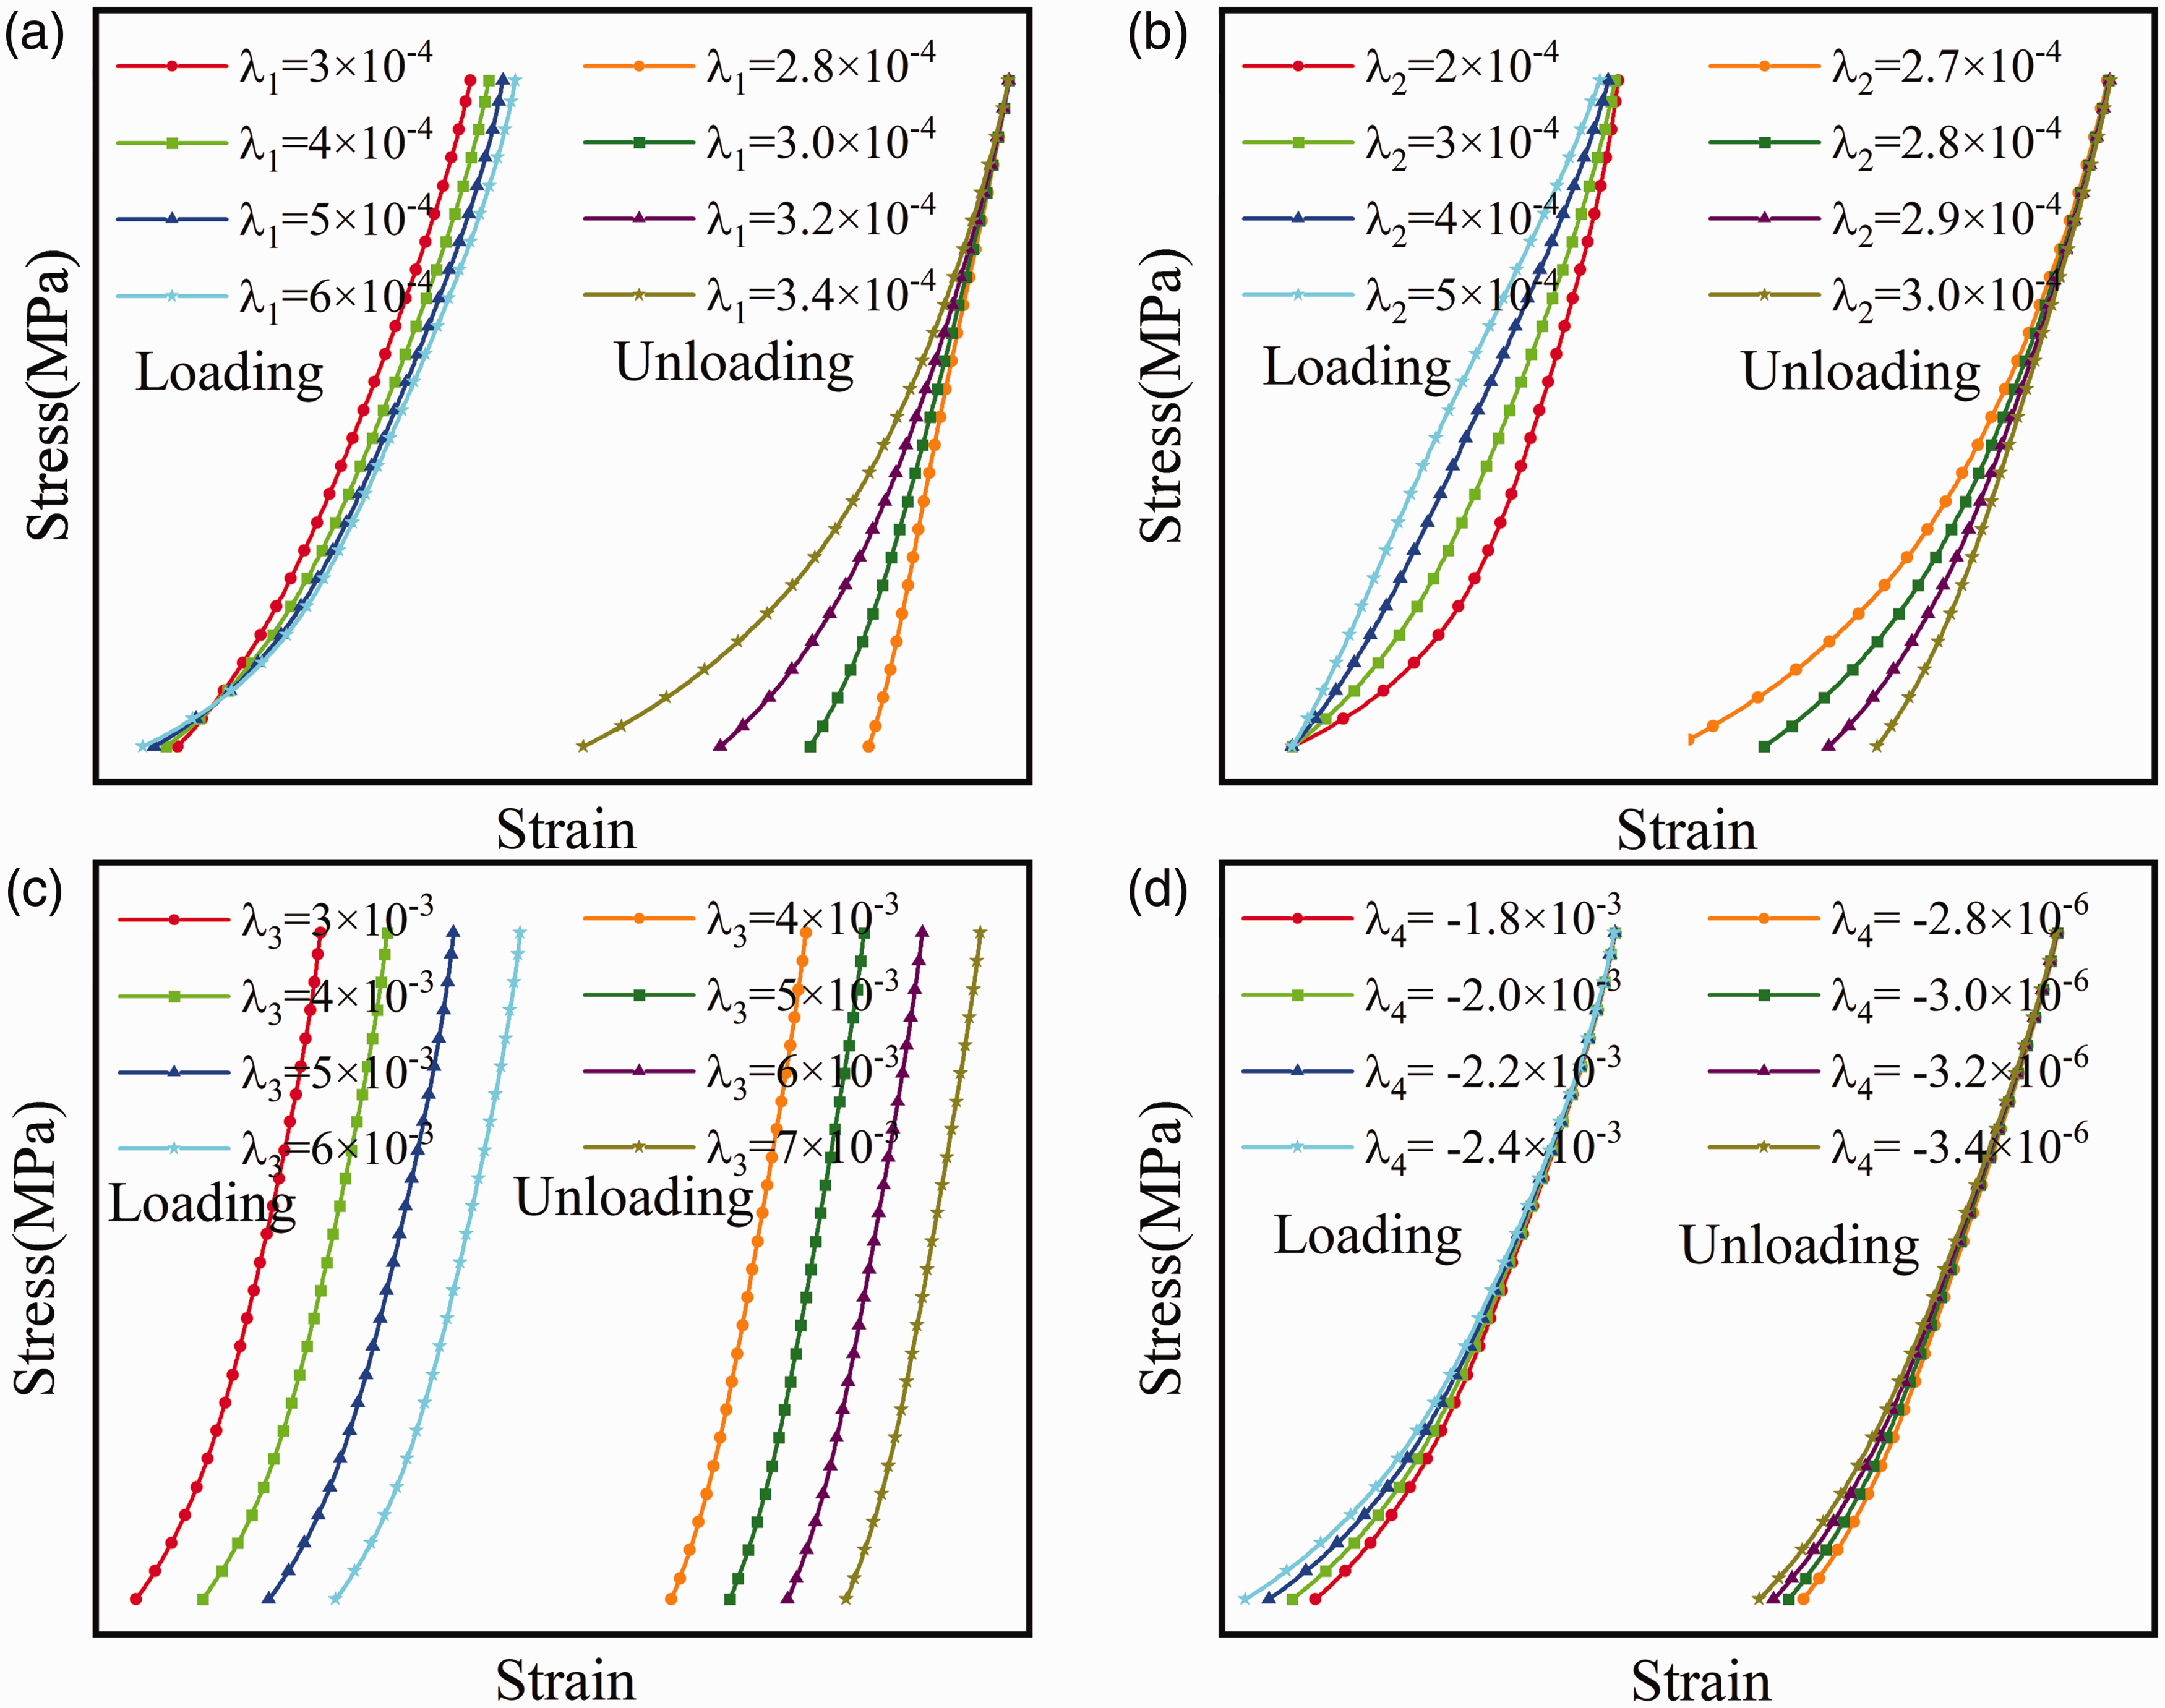
Influences of undetermined coefficients. (a)
Effects of
From the Figure 14, it can be observed that 2. Effects of
Parameter 3. Effect of
Whether in the loading or unloading phases, the 4. Effects of
The
In summary, when a material has a small coefficient of uncertainty, its ability to resist deformation and recover from strain increases.
To summarize, the damping effect under cyclic load exhibits significant prominence. In geotechnical and mining engineering, fully considering the damping effect holds crucial economic value in accurately assessing the structural safety performance and service life. However, practical engineering encounters confining pressure on rocks along with numerous internal joints within them. These external stress fields and internal joint distributions inevitably impact the stability of underground engineering projects. Consequently, certain limitations exist in this study.
Conclusions
The present study discusses the influence of damping effect on the strain equation and damage evolution of gypsum samples under cyclic loading, aiming to provide a theoretical basis for damage assessment of geotechnical structures. The key findings are as follows.
Herein, the strain equation and damping energy calculation method for cyclic loading and unloading tests were presented. LLVS and LLCS tests were conducted at three different loading rates to validate the accuracy of the proposed method. The results demonstrate that the final residual strain errors of the equation and model under these loading rates were 4.59%, 0.06%, and 0.36%, respectively. Moreover, the model effectively fitted the experimental strain curve, thereby confirming its accuracy in predicting the deformation behaviour and damage law. The LLCS and LLVS tests were conducted at the loading rates of 200, 500, and 800 N/s to investigate the damage factors and energy evolutions of the six groups of tested specimens. The results demonstrated that the strength of LLCS increased by 2.38%, 6.41%, and 11.64%, respectively, as the loading rate increased compared with uniaxial compression testing. Similarly, LLVS exhibited increases in strength of 1.59%, 8.32%, and 1.14%, respectively, when compared with LLCS at different loading rates. Moreover, it was observed that at increasing loading rates, both the damage energy density and damage factor of the tested specimens gradually decreased. The experimental curves showed that the energy evolution law based on the damage energy was obvious, whereas the evolution law of the dissipative energy was relatively chaotic, further verifying that the representation of the damage factor based on the damage energy is more reasonable. Considering the representation of damping energy under high-stress amplitude and high-frequency disturbance conditions, economic losses can be reduced to a certain extent. Numerical simulations of the moment tensor acoustic emission at different loading rates were performed to analyse the damage factors and damage characteristics of the specimens at different loading paths. The results showed that the brittle behaviours of the specimens became obvious as the loading rate increased, the number of cracks produced in the experiment increased significantly, distribution of cracks gradually shifted from the centre to the periphery, seismic level of the specimen exhibited a dissipation mode (dense and sparse characteristics) as the loading rate increased, shear cracks gradually transformed into mixed cracks, and the shear cracks gradually changed into mixed cracks, owing to the superposition of the aforementioned factors. The final damaged shape of the specimen following increases in the loading rate was denoted as ‘crushed’.
The model proposed in this study effectively elucidated the stress–strain relationship during cyclic loading and unloading and provided an analytical framework for the assessment of the structural safety performance under perturbed loading conditions. However, it is important to note that this model was significantly influenced by the load order and initial fitting parameters. In the presence of micro-holes and micro-cracks within the sample, there was a notable increase in the positioning error of the model parameters that led to substantial deviations between the model predictions and experimental observations. Therefore, future research should consider inherent defects, anisotropy, and other relevant factors to refine cyclic loading and unloading models.
Highlights
A cyclic loading/unloading strain equation that considers the damping effect and a modified damage-factor calculation method are proposed The loading rate and lower limit of the cyclic stress can effectively suppress axial deformation, increase the peak strength, and reduce the degree of damage to the specimen As the loading rate increased, the percentage of shear cracks in the specimens significantly decreased, number of mixed cracks significantly increased, and the brittleness of the specimens became apparent Smaller strain equation coefficients represent materials with greater resistance to deformation and strain recovery
Footnotes
Author contributions
DW was involved in the experiments, methodology, and writing (the original manuscript). LJ was used for the experiments and methodology. WJ provided funding. SP was involved in the conceptualisation and guided the study.
Availability of data and material
The data supporting the findings of this study are available from the corresponding author [DW] upon reasonable request.
Consent for publication
The authors of this paper provide consent for publication in the INTERNATIONAL JOURNAL OF DAMAGE MECHANICS.
Declaration of conflicting interests
The author(s) declared no potential conflicts of interest with respect to the research, authorship, and/or publication of this article.
Ethics approval and consent to participate
The present study obeys the ethical responsibilities required by the INTERNATIONAL JOURNAL OF DAMAGE MECHANICS.
Funding
The author(s) disclosed receipt of the following financial support for the research, authorship, and/or publication of this article: This study was supported by the Project of the National Natural Science Foundation of China [grant number 51904012], the Key Projects of Natural Science Research in Colleges and Universities in Anhui Province [grant number KJ2019A0099], and the Projects supported by the Scientific Research Activities of Postdoctoral Researchers in Anhui Province [grant number 2018B268].