
Abstract
Horizontal spacing between twin parallel tunnels and surrounding rock joint dip angle are critical to tunnel stability. To clarify the underlying mechanisms, uniaxial compression tests were conducted on rock-like specimens with parallel holes (spacing: 0, 20, 40, and 60 mm) and prefabricated joints (dip angle: 0°, 30°, 45°, 60°, and 90°), with acoustic emission (AE) and digital image correlation (DIC) employed to monitor crack propagation and full-field strain evolution. Results show horizontal spacing affects specimen strength by regulating inter-hole stress superposition, with peak stress showing a nonmonotonic trend of first rising then falling and 20 to 40 mm spacing optimizing stress distribution to enhance load-bearing stability; joint dip angle dominates failure modes via crack propagation paths, as a 45° dip induces the strongest compression-shear coupling to maximize bearing capacity and increase mixed-mode cracks while shear cracks prevail at other angles. A boundary line with a slope of 100 enables quantitative distinction between different crack types, thus confirming the dynamic influence of these two parameters (horizontal spacing and joint dip angle) on crack modes. Additionally, numerical simulations conducted via COMSOL Multiphysics confirmed the existence of a “low-stress bridge” effect between the two parallel holes and elucidated the compression-shear coupling mechanism along the joint surface.
Introduction
With accelerating urbanization and infrastructure development, tunnel engineering has been widely applied in transportation, water conservancy, energy, and other fields. Tunnel stability is critical to ensuring the overall safety of tunnel engineering projects (Yang et al., 2025a). Due to complex geological conditions and specific spatial constraints, the layout of vertically parallel (upper and lower) tunnels has gradually become a common design scheme. Among the many factors affecting the stability of these vertically parallel tunnels, horizontal spacing, and the dip angle of joints in the rock mass between them are two of the most critical (Zhou et al., 2017). Horizontal spacing directly determines the degree of mutual influence between the two upper and lower tunnels, while joints, which act as structural discontinuities within the rock mass, exert a significant effect on tunnel stability depending on their dip angles (Wang et al., 2023a, 2024a).
In recent years, in the context of underground engineering practices such as subway construction and utility tunnel development, scholars worldwide have systematically investigated the mechanical properties of jointed multihole rock masses via laboratory experiments. Numerous investigations combining experimental and theoretical analyses have confirmed that the cross-sectional shape of tunnels (e.g. circular, elliptical, and polygonal) significantly influences tunnel structural stability (Batista, 2011; Yang et al., 2017; Yang et al., 2018). Among these shapes, circular tunnels aligned with the direction of the major principal stress are most effective in stabilizing crack propagation in specimens with three coplanar or noncoplanar holes; this configuration has helped clarify the spatiotemporal evolution of crack initiation and coalescence in multihole structures. Huang et al. (2017) employed digital image correlation (DIC) technique to investigate crack propagation in three-hole specimens, providing detailed insights into the processes of crack initiation and coalescence. Wu et al. (2019), by means of acoustic emission (AE) monitoring, compared the mechanical responses of specimens with one to four horseshoe-shaped openings and established a quantitative model that describes the relationship between the number of openings and energy dissipation characteristics. In summary, although substantial research has been conducted on the stability of rock masses with different hole geometries and quantities, studies focusing on hole spacing in double-hole rock mass structures still require in-depth investigation. Filling this research gap is crucial for analyzing the stability of upper and lower parallel tunnel projects and ensuring construction safety (Zhu et al., 2022).
Existing studies have demonstrated that the dip angle and spacing of joints in rock masses exert a significant influence on the mechanical behavior of rock masses (Park and Bobet, 2009). In general, the presence of joints induces severe local stress concentrations, which facilitate the initiation and propagation of cracks and thus reduce the overall strength of the rock mass (Zhang and Wong, 2013). Yang (2011) observed that sandstone specimens containing pre-existing flaws develop wing and secondary cracks, and the propagation of these cracks dominates the instability process of the sandstone specimens. Cao et al. (2016) investigated the effect of joint dip angle on the strength of rock-like specimens and found that when the dip angle exceeds 45°, the strength of such specimens decreases by approximately 30% to 50%. Furthermore, joint spacing and overlap exert a combined effect on local stress concentration; when the joint spacing is less than twice the joint length, the strength of rock-like specimens decreases by more than 40% (Prudencio and Van Sint Jan, 2007). The interaction between multiple joints further complicates the mechanical response: double-jointed specimens exhibit a 25% to 40% reduction in strength compared with single-jointed specimens (Cao et al., 2015), while specimens containing three joints may undergo chain-like crack coalescence, reducing their residual strength to one-third of that of intact rocks (Wong and Einstein, 2009). Combined experimental and numerical studies indicate that the stress concentration factor at the joint tip can reach three to five times the far-field stress, altering the location where cracks initiate and significantly accelerating crack propagation (Lin et al., 2021). In engineering applications, when the spacing of surrounding rock joints is less than 0.5 m and the dip angle ranges from 60° to 75°, the load carried by the support structure can increase by 50% to 80%, which is consistent with the results of laboratory-scale fault simulations (Bobet and Einstein, 1998). As a key geometric parameter governing the stability of rock masses, the joint dip angle provides critical quantitative guidance for underground engineering design (Min et al., 2025).
In laboratory experiments, the primary objective of rock testing techniques is to monitor fracture evolution in real time and accurately capture the failure behavior of specimens. In early studies, conventional deformation monitoring methods relied on strain gauges to obtain stress–strain curves, by means of which five characteristic stages of the entire failure process were identified (Jiefan et al., 1990). However, this approach has significant limitations in detecting crack initiation and propagation in rock specimens with defects. With advances in imaging technology, DIC has been increasingly employed to analyze the surface deformation and failure processes of specimens under load (Chen et al., 2024). The fundamental principle of DIC involves tracking displacement variations in the speckle pattern on the specimen surface to obtain full-field surface strain, thereby facilitating precise crack identification (Zheng et al., 2025). In addition, AE technology has been increasingly used to characterize crack development in rock specimens (Jia et al., 2025). Analyzing AE signals allows researchers to classify the detected cracks into three types: tensile, shear, and mixed-mode (Wong and Einstein, 2009). Zhu et al. (2019) combined DIC and AE techniques in uniaxial compression tests on prismatic sandstone specimens containing pre-existing holes filled with various inclusions, while simultaneously recording and analyzing the deformation and crack evolution of the specimens. Miao et al. (2018) also employed AE and DIC to monitor damage evolution, providing deeper insights into crack behavior in the specimens, and used high-resolution cameras to capture macroscopic crack patterns for subsequent identification and classification.
Previous studies have primarily focused on the influence of hole shape and number on the stability of rock mass structures, whereas many studies have investigated the deformation and failure characteristics of intact rock masses in terms of joint dip angle and number. However, systematic investigations on the load-bearing behavior and crack development patterns of double-hole rock mass structures that consider both hole spacing and joint dip angle simultaneously remain limited. Moreover, existing research methods often rely on a single analytical method and lack full integration of AE parameter identification, DIC-based full-field strain analysis, and numerical simulation. To fill these research gaps, this study fabricated double-hole rock-like specimens with different horizontal hole spacings (0, 20, 40, and 60 mm) and joint dip angles (0°, 30°, 45°, 60°, and 90°). By integrating the characteristics of AE energy accumulation, the average frequency (AF)–rise angle (RA) crack classification method, and DIC-based full-field strain evolution analysis, this study elucidates the multistage deformation characteristics of double-hole rock masses under loading. In addition, numerical simulations were performed to examine the distribution of principal stress around the two parallel holes. The findings provide theoretical guidance for the design and stability evaluation of upper and lower vertically parallel tunnels.
Sample preparation and experimental system
Sample preparation
To investigate the effects of horizontal spacing and joint dip angle on the strength and failure characteristics of rock masses corresponding to upper and lower parallel tunnels, this study referred to relevant research (Hu et al., 2020; Lin et al., 2020) and fabricated rectangular rock-like specimens (200 × 150 × 30 mm, length × width × thickness) (Luo et al., 2017). Prefabricated circular holes (with a radius of 36 mm) were used to simulate tunnel structures. The vertical center-to-center distance between the upper and lower holes was set to 100 mm, which met the specification of the International Tunneling Association, which states that the minimum clear distance between two tunnels should not be less than the diameter of each tunnel (Li et al., 2020). The geometry of the specimens is illustrated in Figure 1.
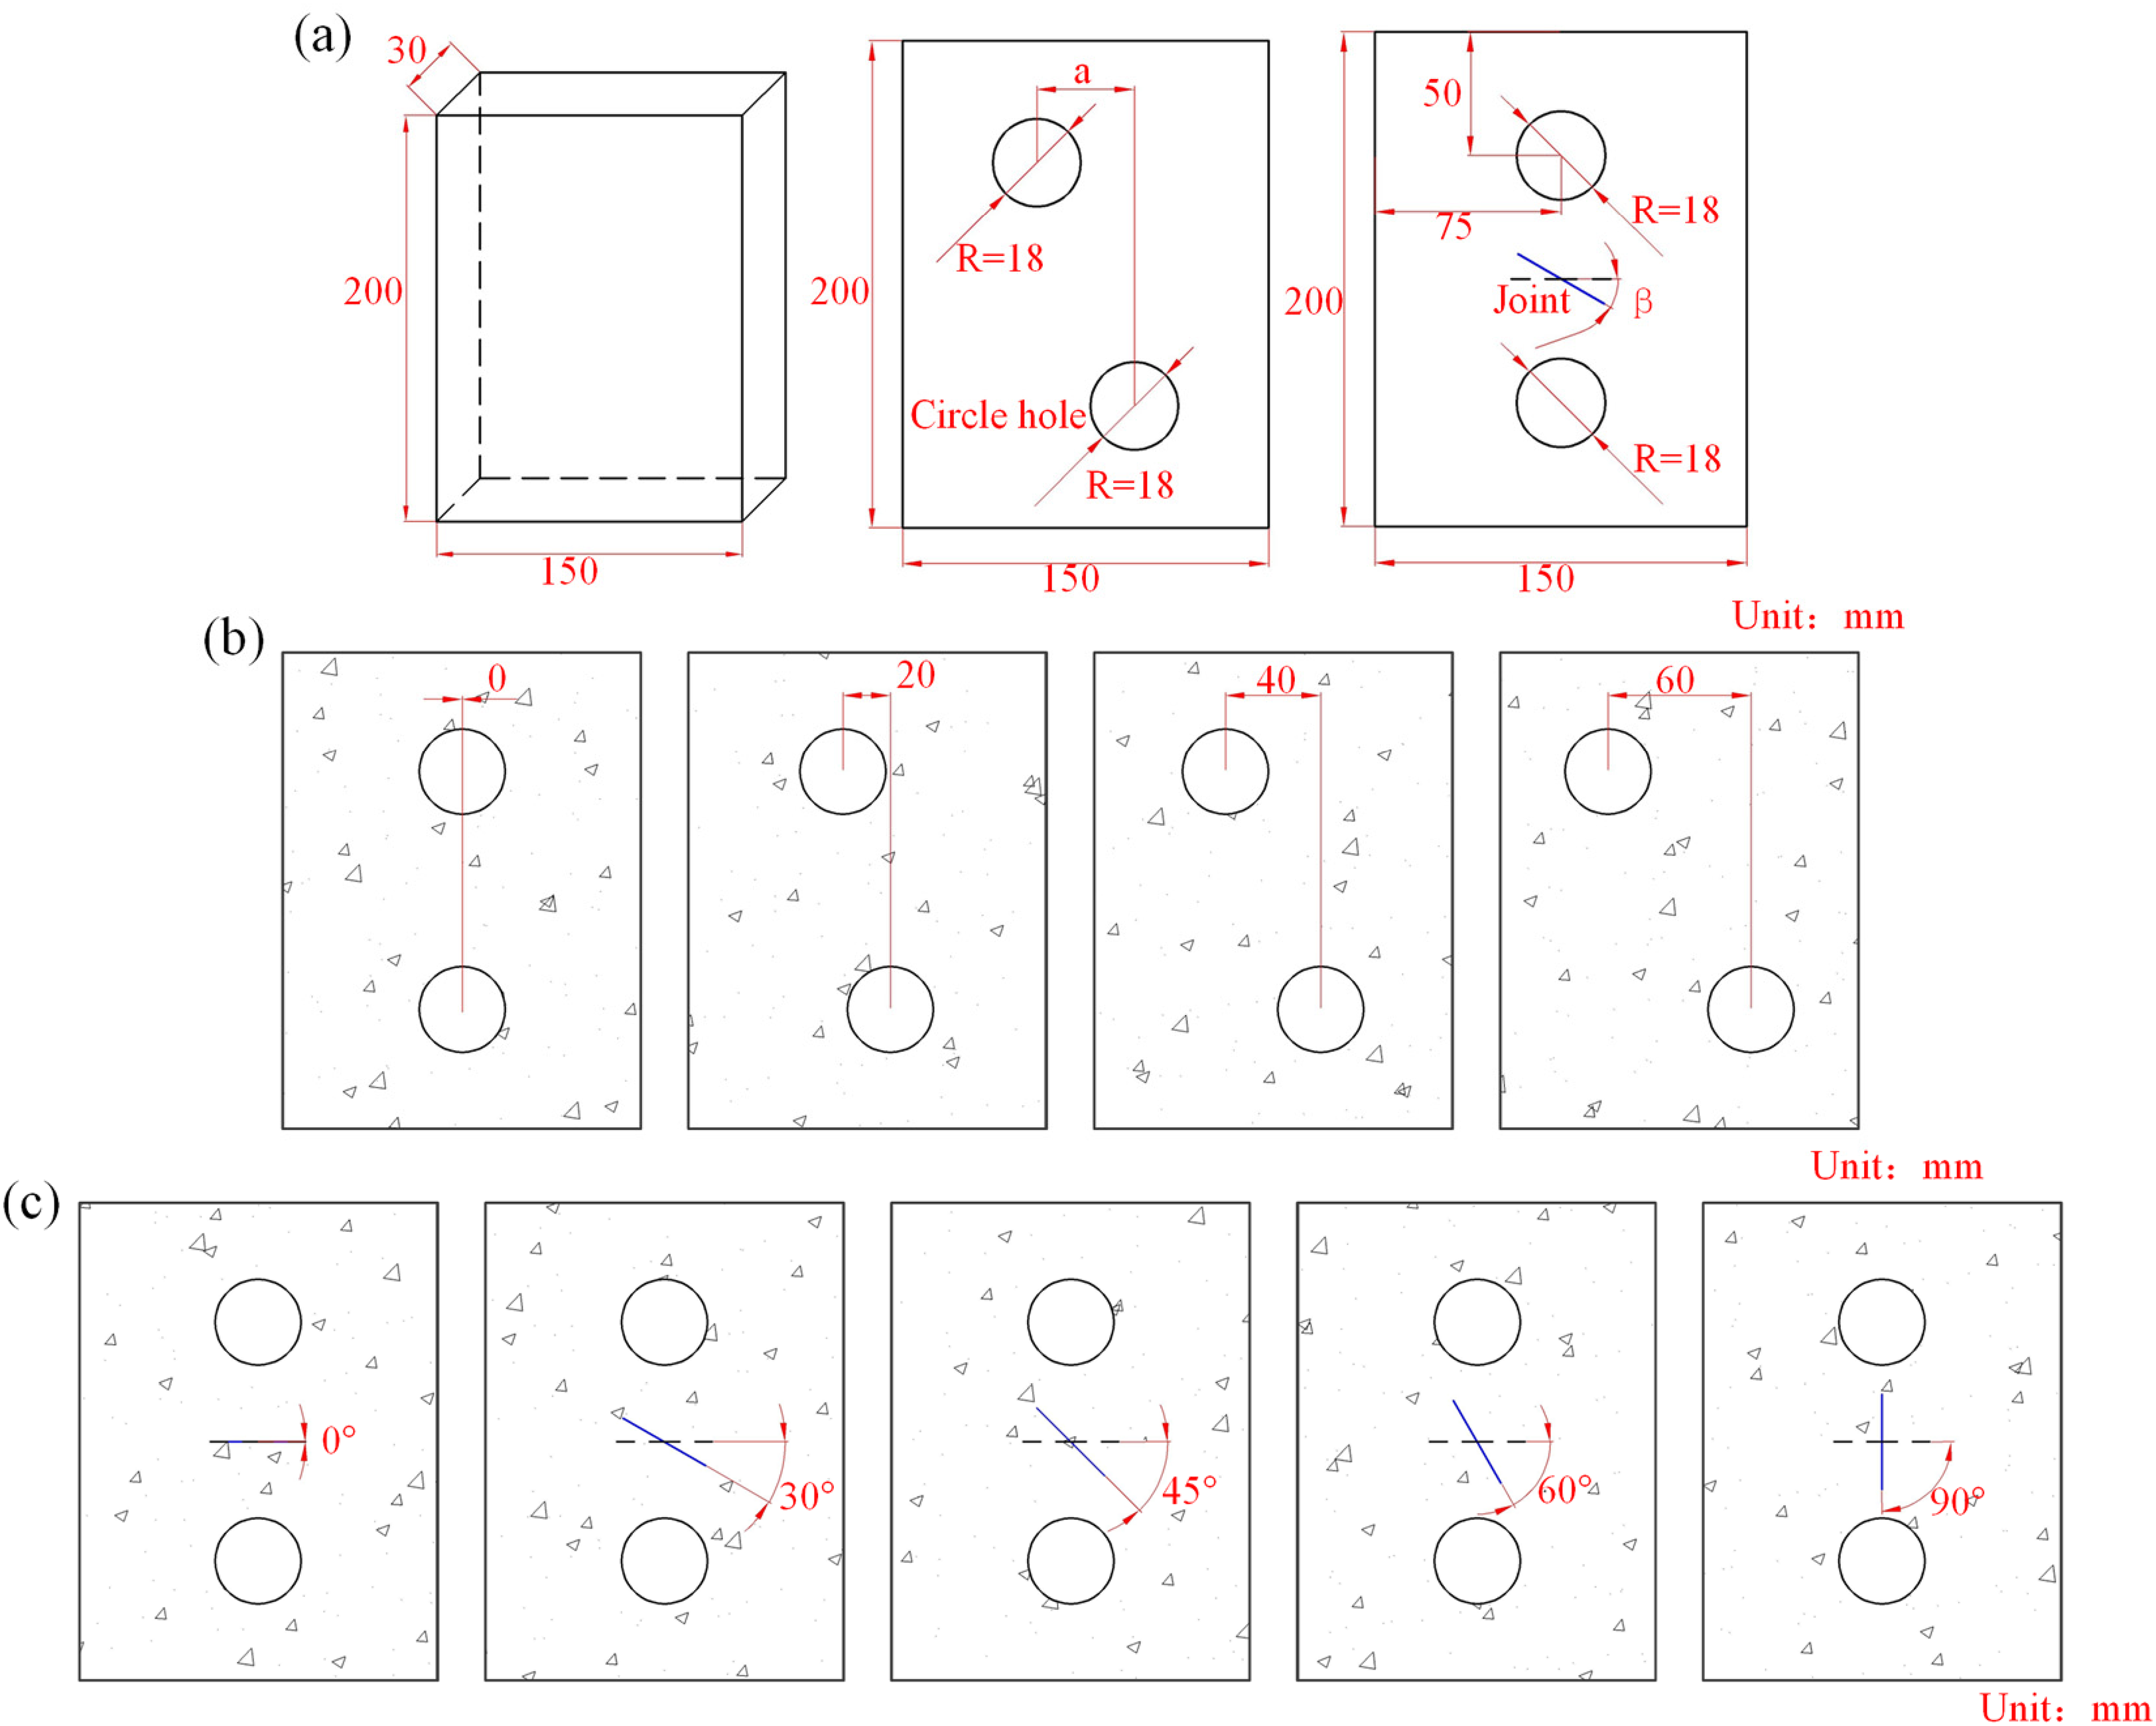
Specific dimensions of the specimens. (a) Specimen dimensions, (b) specimens with different spacing, and (c) specimens with different joints.
To examine the effects of horizontal spacing, the horizontal center-to-center spacing between the two holes was set to 0, 20, 40, and 60 mm. This group of specimens was free of prefabricated joints, and the centers of the holes were positioned vertically 50 mm from the top and bottom edges of the specimens. To investigate the effects of joint dip angle, one prefabricated joint was placed in the middle region between the two holes of each specimen. All joints had a consistent length of 40 mm, and the joint dip angles were set to 0°, 30°, 45°, 60°, and 90°. This group of specimens featured vertically aligned upper and lower holes (i.e. horizontal alignment of hole centers), with the centers of the holes positioned vertically 50 mm from the top and bottom edges and horizontally 75 mm from the left and right edges of the specimens. Specimens were marked using the format “S-a-β,” where “a” denotes the horizontal center-to-center spacing between the two holes (unit: mm), and “β” represents the joint inclination angle between the two holes (unit: °). For specimens designed to study joint inclination angles, since the horizontal center-to-center spacing between the two holes “a” is 0, they were marked using the format “S-0-β.” For specimens focusing on the study of hole spacing, as the joint inclination angle “β” is 0, they were directly marked using the format “S-a.
To ensure the reliability of test results, two replicate specimens were prepared for each experimental condition. The rock-like specimens were fabricated using cement mortar with a volume-based mix ratio of white cement:sand:water = 2:1:1. The white cement used was Grade 42.5 Portland cement, and the silica sand had a maximum particle size of 1 mm. Prior to casting, cylindrical molds wrapped in thin paper were placed at the corresponding top and bottom positions of the casting molds to create prefabricated holes. Meanwhile, mica sheets with dimensions of 40 mm in length and 0.6 mm in thickness were accurately placed at the predetermined position to simulate prefabricated joints with a specific inclination angle. During placement, the mica sheets were ensured to be flush with and perpendicular to the sample surface. After approximately 5 hours of initial setting, during the initial setting stage of the mortar, the cylindrical mold was carefully removed to expose the prefabricated holes inside the sample. Subsequently, the samples were disassembled and cured in water for 3 days, followed by continuous curing in a standard curing room with a temperature of (20 ± 2) °C and a relative humidity of not less than 95% for another 25 days. In accordance with the recommended methods of the International Society for Rock Mechanics and Rock Engineering (ISRM), Brazilian splitting tests (cylindrical specimens: diameter = 50 mm, thickness = 50 mm), uniaxial compression tests (cylindrical specimens: diameter = 50 mm, height = 100 mm), and variable-angle shear tests (cube specimens: side length = 70 mm) were performed on intact specimens of this material to determine the basic mechanical parameters of the rock-like material. Table 1 presents the average basic mechanical parameters of the rock-like material obtained from the three types of tests.
Mechanical properties of the rock specimens.
UCS: uniaxial compressive strength.
Experimental equipment and design
Loading system
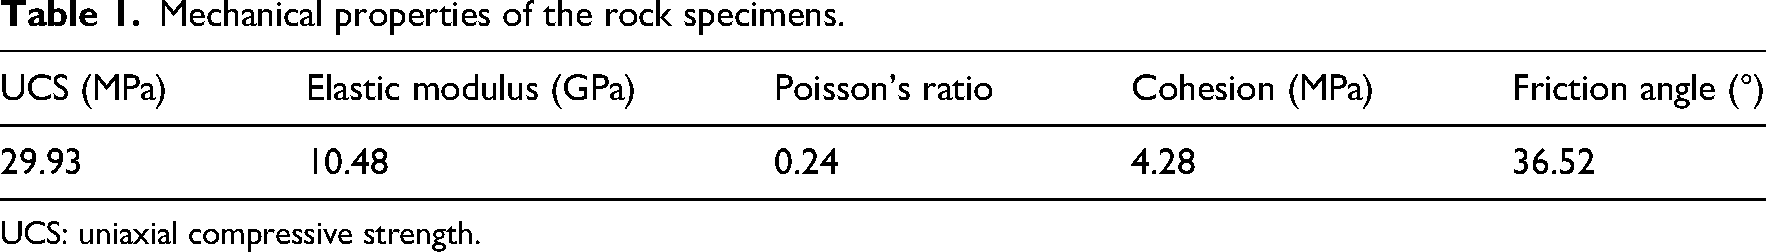
The testing equipment used in this study comprised a servo-controlled loading machine (DCS-200), an AE system, and a DIC system, as illustrated in Figure 2. Prior to testing, the loading machine, AE system, and DIC system were synchronized to ensure consistent timing for operation and data acquisition. During each uniaxial compression test, the machine was used to apply a load to the specimens at a rate of 200 N/s under force control mode, aiming to simulate the quasi-static instability and failure process of surrounding rock under bearing conditions in practical engineering scenarios, while the AE and DIC systems simultaneously monitored the failure process in real time. Additionally, universal lithium-based grease was evenly applied to the interfaces between each specimen and the loading platens to effectively mitigate the end effects. The built-in data acquisition system of the testing machine recorded real-time variations in axial load and displacement, thereby ensuring the scientificity and reliability of the experimental results.
Experimental procedure.
AE system
This study employed an AE monitoring system compliant with ASTM standards. By capturing transient elastic waves generated by energy release within the material, it dynamically characterizes the fracturing behavior of rock-like materials. The system had a sensitivity of 0.1 μV and a dynamic range of 80 dB, enabling precise recording of the entire process of microcrack initiation, propagation, and coalescence. A three-stage signal conditioning procedure was adopted. The first stage involved pre-amplification, in which PAC-2/4/6 broadband preamplifiers (with a gain of 40 dB) were used to amplify the raw AE signals. The second stage was noise suppression, in which a threshold filter (with a threshold of 45 dB) effectively eliminated environmental electromagnetic interference, thereby improving the signal-to-noise ratio by approximately 62%. The third stage focused on sampling optimization, which involved employing a sampling frequency of 1 MHz and an 18-bit analog-to-digital (A/D) converter to ensure waveform fidelity. In accordance with ASTM E1106, three Nano30 wideband sensors (with a frequency response range of 125–750 kHz) were mounted on the surface of each specimen in a triangular arrangement. Medical-grade Vaseline was used as an acoustic couplant to ensure effective acoustic transmission, while a pressure application device was used to maintain a constant contact pressure of 0.5 MPa between the sensors and the surface of each specimen.
DIC system
The principle of DIC lies in the precise comparison of positional changes of random speckles between predeformation and postdeformation images of the specimen surface. By tracking the displacement components of pixel subsets, DIC converts deformation measurement into a digital computation process, which ultimately yields full-field strain data of the specimens. The DIC system primarily comprises a light source, a charge-coupled device (CCD) industrial camera, and image processing software. Prior to testing, the surface of each specimen was prepared with speckle patterns, thereby forming a dense, random distribution of speckles to provide a basis for subsequent displacement monitoring and image processing. The position of the CCD industrial camera was carefully adjusted to ensure every point on the surface of each specimen was clearly within the camera's field of view. During loading, the CCD industrial camera automatically acquired images at a frame rate of 10 frames per second (fps) and an image resolution of 2000 × 1500 pixels. Finally, Vic-2D software was used to process the acquired images and extract displacement field data, providing precise and reliable data for this study.
Experimental results
Specimen strength characteristics
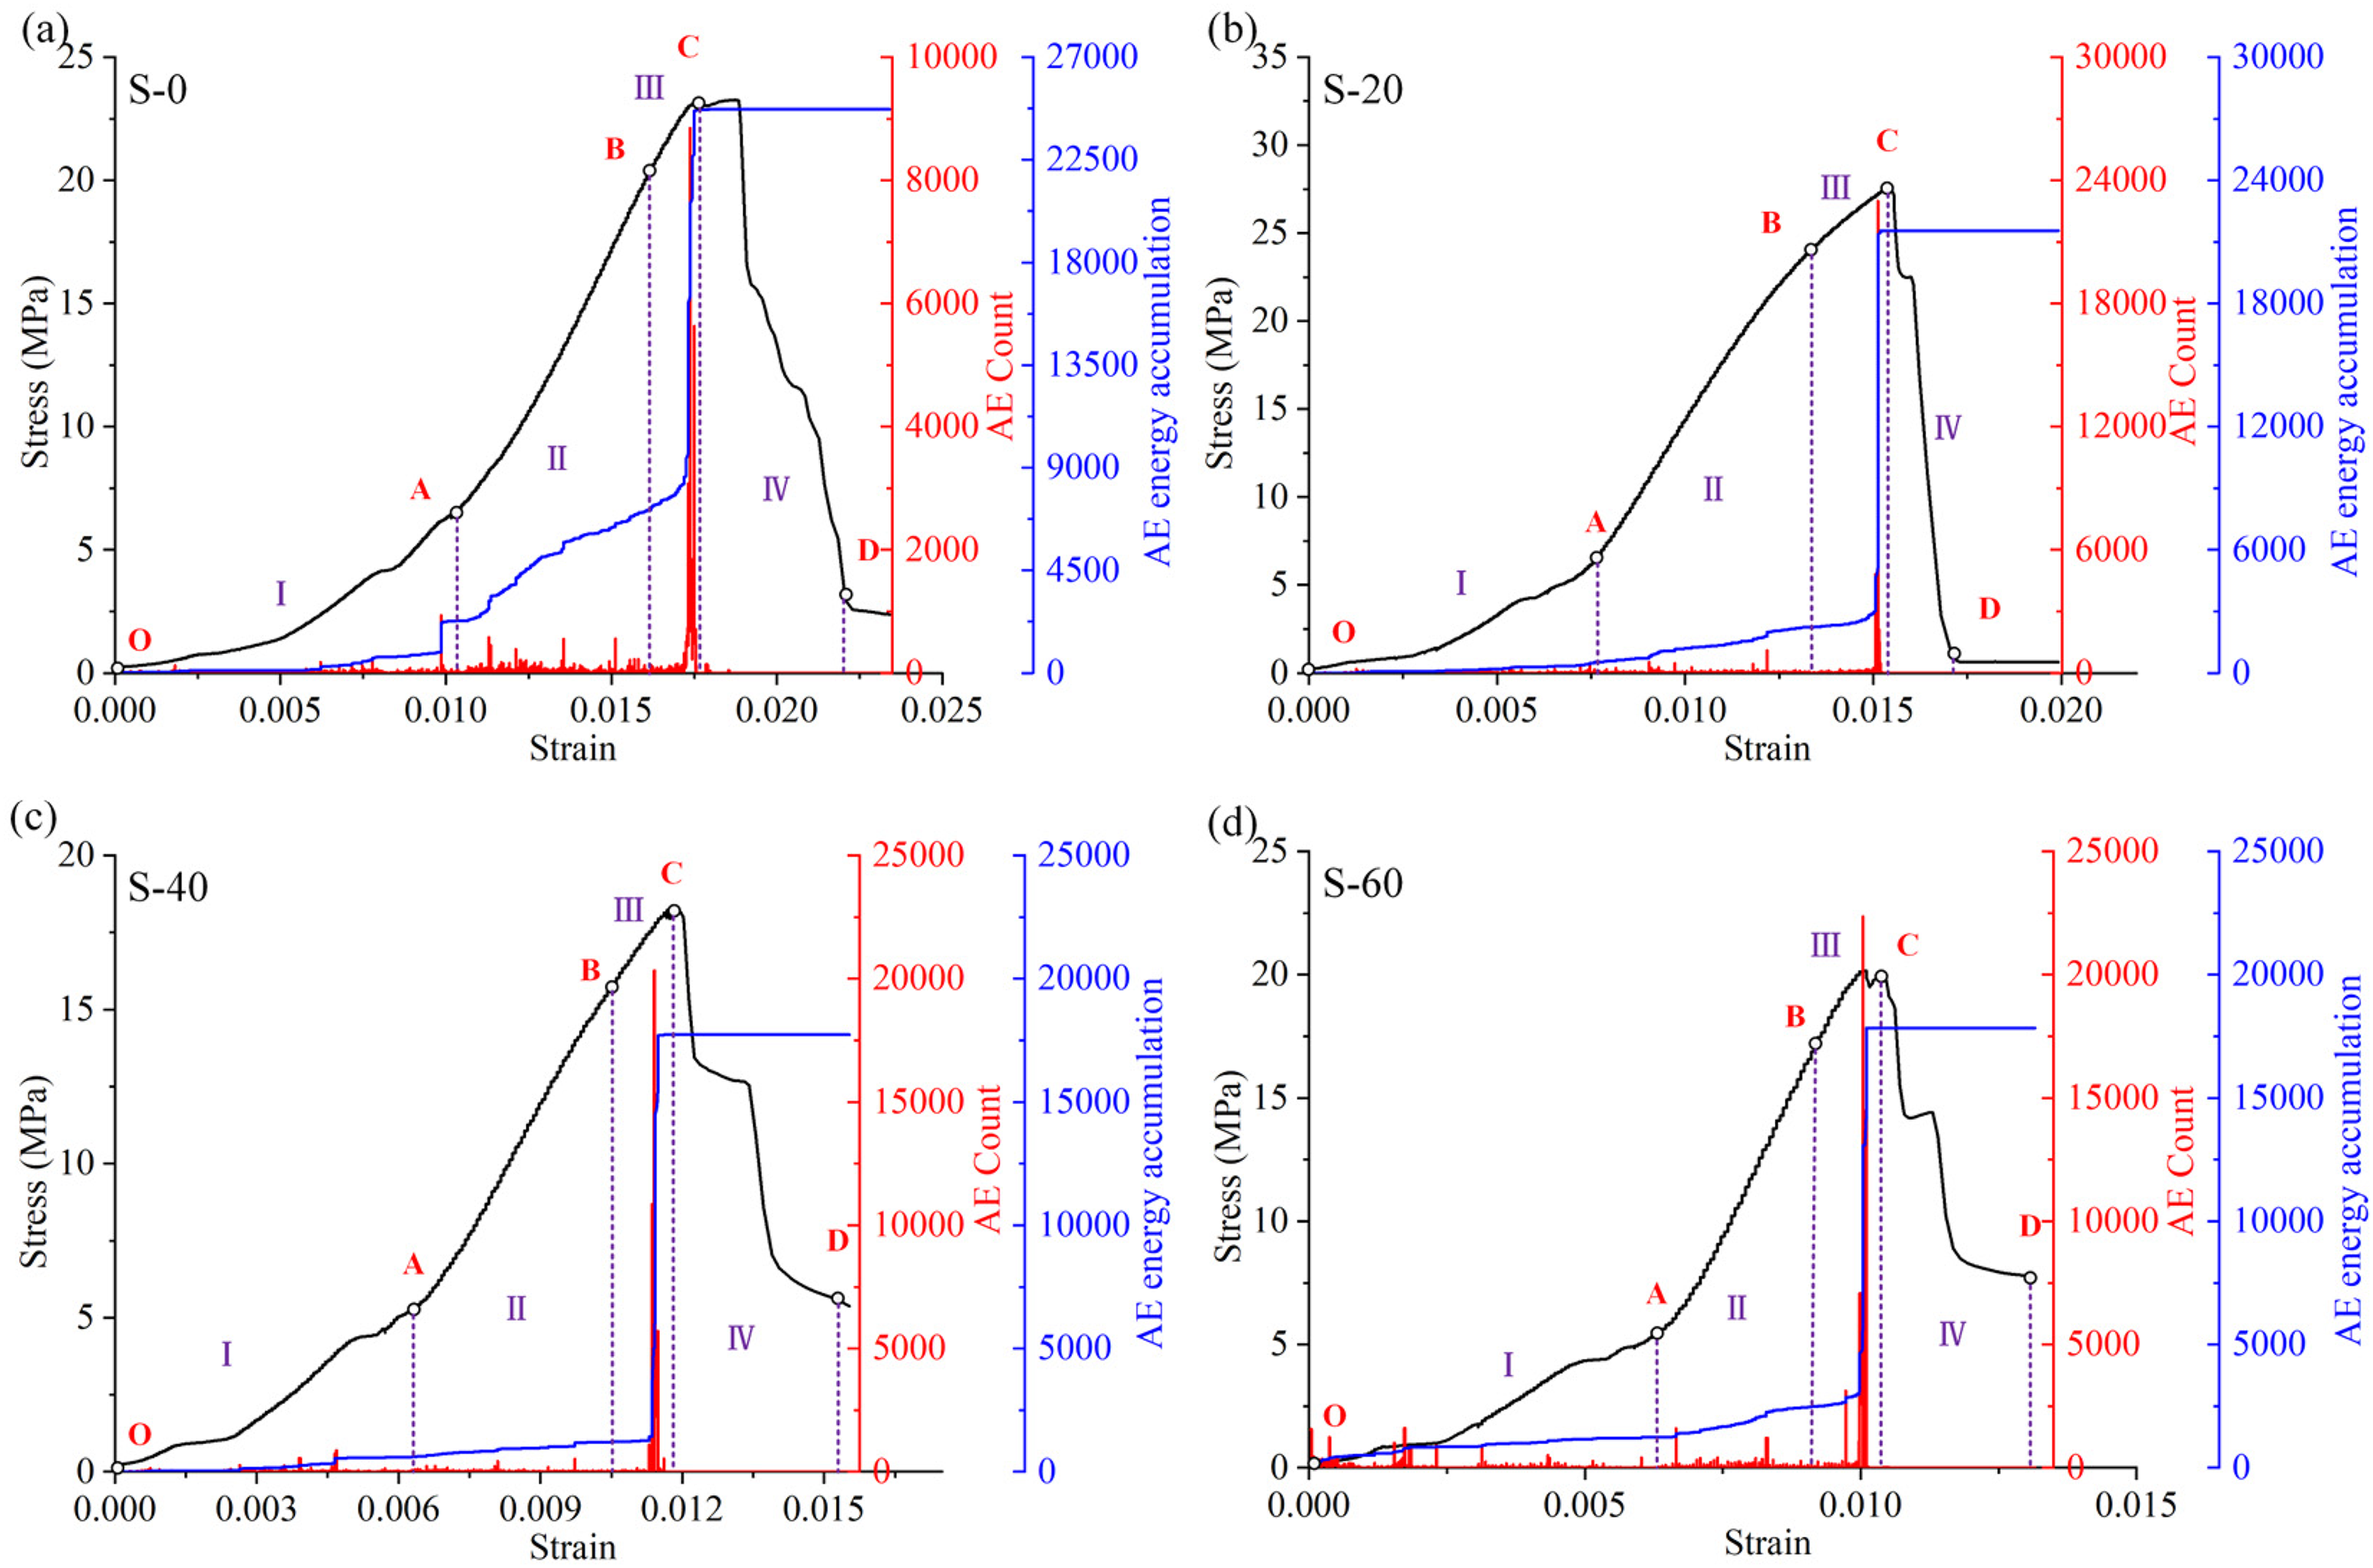
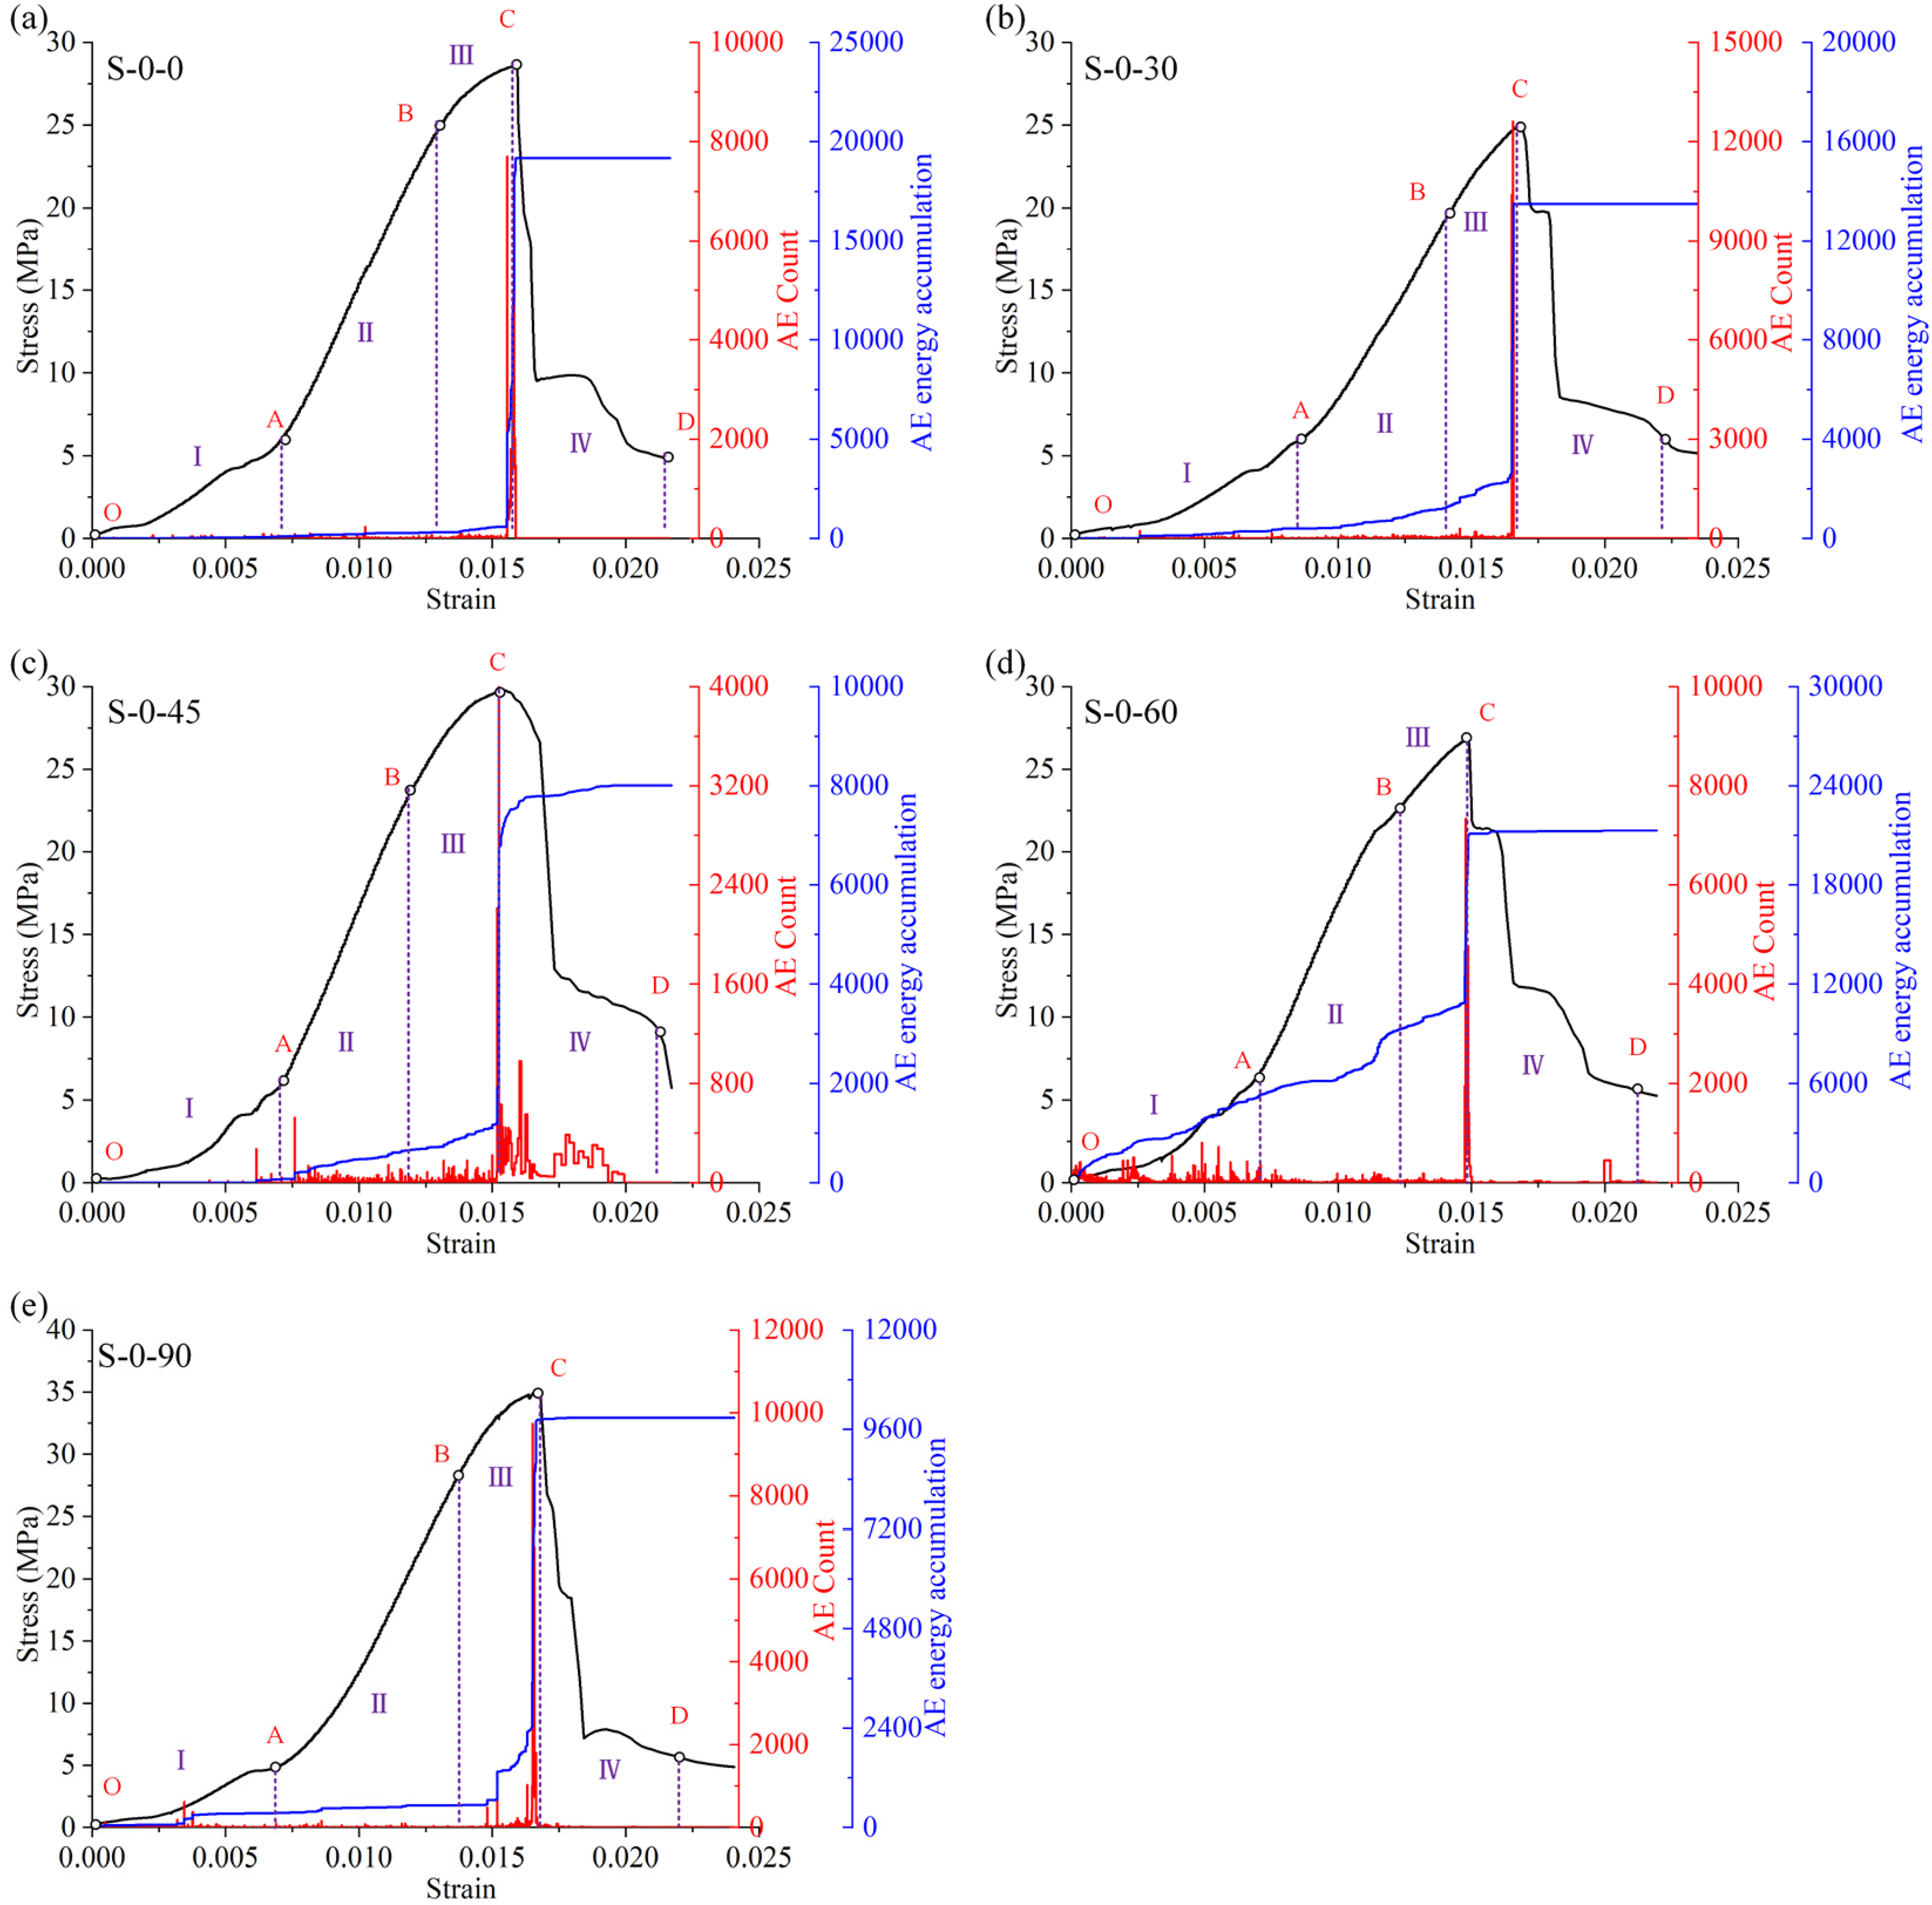
The effects of horizontal spacing and joint dip angle on the strength of double-hole rock-like specimens can be quantitatively characterized using stress–strain curves, as illustrated in Figures 3 and 4. As depicted in Figure 3, the uniaxial compression stress–strain curves of these specimens can be divided into four typical stages: compaction (OA), elastic deformation (AB), plastic deformation (BC), and postpeak deformation (CD). Notably, the slight strain fluctuations observed in the elastic stage are attributed to minor initial contact adjustments of the loading system and exert no significant influence on the strength characteristics or failure patterns of the specimens.
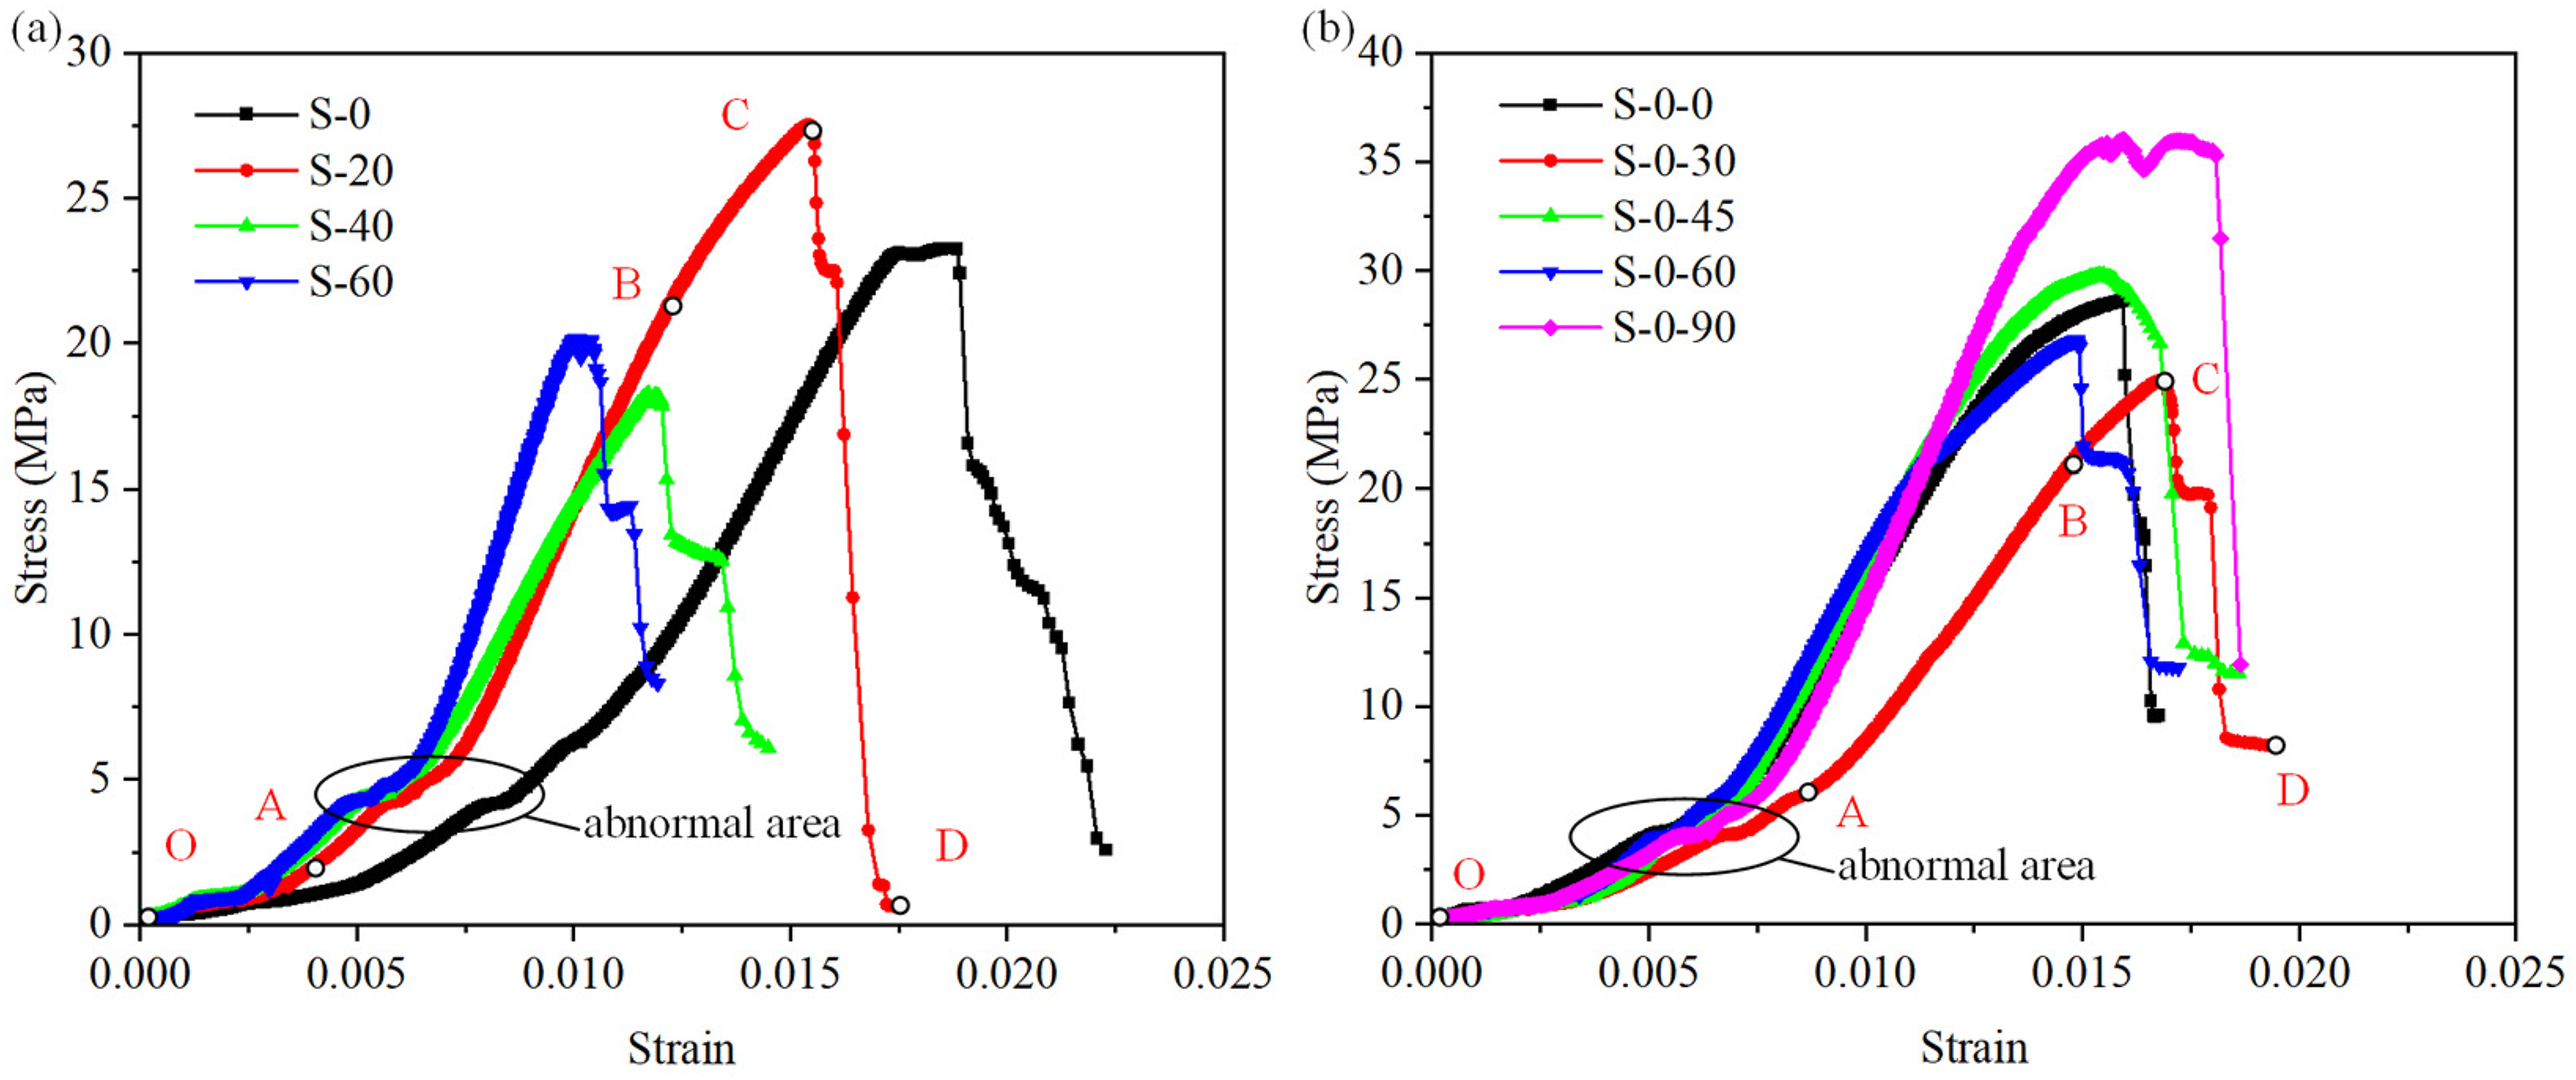
Stress–strain curves of the specimens. (a) Stress–strain curves of specimens with different spacings and (b) stress–strain curves of specimens with different joint dip angles.
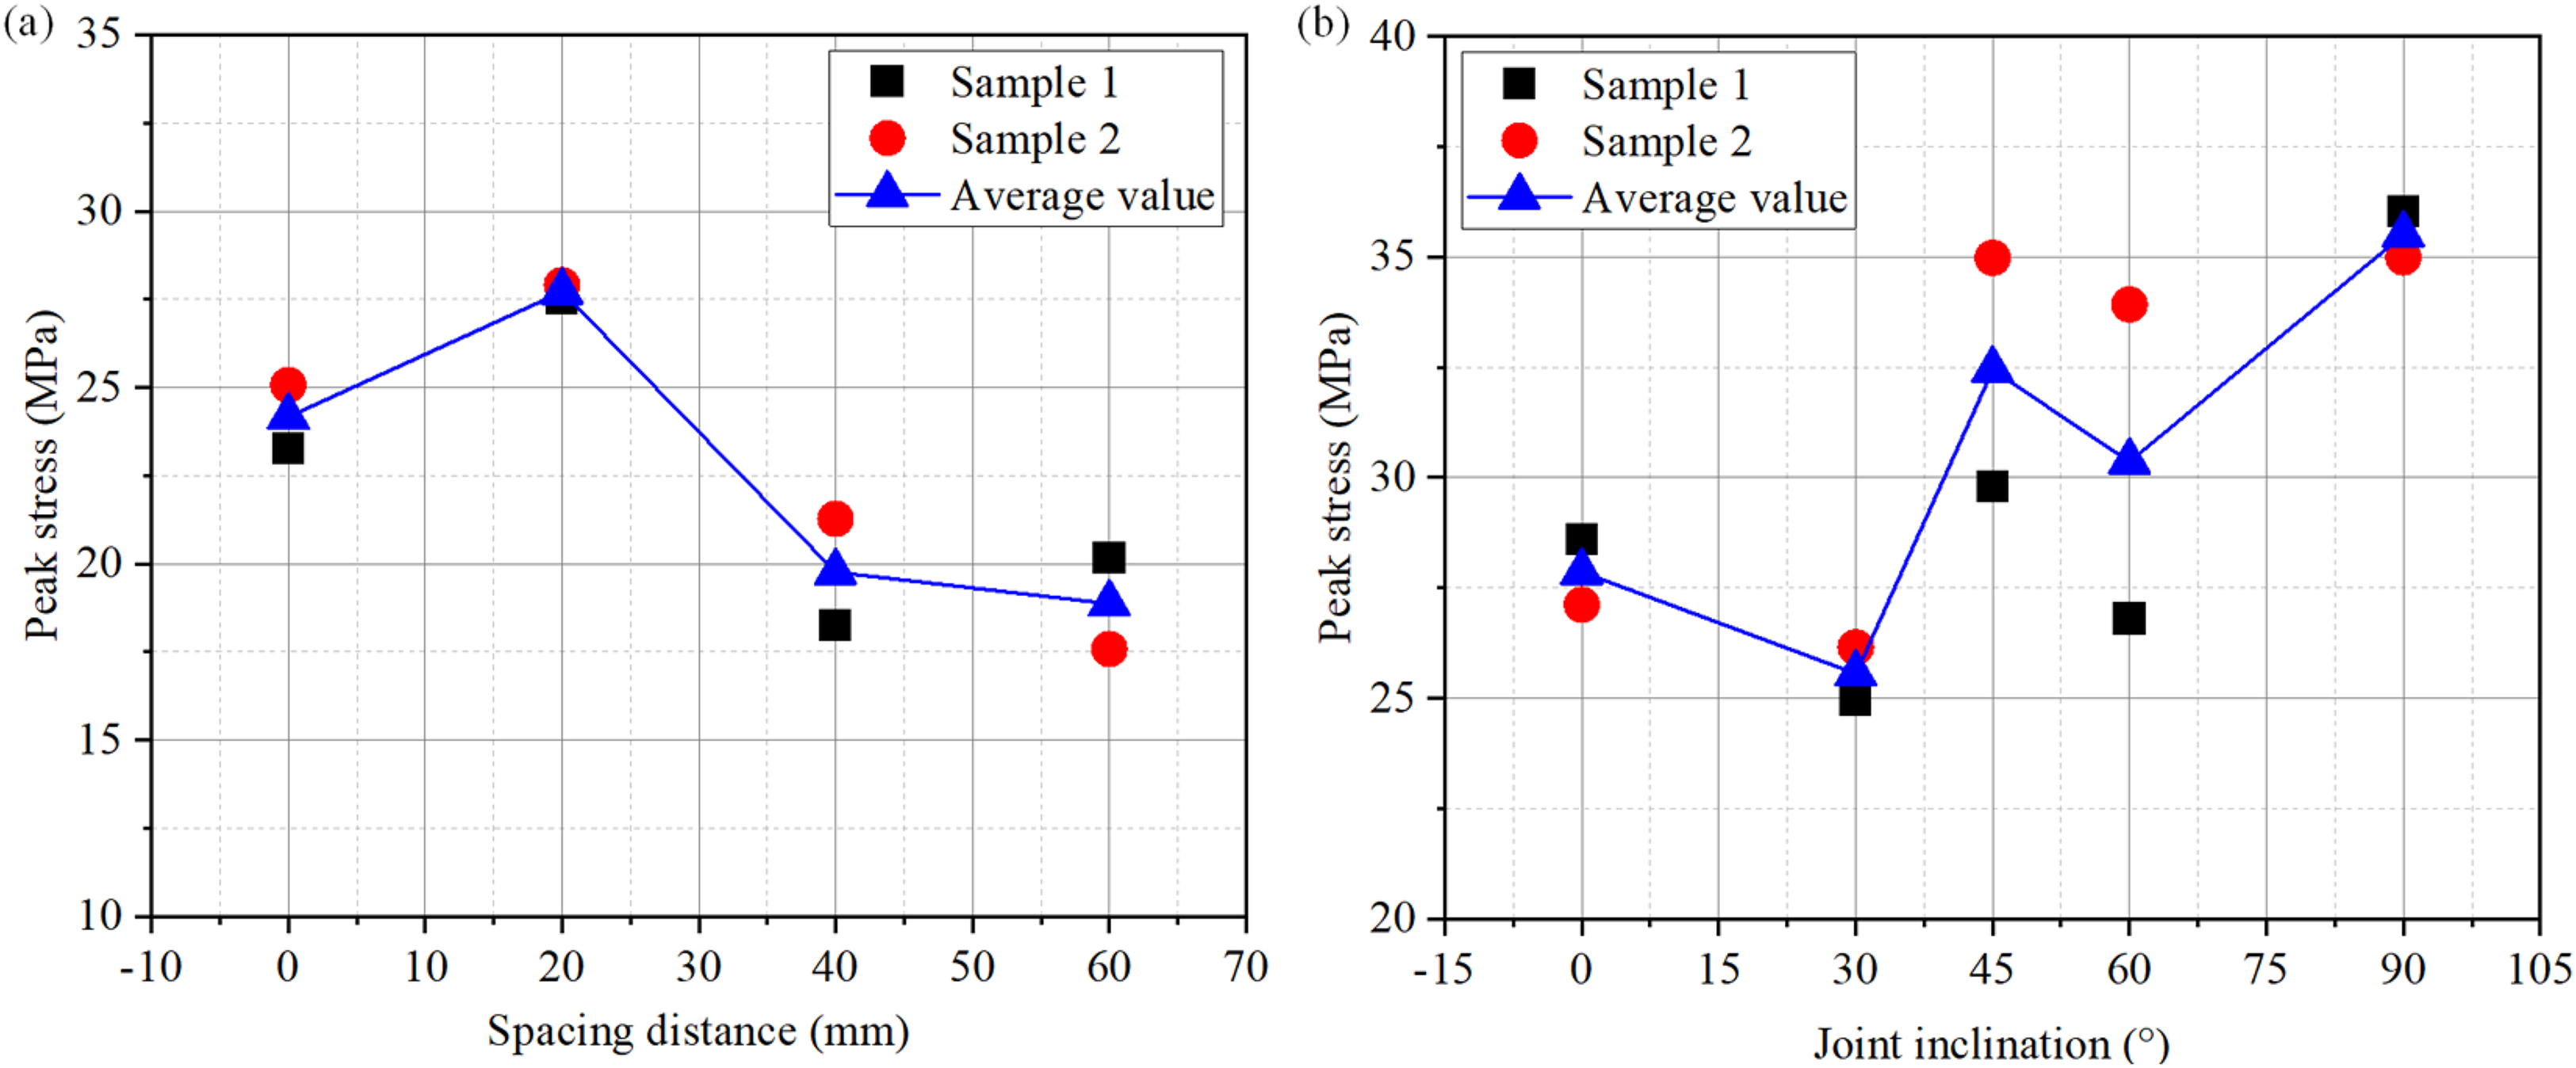
Failure strength of specimens under different conditions. (a) Failure strength of specimens with different spacings and (b) failure strength of specimens with different joint dip angles.
Regarding horizontal spacing (Figure 3(a)), the stress–strain curves of the S-20 and S-60 specimens exhibit higher linear stress growth rates and correspondingly larger elastic moduli during the elastic stage, whereas the S-0 and S-40 specimens exhibit relatively lower elastic moduli. In the postpeak stage, the S-40 specimen exhibits prominent ductility, which is manifested in the slow stress decrease with increasing strain, and this process forms an approximate “plateau” in the strain range of 0.012 to 0.013, with an approximate 21% stress decrease. Regarding joint dip angle (Figure 3(b)), the S-0-45 specimen exhibits a relatively high peak stress, a steep slope in the linear segment of the elastic stage, and prominent postpeak ductility. The S-0-90 specimen has the highest peak stress, showing a distinct peak stress recovery compared with S-0-60, and its slope in the linear segment of the elastic stage is close to that of S-0-45. The S-0-0 and S-0-30 specimens exhibit steep postpeak stress drops with no obvious ductile plateaus, and their peak stresses are significantly lower than those of S-0-45 and S-0-90. Mechanistically, horizontal spacing regulates the mechanical response by modulating the stress superposition effect between the two holes (Bobet and Einstein, 1998). The S-20 specimen experiences weak stress superposition and low stress concentration between the two holes. The S-60 specimen experiences weak interaction between the stress fields of the two holes due to excessively large spacing. The S-0 specimen experiences intense stress concentration between the holes. The S-40 specimen undergoes local stress redistribution between the holes, thereby facilitating microdeformation compatibility. The joint dip angle regulates mechanical behavior by altering the compatibility between the joint plane and the loading direction and modifying the state of stress concentration. In the S-0-45 specimen, the joint plane has high compatibility with the loading direction, and the stress concentration factor at the joint tip is high and strongly superimposes on that around the holes. In the S-0-90 specimen, the joint plane is parallel to the loading direction, causing minimal disturbance to the compressive stress concentration zone around the holes. In the S-0-0 and S-0-30 specimens, the joint planes are prone to early shear slip under low loads, thus inducing microcracks around the holes and resulting in premature instability.
As shown in Figure 4, both horizontal spacing and joint dip angle exert significant control over the peak stress of the specimens, albeit through distinct mechanisms. For horizontal spacing (Figure 4(a)), the peak stress exhibits a nonmonotonic trend of initially increasing and then decreasing as the spacing between the two holes increases. This behavior indicates that inter-hole spacing strongly affects the overall strength of the specimens, primarily due to variations in stress concentration. Furthermore, the results of the replicate tests demonstrate high consistency, confirming good experimental repeatability. Figure 4(b) illustrates the complex influence of the joint dip angle on peak stress. As the angle increases sequentially from 0° to 30°, 45°, 60°, and 90°, the peak stress of the specimen exhibits a periodic variation pattern of decrease, rise, decrease, and rise. An analysis of the peak stress change rate with respect to the dip angle (dσ/dθ) shows significant differences across different angle intervals. Specifically, in the 30° to 45° interval, the change rate reaches a positive maximum of 0.1716 MPa/°, while in the 60° to 90° interval, it reaches a minimum of −0.4586 MPa/°. This nonlinear response primarily arises from the directional control imposed by the joint dip angle on crack propagation paths, specifically manifested in that when the joint dip angle is less than 45°, tensile cracks tend to propagate along the joint plane, whereas when the joint dip angle exceeds 45°, shear slip gradually becomes the dominant failure mechanism
Acoustic emission characteristics
As an effective method for monitoring the internal mechanical behavior of rocks, the signal parameters of AE technology exhibit a close correlation with the internal crack types and propagation states of rock masses. Analyzing changes in signal parameters under different mechanical conditions enables accurate classification of crack types in rock materials (Du et al., 2020). In practical applications, crack type identification can be achieved based on the definitions of AE characteristic parameters, with AF and RA being the most commonly used derived AE parameters. Their definitions are presented in equations (1) and (2), respectively:

where
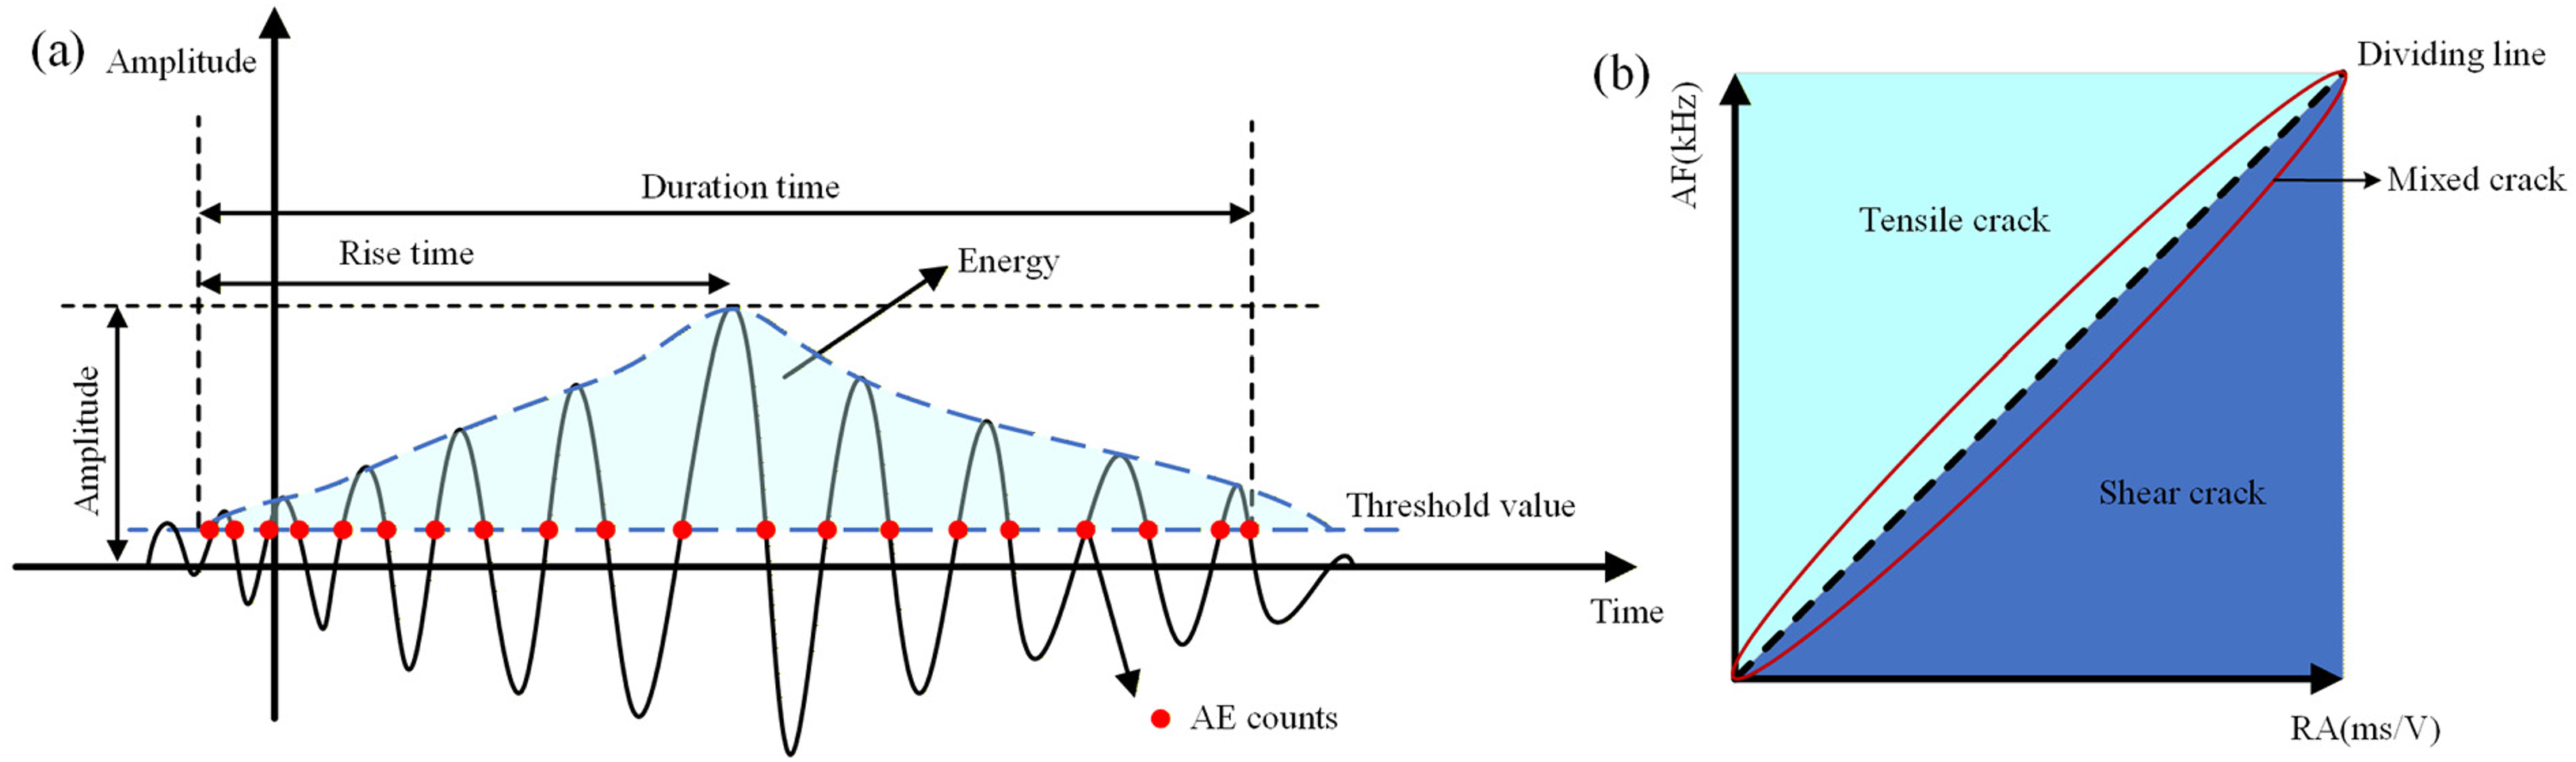
Physical meaning of acoustic emission (AE) waveform parameters and crack division diagram. (a) AE waveform parameters and (b) crack classification.
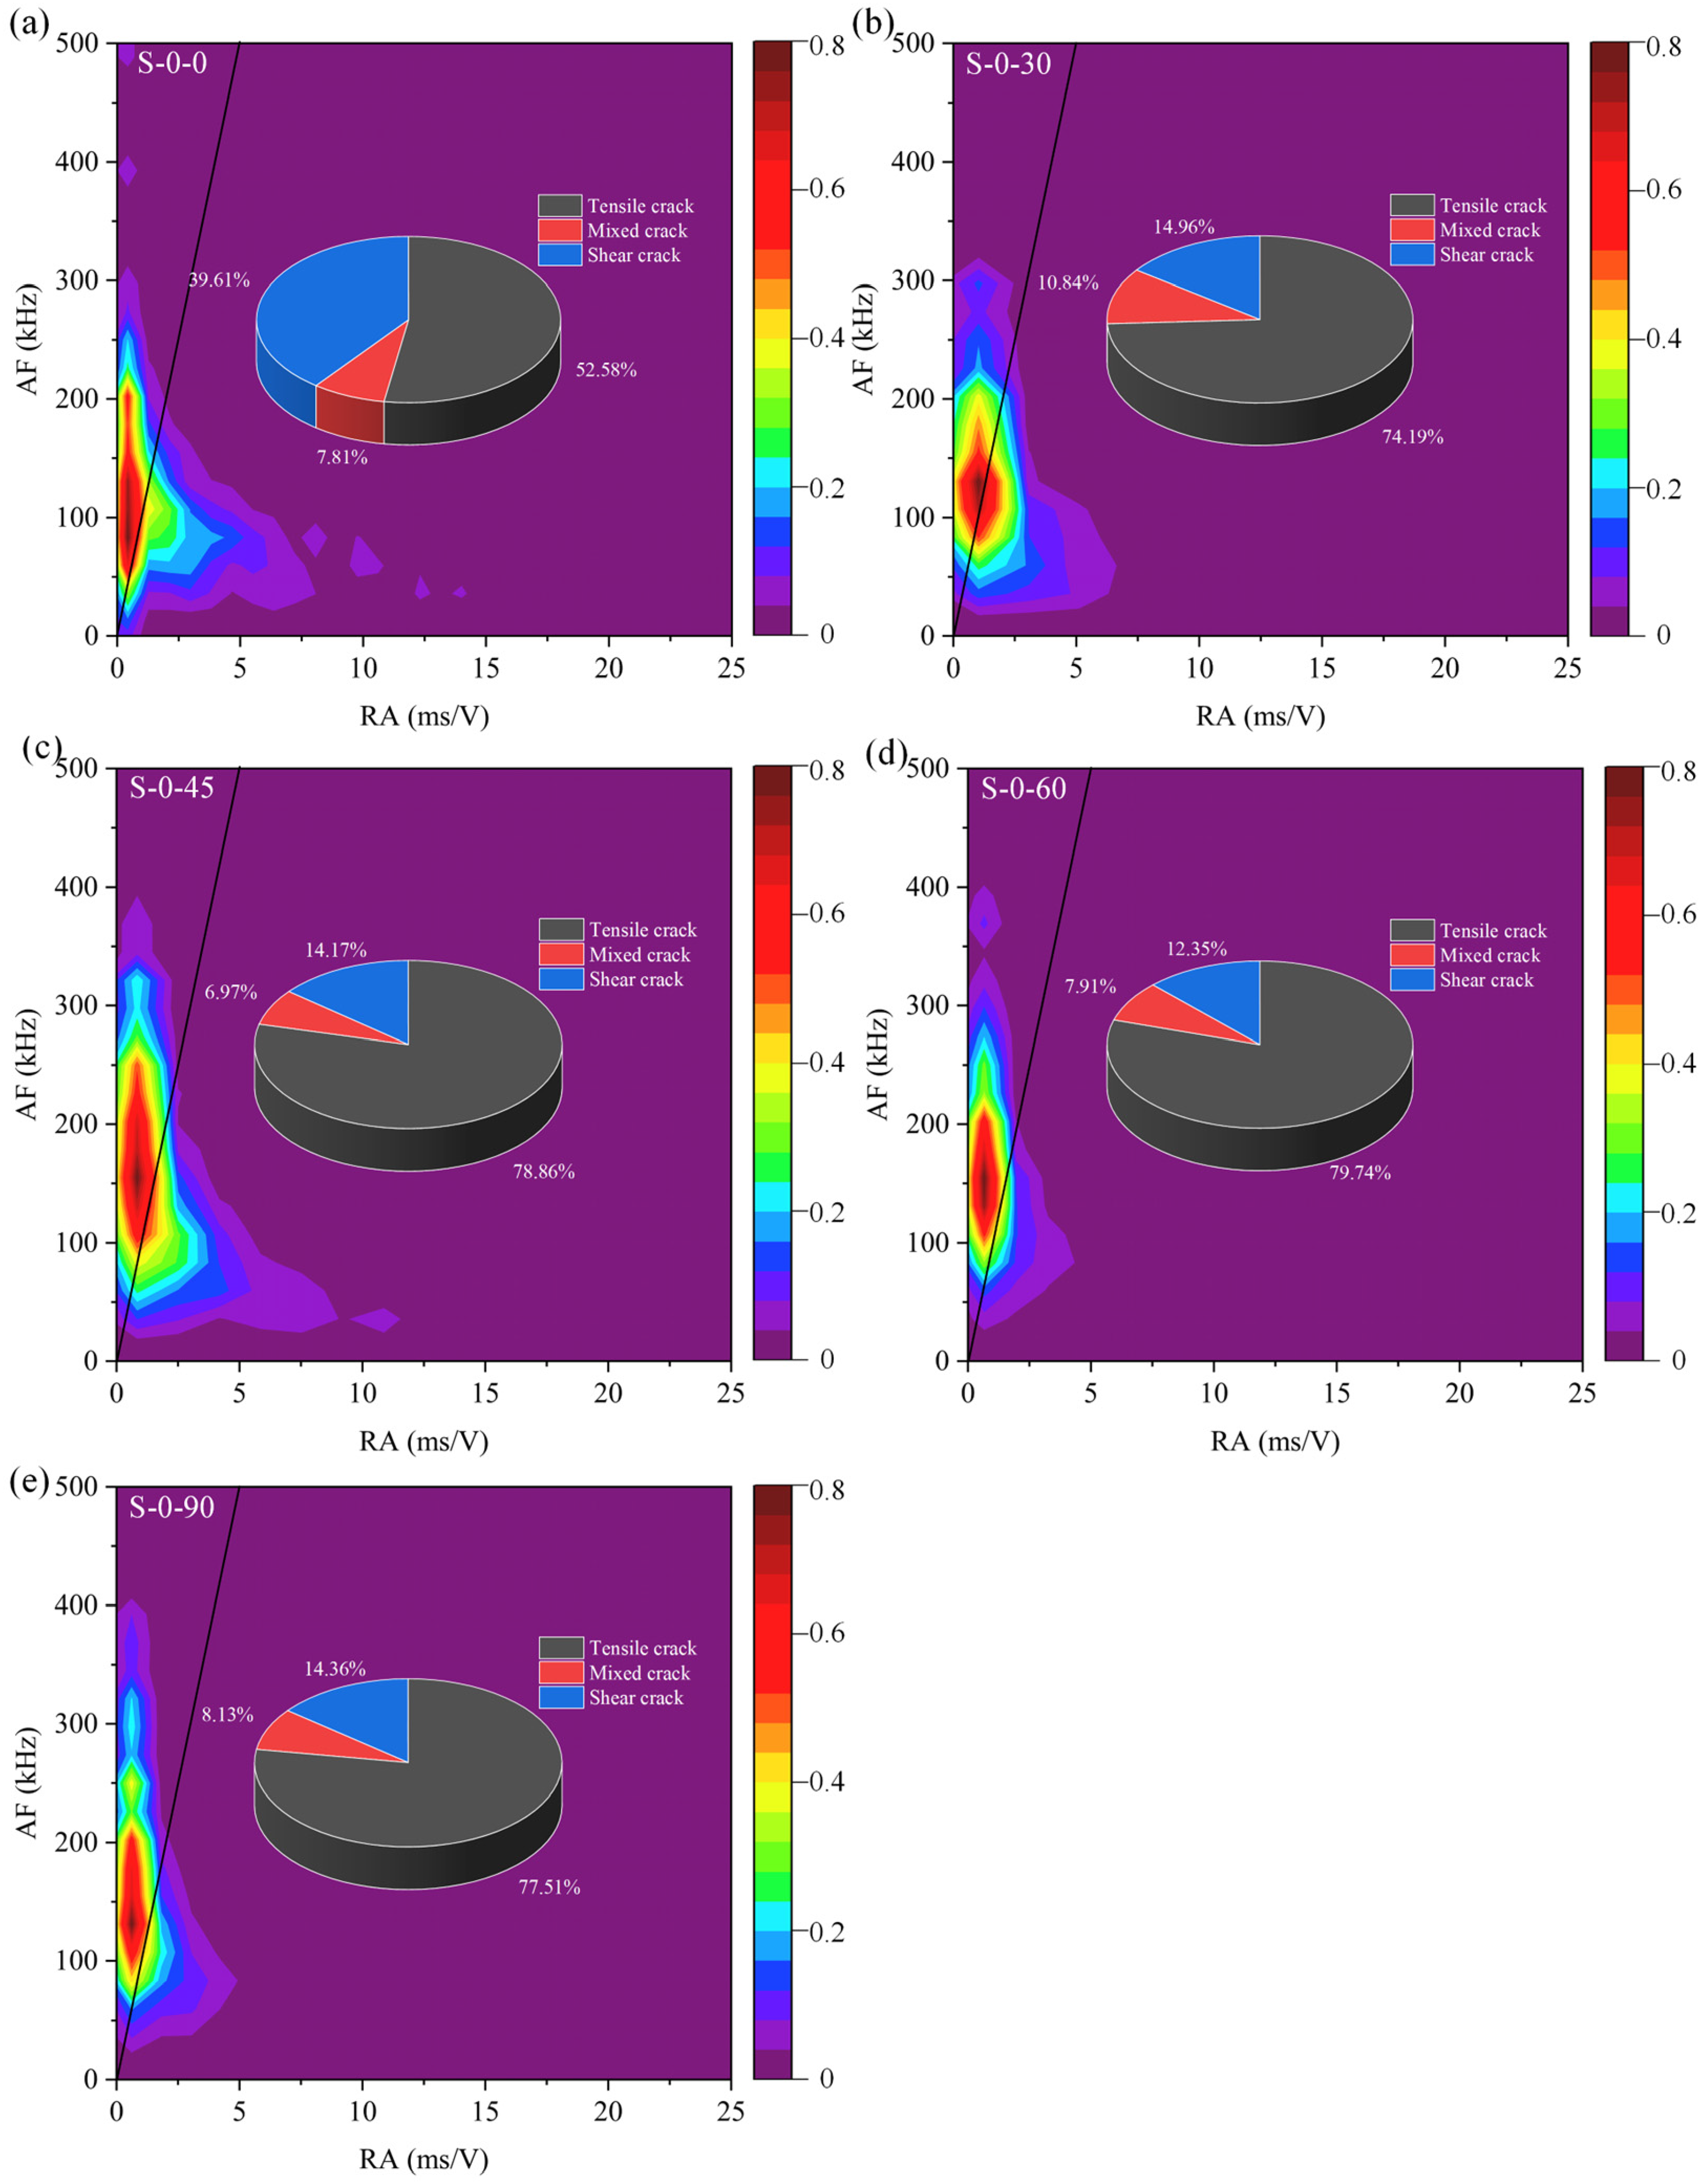
In rock mechanics, investigating the relationship between crack types and AE parameters is of significant theoretical and practical importance. Shear cracks are typically characterized by long rise times and low dominant frequencies, which correspond to relatively high RA values. In contrast, tensile cracks exhibit short rise times and high dominant frequencies, corresponding to relatively high AF values (Niu et al., 2020; Ohno and Ohtsu, 2010). As shown in Figure 5(b), the AF to RA ratio is commonly adopted as a threshold to distinguish crack types. AE events above this threshold are classified as tensile cracks, whereas those below are identified as shear cracks. The intermediate region is defined as mixed mode cracks. At present, no unified criterion for the AF to RA ratio has been established for brittle materials. Zhang and Deng (2020) proposed an AF to RA range of 100 to 500 for rock-like materials. Liu et al. (2022) reported a characteristic AF to RA value of 104.4 for brittle sandstone. Several studies have adopted an AF to RA value of 100 as a classification criterion (Dong et al., 2024; Du et al., 2020; Li et al., 2024). Based on these studies, an AF to RA value of 100 is selected as the threshold in this study to distinguish tensile and shear cracks. It should be noted that under dynamic disturbances, the dominant frequency of AE signals changes significantly. During the initial disturbance stage, relatively high dominant frequencies are associated with small scale damage, whereas a shift toward lower frequencies occurs during failure, corresponding to large scale crack propagation (Jiang et al., 2024). In the kernel density estimation plots, color intensity represents the density of AE events. Warm colors such as red and orange indicate high density regions, whereas cool colors such as blue and purple indicate low-density regions.
Influence of horizontal spacing on AE characteristics
Figure 6 illustrates the AE count and cumulative energy characteristics during the loading-induced deformation of specimens with different horizontal spacings. For the S-0 specimen, the AE count exhibits intense fluctuations prior to peak stress, and the cumulative energy released during the plastic stage accounts for 72% of the total energy released throughout the test. This indicates that the stress superposition effect between the two holes significantly induces the initiation and propagation of dense microcracks. For the S-20 specimen, the AE count exhibits a stepwise growth pattern, with each stage showing an approximate 15% increase. The energy release rate decreases significantly, and the proportion of energy released before the peak stress drops to 55%, reflecting the inhibitory effect of the optimized stress distribution on sudden failure. Notably, even in the postpeak stage, the S-40 specimen continues to generate low-amplitude AE signals, which is consistent with the progressive expansion of local strain bands observed in Figure 10, confirming the ductile failure characteristics of the S-40 specimen.
Curves of stress, acoustic emission (AE) count, cumulative AE energy versus strain for specimens with different spacings.
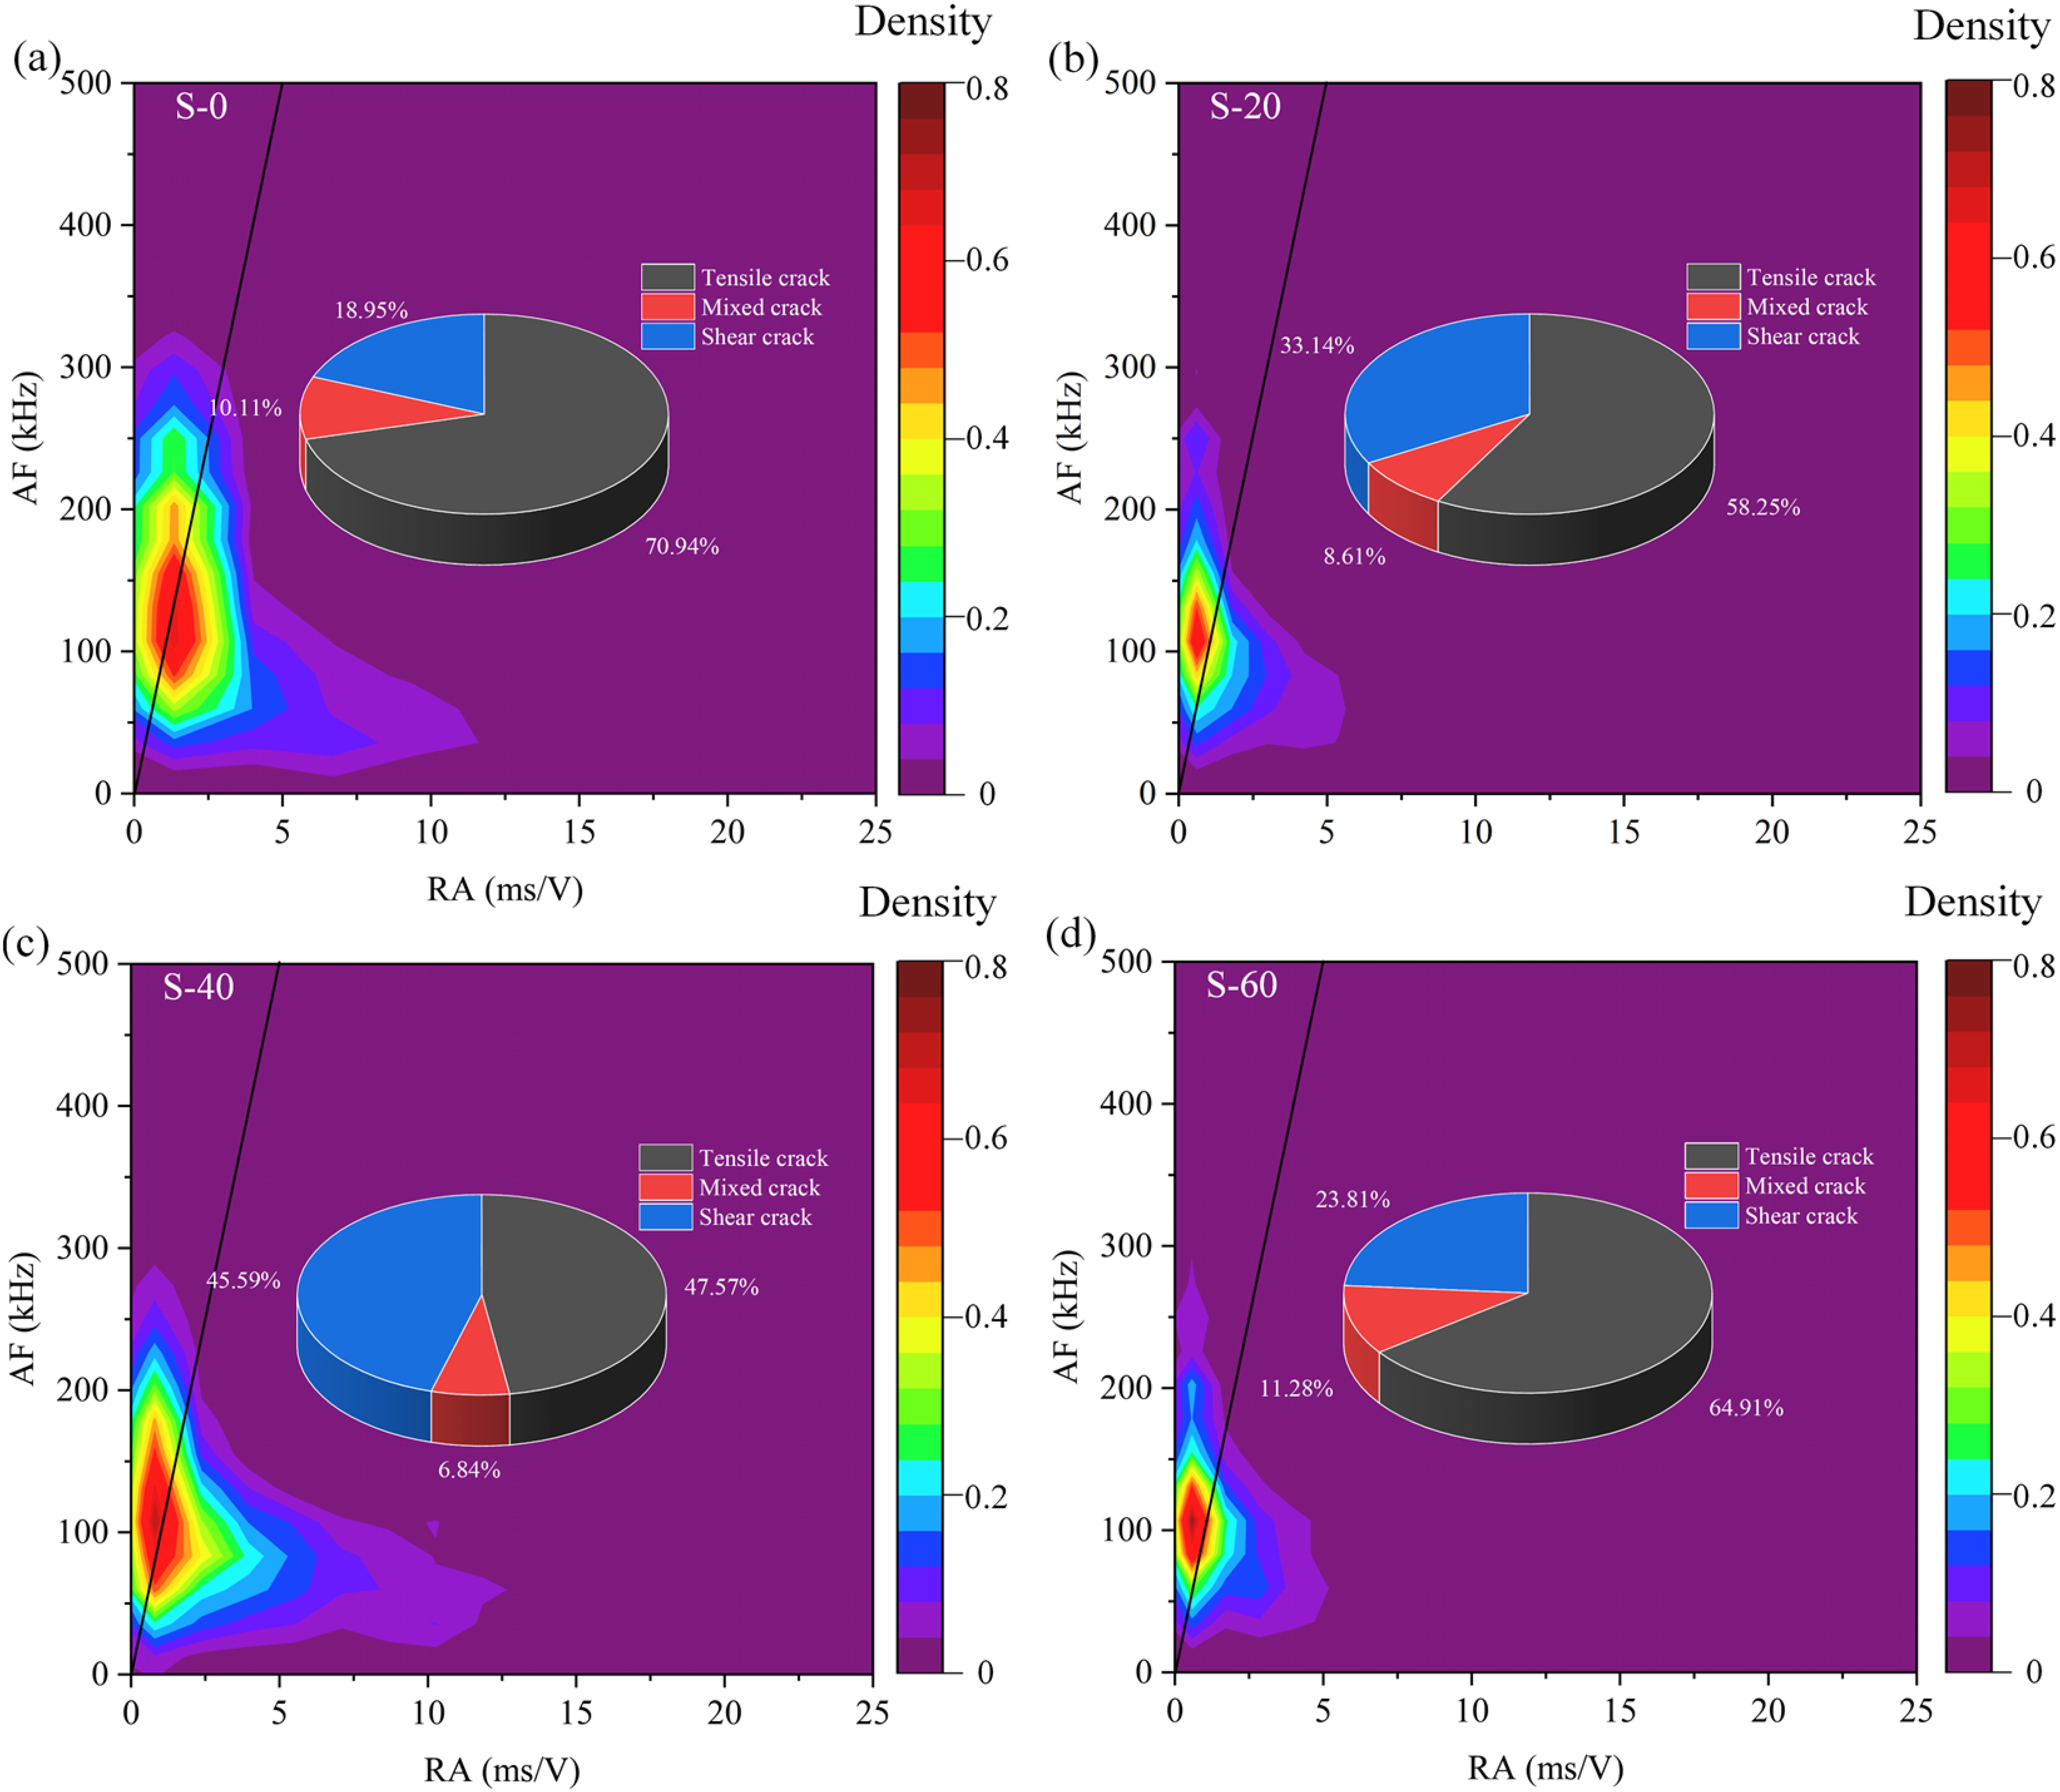
Kernel density estimation and crack classification of AF and RA discrete points for specimens with different spacings. AF: average frequency; RA: rise angle.
Figure 7 illustrates the kernel density estimation of discrete AF–RA points and the crack classification results for specimens with different horizontal spacings. As the horizontal spacing increases from 0 to 40 mm, the stress superposition effect gradually weakens, and the dominant crack mechanism transitions from tensile-dominated to shear-dominated cracking. Due to significant inter-hole stress superposition, the S-0 specimen exhibits a high proportion of tensile cracks, which reflects its tensile-stress-dominated brittle failure characteristics. Under the influence of the “low-stress bridge” effect, the S-20 specimen exhibits a reduced degree of inter-hole stress concentration, and its AE count exhibits stepwise growth, which indicates that the dominant cracking mechanism begins to shift toward shear-induced cracking. The S-40 specimen exhibits the most significant shear-dominated cracking characteristics and maintains over 20% of its peak bearing capacity postpeak, which is highly consistent with its superior plastic deformation capacity (strain range: 0.008–0.011) and uniform strain distribution. Due to weakened interaction between the two holes in the S-60 specimen, the proportion of tensile cracks increases again, accompanied by an increase in the number of mixed-mode cracks.
Curves of stress, acoustic emission (AE) count, cumulative AE energy versus strain for specimens with different joint dip angles.
Influence of joint dip angle on AE characteristics
Figure 8 illustrates the AE count and cumulative energy characteristics during the loading-induced deformation of specimens with different joint dip angles. All such specimens exhibit a common pattern of progressive AE activity development in the prepeak stage, followed by a sharp increase at peak stress and a subsequent sharp decrease in the postpeak stage. At peak stress, both the AE count and cumulative energy reach their maximum values, as dense initiation, propagation, and coalescence of internal cracks in the rock mass during this stage result in the concentrated release of elastic strain energy. In the postpeak stage, structural instability and strain energy dissipation cause the cumulative AE energy to level off and the AE count to approach zero. Notably, the S-0-45 and S-0-60 specimens exhibit fluctuating stepwise growth in AE count as early as stages I to III, with AE activity significantly more active than that of specimens with other joint dip angles. This is because the S-0-45 specimen is in a compression-shear stress-dominated state (with a high stress concentration factor at the joint tip), while the S-0-60 specimen gradually transitions to a tensile-shear composite stress-dominated state. Both specimens experience early microcrack activation prepeak due to the stress superposition effect. In contrast, the prepeak cumulative AE energy of the S-0-0 specimen is nearly zero, with a sharp increase to the maximum value only at peak strain. This is because the 0° horizontal joint initially alleviates tensile stress concentration around the holes through deformation coordination, thereby inhibiting early microcrack development. At peak strain, sudden slip along the joint plane and coalescence with hole-surrounding tensile cracks trigger the instantaneous release of elastic strain energy.
Kernel density estimation and crack classification of AF and RA discrete points for specimens with different joint dip angles.
Figure 9 illustrates the kernel density estimation of discrete AF–RA points and crack classification results for specimens with different joint dip angles, which reveals the influence of joint dip angle on crack evolution in the rock mass. As the joint dip angle increases from 0° to 90°, the proportion of tensile cracks increases from 52.58% (at 0°) to a maximum of 79.74% (at 60°) during stages I to III. Concurrently, the kernel density in the high-AF, low-RA region continuously increases, and the crack mechanism gradually transitions from shear-dominated (S-0-30) to tensile-dominated (S-0-60). The proportion of mixed-mode cracks remains between 6.97% and 10.84%, which reflects the weak regulatory effect of joint dip angle on crack interaction. The increased kernel density in the high-AF region for the S-0-90 specimen, along with its peak stress recovery observed in Figure 4(b), corroborates the promoting effect of joint orientation on tensile failure.
Deformation characteristics of specimen strain fields
Evolution of specimen strain fields
Figure 10 shows the evolution of the apparent maximum principal strain field of the specimen with increasing loading as measured by DIC. The analysis region in the DIC test fully covers the entire surface of the rock-like specimen. The specimen has a length of 200 mm and a width of 150 mm. Overall, high strain concentration zones originate primarily around the tunnel-simulating holes. These zones then develop and propagate continuously by connecting the two holes. They further extend toward the specimen edges and generally present a band-like distribution. This pattern essentially reflects the types of crack evolution and propagation paths inside the specimens. Notably, for specimens with horizontal spacings of 40 and 60 mm, the high strain zones develop later and gradually expand from the vicinity of one hole to connect with the other hole, forming only one through crack. The apparent strain distribution in other regions is more uniform. However, for the specimens with horizontal spacings of 0 and 20 mm, the intensity and extent of high strain concentrations between the two holes are greater, and this higher intensity and larger extent of high strain concentrations indicates more extensive crack evolution between the two holes, as well as more extensive crack development between each hole and the specimen edges. This demonstrates that horizontal spacing is a key factor governing the degree of strain concentration between the holes. Appropriately increasing the hole spacing can enhance the overall bearing capacity of the specimens and reduce both the risk and severity of failure.
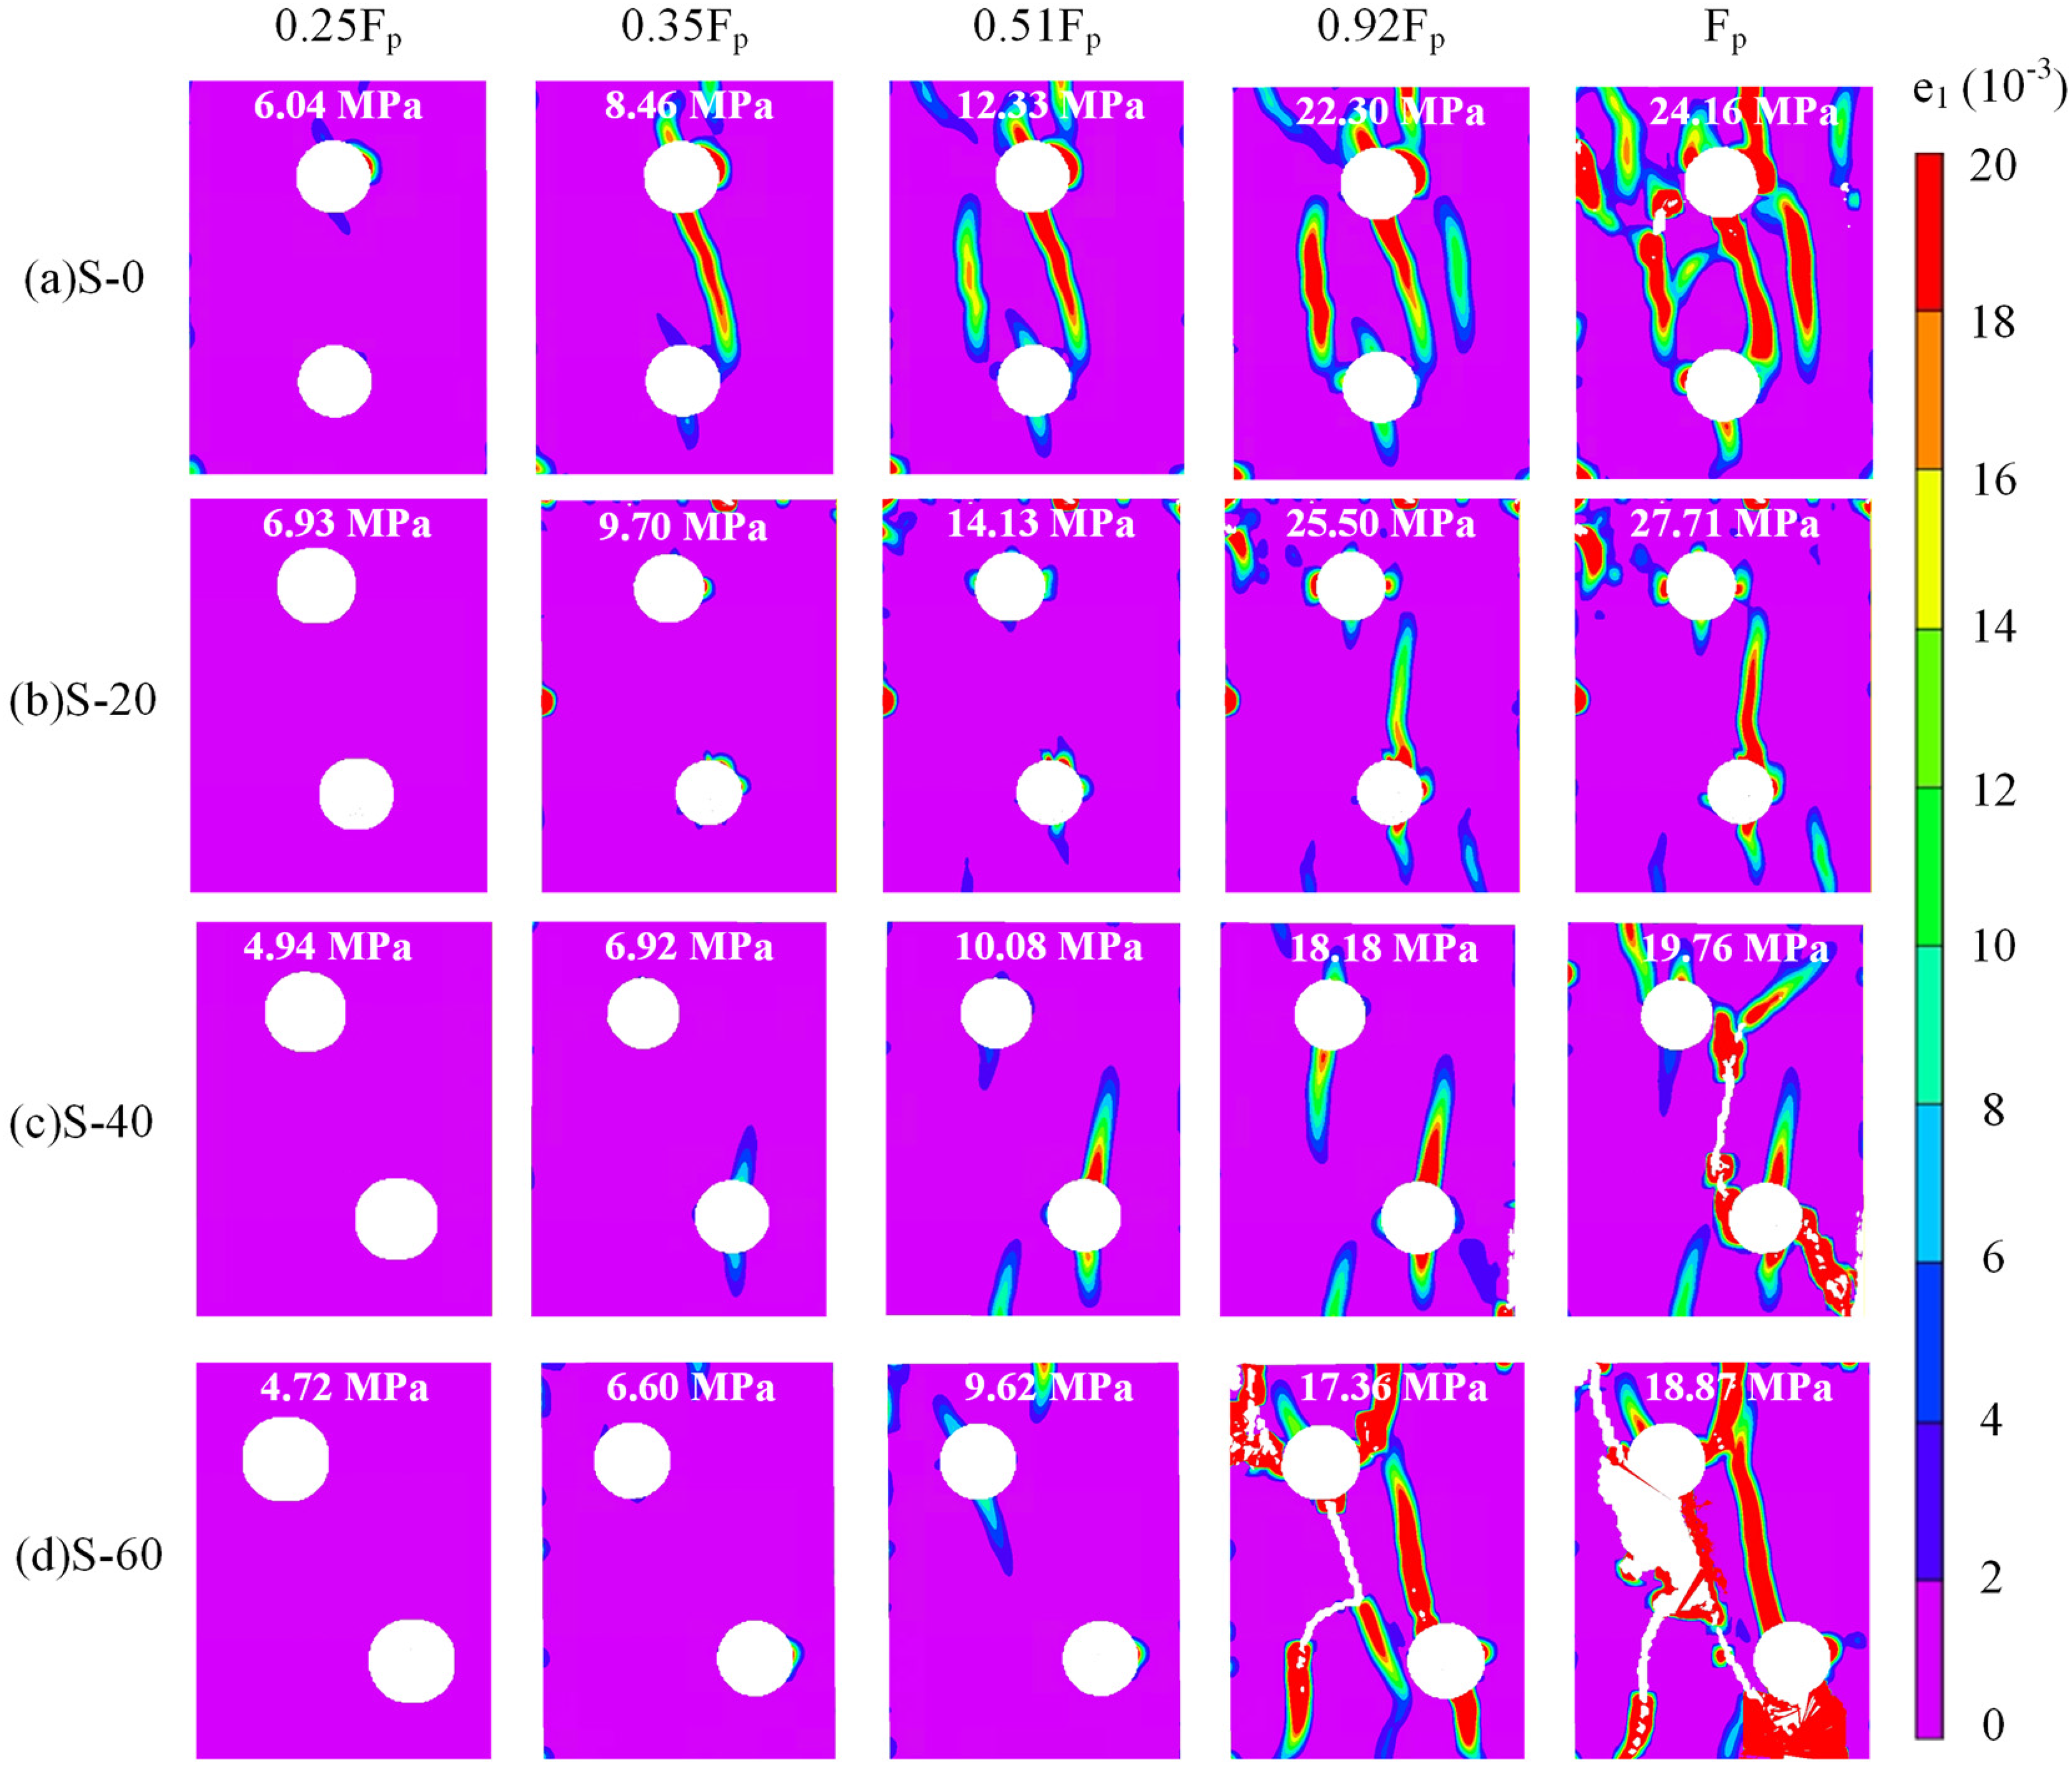
Maximum principal strain fields of specimens with different horizontal spacings.
Figure 11 illustrates that joint dip angle significantly regulates the evolution of the maximum principal strain field in rock-like specimens with upper and lower double parallel holes. The initiation and evolution of strain concentration zones exhibit distinct orientation dependence, with strain concentrations primarily concentrated around the joint tip and the holes, and showing differentiated evolutionary paths for different joint dip angles. This essentially stems from the reconstruction of the stress field around the holes, driven by the joint's role as a discontinuity in the rock mass. Specifically, the S-0-30, S-0-45, and S-0-60 specimens experience a typical compression-shear stress state, in which the strain concentration at the joint is intense and the strain gradient is maximum at the joint tip. The high strain zones extend rapidly toward the stress concentration zones around the holes, eventually forming through cracks. In the S-0-0 specimen, local tensile stress concentration is only observed at the two ends of the joint, which is attributed to the geometric discontinuity of the joint. The strain concentration zones first develop at both ends of the joint and gradually expand toward the holes, but the crack connection rate is significantly lower than that in the aforementioned three specimens. The S-0-90 specimen experiences biaxial stress, resulting in symmetric high strain bands parallel to the joint, which connect the left and right edges of the upper and lower double holes. During the failure stage, cracks initiate directly on the joint surface and propagate rapidly along the strain bands to connect the two holes. Mechanistically, joint dip angle governs the initiation locations, propagation paths, and connection rates of the strain concentration zones by modifying the stress distribution pattern of the double joint-hole system.
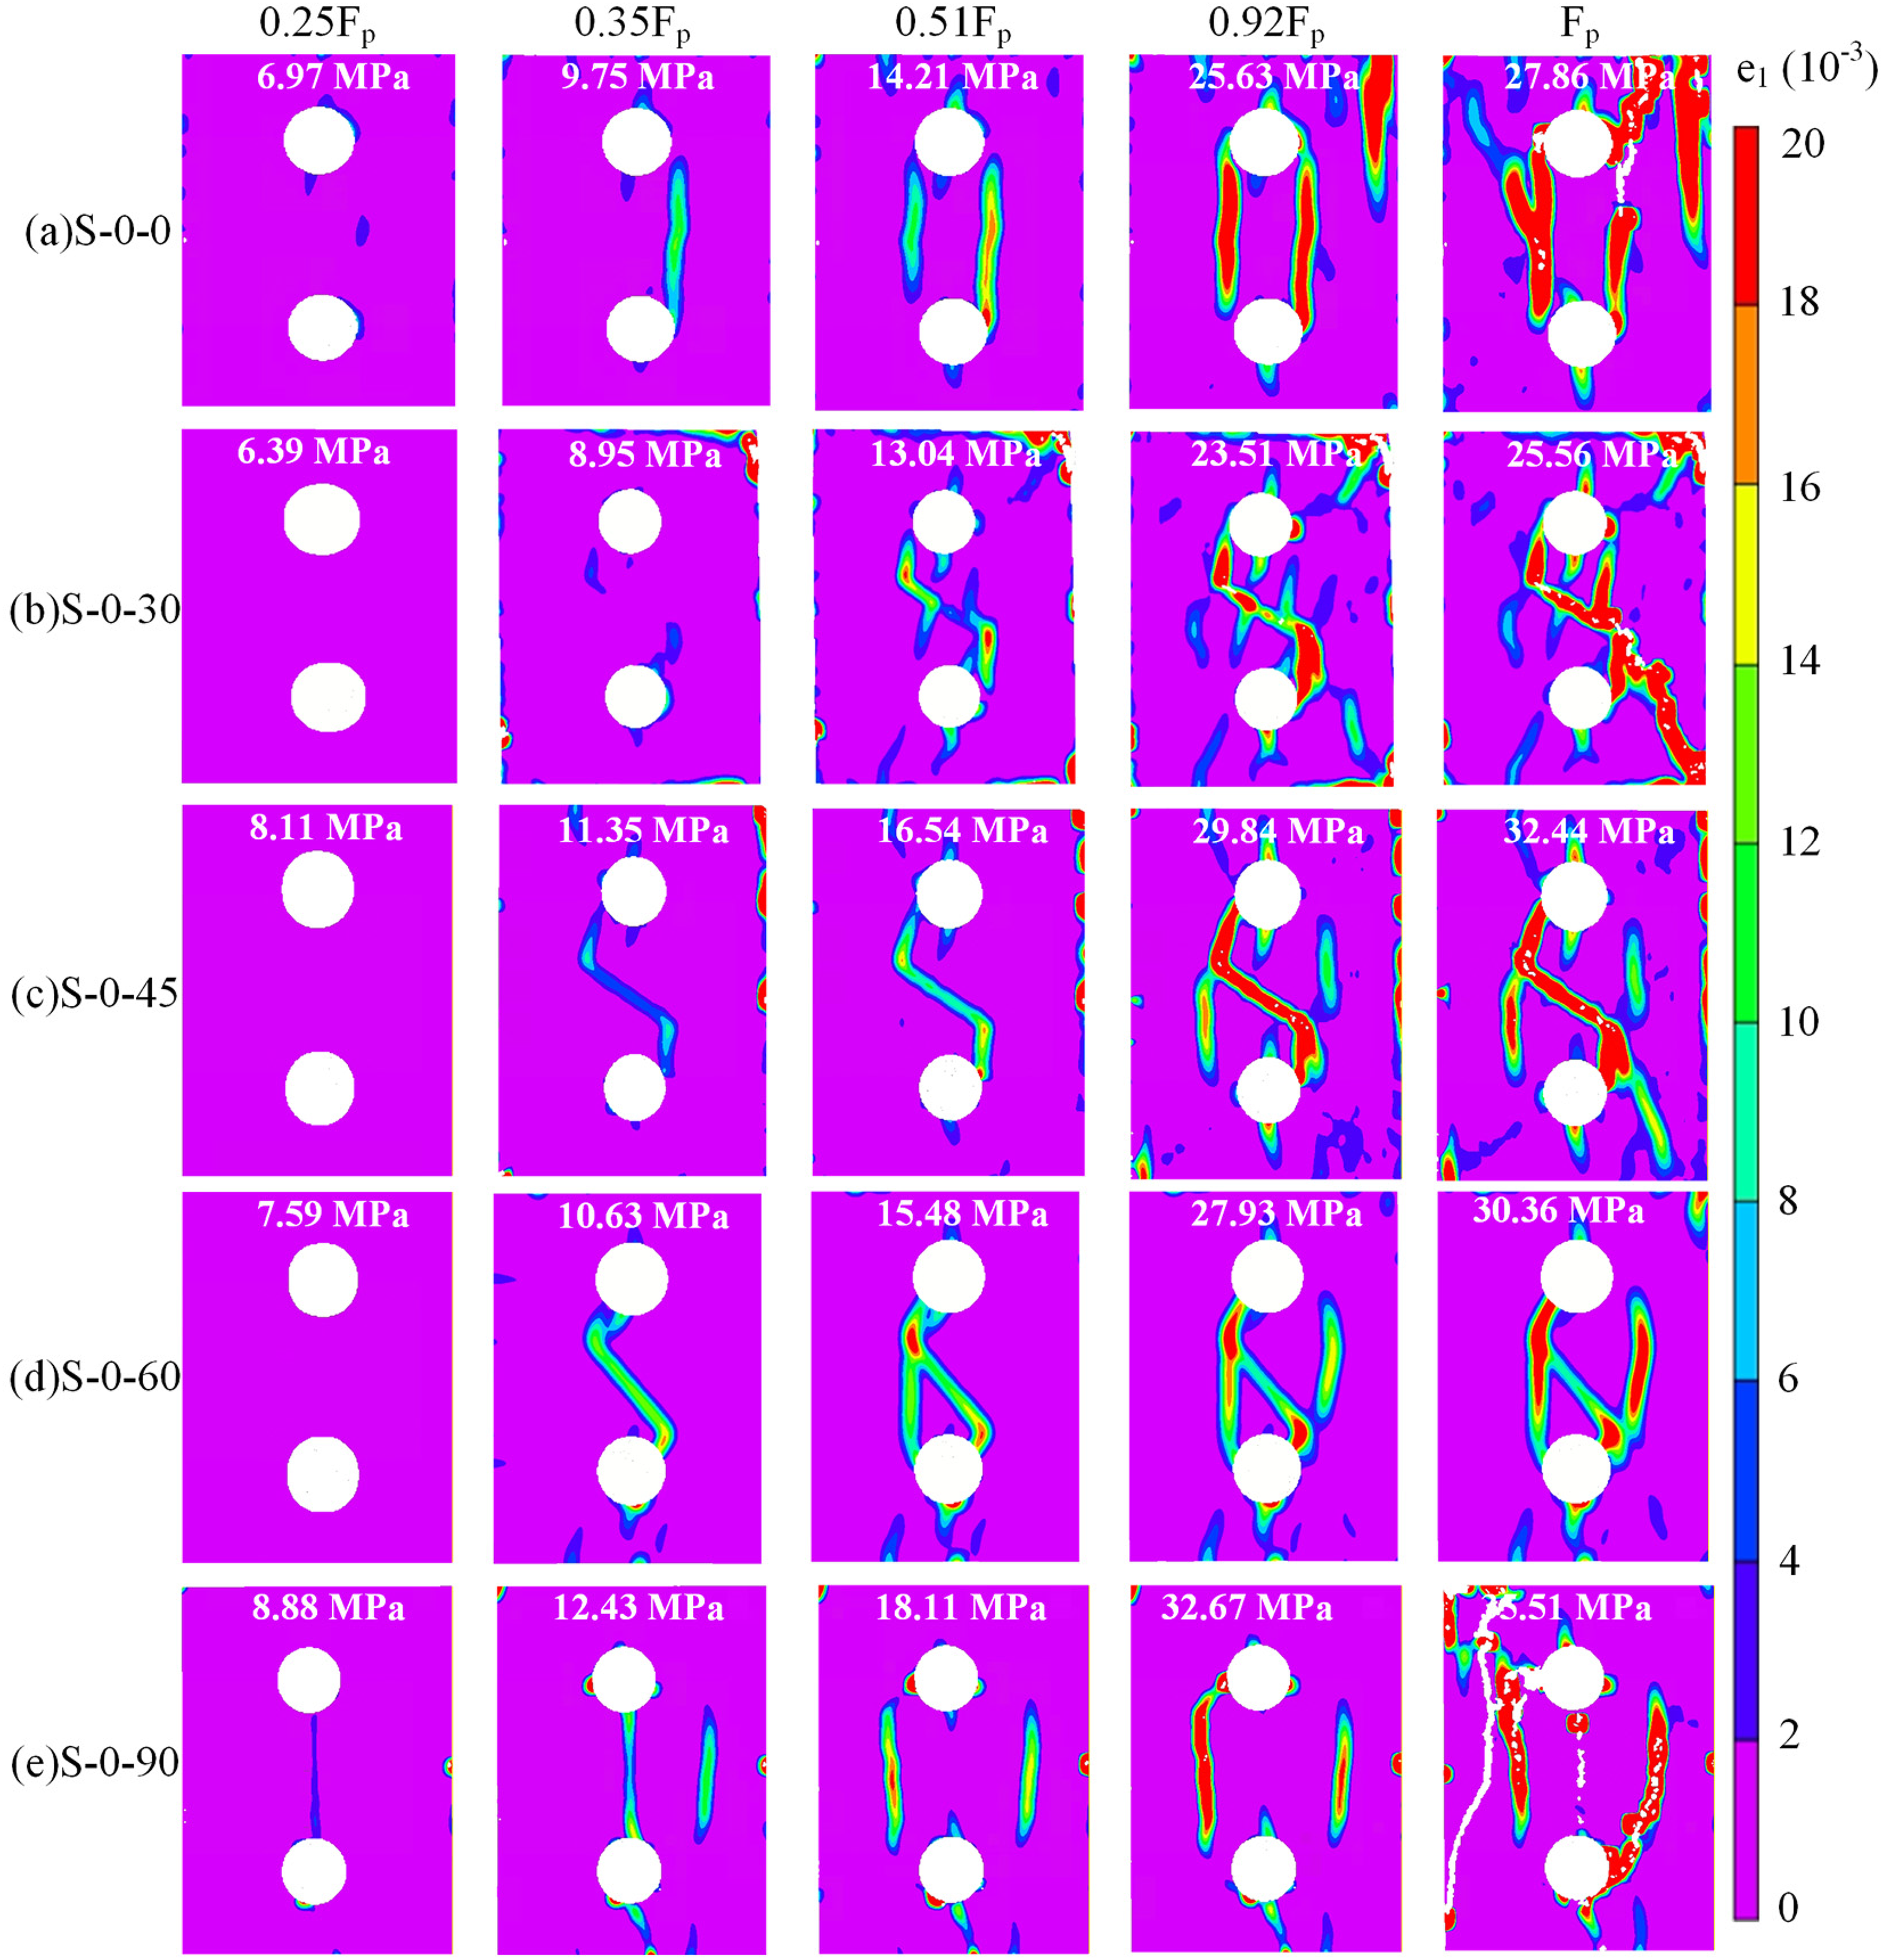
Maximum principal strain fields of specimens with different joint dip angles.
Evolution of maximum principal strain at typical locations of specimens
The apparent strain fields of the specimens indicate that high strain concentration zones are generally located around hole peripheries and joint tips. By analyzing the maximum principal strain–time curves at representative measurement points (e.g. P5, P3’, and P7’), the influence of horizontal spacing and joint dip angle on local strain evolution is revealed (Figure 12). Point 5, located at the bottom of the holes, is dominated by tensile stress, whereas point 3’, positioned on the side of the holes, exhibits characteristics of shear stress concentration. In the S-0 specimen, the double-hole-induced stress superposition effect is pronounced, which is manifested by the rapid increase of nodal strains that peak at an early loading stage, resulting in the formation of steep strain–time curves. At P5, tensile strain surges, while at P3’, sudden strain jumps occur, which are caused by shear stress concentration. For the S-40 and S-60 specimens, their stress concentration is more evenly distributed, resulting in gradual strain growth, delayed peak strain, and lower strain amplitudes. The inflection points of the strain–time curves accurately predict the initiation of secondary tensile cracks and shear cracks, confirming that horizontal spacing modulates stress concentration intensity by altering the local stress field distribution.
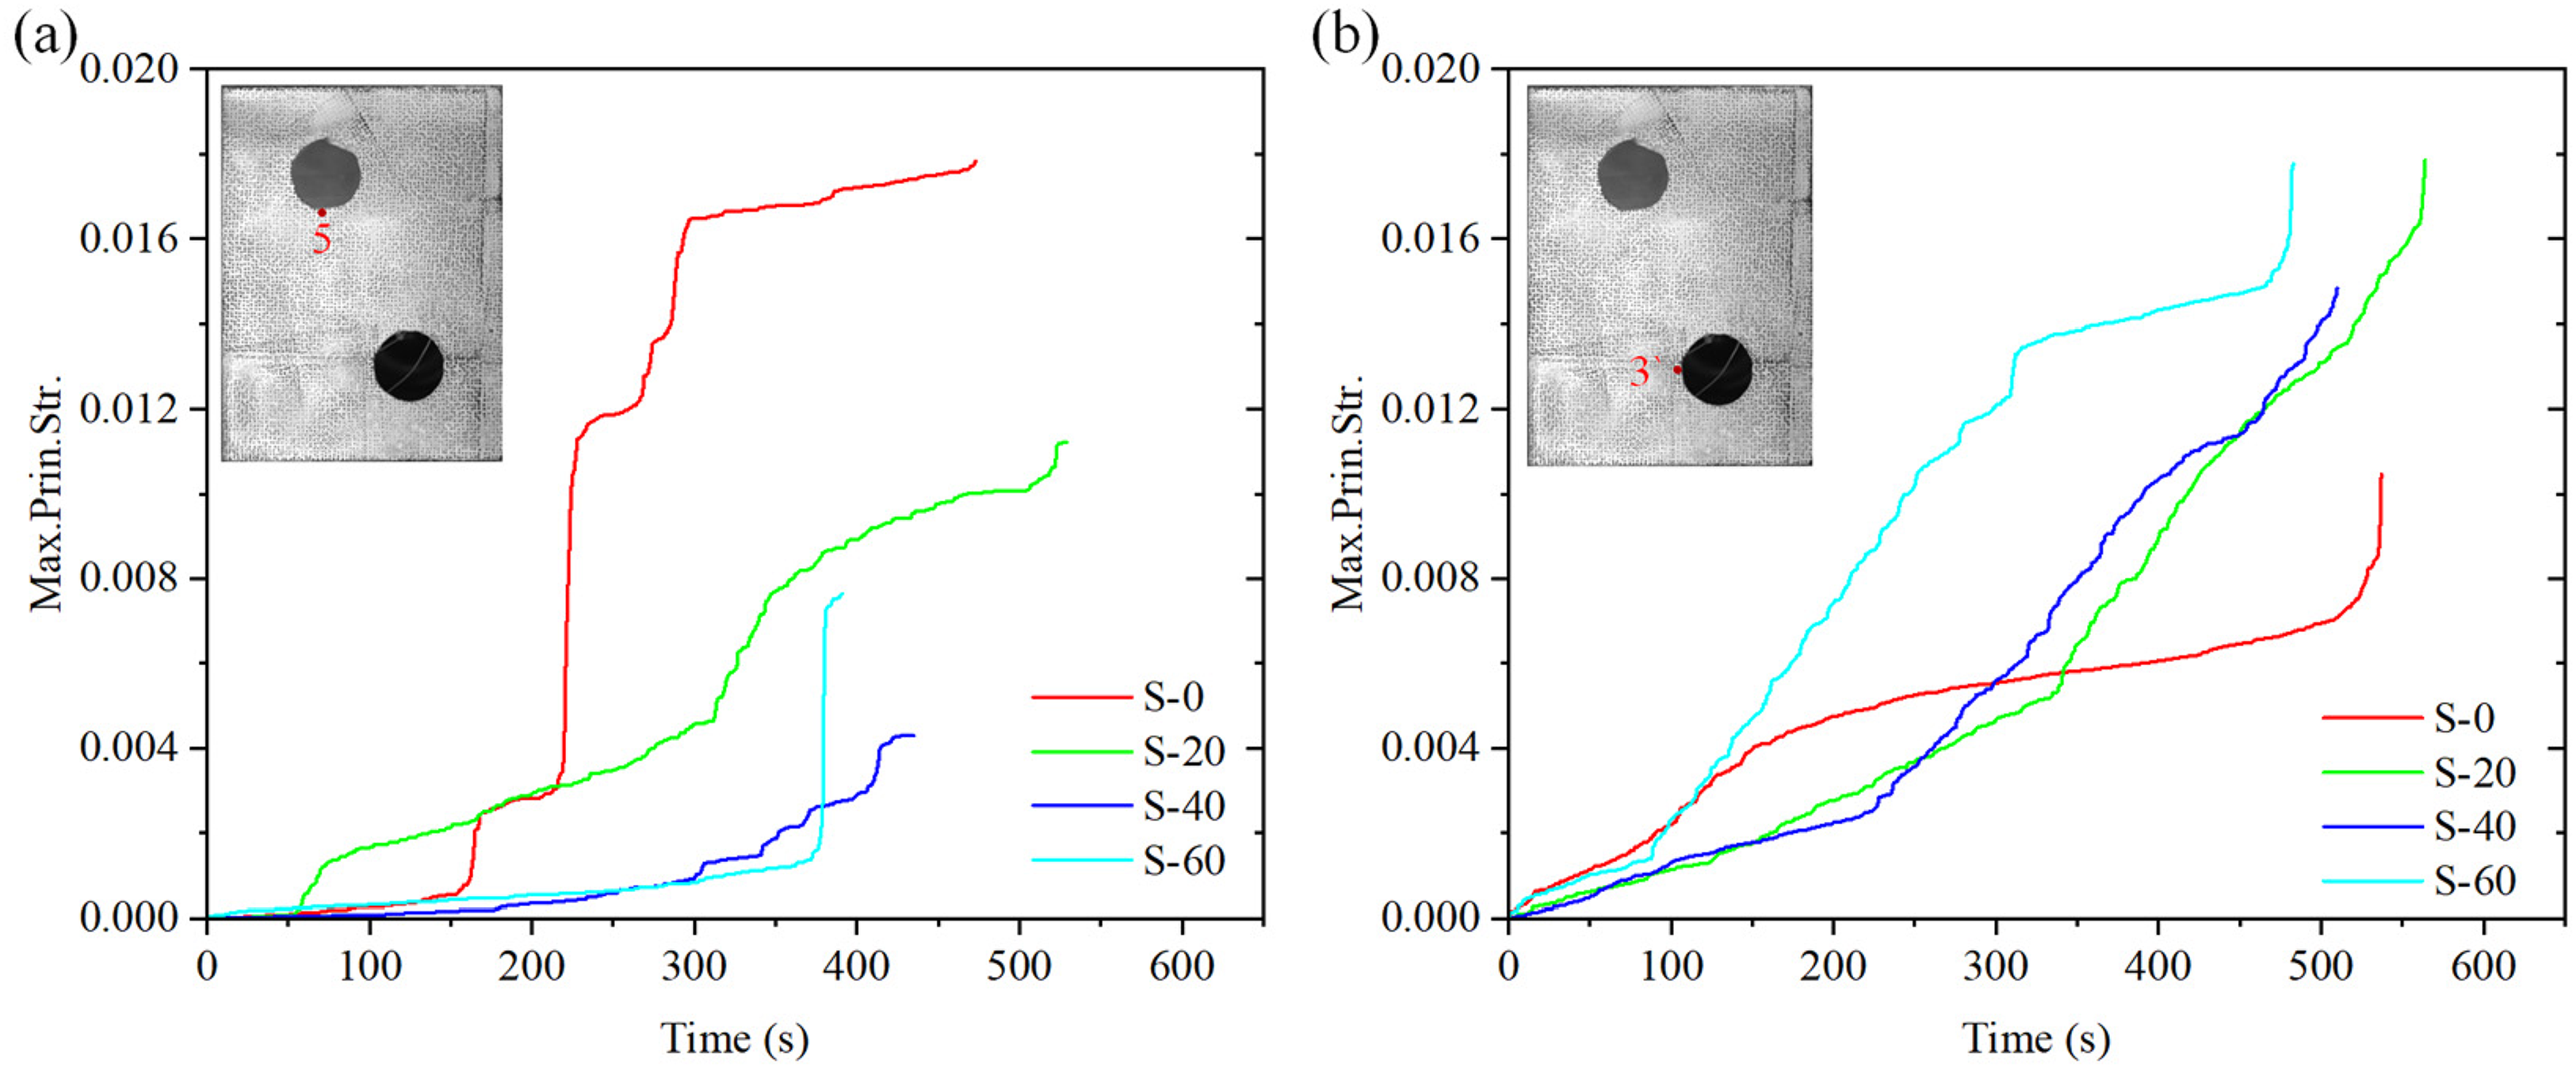
Strain–time curves at typical locations of specimens with different spacings. (a) Point 5 and (b) point P3’.
To reveal the regulatory effect of joint dip angle on the local deformation evolution of rock masses associated with parallel tunnels, two specific measurement points were selected for dynamic response analysis of the time-dependent maximum principal strain, and these two points are points 5 and 7’ (Figure 13). Point 5 is located in the tensile stress concentration zone at the bottom of the holes, while point 7’ is located in the compressive stress concentration zone on the sides of the holes. The strain evolution characteristics at these two points differ significantly and are closely associated with stress field reconstruction and crack propagation mechanisms induced by different joint dip angles. The strain curve at point P5 exhibits overall alternating characteristics of “stepwise increase” and “periodic stabilization.” Specifically, for the S-0-45 specimen, the 45° joint forms an optimal compression-shear coupling angle with the applied loading direction, resulting in a “two-stage steep rise” in strain, which corresponds to the initiation and propagation of tensile wing cracks, as well as the coalescence of secondary tensile cracks (Cao et al., 2015). The S-0-90 specimen exhibits an “early steep rise–later stabilization” pattern, which is attributed to the synergistic effect between the vertical joint and the stress field around the holes. The S-0-0 specimen exhibits a “long-period stabilization–final sharp rise” pattern, as the horizontal joint initially alleviates tensile stress concentration at the bottom of the holes. The S-0-30 and S-0-60 specimens exhibit a “single-stage gradual increase” pattern, with differences arising from the distinct stress states induced by the angle between the joint and the applied loading direction. The strain curve at P7’ exhibits an overall “gradual increase” trend. Under different joint dip angles, the slopes of the curves and the final strain values show minor differences. This is because the shear stress distribution on the sides of the holes is primarily determined by the hole geometry, and joint dip angle has a weak effect on modifying the stress concentration factor in this region. Only the S-0-45 specimen shows a slightly steeper curve slope, attributed to the superposition of joint-induced stress and shear stress on the sides of the holes, while in contrast, the S-0-90 specimen exhibits a slightly gentler slope, as the joint disperses the shear stress on the sides of the holes. The S-0-0 specimen exhibits minor strain fluctuations in the later stage, which are caused by slip along the joint plane. In summary, joint dip angle regulates local strain by directionally reconstructing the stress field and guiding crack propagation paths, exerting a significant influence on the tensile deformation at P5 but a weaker influence on the shear deformation at P7’. This provides a theoretical basis for prioritizing tensile-sensitive regions in the stability analysis of underground parallel tunnels.
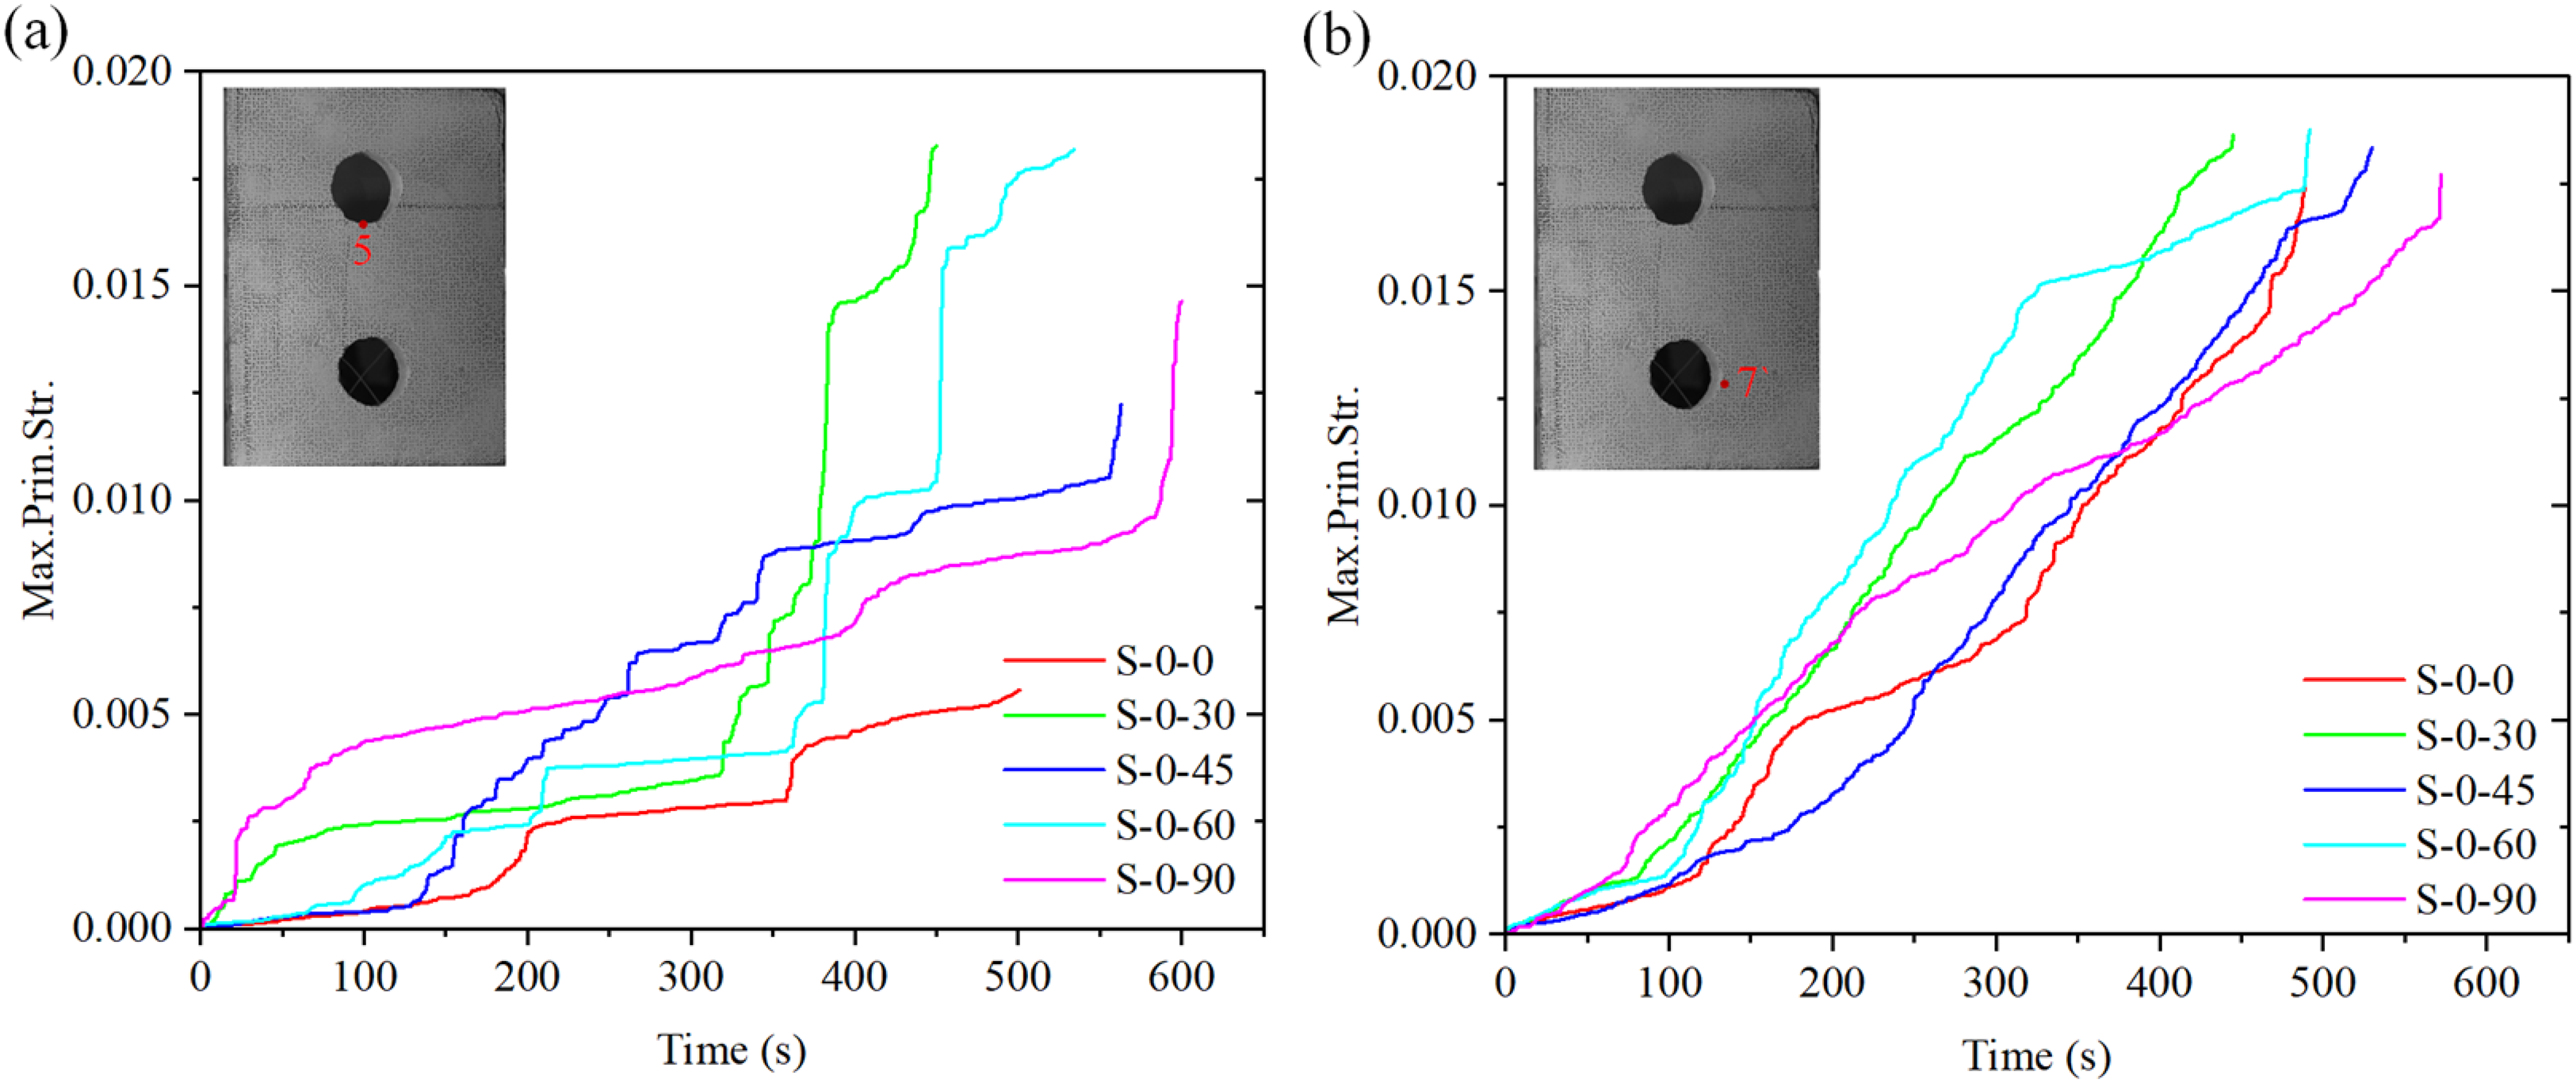
Strain–time curves at typical locations of specimens with different joint dip angles. (a) Point 5 and (b) point P7’.
Failure modes of specimen cracks
Crack type identification
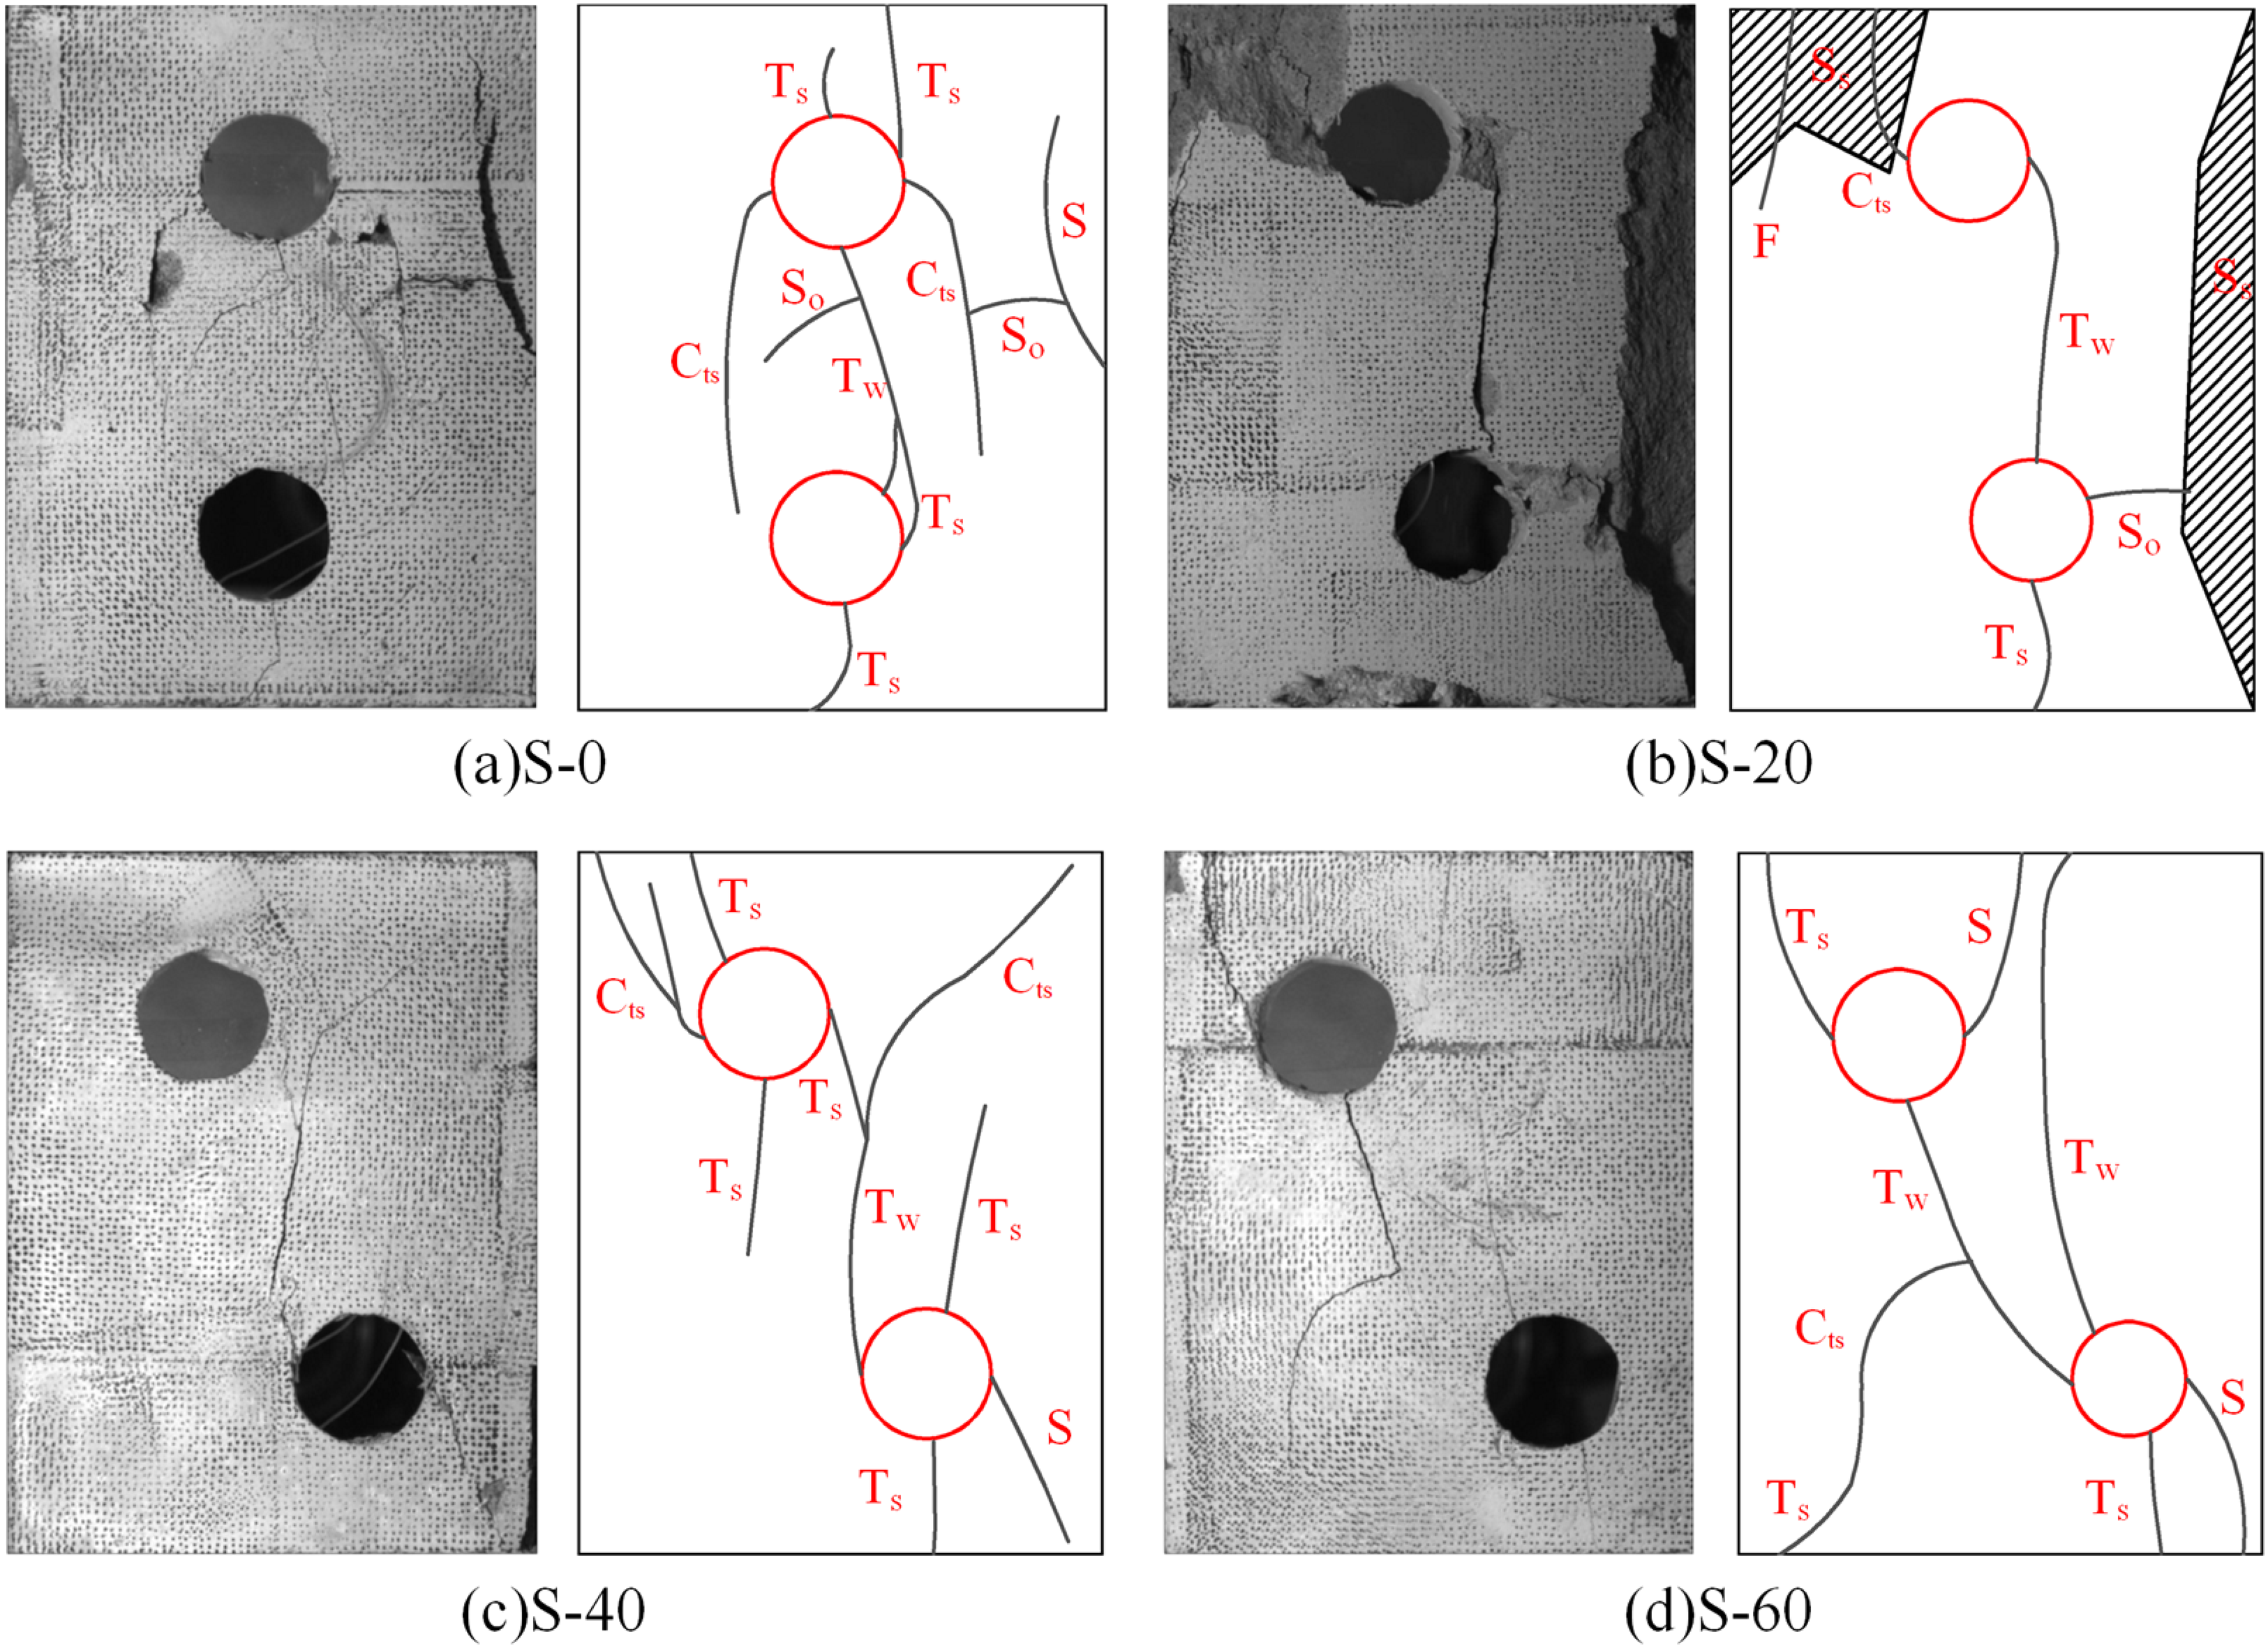
Figure 14 presents the types and morphologies of cracks observed in the experiments. During uniaxial loading, cracks preferentially initiated and propagated around the periphery of the holes and near the pre-existing joint, forming three typical types: tensile wing cracks, secondary tensile cracks, and shear cracks. Tensile wing cracks originated from point A at the edge of the holes and extended toward the specimen boundary away from the holes. Secondary tensile cracks originated from points C and D at the ends of the holes along the loading direction, which was attributed to tensile stress concentration. Shear cracks first initiated at point B between the two holes (attributed to shear stress concentration) and then developed gradually. Under continued loading, various cracks evolved and propagated, ultimately leading to the failure of the specimens.
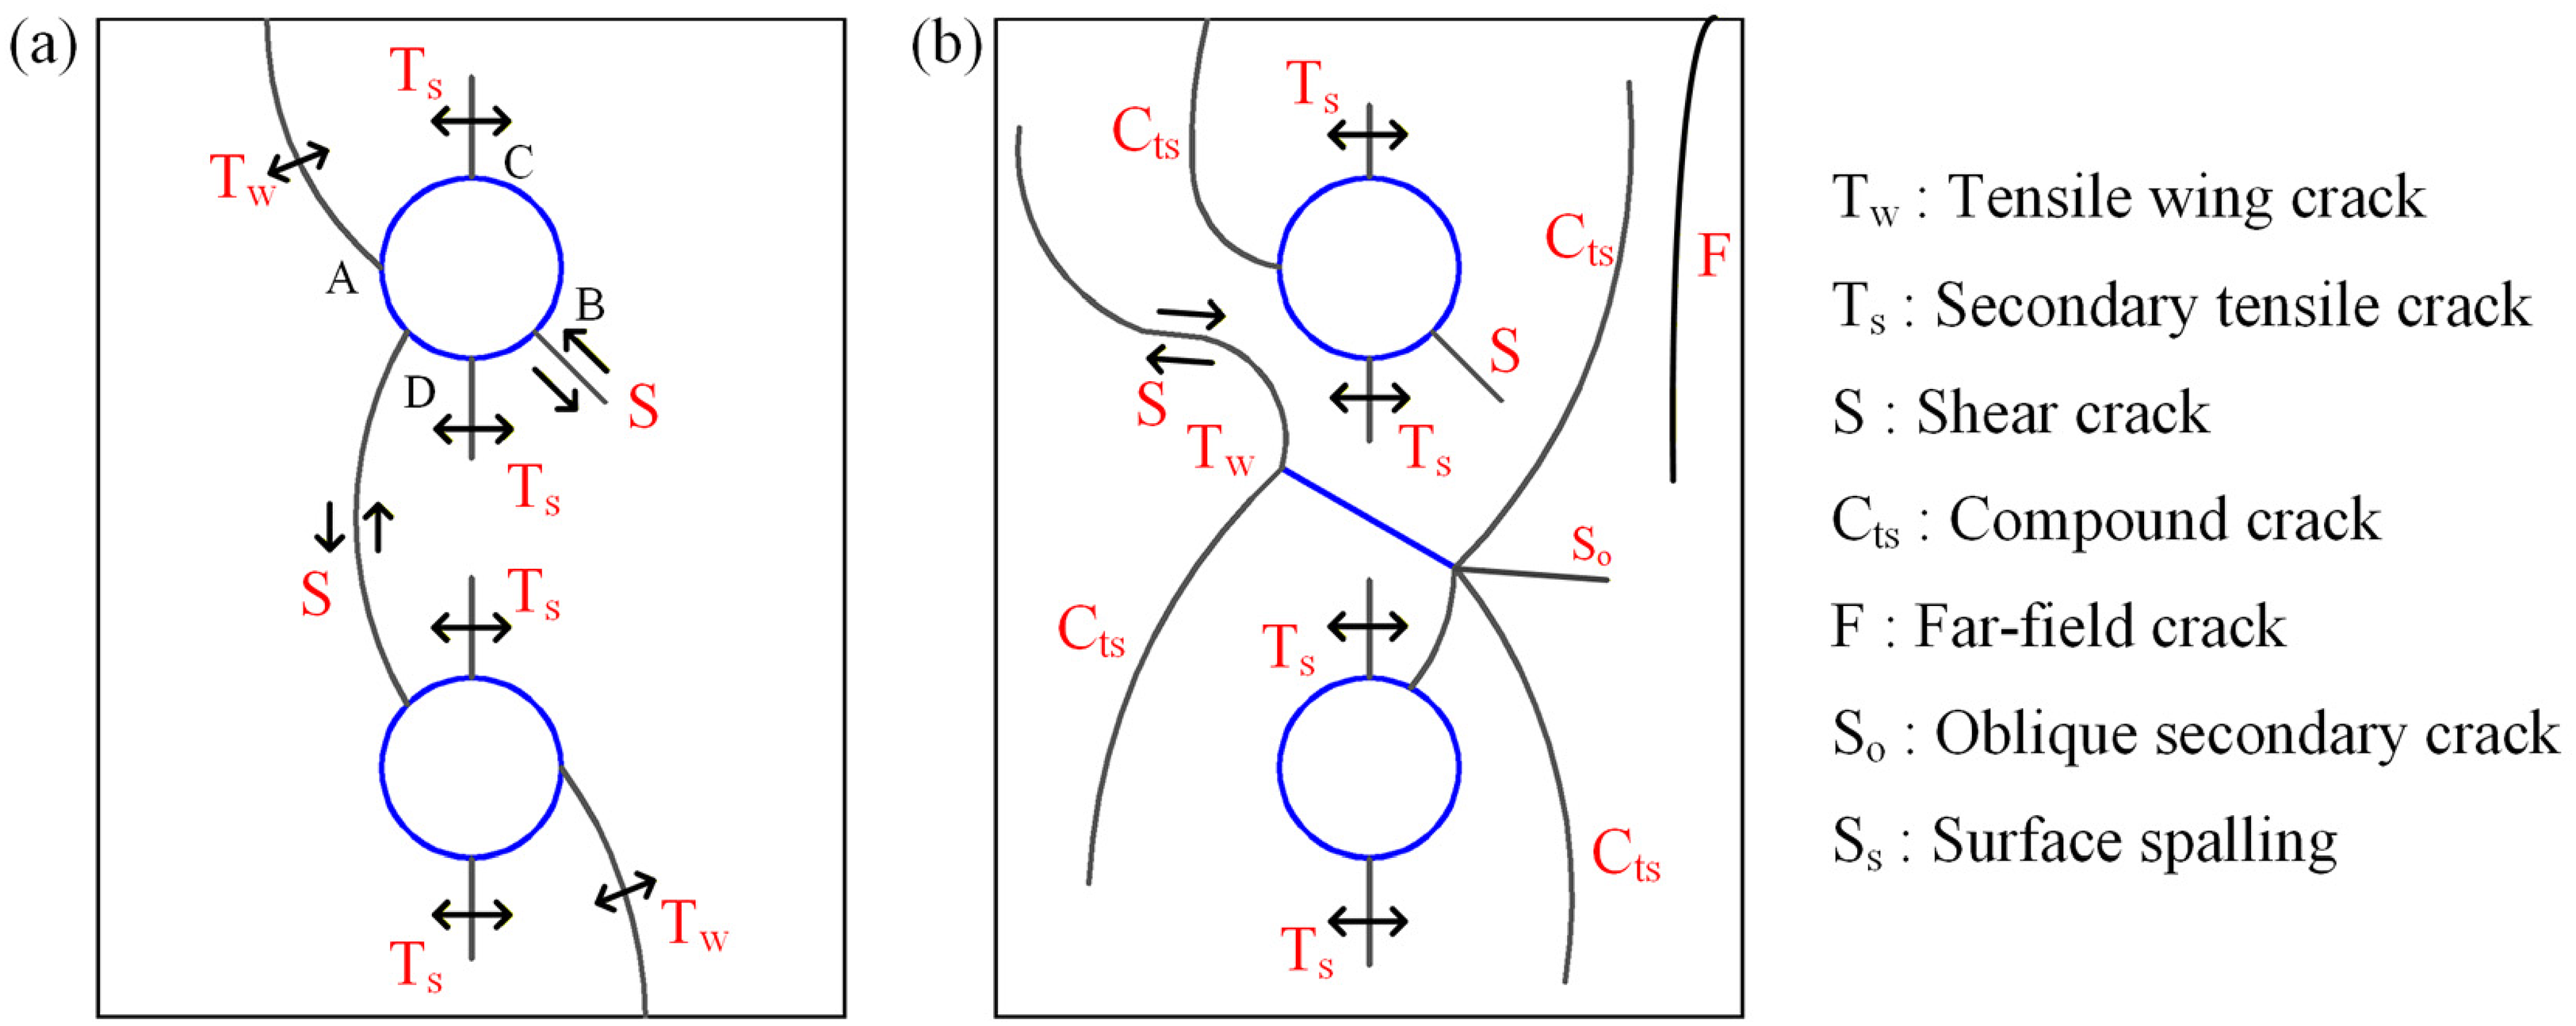
Crack failure types observed in the experimental specimens. (a) Holed sample and (b) holed sample with a joint.
Figure 15 illustrates the displacement vector distribution of the S-0-45 specimen. The distinct characteristics of displacement vectors around the double holes provide an intuitive basis for identifying different crack types. The bending and separation of displacement vectors at the outer ends of the double holes can be used to identify tensile wing cracks. This bending and separation pattern intuitively reflects the formation mechanism of these cracks, thereby providing a critical basis for analyzing the crack propagation process. The outward-sliding displacement vectors between the two holes correspond to the development of shear cracks, which is related to the internal stress distribution of the double-hole specimen, thereby aiding in understanding the mechanical response under complex stress conditions. The separated displacement vectors observed below the ends of the double holes represent secondary tensile cracks, whose formation is related to stress redistribution within the double-hole specimen and mechanical effects induced by the propagation of initial cracks. Analyzing the displacement vector characteristics of these cracks helps investigate the evolutionary laws of crack propagation. The displacement vector map clearly exhibits the characteristics of different crack types, providing key evidence for the in-depth study of crack development and mechanical response mechanisms in the double-hole specimens.
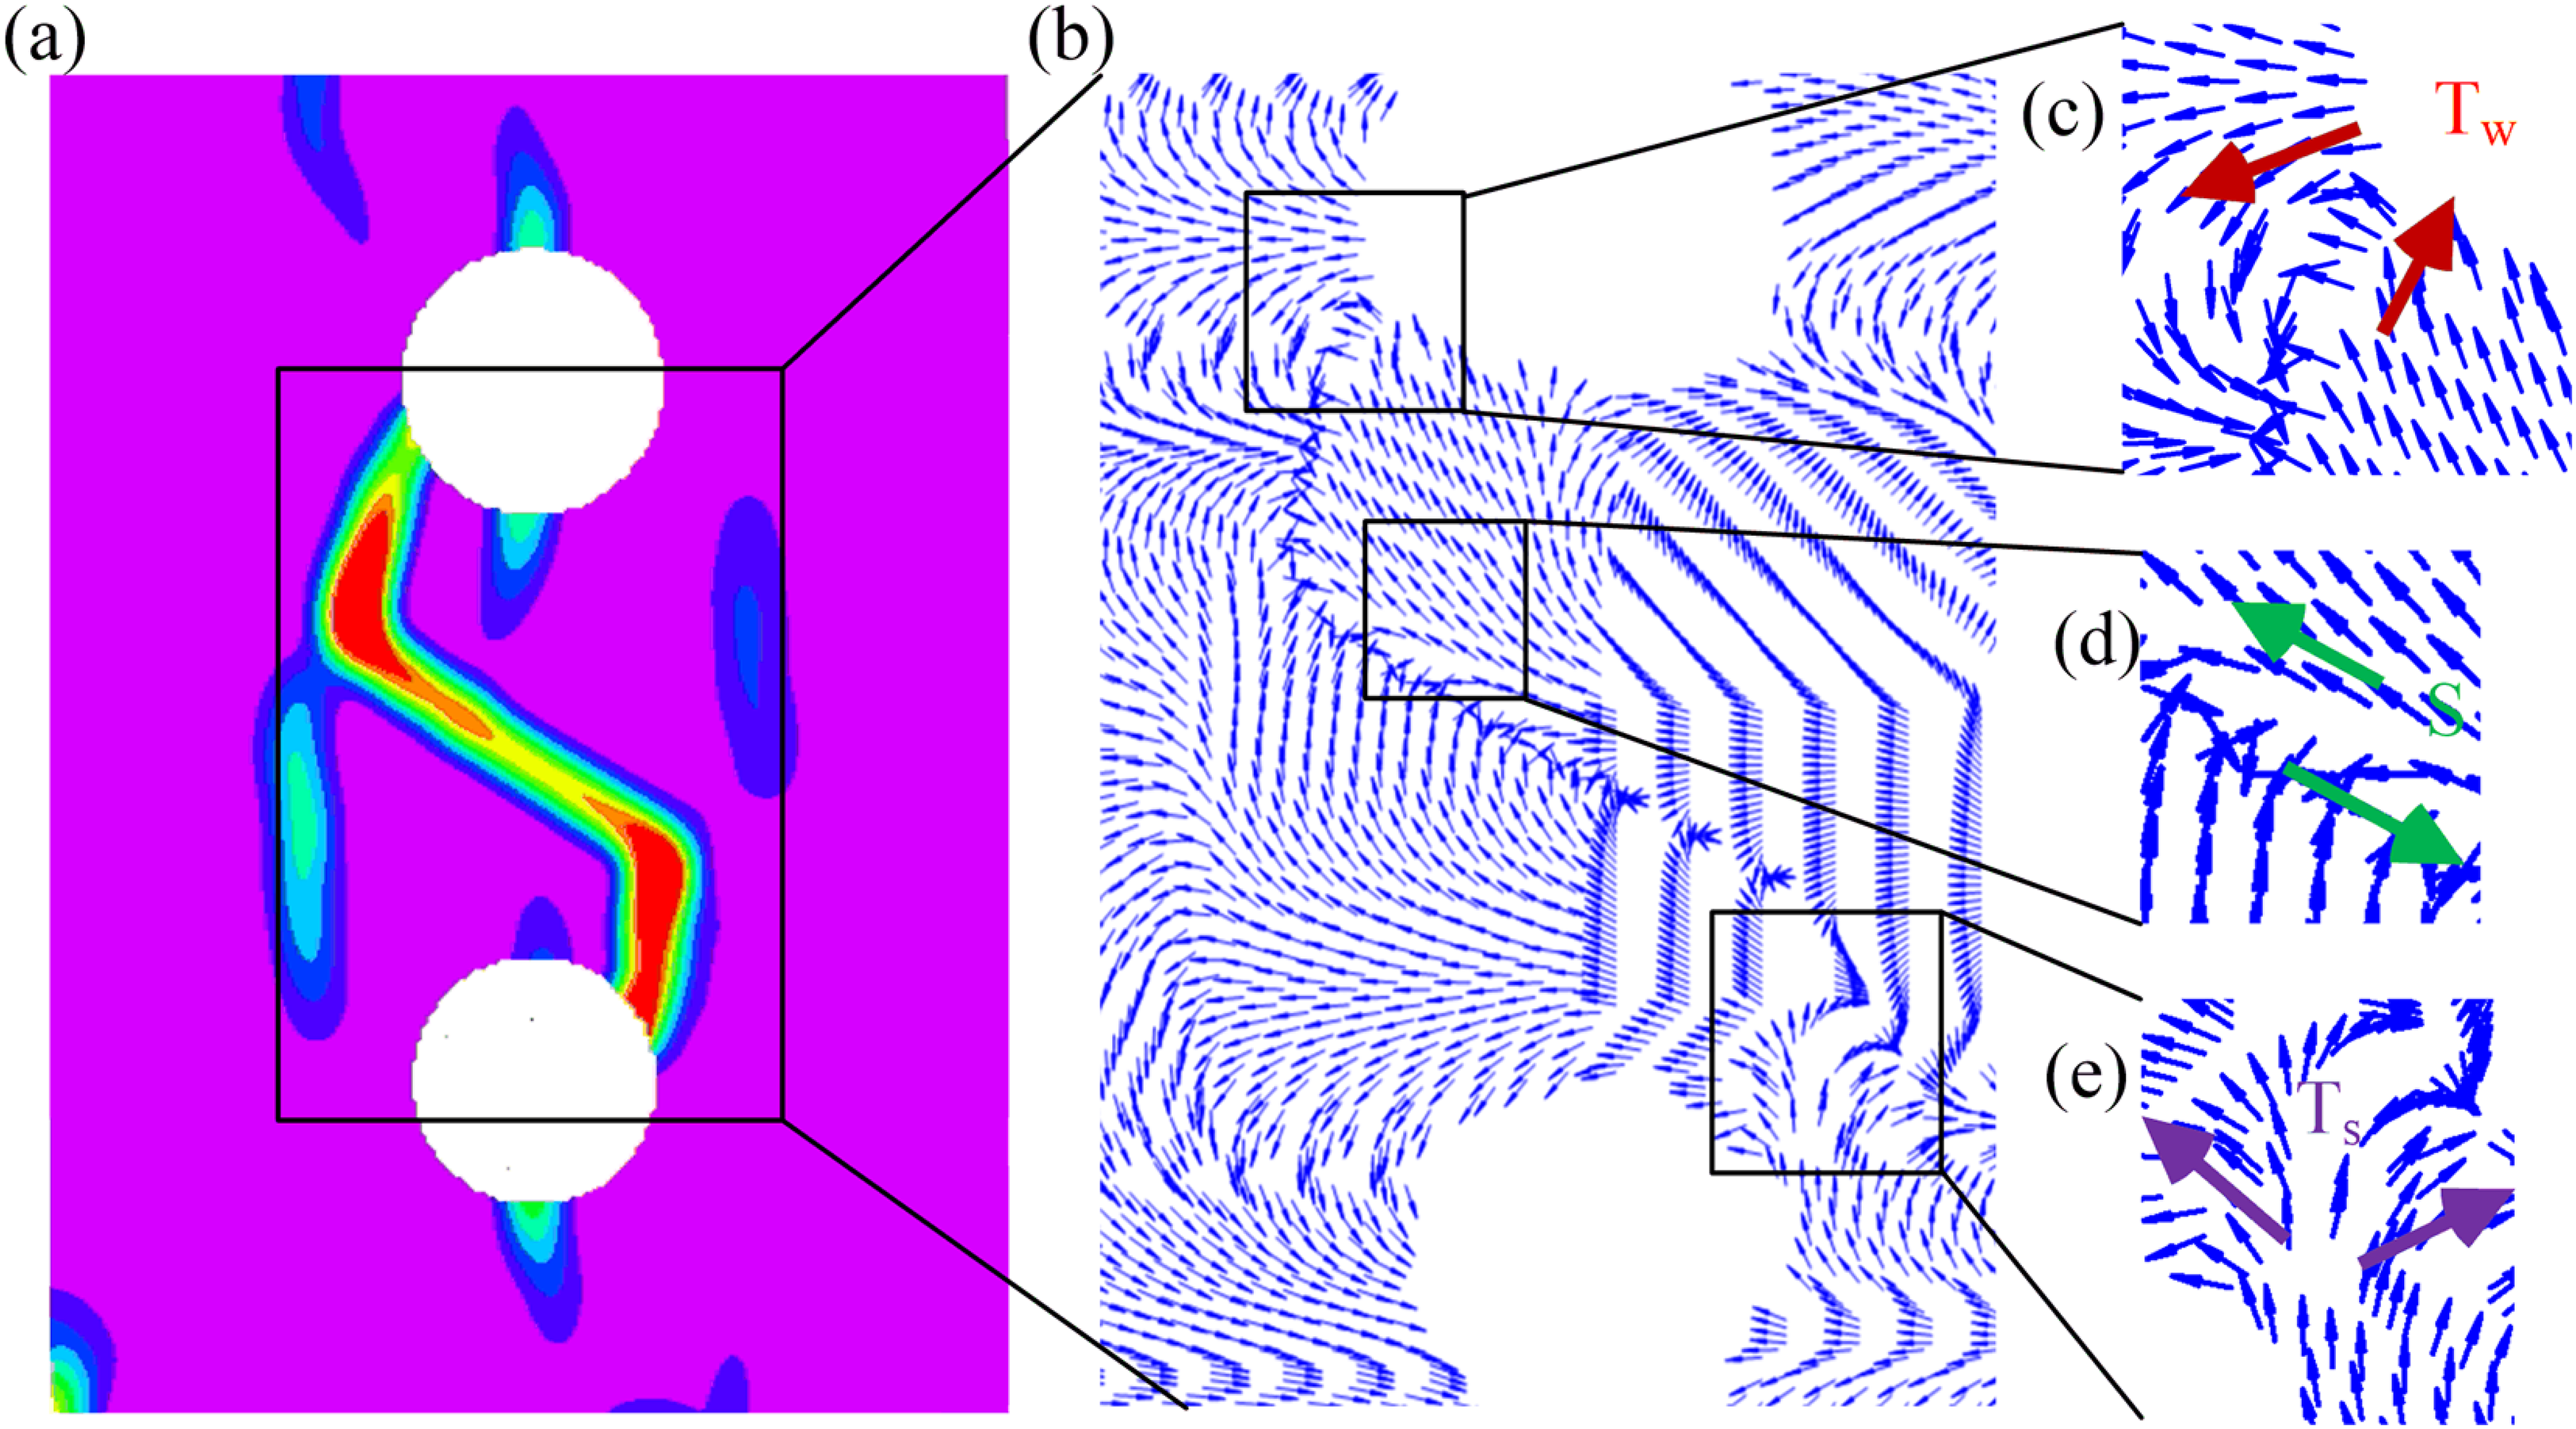
(a) Maximum principal strain field of the S-0-45 specimen. (b) Displacement vectors around the double holes of S-0-45. (c) Displacement vectors for a tensile wing crack. (d) Displacement vectors for a shear crack. (e) Displacement vectors for a secondary tensile crack.
Figure 16 systematically reveals the initiation, evolution mechanisms, and spatial distribution patterns of composite cracks and oblique secondary cracks by analyzing the distribution characteristics of the lateral displacement field (denoted as U) and the maximum shear strain field (denoted as exy). In detail, the composite crack originates from the spatial interweaving of a secondary tensile crack and a shear crack, which is a process evident in Figure 16(a). In Figure 16(a), the U field exhibits a displacement discontinuity zone at the midpoint of the line connecting the double holes, a zone that corresponds to the shear stress concentration zone that first induces the initiation of the shear crack. Simultaneously, the exy field exhibits local tensile strain concentration in this zone, triggering the initiation of the secondary tensile crack. These two cracks initiate synchronously and couple with each other during propagation, which in turn forms the composite crack. The oblique secondary crack exhibits a “dual initiation source” evolution pattern. The exy field in Figure 16(b) shows the first initiation source at the joint tip, where the joint plane forms a 60° angle with the loading direction and is in a compression-shear stress state that easily induces microcracks. The second initiation source is located on the sides of the double holes, induced by the shear stress concentration around the double holes. As the load gradually increases, the shear strain concentration zones of the two sources gradually connect along the “path of least resistance” to form the oblique secondary crack. The synergistic effect of co-directional sliding displacements near the joint edge and the double holes in the U field provides the necessary conditions for the coalescence of the oblique secondary crack. The formation and evolution of both crack types are controlled by the composite tensile-shear stress within the rock mass, the stress superposition effect of the joint-hole system, and the synergy of displacements, which essentially reflects the regulatory mechanism of the joint-hole system for spatial stress redistribution and crack development paths in the rock mass.
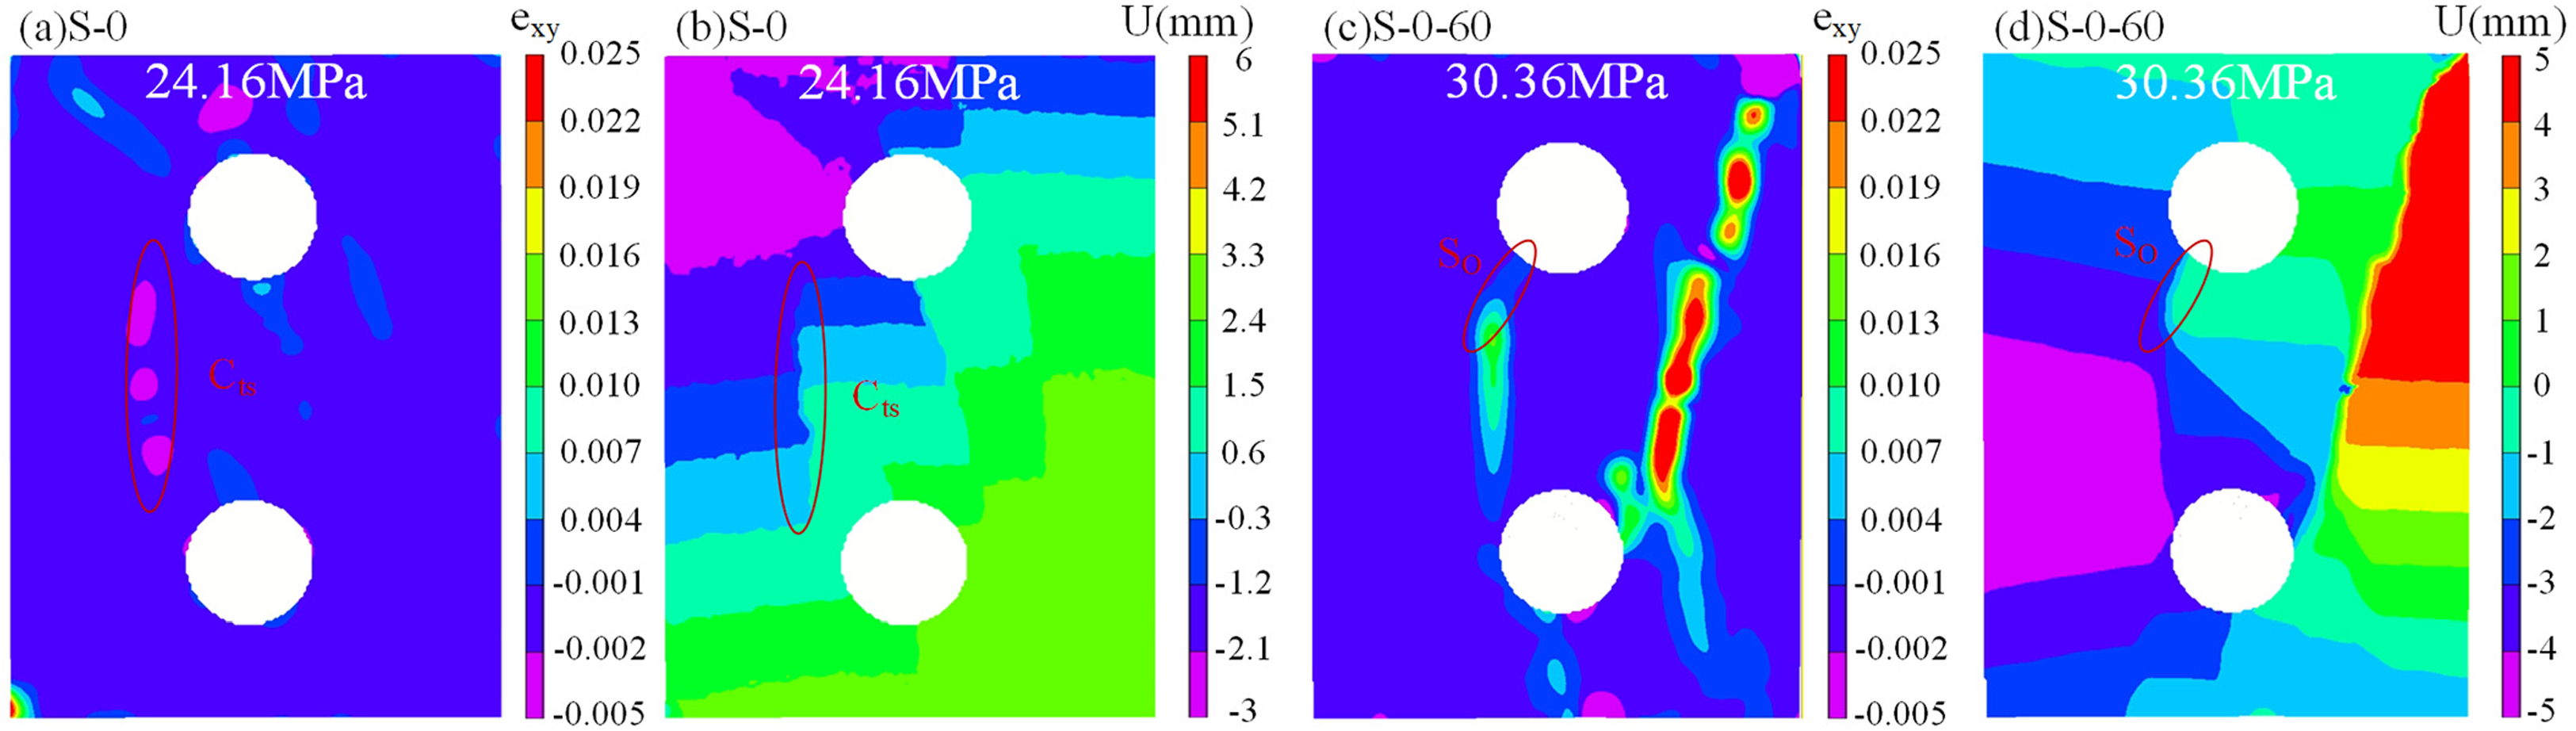
Maximum shear strain field (exy) and lateral displacement field (U). (a) exy of the S-0 specimen, (b) U of the S-0 specimen, (c) exy of the S-0-60 specimen, and (d) U of the S-0-60 specimen.
Crack propagation process
As illustrated in Figure 17, horizontal spacing significantly regulates the propagation behavior of the main crack, a regulation manifested in the transition of the main crack path from clear and stable to complex and variable as the spacing increases from 0 to 60 mm. Specifically, in the S-0 specimen, the main crack extends directly upward and sideways from the specimen bottom, which first initiates at a stress level of 0.3σ₁ and significantly guides the surrounding secondary cracks. In the S-20 and S-40 specimens, the increased horizontal spacing alters the stress distribution, causing deflection of the main crack propagation direction, an increase in path tortuosity, a more complex distribution of surrounding cracks, and simultaneous intensification of the interaction between secondary cracks and the main crack. The S-60 specimen exhibits significant rightward extension of the main crack with prominent branching, which, together with secondary cracks, forms a complex network structure. This fully demonstrates the complexity and diversity of crack propagation under larger horizontal spacing conditions. Overall, increasing the horizontal spacing prompts a shift in the main crack propagation direction from unidirectional and straightforward to complex and diversified, with a continuous increase in the intensity of interactions between cracks, as well as between cracks and specimen boundaries. Secondary cracks consistently participate in the crack development process, and they synergize with the main crack to ultimately form distinct failure modes. This analysis indicates that horizontal spacing regulates the complexity of cracks and the intensity of interactions by altering the stress distribution within the specimen.
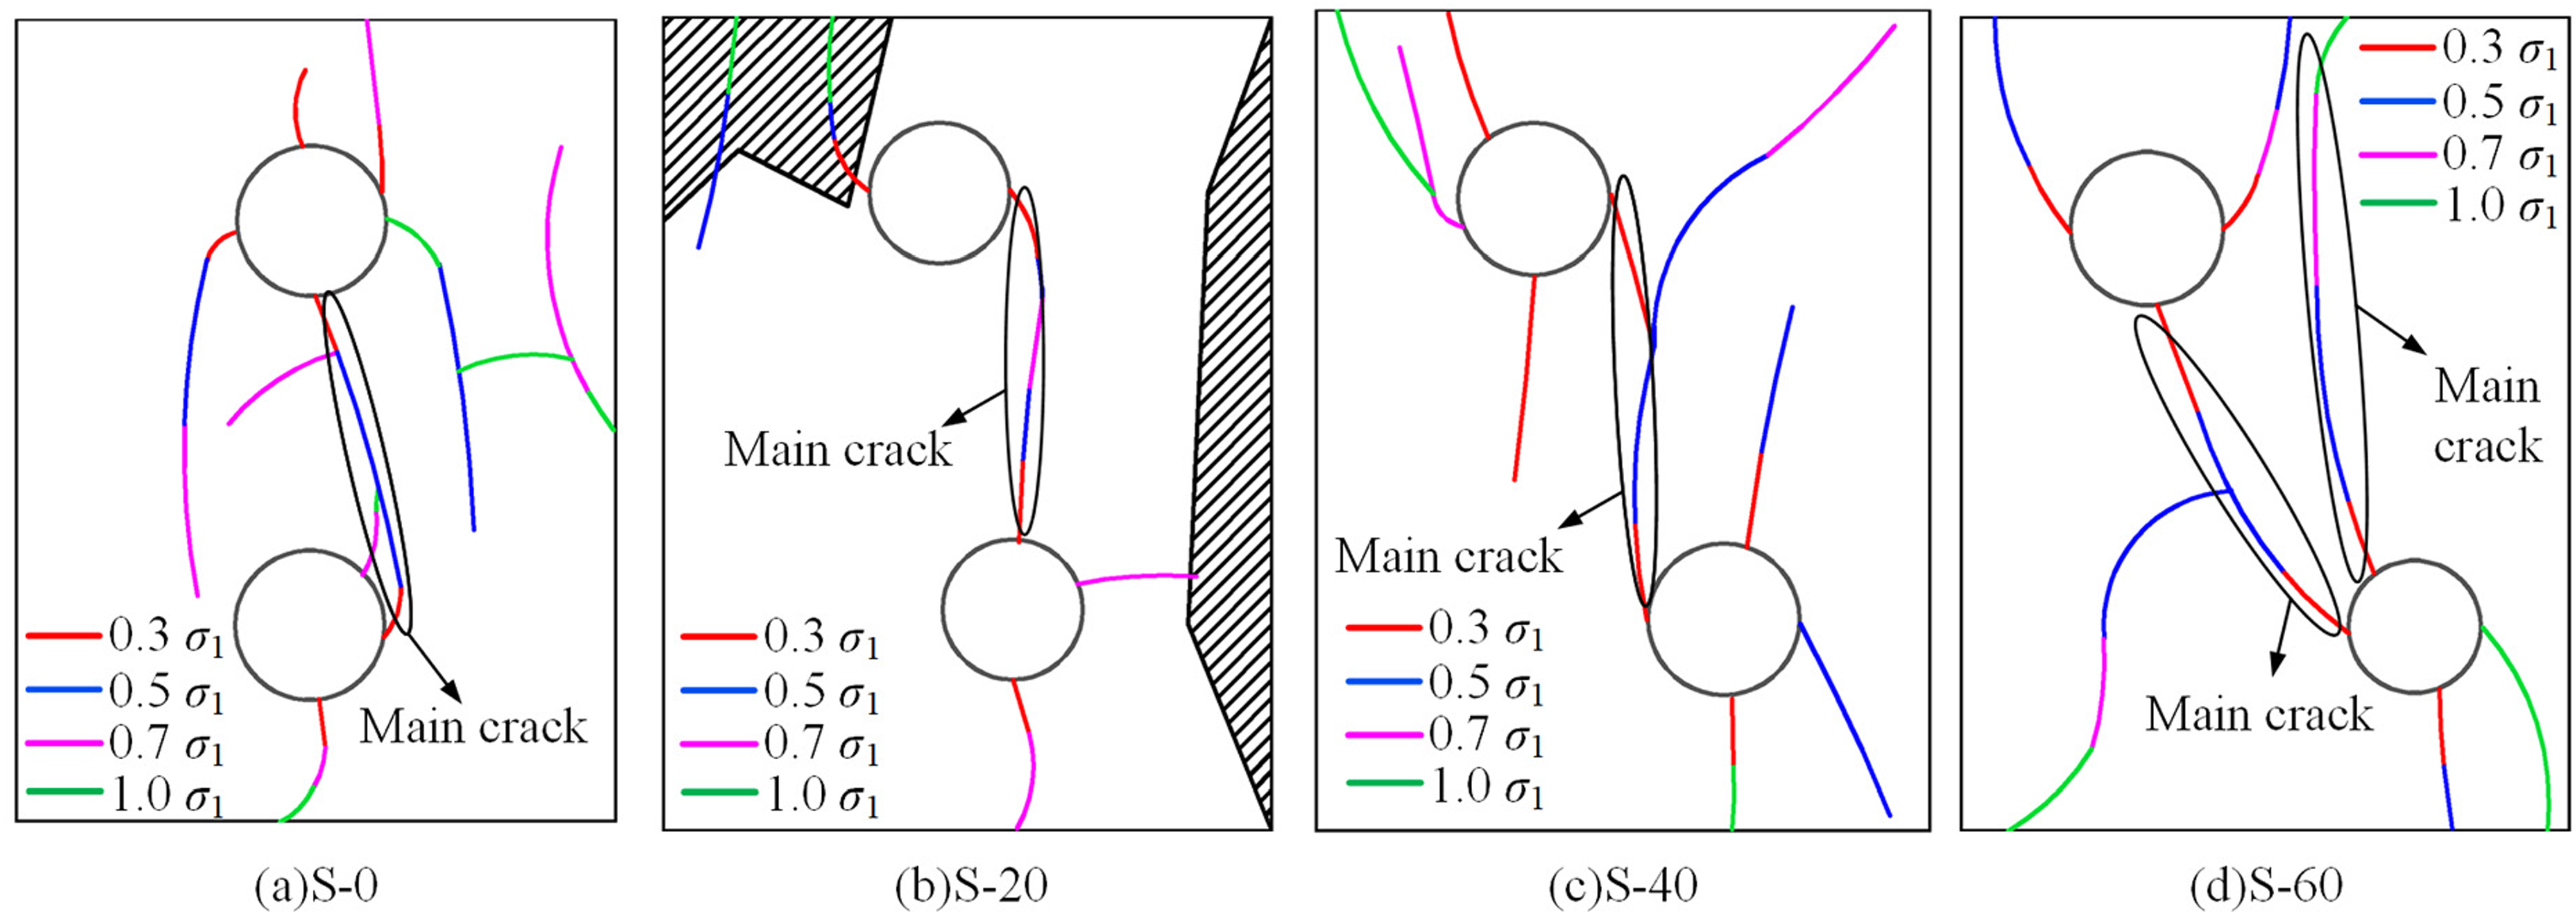
Crack failure process diagrams for different horizontal spacings.
As illustrated in Figure 18, specimens with different joint dip angles exhibit significant differences in crack propagation characteristics. In the S-0-0 specimen, cracks primarily extend vertically, connecting with the sides of the holes. When the joint dip angle increases to 30°, 45°, or 60°, the crack propagation paths of the specimens become increasingly complex, exhibiting oblique and multidirectional extension features. Cracks extend both outward from the holes and toward the joint, with inter-hole cracks beginning to exhibit connection tendencies. The tortuosity of the crack paths further increases with the joint dip angle, with their specific paths and morphologies varying significantly with the dip angle. When the joint dip angle reaches 90°, crack propagation in the specimens primarily occurs parallel to the joint, which reflects the significant guiding effect of the joint on crack extension. In general, as the joint dip angle increases from 0° to 90°, the crack propagation direction gradually transitions from being initially perpendicular to the joint plane to eventually parallel to it, and the morphology of the crack paths evolves from relatively regular morphologies to complex ones, which reflects the dominant mechanism by which the joint structure interacts with the external stress field to jointly govern crack initiation and propagation. The above analysis indicates that the joint dip angle not only determines the initial direction of crack propagation but also controls the evolutionary law of crack propagation paths through its coupling with the stress field, exhibiting distinct angle-dependent characteristics.
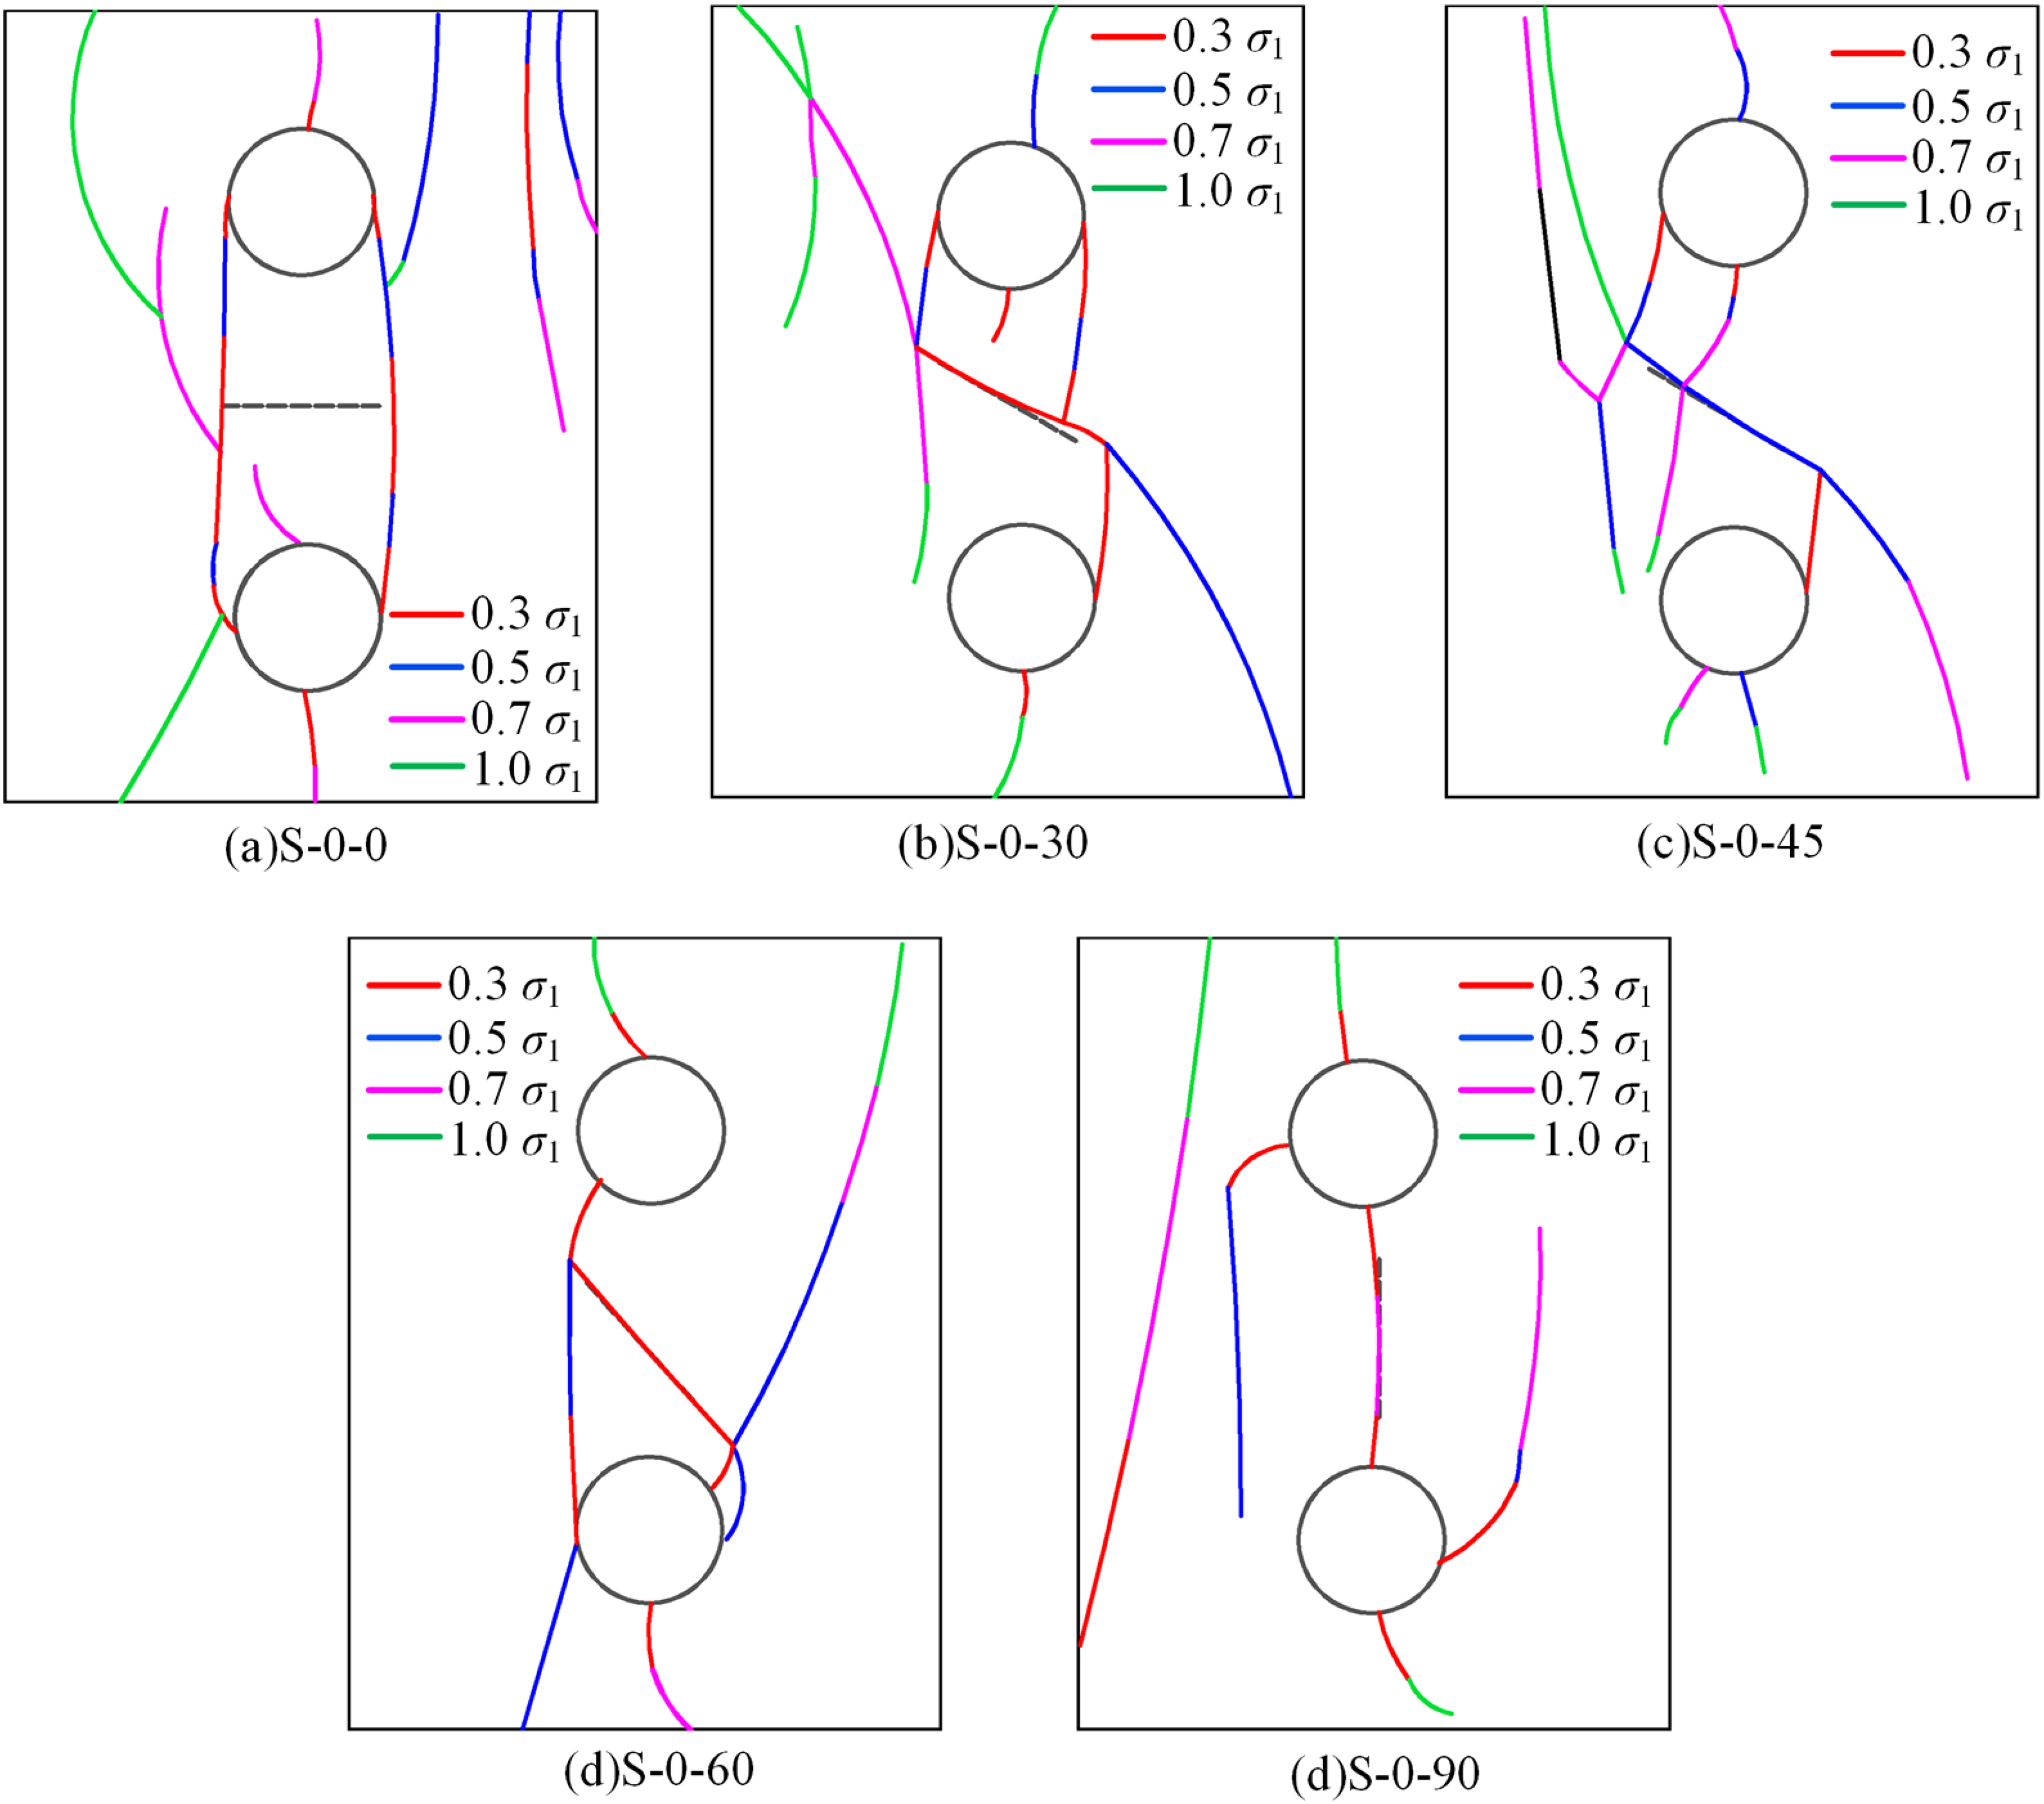
Crack failure process diagrams for different joint dip angles.
Crack types in final failure patterns
Figure 19 illustrates the overall crack failure characteristics of specimens with different horizontal spacings, indicating that horizontal spacing significantly regulates crack types and the dominant crack mode exhibits a regular evolution as spacing increases. Specifically, from the S-0 to S-60 specimens, the dominant crack type transitions from the synergistic action of shear cracks and composite cracks to shear crack dominance. The development level of secondary tensile cracks exhibits nonlinear fluctuations as horizontal spacing increases. Notably, the S-40 specimen exhibits a distinct characteristic of tensile wing cracks extending toward the specimen edges, while composite cracks and shear cracks form an intermittent network between the two holes, and secondary tensile cracks develop uniformly around the peripheries of the holes—this collectively constitutes a complex mode of synergistic multicrack propagation. Other specimens (e.g. S-0, S-60) do not exhibit this characteristic of balanced development of multiple crack types. This distinct characteristic arises because horizontal spacing directly influences the mechanical balance of crack development by regulating the stress superposition intensity between the two holes. For the S-0 and S-20 specimens, significant stress superposition promotes the synergistic propagation of shear cracks and composite cracks, while for the S-60 specimen, weakened stress superposition leads to shear crack dominance. For the S-40 specimen, however, the most balanced stress field distribution enables the full development of tensile, shear, and composite cracks, thereby forming a multitype crack network.
Crack failure diagrams for different horizontal spacings.
Figure 20 illustrates the crack failure characteristics of specimens with different joint dip angles, revealing the directional control of the joint dip angle on the crack combination mode. Overall, the crack development mode exhibits systematic evolution as the joint dip angle changes. Specifically, shear cracks dominate at joint dip angles of 0° to 30°, while at joint dip angles of 30° to 60°, the proportion of mixed-mode cracks gradually increases, and tensile cracks dominate at a joint dip angle of 90°. Among these jointed specimens, the S-0-45 specimen is the most distinctive, exhibiting the highest proportion of mixed-mode cracks. Tensile wing cracks, secondary tensile cracks, and shear cracks form a spatially interwoven network, while composite cracks form closed loops around the double holes, and far-field cracks initiate from the specimen edges. The S-0-90 specimen is also distinctive in that tensile wing cracks form a symmetrical double-wing structure connecting the double holes and the joint, while composite cracks only appear locally and exhibit significant tensile dominance. These special phenomena stem from the joint dip angle exerting a distinct regulatory effect on the crack propagation path, and this regulatory mechanism operates such that for a joint dip angle of 45°, the relative position of the joint and the tunnel-simulating double holes optimizes the interaction of multiple crack types and promotes the formation of a mixed-mode crack network. For a joint dip angle of 90°, the joint plane is perpendicular to the loading direction, and this orientation maximizes tensile stress concentration, thereby inhibiting shear crack development and enhancing the tensile-dominant mechanism. In comparison, the S-0-0 specimen is characterized by the interweaving of shear cracks and secondary tensile cracks, while the S-0-30 specimen exhibits oblique extension of tensile wing cracks and a transition zone of composite cracks, and the S-0-60 specimen exhibits a sharp increase in tensile wing cracks and uniform distribution of secondary tensile cracks, which further confirms the regulatory effect of the joint dip angle on crack paths.
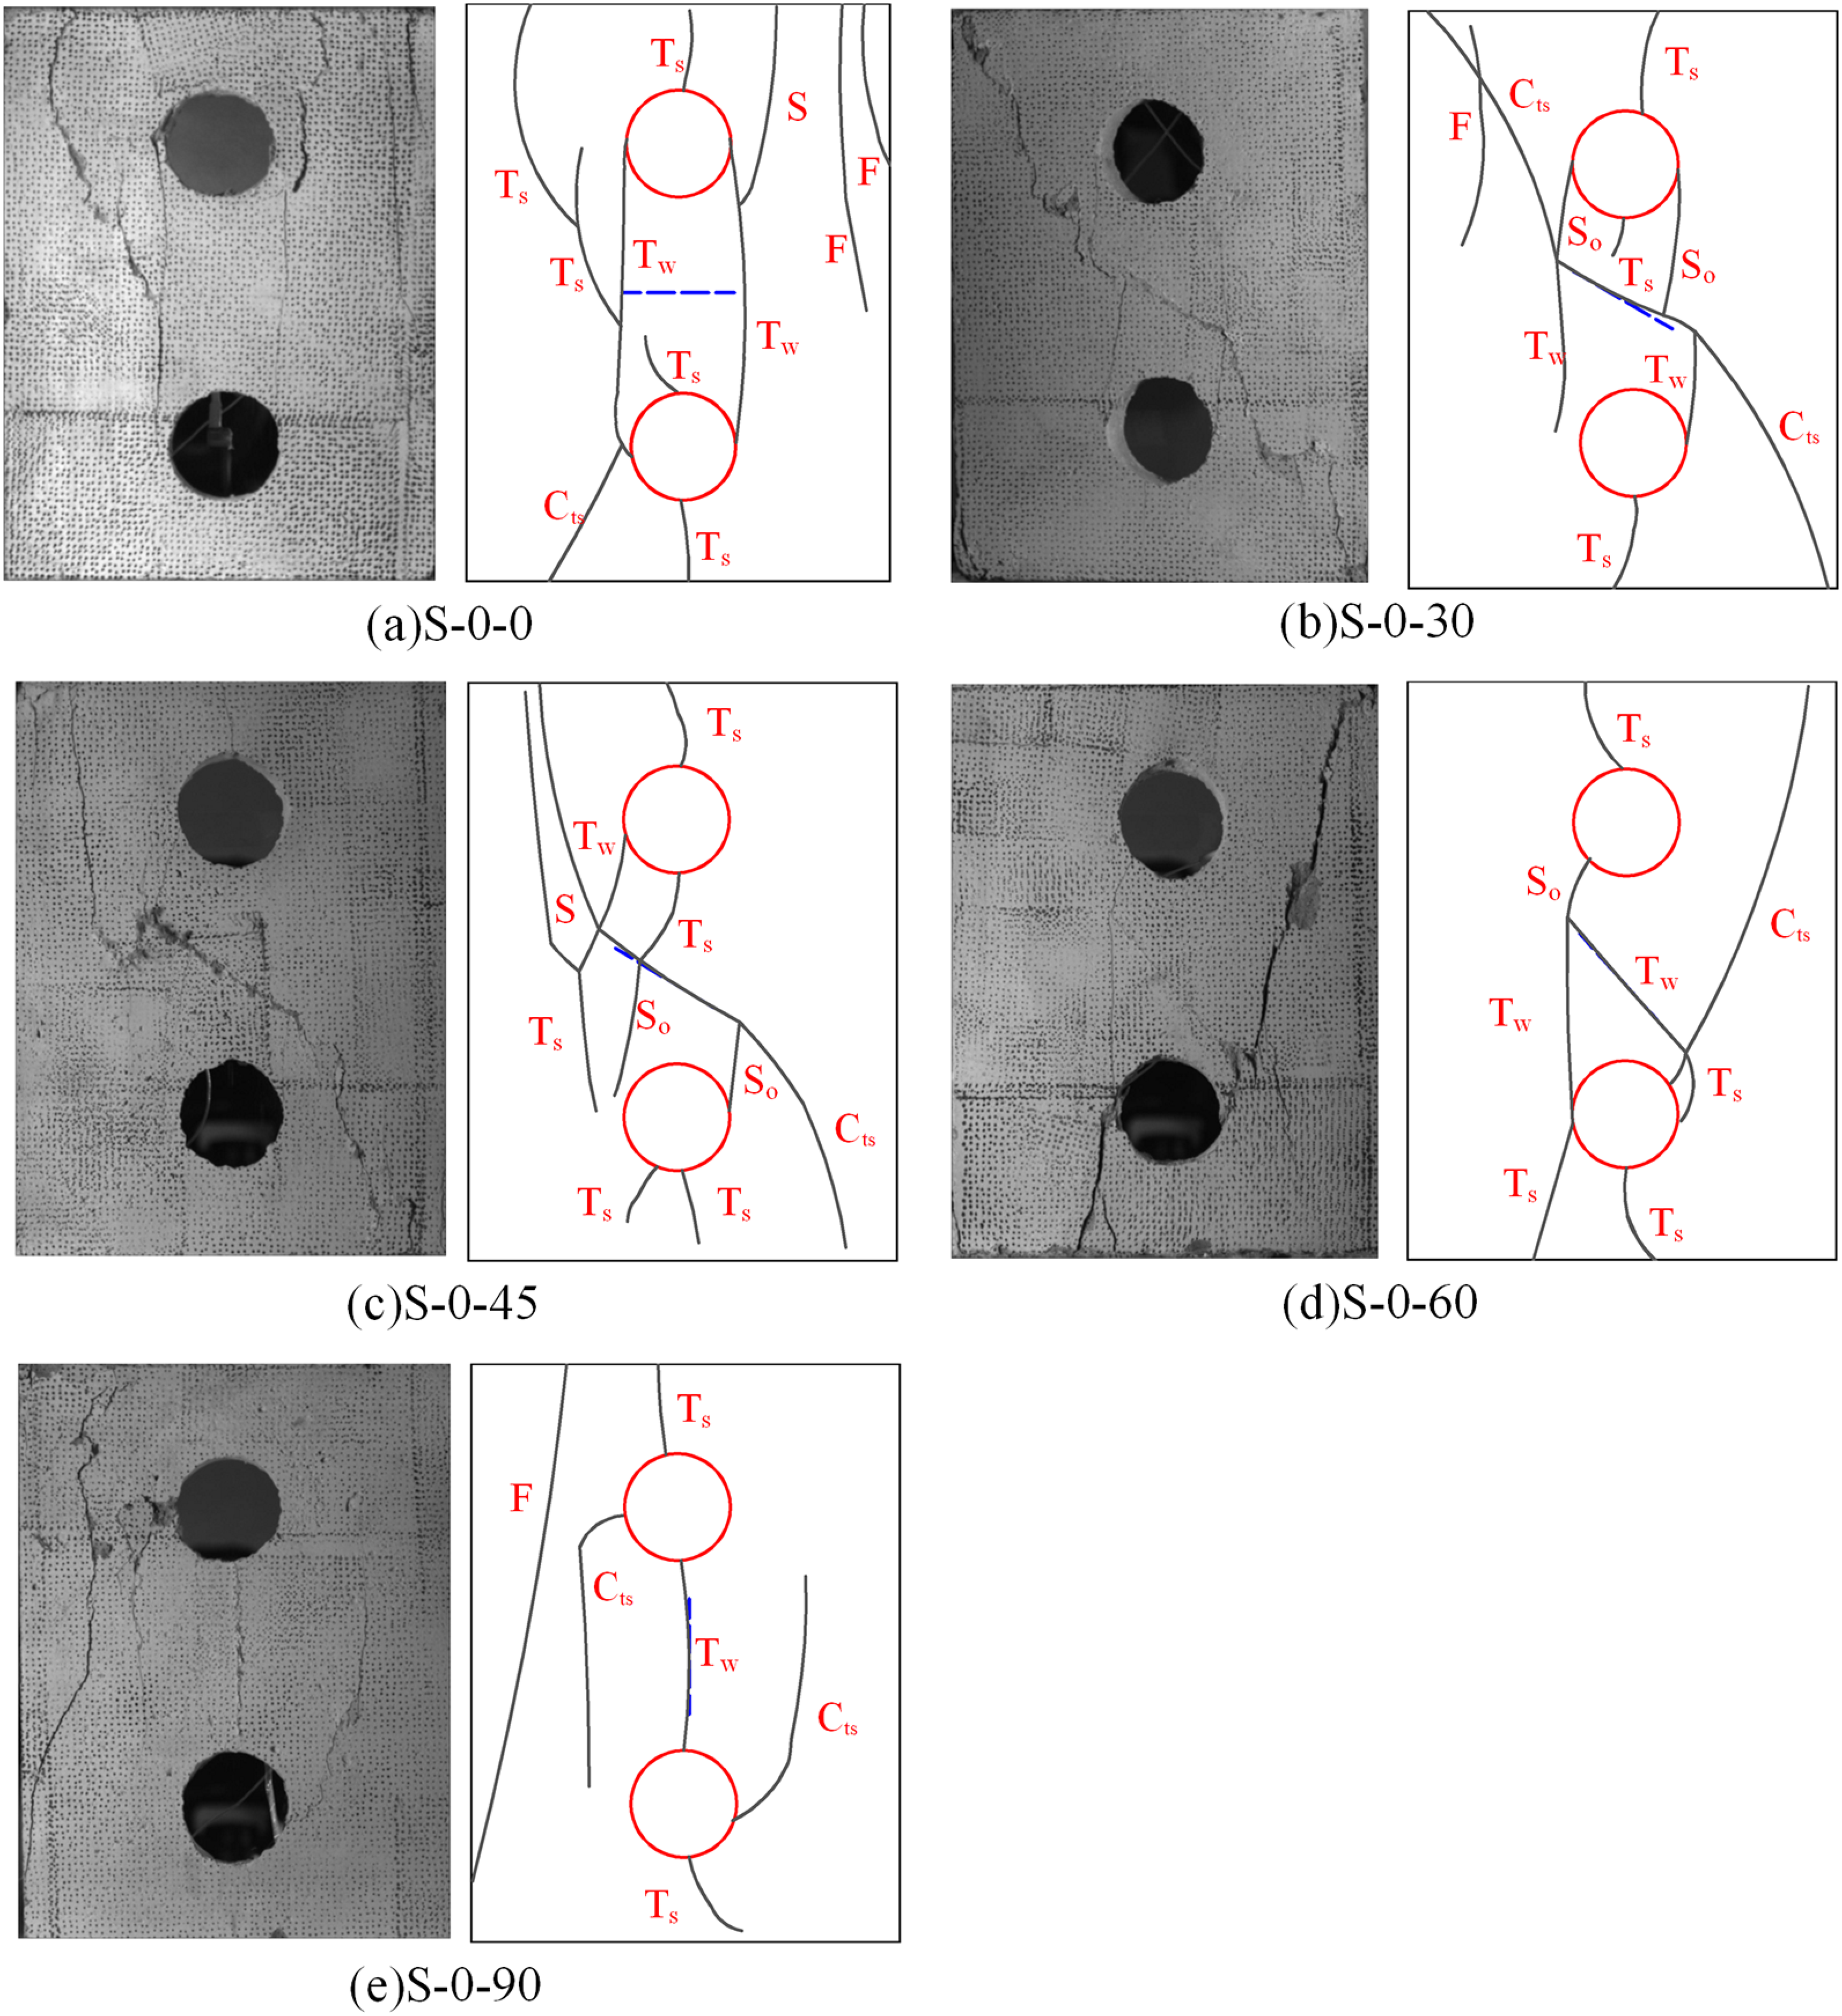
Crack failure diagrams for different joint dip angles.
Discussion
Analysis of the mechanical mechanism of crack development
To reveal the intrinsic mechanical mechanisms of crack initiation, propagation, and coalescence in the surrounding rock of upper and lower parallel underground tunnels, this section establishes calculation models for the stress field around single-hole and double-hole tunnels based on linear elastic theory and analytical methods. This approach clarifies the quantitative relationship between stress distribution features and crack evolution patterns, thereby providing a theoretical basis for the stability control of underground tunnels.
Analytical solution of the stress field around a single circular tunnel
Under uniaxial compression, the stress distribution around a circular hole can be accurately described by the Kirsch solution in polar coordinates (Wang et al., 2023b). Assuming the specimen is subjected to an axial uniaxial compressive stress P, a polar coordinate system 


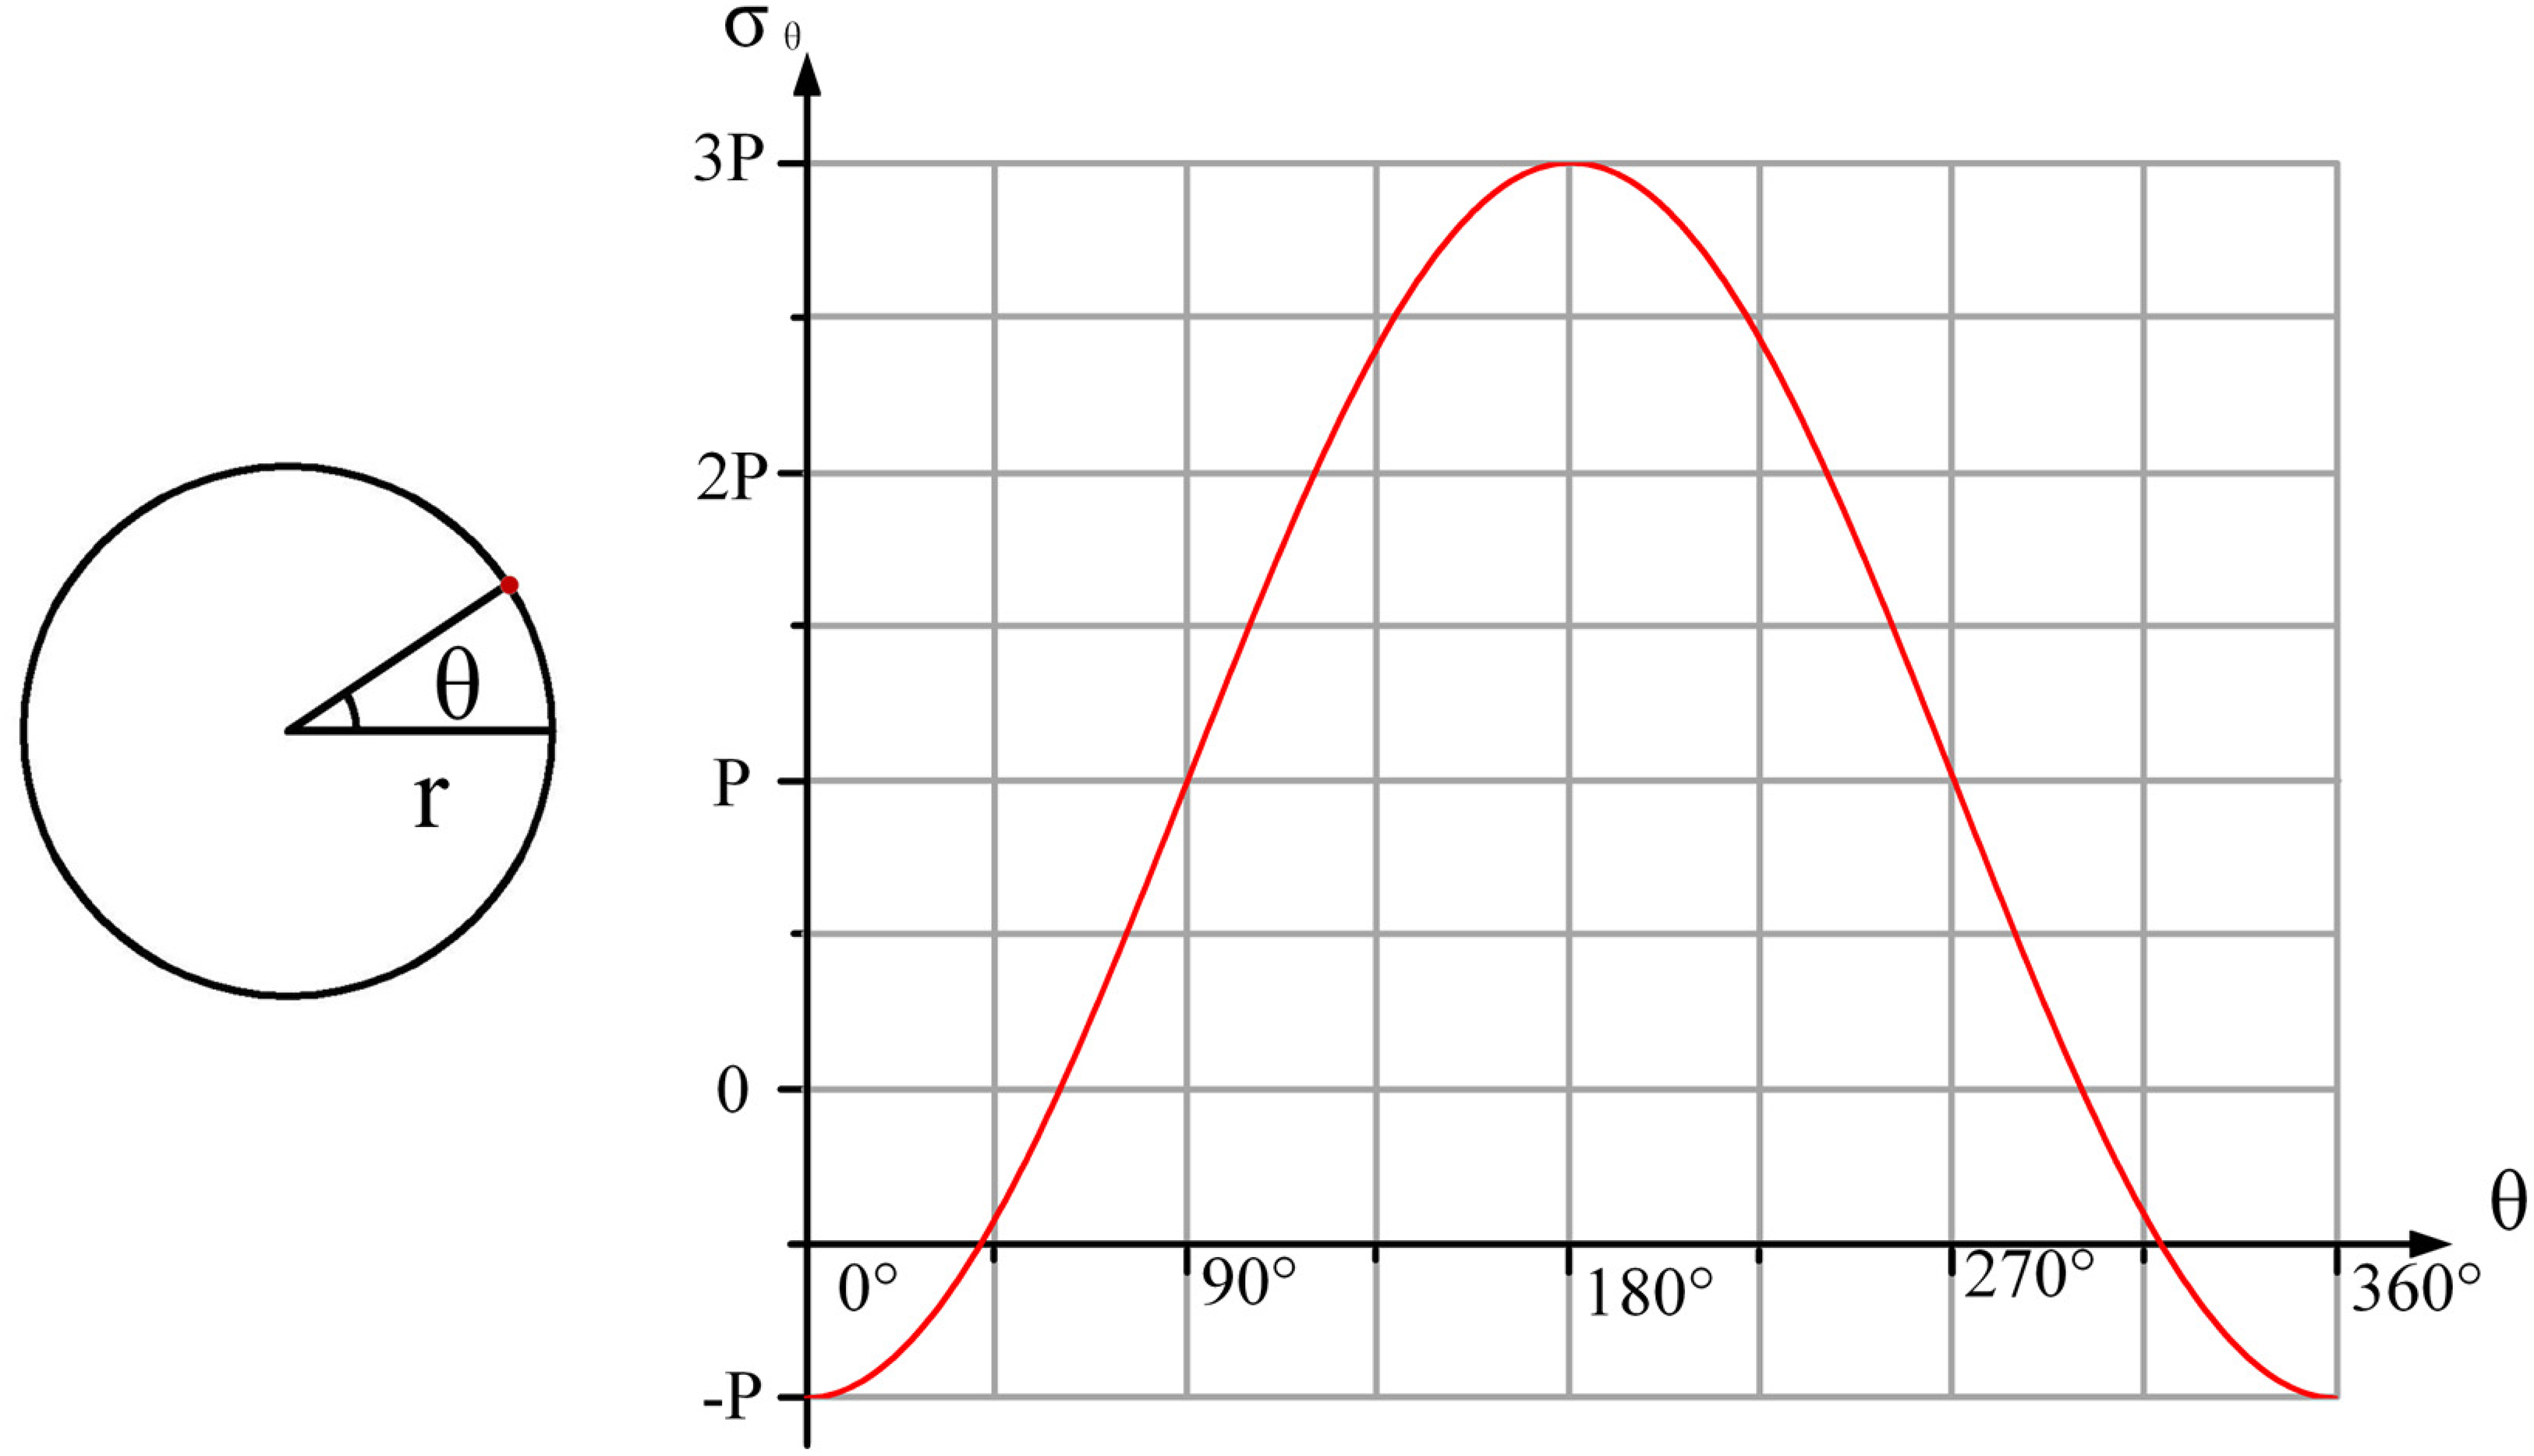
Stress state at the edge of a single hole.
Stress field superposition effect of double parallel tunnels
The stress field of upper and lower parallel tunnels is formed by the superposition of the stress fields of two single tunnels. However, the superposition pattern is controlled by the relative magnitude of the center-to-center distance d (between the two holes) and the tunnel radius r, thus this superposition pattern requires discussion under two scenarios.
When the center distance between the two tunnels is much larger than the tunnel diameter (
Coordinate systems are established as follows. First, the center of the upper hole is taken as the origin 

Under this condition, the stress components at any point around the double holes within the rock mass are equal to the algebraic sum of the corresponding individual stress components contributed by the two single holes.


When the center-to-center distance of the two holes is close to the tunnel diameter, the interaction between the two tunnel stress fields is strong, and an exact solution must be derived using the complex variable function method. Based on the complex potential theory of elasticity (Zhang et al., 2009; Zhang and Wong, 2013), let the complex plane be 

where


where
Numerical simulation of the double-hole stress field and engineering verification
To reveal the regulatory mechanisms of horizontal spacing and joint dip angle on stress distribution in the surrounding rock of double parallel tunnels from the perspective of mechanical nature, this study established a two-dimensional elastic-plastic finite element model based on continuum elastoplastic theory using COMSOL Multiphysics. Systematic numerical simulations were conducted to analyze the stress response of jointed and nonjointed rock-like specimens under a 1 MPa uniaxial compression load (Wang et al., 2023b).
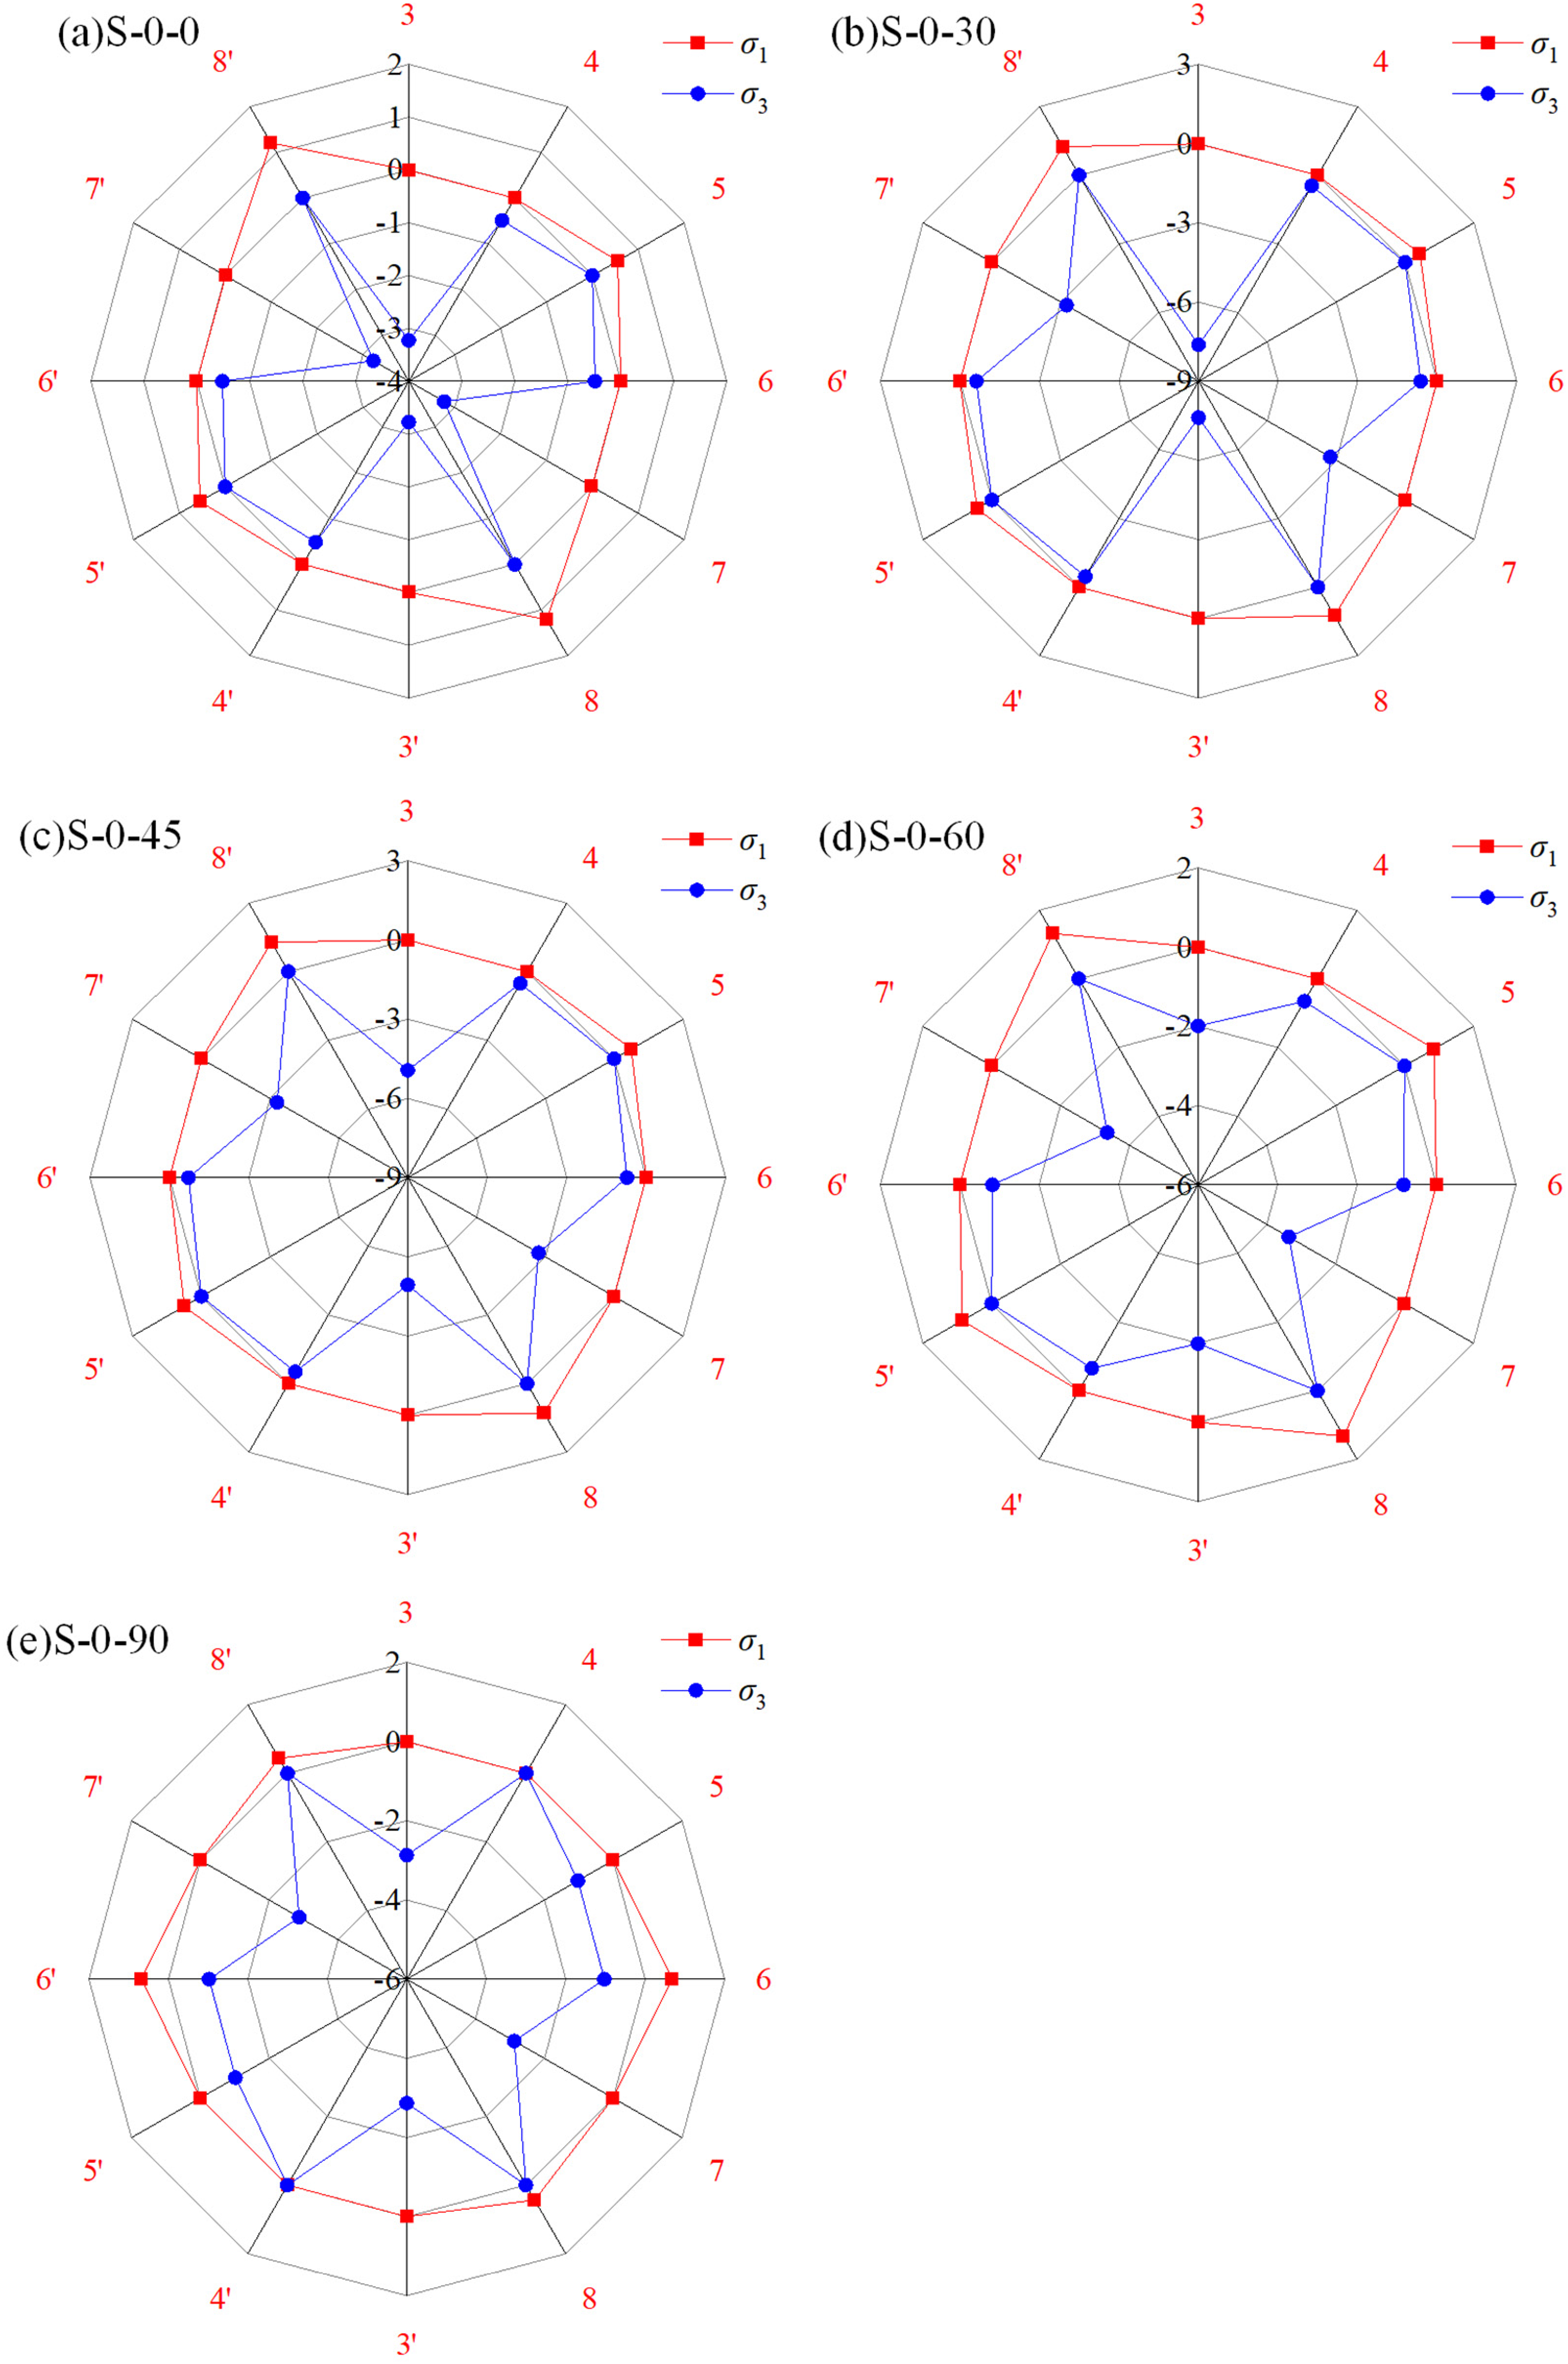
The model adopted the plane strain assumption and coupled the maximum tensile stress criterion with the Mohr–Coulomb criterion as the yield criterion, and this combination accurately reflects the elastoplastic behavior and failure characteristics of rock masses under actual stress states. The model parameters were strictly calibrated based on the mechanical properties of the rock-like material presented in the “Sample preparation” section (including elastic modulus, Poisson's ratio, cohesion, and internal friction angle), and this calibration process ensured comparability between numerical results and experimental data. To accurately capture the stress evolution behavior in key areas, eight stress monitoring points were placed around the tip of the joint and the double holes (locations detailed in Figure 22). By extracting the maximum principal stress factor (
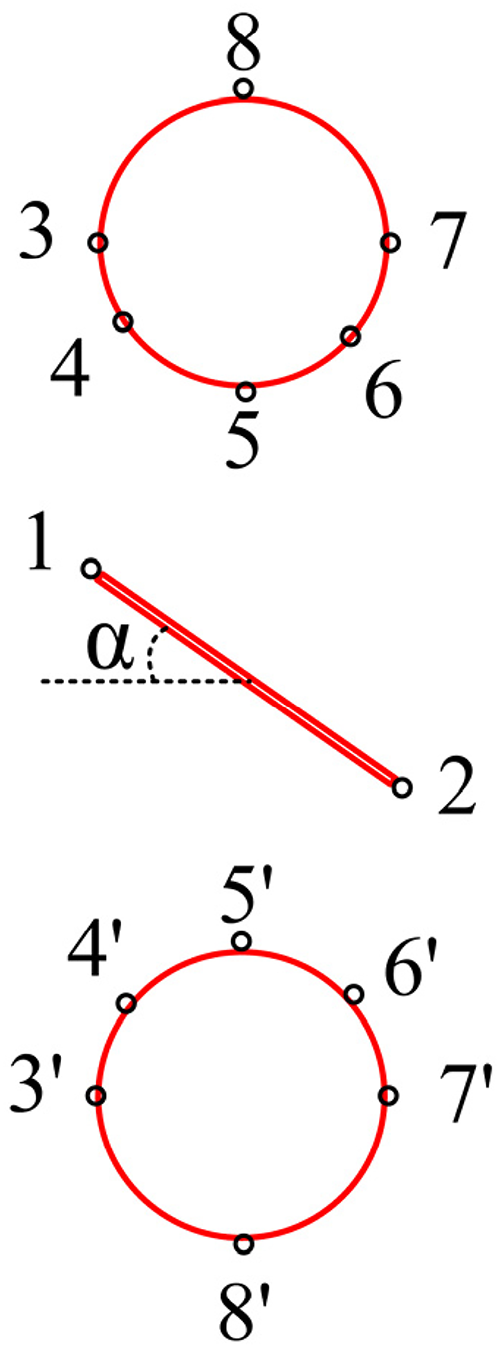
Layout of monitoring points in the specimen.
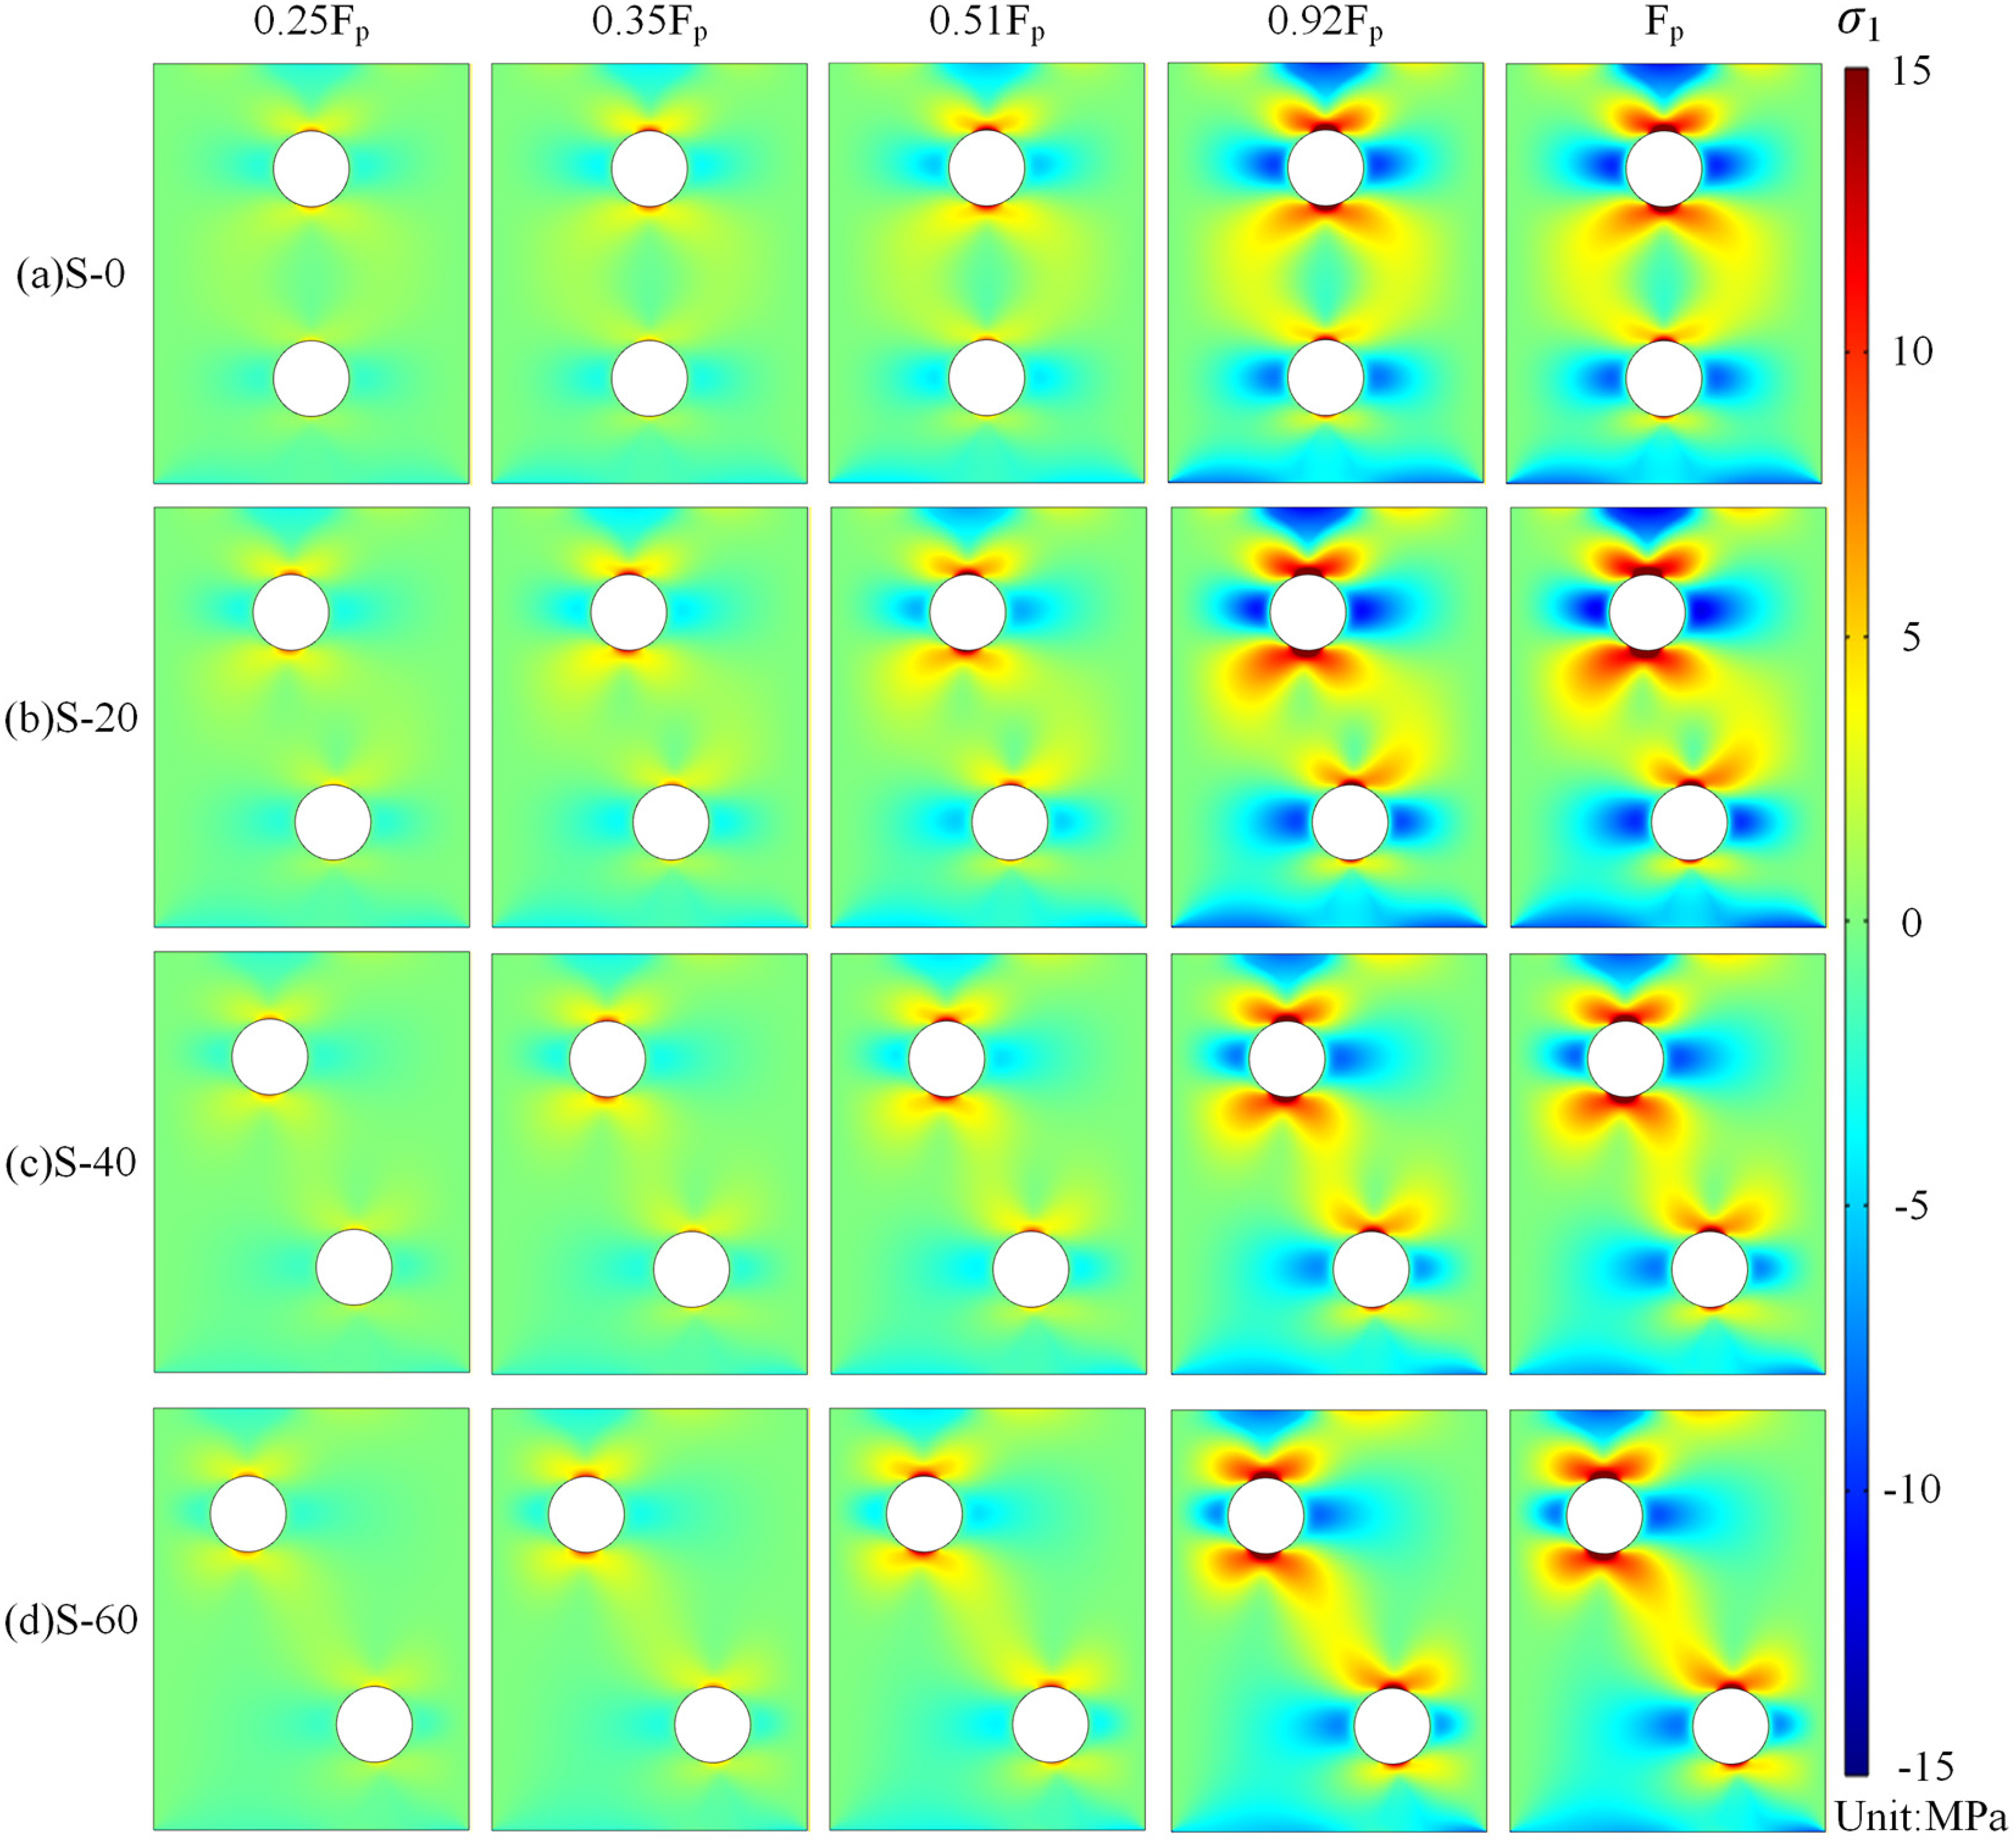
The simulation results indicate that horizontal spacing significantly regulates the stress distribution between the double holes (Figure 23). Under nonjointed conditions, the stress fields of specimens with different horizontal spacings exhibit significant differences, as detailed below. For the S-0 specimen, the stress superposition effect between the double holes is pronounced, with
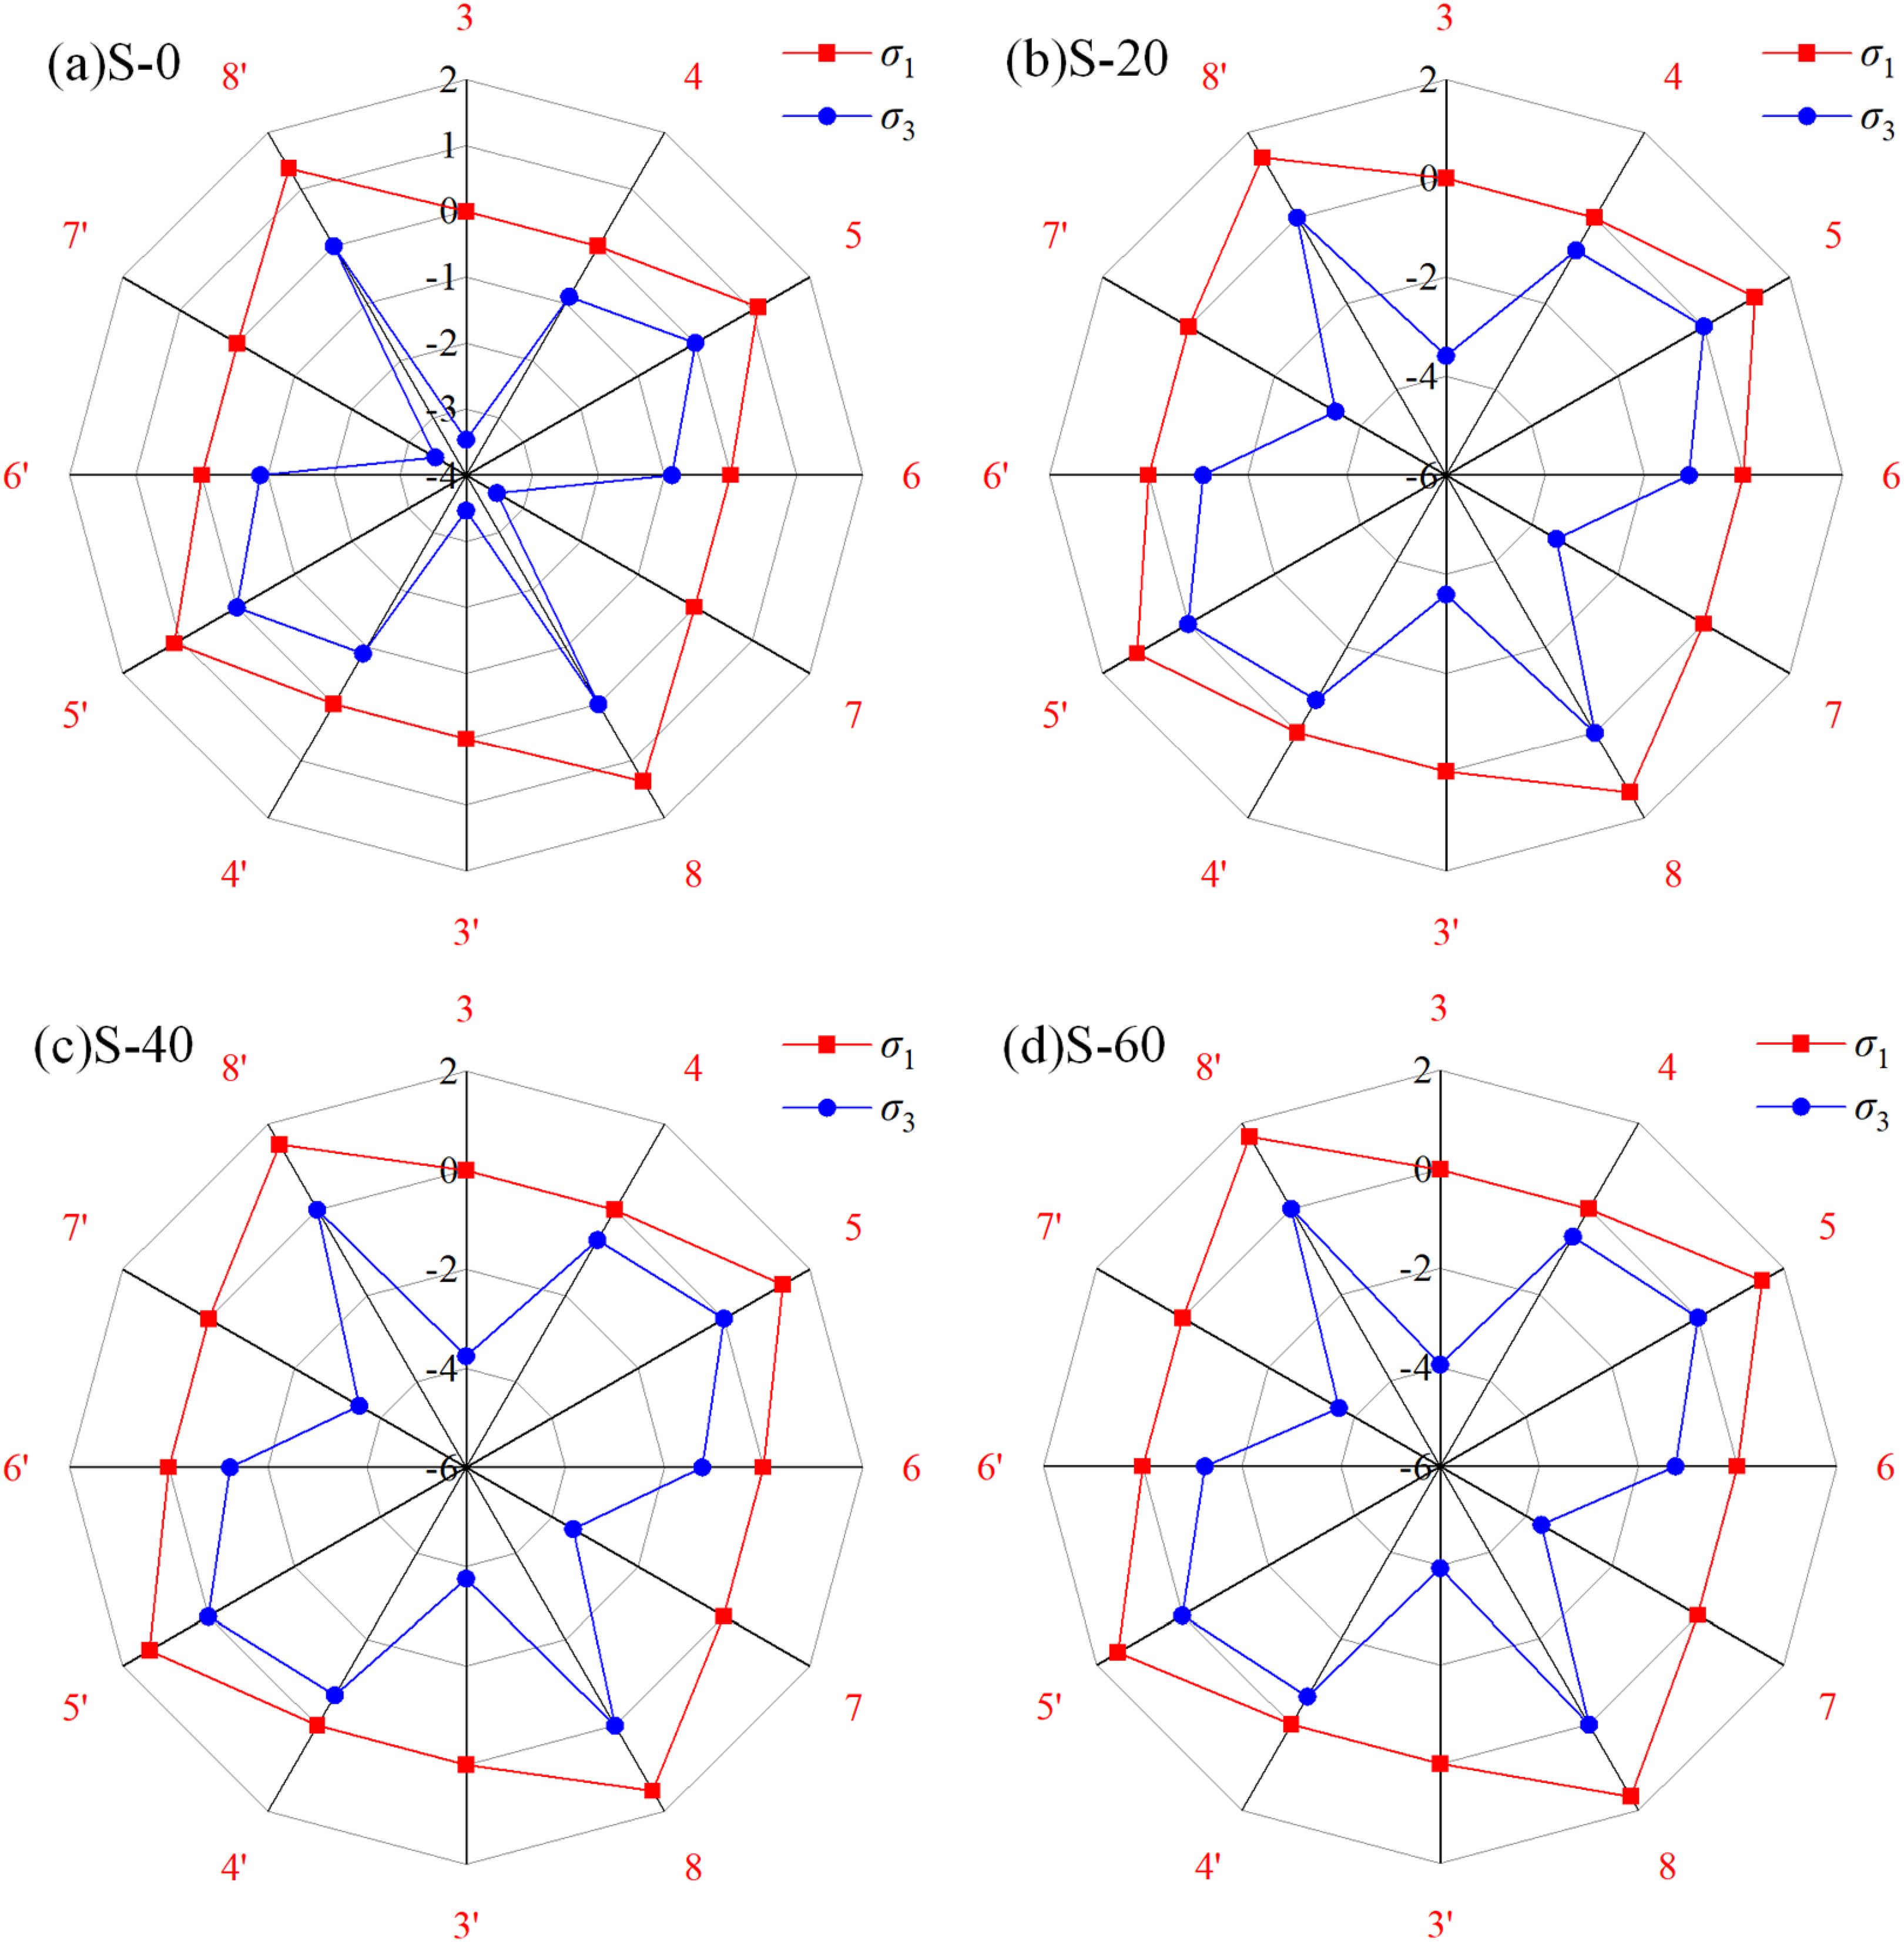
Distribution of principal stress factors around the two holes for specimens with different horizontal spacings.
In jointed specimens, joint dip angle significantly regulates the stress field by altering stress transfer paths (Figure 24). Compared with nonjointed specimens, jointed specimens (with pre-existing joints) exhibit more complex stress concentration patterns. For example, the maximum principal stress distribution of the S-0-0 specimen is similar to that of the nonjointed S-0 specimen (Figure 23(a)). This indicates that the horizontal joint exerts a relatively local influence on the overall stress distribution and is less likely to induce directed crack propagation paths. In contrast, in the S-0-60 specimen, stress concentration at the joint tip is pronounced, and
Distribution of principal stress factors around the two holes for specimens with different joint dip angles.
Based on the analysis of principal stress evolution characteristics at typical monitoring points around holes and joints as shown in Figure 25, this study clarifies the modulation effect and underlying mechanism of joint dip angle on the stress state and bearing characteristics of rock specimens. In comparison with specimens in other dip angle groups, the S-0-45 specimen in the 45° dip angle group exhibits a more homogeneous spatial distribution of the maximum and minimum principal stresses. The degree of tensile stress concentration at the top and bottom of the hole wall increases slightly compared with specimens in the 0° to 30° dip angle groups. The compressive-shear stress along the side of the hole wall is maintained at a moderate level without excessive stress concentration. These results indicate that a joint dip angle of 45° can transform the local stress state around the double-hole system from the tension-dominated mode corresponding to 0° to 30° dip angles and the shear-dominated mode corresponding to 60° to 90° dip angles into an optimal compression-shear coupling state. This transformation fundamentally alters the fracture evolution characteristics and propagation pattern at the defect tip.
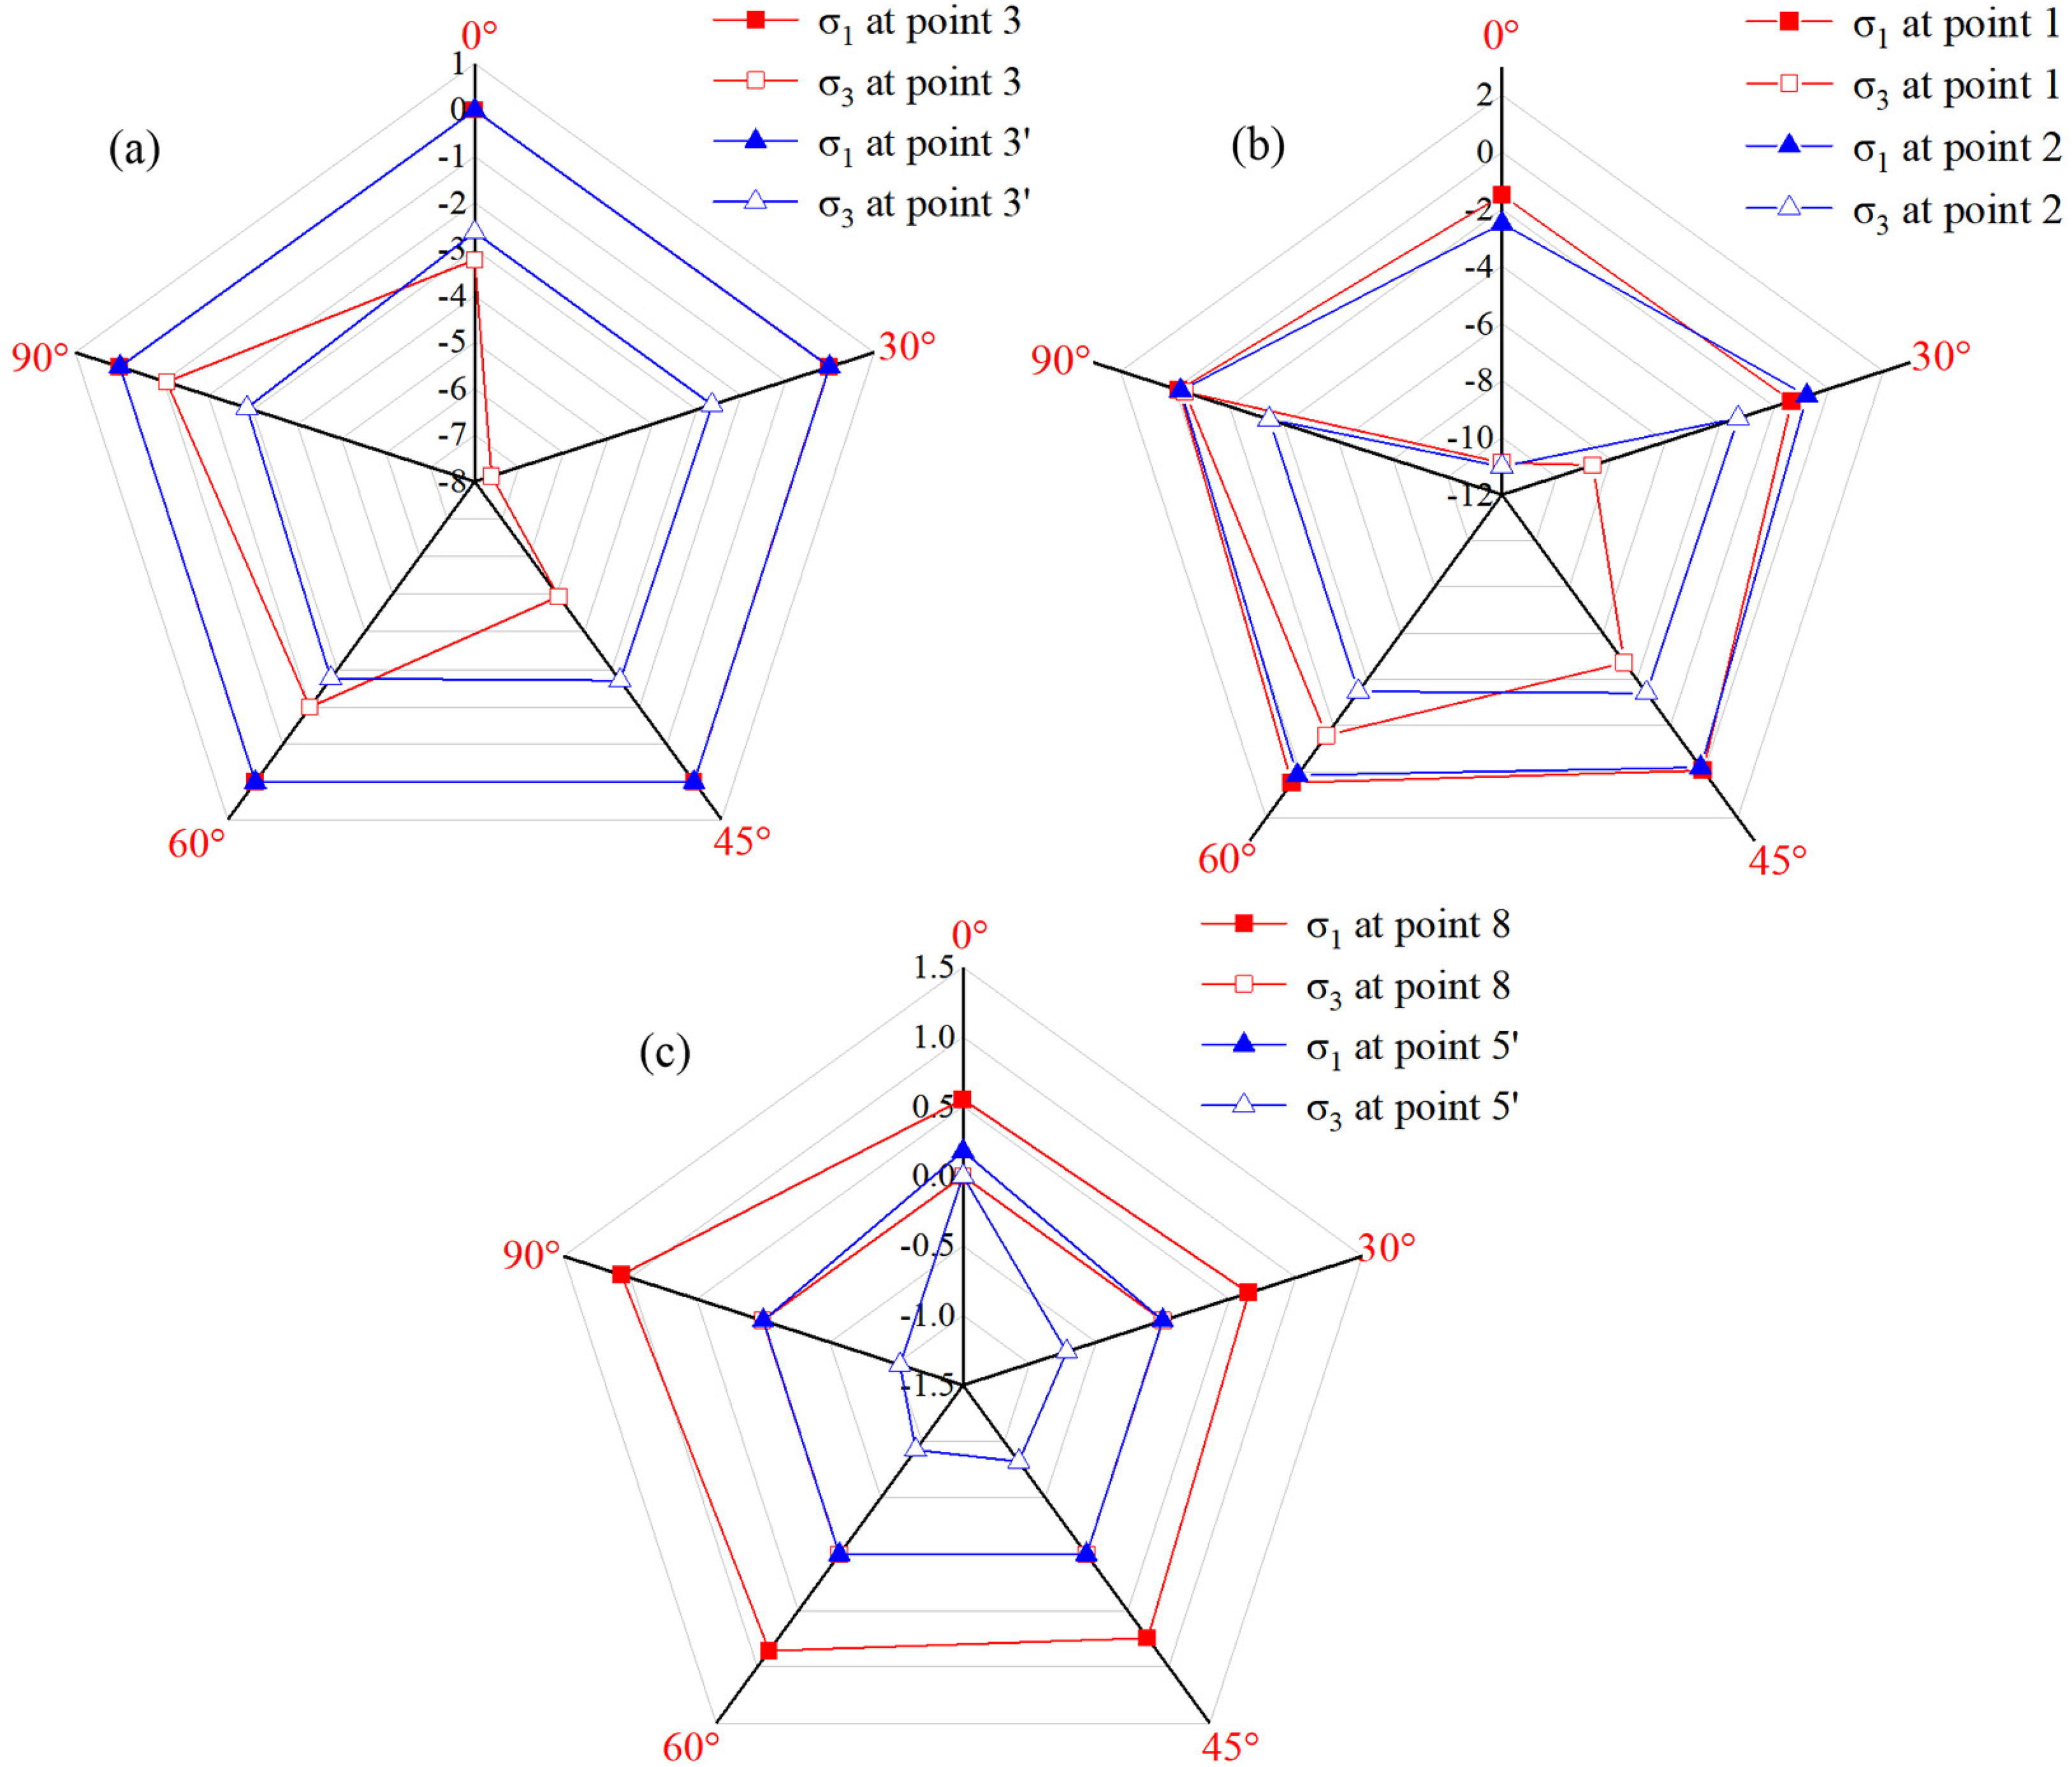
Principal stress factors of typical positions around holes and joints of different specimens. (a) 3′ and 3′ principal stress factors, (b) 1′ and 2′ principal stress factors, and (c) 8′ and 5′ principal stress factors.
From a fracture mechanics perspective, this stress state plays a crucial role in controlling crack propagation. At small inclination angles (0°–30°), tensile stress dominates the stress field around the hole, leading to a relatively high level of the mode I stress intensity factor (KI) and thus facilitating the rapid initiation and unstable propagation of tensile wing cracks. This phenomenon is consistent with classical rock fracture mechanics theory, where tensile stress concentrates at the defect tip to induce wing crack formation, and such cracks propagate along the direction of the maximum principal stress. In contrast, at large inclination angles (60°–90°), stress tends to concentrate along the joint surfaces, which not only facilitates shear localization but also accelerates crack coalescence between defects and structural surfaces (Qin et al., 2023). However, when the inclination angle is about 45°, the crack tip will produce mode I stress intensity factor (KI) and mode II stress intensity factor (KⅡ), and finally form a mixed-mode fracture condition. Under such conditions, crack propagation must satisfy both tensile and shear failure criteria, which not only increases the energy required for crack propagation but also inhibits the rapid crack propagation (Yao et al., 2022).
This working mechanism can reasonably explain the enhanced peak strength of the S-0-45 specimen relative to other test groups. The corresponding inference aligns well with experimental observations from prior cross-section analysis, as evidenced by two key findings. AE monitoring captures a higher proportion of mixed-mode cracks, while DIC measurements reveal distinct progressive strain localization characteristics. Cracks within the specimen propagate predominantly in a diffuse and stable manner rather than forming a through-going dominant tensile fracture zone. Lin et al. (2020) observed the same mixed-mode fracture features and strength enhancement effect associated with intermediate-angle joints in their investigation of jointed rock specimens containing pre-existing holes or fissures. Overall, the results of this study demonstrate that a joint angle of approximately 45° can establish a favorable compression-shear coupled loading configuration. This configuration effectively suppresses stress concentration and thereby enhances the bearing capacity of rock structures.
The numerical simulations in the present study reveal the regulatory effects of horizontal spacing and joint dip angle on stress distribution, which are consistent with field observations in practical tunnel engineering projects. For instance, in a cross-river twin-tunnel project, Wang et al. (2024b) found that the excavation of the second tunnel significantly enhanced the lining response of the first tunnel, indicating that excessively small spacing between the two tunnels intensifies their mechanical interaction. Furthermore, Yang et al. (2025b) demonstrated through monitoring data that adopting isolation barriers can effectively control pier displacements, highlighting the necessity of implementing structural protective measures when tunnel spacing is limited. These case studies provide practical verification for the crack propagation mechanisms and stress concentration phenomena identified in the present study.
It should be noted that the spacing values obtained in the present laboratory study (20–40 mm) are specific to the geometric scale of the rock-like specimens, so size-effect considerations are necessary when extrapolating these results to engineering-scale tunnel systems (Chu et al., 2007). In the experiments, the hole radius was 36 mm, and the optimal horizontal spacing range of 20 to 40 mm corresponds to approximately 0.28 to 0.56 times the tunnel radius or approximately 0.14 to 0.28 times the tunnel diameter. This indicates that the mechanical advantage observed in the laboratory is fundamentally governed by the dimensionless spacing ratio between adjacent openings rather than the absolute spacing value itself (Ghorbani and Ajalloeian, 2019). This type of dimensionless analysis has been widely adopted in studies on interacting tunnels, where the spacing-to-diameter ratio is regarded as a key parameter governing stress interactions and stability (Zheng et al., 2022). When applied to actual tunnel engineering where tunnel diameters typically range from several meters to over 10 m, maintaining a similar geometric proportion between tunnel spacing and tunnel diameter can help replicate the beneficial low-stress bridge effect identified in the experiments (Wu et al., 2025). Therefore, the laboratory-derived optimal spacing range should be interpreted as a scaled geometric relationship rather than a direct engineering value. In practical design, an appropriate center-to-center spacing ratio that preserves this proportional relationship can mitigate stress superposition between adjacent tunnels and promote more uniform stress distribution within the intervening rock mass (Hasheminejad and Avazmohammadi, 2008). Previous analytical and numerical studies have similarly demonstrated that increasing the spacing ratio between adjacent tunnels significantly reduces interaction-induced stress concentration and deformation of the rock (Deng et al., 2024). Although the exact optimal value may vary with in situ stress conditions, rock mass quality, and excavation sequence, the results of this study suggest that maintaining a moderate spacing ratio is critical to suppressing stress concentration and enhancing the stability of the rock in parallel tunnel systems (Huang et al., 2025).
Numerical simulation of damage evolution and mechanism analysis
To investigate the damage development mechanism of rock-like specimens containing double holes from the perspective of damage mechanics and to validate the experimental findings, this study establishes an elastoplastic coupled continuous damage constitutive model within the COMSOL Multiphysics platform and performs a systematic time series comparative analysis between numerical simulation results and laboratory monitoring data (Yang et al., 2026). For brevity, only specimens with different spacing distances are considered. A unified time series benchmark is established using the normalized stress level 
where
The initial damage stage corresponds to a normalized stress level of
The stable damage development stage, representing the second stage of damage development, corresponds to a normalized stress level of
Stress distribution nephogram of COMSOL under different interval distance.
The instability damage development stage, which constitutes the third stage, corresponds to a normalized stress range of
Overall, the development of D reveals that the damage development of rock within a double-hole system is not merely the unidirectional accumulation of microcracks, but rather a multiscale progressive instability process driven by stress field reconstruction and defect interaction. The transition from diffuse damage to localized damage development and finally to through-going failure captures the inherent coupling mechanism among mechanical response, energy release, and structural degradation. These findings establish a comprehensive analytical framework for elucidating damage development in jointed rock masses with multiple openings and provide a theoretical basis for assessing rock stability.
Conclusions
By means of multiscale physical experiments and numerical simulations, this study systematically reveals the coupled regulatory effects of horizontal spacing and joint dip angle on the mechanical stability and failure mechanisms of the surrounding rock in upper and lower parallel underground tunnels, and the main conclusions are summarized below.
Horizontal spacing exerts a nonmonotonic effect on the strength and failure modes of specimens. As horizontal spacing increases, the peak stress of the specimens first increases and then decreases. When the spacing is in the range of 20 to 40 mm, a “low-stress bridge” effect forms between the double holes, and this effect leads to a more uniform stress distribution. Specimens within this optimal spacing range exhibit the highest overall bearing capacity and typical ductile failure characteristics. Conversely, both excessively large and small horizontal spacings intensify stress concentration, and this intensification results in reduced specimen strength and brittle failure. Joint dip angle significantly governs the crack propagation paths and failure mechanisms of specimens. When the joint dip angle is 45°, the specimen exhibits the strongest compression-shear coupling effect, and this compression-shear coupling effect corresponds to the highest peak stress and a significant increase in the proportion of mixed-mode cracks. For joint dip angles of 0° to 30°, shear failure dominates while for angles of 60° to 90°, tensile failure gradually dominates. This observation indicates that the joint dip angle governs the failure mode of rock masses by altering the stress transfer path. The AF-RA AE analysis method can effectively identify the evolution of crack types. A boundary line with a slope of 100 (i.e. AF/RA = 100) enables quantitative distinction between tensile, shear, and mixed-mode cracks. Experimental results show that increasing horizontal spacing promotes a transition in the dominant crack mechanism from tensile-dominated to shear-dominated. Variations in joint dip angle cause periodic fluctuations in the proportion of tensile cracks, which further verifies the dynamic regulatory effect of joint dip angle on crack types. Full-field strain analysis based on DIC and numerical simulations jointly reveal the synergistic evolution mechanism of mechanical stress and strain. High-strain concentration zones initially initiate around the holes’ peripheries and joint tips, then propagate and coalesce along the paths of least resistance. COMSOL-based numerical simulation results confirm that horizontal spacing modulates the degree of stress superposition between the double holes, while joint dip angle reconstructs the local stress distribution. Together, these two factors (horizontal spacing and joint dip angle) influence the development of strain concentration zones and the final failure patterns, providing a theoretical basis for the stability design of parallel underground tunnels.
Footnotes
Author contributions
Funding
The authors disclosed receipt of the following financial support for the research, authorship, and/or publication of this article: This work was supported by the National Natural Science Foundation of China (grant nos: 52474110 and 52304099), Open Fund of State Key Laboratory of Digital Intelligent Technology for Unmanned Coal Mining (grant no: SKLMRDPC23KF09), and the Outstanding Youth Science Foundation of Henan Province (grant no: 252300421196).
Declaration of conflicting interests
The authors declared no potential conflicts of interest with respect to the research, authorship, and/or publication of this article.
Data availability statement
The data will be made available upon reasonable request.