
Abstract
Bridges are exposed to structural damage under moving vehicle loads, posing potential threats to structural safety. To address the limitations of conventional mode-shape-based damage identification methods, which rely on baseline data and a large number of sensors, this article presents a novel approach based on response principal components under moving loads. Considering vehicle–bridge interaction, this study elucidates the composition of the response's principal components of damaged beams. Initially, the dynamic response of the beam is decomposed using the proper orthogonal decomposition, and the analytical expressions for the principal components of responses are derived. Then, damage identification is conducted, indicating that the principal components of the response for a damaged beam can be decomposed into modal components, dynamic components, and damage components. Moving average filtering is employed in the separation process, thereby extracting the damage component. Numerical simulations and experimental validations are subsequently conducted to assess algorithm performance. This study highlights the role of the damage component within principal components, providing new insights into their physical interpretation in structural damage identification.
Keywords
Introduction
Bridges play an essential role in guaranteeing the safety of public travel. Among them, small- and medium-span bridges are important in urban transportation systems, many of which have already been in service for several decades (Miyamoto et al., 2017, 2019). Considering long-term vehicle loading, environmental degradation, material aging, and occasional extreme events, bridges inevitably experience deterioration in structural performance and may suffer various structural damages (Figueiredo et al., 2025; Wang et al., 2025). If such damage remains undetected and not repaired in time, it might affect service life and even cause sudden failures. Thus, the establishment of effective structural health monitoring (SHM) systems is important (He et al., 2022).
Structural damage identification of real structures is usually challenging. Various methods based on natural frequencies (Xia and Hao, 2003), the modal damping (Curadelli et al., 2008), and mode shapes (Pandey et al., 1991) have been extensively investigated. Although natural frequencies are easy to measure, the frequency shifts caused by structural damages are often very small and insensitive to minor defects (Salawu, 1997). Damping parameters, while theoretically informative, are difficult to measure accurately in practice and susceptible to environmental interference (Cao et al., 2017). By contrast, mode shapes reflect structural spatial information and allow accurate damage localization. Consequently, mode-shape-based methods using modal curvature (Pooya and Massumi, 2021; Xu et al., 2017), modal flexibility (Jaishi and Ren, 2006; Le et al., 2020), and modal strain energy (Nick et al., 2021; Shi et al., 2000) have proven effective for damage detection.
Traditional mode-shape-based methods typically rely on comparing mode shape differences between damaged and undamaged structures. For example, Fang and Perera (2009) proposed power mode shapes based on the power spectral density and formulated metrics, such as modal curvature and power flexibility, for damage identification. Solís et al. (2013) employed a continuous wavelet transform to capture differences in mode shapes and combined them with frequency weighting to improve detection accuracy. O’Brien and Malekjafarian (2016) estimated mode shapes from vehicle-induced vibrations and used the squared difference of mode shapes before and after damage as an indicator. However, such approaches generally require either undamaged reference data or finite element models as baselines. In practice, particularly for small- and medium-span bridges that have been in service for decades, baseline information is often missing or incomplete, significantly restricting their applicability.
Another challenge arises from the need to deploy a densely distributed sensor network to obtain accurate mode shapes. Solís et al. (2013) introduced interpolation techniques to compensate for missing data when sensor numbers are limited. For long-span bridges, comprehensive monitoring systems are typically installed due to their strategic importance. For example, the Tsing Ma Bridge in Hong Kong is equipped with more than 280 sensors (Xia et al., 2013), and the Xihoumen Bridge's system includes nine data acquisition systems and 88 sensors (Ye et al., 2019). Such large-scale systems are prohibitively expensive to implement on every small- and medium-span bridge. Ideal sensor layouts are rarely achievable given the spatial constraints and the considerable number of bridge structures. Therefore, damage detection techniques using only limited sensors have attracted sufficient research attentions. Conventional approaches produce mode shape data with resolutions equal to the number of installed sensors, causing difficulty to record sufficient details when sensor is limited. By contrast, techniques capable of identifying dense mode shapes from limited sensor data provide a practical solution for SHM of small- and medium-span bridges.
Reducing the required sensors in bridge SHM has attracted sufficient research efforts in the previous decades. Yang et al. (2014, 2022) proposed the vehicle scanning method, which extracts bridge mode shapes from vehicle-induced vibrations for damage detection. To obtain high-resolution mode shapes for bridges under practical operating conditions, Demirlioglu and Erduran (2024) developed a reference-based component scaling approach using stationary and moving instrumented vehicles. However, vehicle-scanning-based approaches are generally sensitive to road surface roughness. Feng and Feng (2017) explored non-contact vision-based techniques to measure bridge displacements, from which mode shapes were derived, and curvature was used as the damage indicator. Dorn and Yang (2023) reconstructed high-spatial-resolution continuous mode shapes through modal identification, using full-field dense optical sampling and video motion magnification to obtain globally dense structural vibration responses. Although this optical-based method allows dense spatial sampling, it suffers from high sensitivity to environmental conditions such as the lighting.
Moreover, He et al. (2024) achieved full-field response reconstruction and high-resolution mode shape identification of beam-like bridges by constructing a general basis matrix based on the Fourier series. However, due to the reduced accuracy of compressive sensing in reconstructing high-frequency components, this method mainly focuses on identifying the first two modes in practical applications. Moving vehicle loads are the most common excitations experienced by bridges in service. Therefore, methods that adopt moving-load-induced responses facilitate real-world engineering practice. Nie et al. (2022) proposed a novel approach demonstrating that the orthogonal decomposition of displacement responses under moving loads naturally yields principal components that include mode shape information. This result indicates that high-resolution mode shapes can be reconstructed using only a few sensors.
The vibration characteristics of bridges under moving loads have long been a topic of considerable research interest. González and Hester (2013) analyzed the acceleration responses of beam bridges under moving loads and identified damage by isolating the damage-sensitive components. He and Zhu (2016) derived displacement solutions of damaged beams under moving loads and demonstrated that moving-frequency components are more suitable for localization. Lu et al. (2025) found that when vehicles pass over damaged regions, the bridge's low-frequency accelerations exhibit abnormal “bulges”, which can be detected through low-pass filtering. Nie et al. (2024, 2025) further utilized high-resolution mode shapes, combined with Hilbert transform and continuous wavelet transforms, to extract damage features for localization. However, they did not conduct a detailed analysis of the intrinsic composition of the response principal components.
Given that structural stiffness changes caused by damage induce local irregularities in mode shapes, this feature has become another important aspect for damage detection. Wang and Qiao (2008) proposed a baseline-free method by decomposing mode shapes into a “smooth component” (approximating the undamaged state) and an “irregular component” (capturing local stiffness changes). The latter, extracted via filtering, provides direct damage information without requiring baseline data. Similarly, Mao (2016) applied high-pass filtering to isolate damage-induced irregularities for localization. More recently, Pooya and Massumi (2022) developed a damage index based on the ratio difference between pseudo modal strain energy and pseudo modal kinetic energy, enabling damage identification in beam-like structures using only the modal displacement data of the damaged state. Yang et al. (2024) proposed a baseline-free structural damage localization method under unknown seismic excitations. In their method, the structural strain mode shape is first identified using strain power spectrum density transmissibility, and the wavelet transform is then applied to amplify the singularity of the strain mode shape at damage locations. However, these methods generally require dense sensor layouts to ensure mode shape accuracy and often rely on interpolation to fill in missing data, thereby increasing complexity and cost.
Although many studies regarding bridge damage identification have been conducted, the SHM of small- and medium-span bridges still faces several challenges: (1) Most existing approaches focus solely on detecting singularities in vibration signals without sufficient theoretical derivations. The physical interpretation of damage identification based on response principal components has not been fully clarified. (2) The local damage to the bridge is difficult to identify from sparse mode shapes. Methods relying on interpolations, expansion techniques, or finite element baselines are often impractical for operational structures. (3) The deployment of dense sensor networks is neither economical nor feasible in bridges, and the potential for damage detection using limited sensor information remains insufficiently explored. To address these limitations, a novel baseline-free bridge SHM technique is proposed, the major contributions are summarized as follows: (1) For the first time, the physical interpretation of response principal components of bridges under moving loads is clarified. Damage analysis is incorporated to explore the intrinsic composition of these components. (2) A novel filtering-based damage detection method is developed. Specifically, a moving average filtering technique is used to extract the damage component from the response principal components, effectively highlighting damage features without requiring baseline information. (3) The proposed method is robust under limited sensors with measurement noises, facilitating potential applications in real structures.
The remainder of this article is organized as follows: the Methodology section establishes the theoretical framework of displacement principal components under vehicle–bridge interaction. The Numerical validation section numerically investigates different damage scenarios for a beam bridge model. The Experimental verification section presents laboratory experiments on a simply supported beam to further verify the proposed method under realistic conditions. Finally, the Conclusions section summarizes the findings of this study.
Methodology
Vibration theory of a beam under a moving load
Vibration response of an undamaged beam
Figure 1 illustrates a simply supported beam with a total span of l that is subjected to a moving concentrated load. The load f travels along the beam at a constant velocity v. The vibration caused by this moving load can be described by the following governing equation of motion:


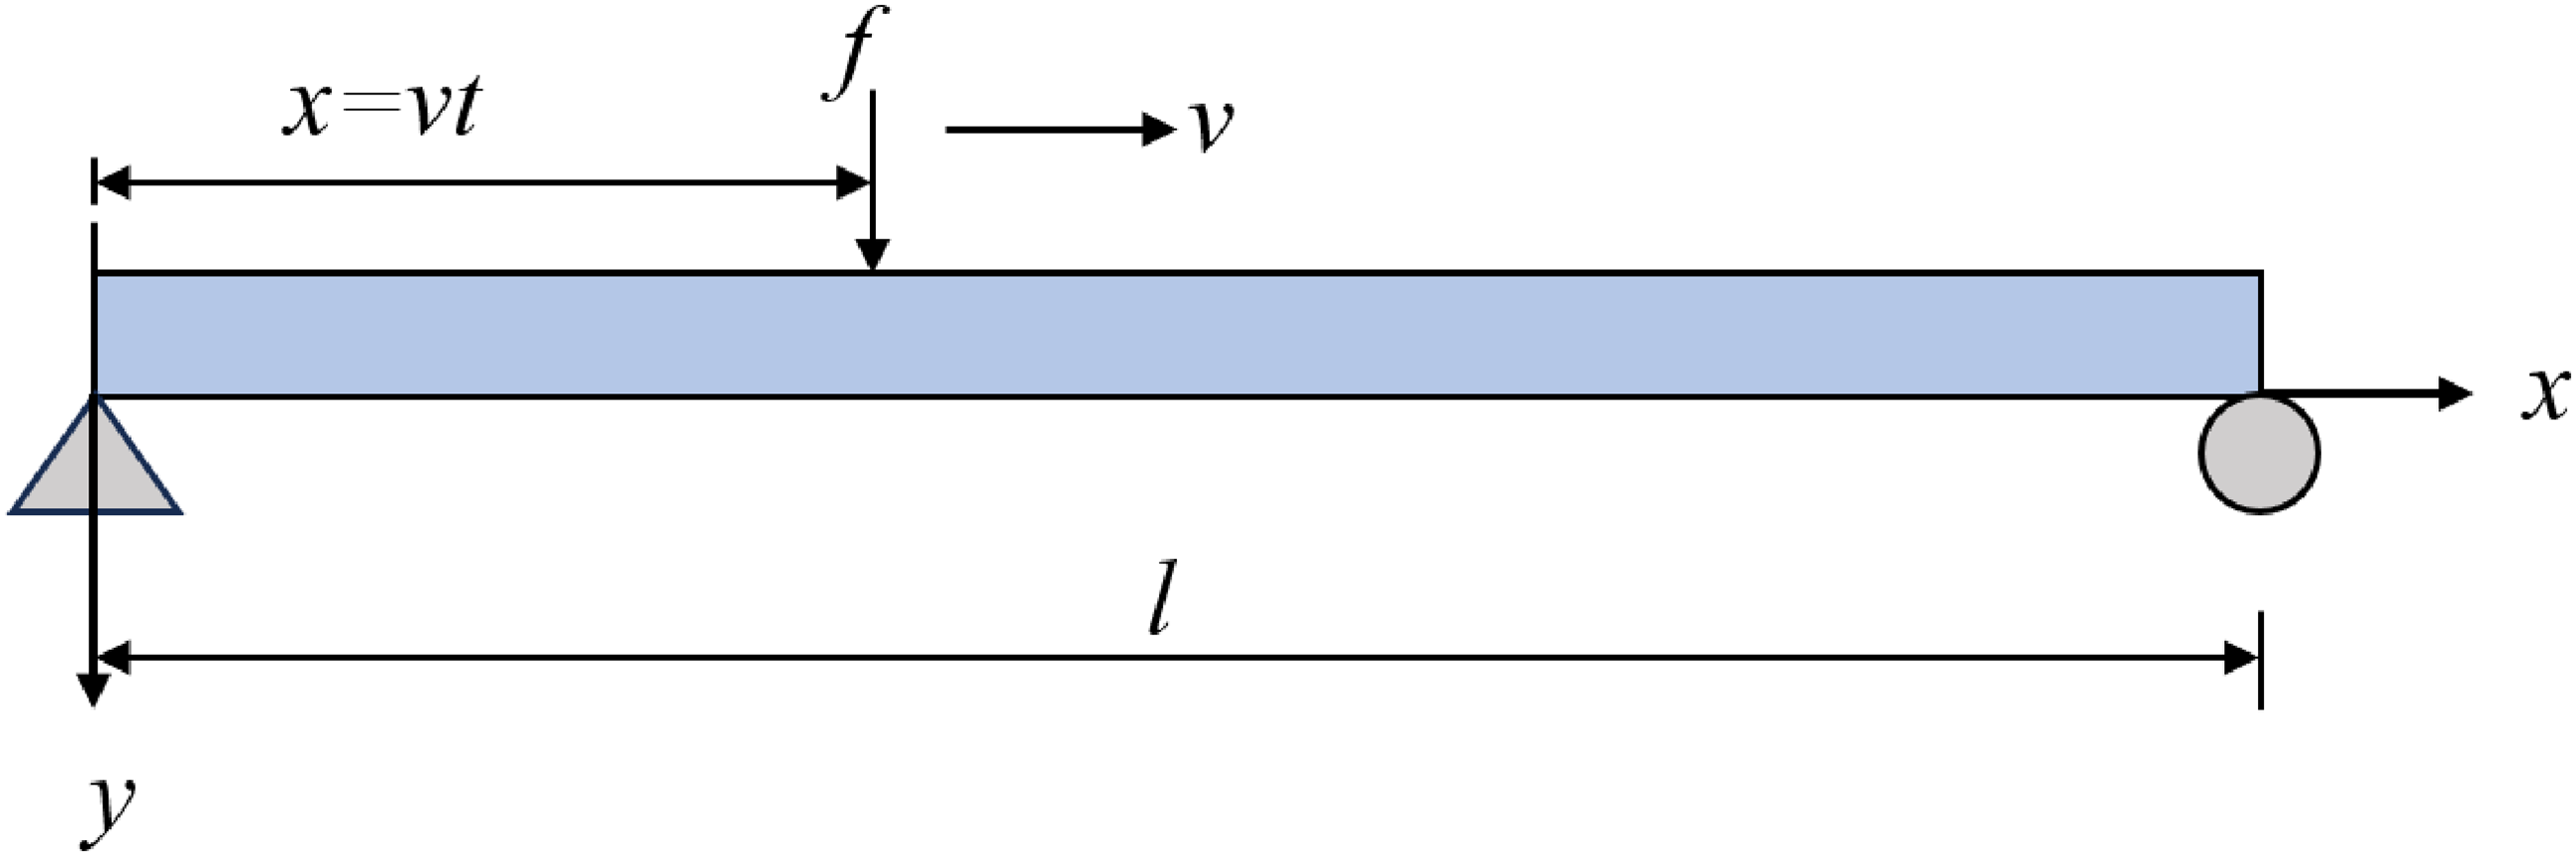
Schematic diagram of a simply supported beam subjected to a moving load.
Equation (3) indicates that the beam's dynamic response is composed of two distinct frequency components: (1) a high-frequency component associated with the beam's natural vibration modes, and (2) a low-frequency component dominated by the excitation frequency of the moving load. In general, the natural frequencies of the beam are considerably higher than those induced by the moving load (Paultre et al., 1992). As advised,
Vibration response of a damaged beam
In bridge damage identification, local stiffness reduction is commonly adopted to represent structural deterioration (Zhou et al., 2024). Damages are usually observed as a flexural stiffness degradation, while the mass distribution remain unchanged. This stiffness degradation introduces slight perturbations in the natural frequencies and mode shapes of the structure. Consequently, the

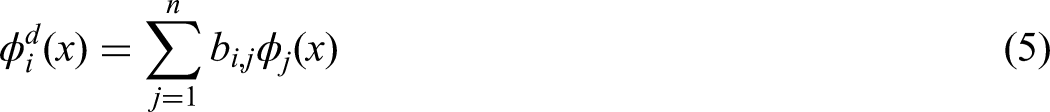
Equation (5) indicates that the presence of damage causes modal coupling, implying that the
By substituting equation (5) into equation (3a), the undamped displacement response of the damaged beam structure can be derived as follows:

As shown in equations (3a) and (6), damage affects the natural frequencies and mode shapes, indicating that the dynamic response contains identifiable structural damage features.
Component analysis of principal components
Proper orthogonal decomposition (POD) has been widely adopted in modal analysis (Feeny and Kappagantu, 1998; Ma et al., 2019). Assuming s sensors are evenly distributed along the beam, and k displacement signals are recorded, the collected data can be organized into a matrix as follows:

The projection of the original data onto the eigenvectors represents the principal components, which can be expressed as follows:

According to Nie et al. (2022), the eigenvector matrix was assumed to be equivalent to the mode shape matrix. Consequently, the principal components physically represent the modal coordinates, that is,


Using the orthogonality condition of mode shapes,

This result demonstrates that the mode shape vector

Given that eigenvectors are commonly normalized in eigenvalue decomposition, that is,
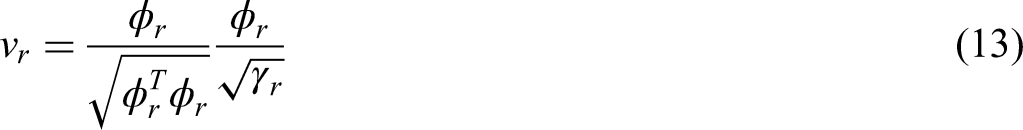

Equation (14) indicates that, under evenly distributed sensors,

Finally, the principal component matrix is expressed as follows:
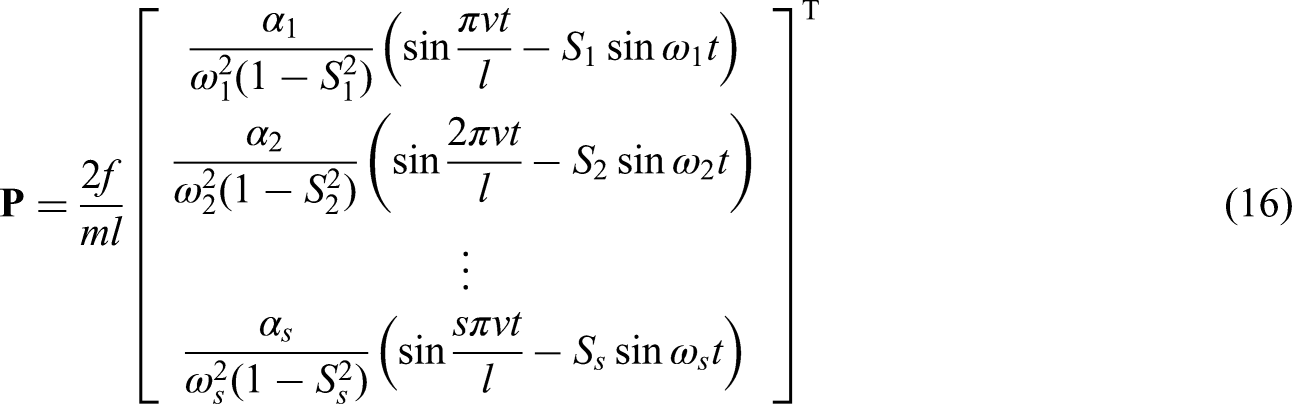
Equation (16) indicates that principal components are essentially the decoupled representations of modal coordinates. They contain two distinct frequency components: (1) low-frequency components, governed primarily by the moving load, which carry modal information with a spatial resolution determined by the sampling frequency; (2) high-frequency components, dominated by the structural natural frequencies, which reflect the intrinsic dynamic characteristics of the beam. The two frequency ranges differ significantly; thus, they can be effectively separated through filtering. Consequently, the modal component

When the beam is damaged, its vibration characteristics are altered. Considering the damaged response (equation (6)), the modal component of the principal component can be expressed as follows:
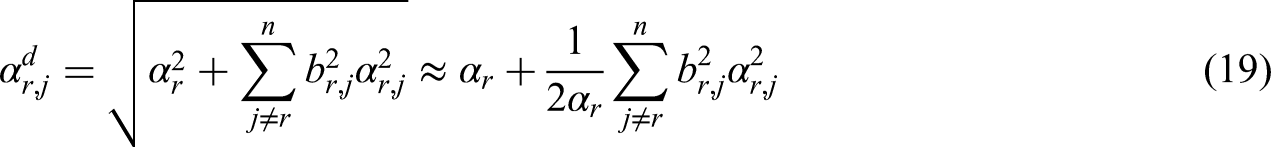
Considering that the frequency shift induced by damage is usually very small and the variation in the velocity parameter is negligible, the change in the modal component can be approximated as follows:

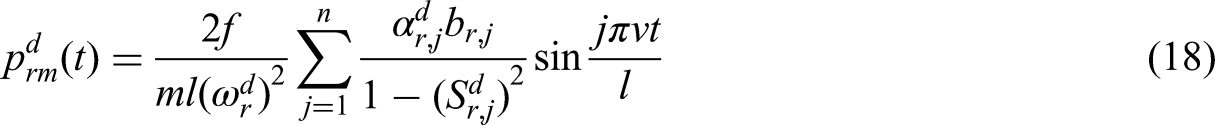
Accordingly, equation (18) can be rewritten as follows:

As shown in equation (21), structural damage introduces coupling among different mode orders, such that the principal component, originally dominated by a single mode, becomes contaminated with contributions from other modes. In other words, damage disrupts the one-to-one correspondence between a principal component and a single mode. Consequently, the modal component of the damaged principal component contains not only the dominant mode but also additional contributions from other order modes.
Damage detection based on irregularity of mode shapes
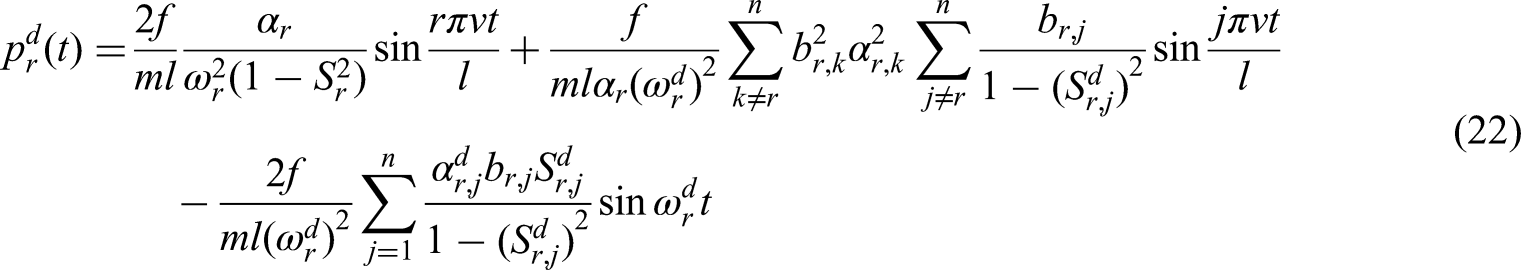
The principal component can be decomposed into three parts: the modal component, the dynamic component, and the damage component. Accordingly, the damaged principal component can be expressed as follows:
The undamaged modal component typically exhibits a smooth sinusoidal curve. When damage occurs, although the dominant mode remains unchanged, small contributions from other modes can be observed. These irregularities are particularly evident at the damaged location, as local stiffness reduction leads to the coupling and superposition of higher-order modes in this region.
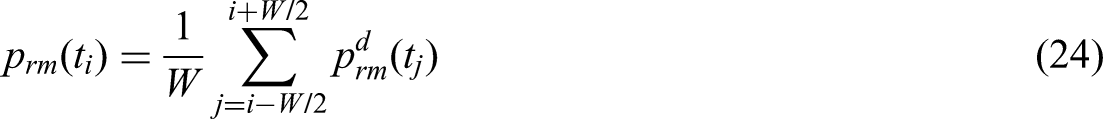
Direct visual identification of damage is impractical because the magnitude of the damage component is usually smaller than the dominant modal component. A moving average filter (MAF) is applied to extract this small damage component. Initially, the dynamic component is removed using the natural frequency as the cutoff frequency. Only the undamaged modal and damaged components remain.
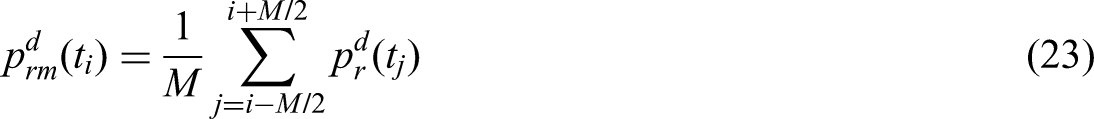
In the equation, the moving window length M is defined as
Then, a second filter is applied. The undamaged modal component is dominated by a single frequency, whereas the damage-related component contains higher-order frequencies induced by local stiffness perturbations. The undamaged mode shape component can be effectively extracted using the dominant frequency of the moving load as the cutoff frequency, as follows:

Through this process, only the irregularities associated with local modal distortions are retained and amplified in the damage component. To further enhance their visibility, the square of the damage component is employed as a damage indicator, as follows:

Numerical validation
Introduction of the numerical model
A simply supported beam model was established in ANSYS to verify the effectiveness of the proposed method. The beam has a cross-section of 0.3 m × 0.5 m and a span length of 20 m. The density and elastic modulus were set to 7850 kg/m3 and 210 GPa, respectively. Along the beam length, 500 elements were divided longitudinally and 10 elements vertically. Damage was simulated by deleting specific elements, and the damage severity was defined as the ratio of the deleted element height to the total section height.
Both single- and double-damage scenarios were considered. Damage was introduced at positions of 6 m (
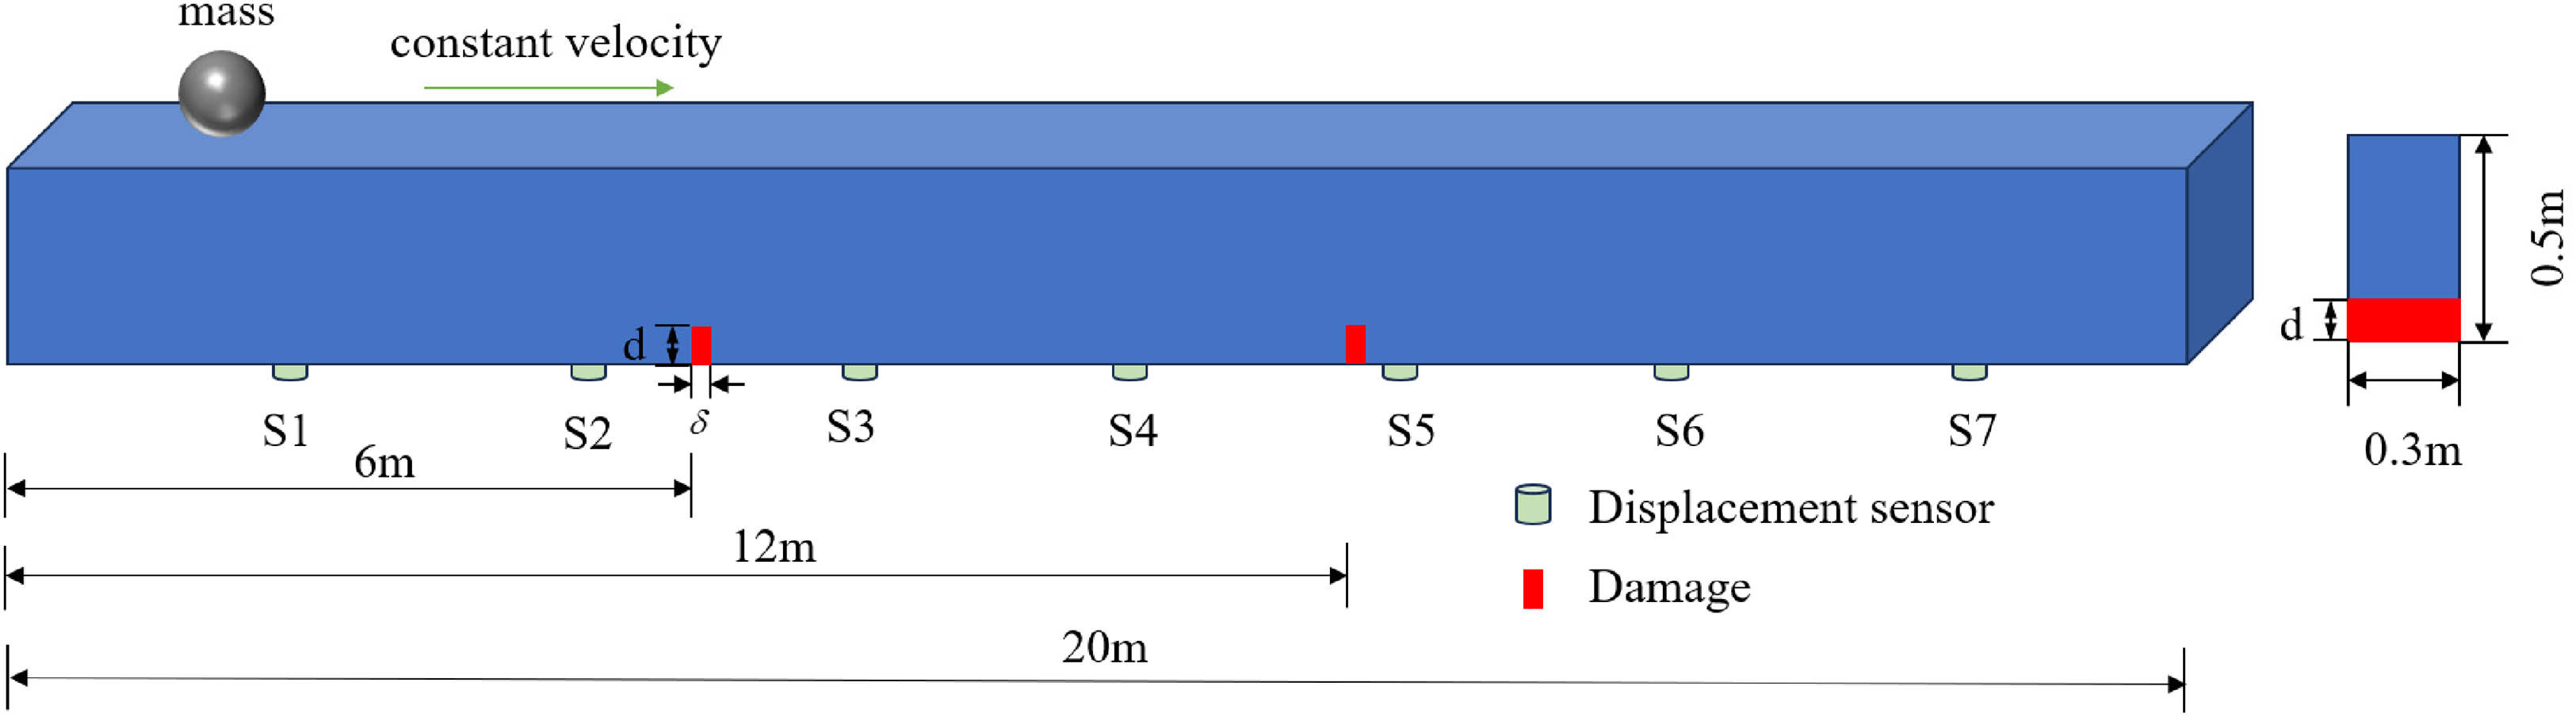
Simulation model.
Numerical simulation scenarios.
Results of numerical simulation
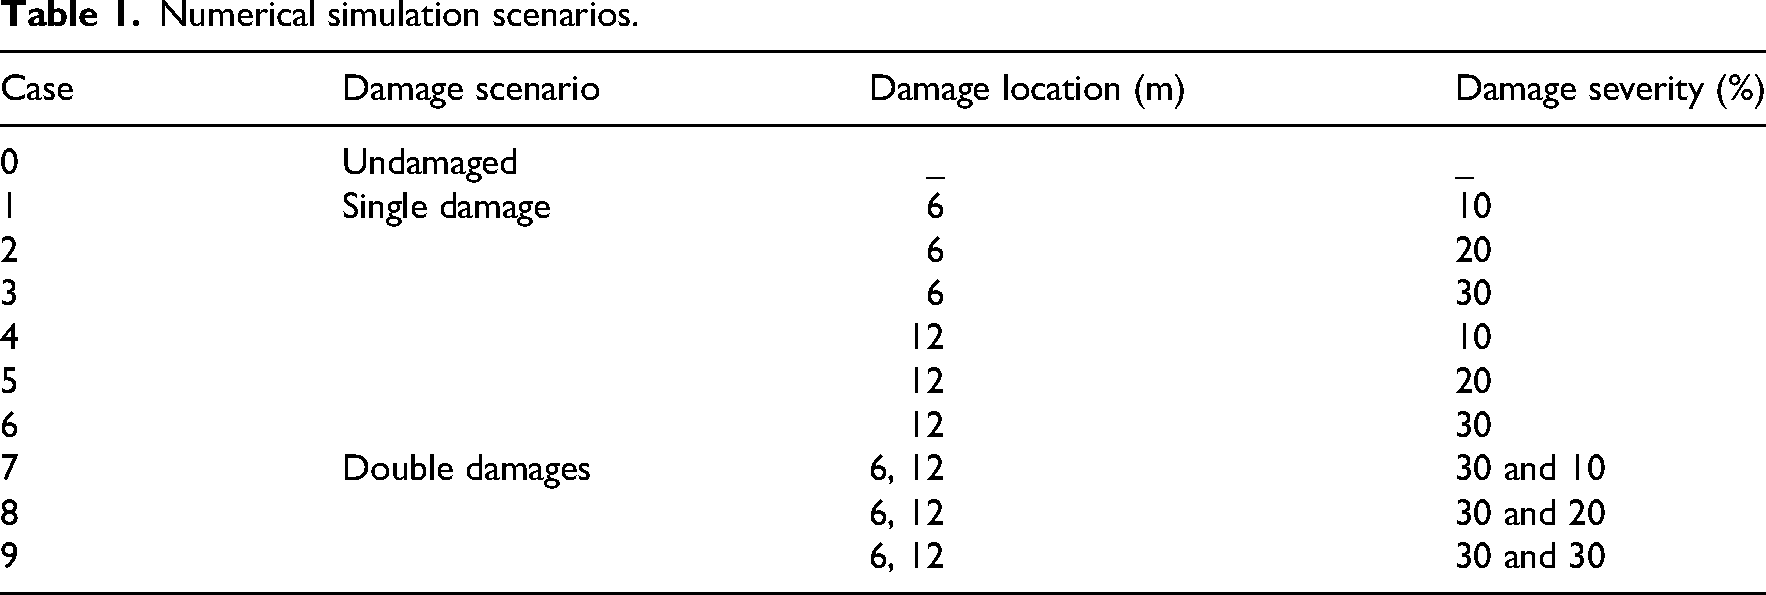
Although the proposed method does not require baseline data, the undamaged state is analyzed here to demonstrate the method's accuracy and reliability. Figure 3 illustrates the midspan displacement time history and corresponding frequency spectrum before and after damage. As shown in Figure 3(a), stiffness degradation increases deflection amplitude, with a maximum displacement variation of ∼1.2%. The corresponding change in the first natural frequency is ∼1.8%, as illustrated in Figure 3(b). Even with 20% damage, the variations in the time and frequency domains remain minor, causing difficulty in accurately identifying the damage.
Time history and frequency spectrum at midspan (
Figure 4 presents the first two principal components of the dynamic displacement for the undamaged beam. The numerical results show satisfactory agreement with the theoretical value, confirming the accuracy of equation (16). The calculated contribution ratio of the first principal component is 96.3%; therefore, only the first principal component is used for damage identification.
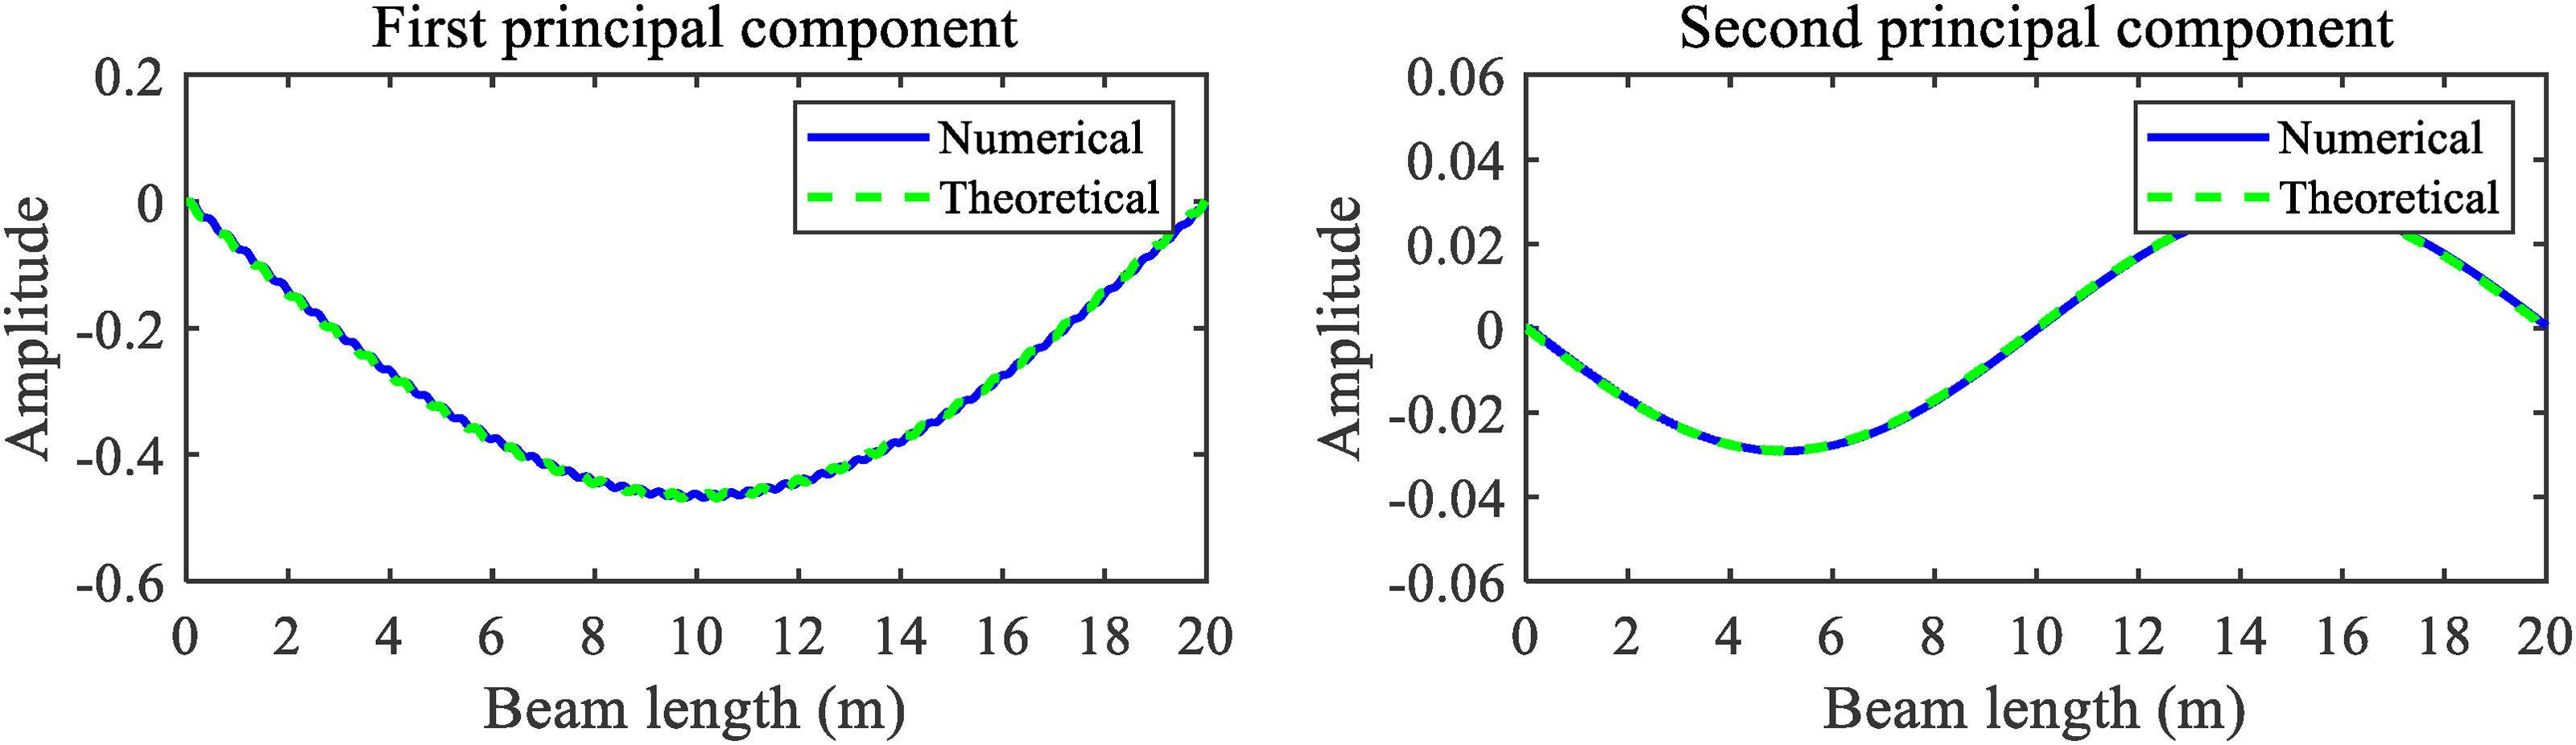
First two principal components (undamaged).
To further demonstrate that the identified high-resolution mode shapes contain rich spatial information, the conventional complex mode indicator function (CMIF) method was adopted to extract discrete mode shapes as references for comparison. Since the displacement response is mainly dominated by low-frequency components, the first three mode shapes were identified, as shown in Figure 5. The results show that the high-resolution mode shapes match the discrete mode shapes closely. Moreover, the modal assurance criterion (MAC) values evaluated at the sensor locations are all > 0.997 (Figure 5(d)), indicating good spatial correspondence between the high-resolution mode shapes and the CMIF reference mode shapes for each order, and confirming the reliability of the mode identification results.
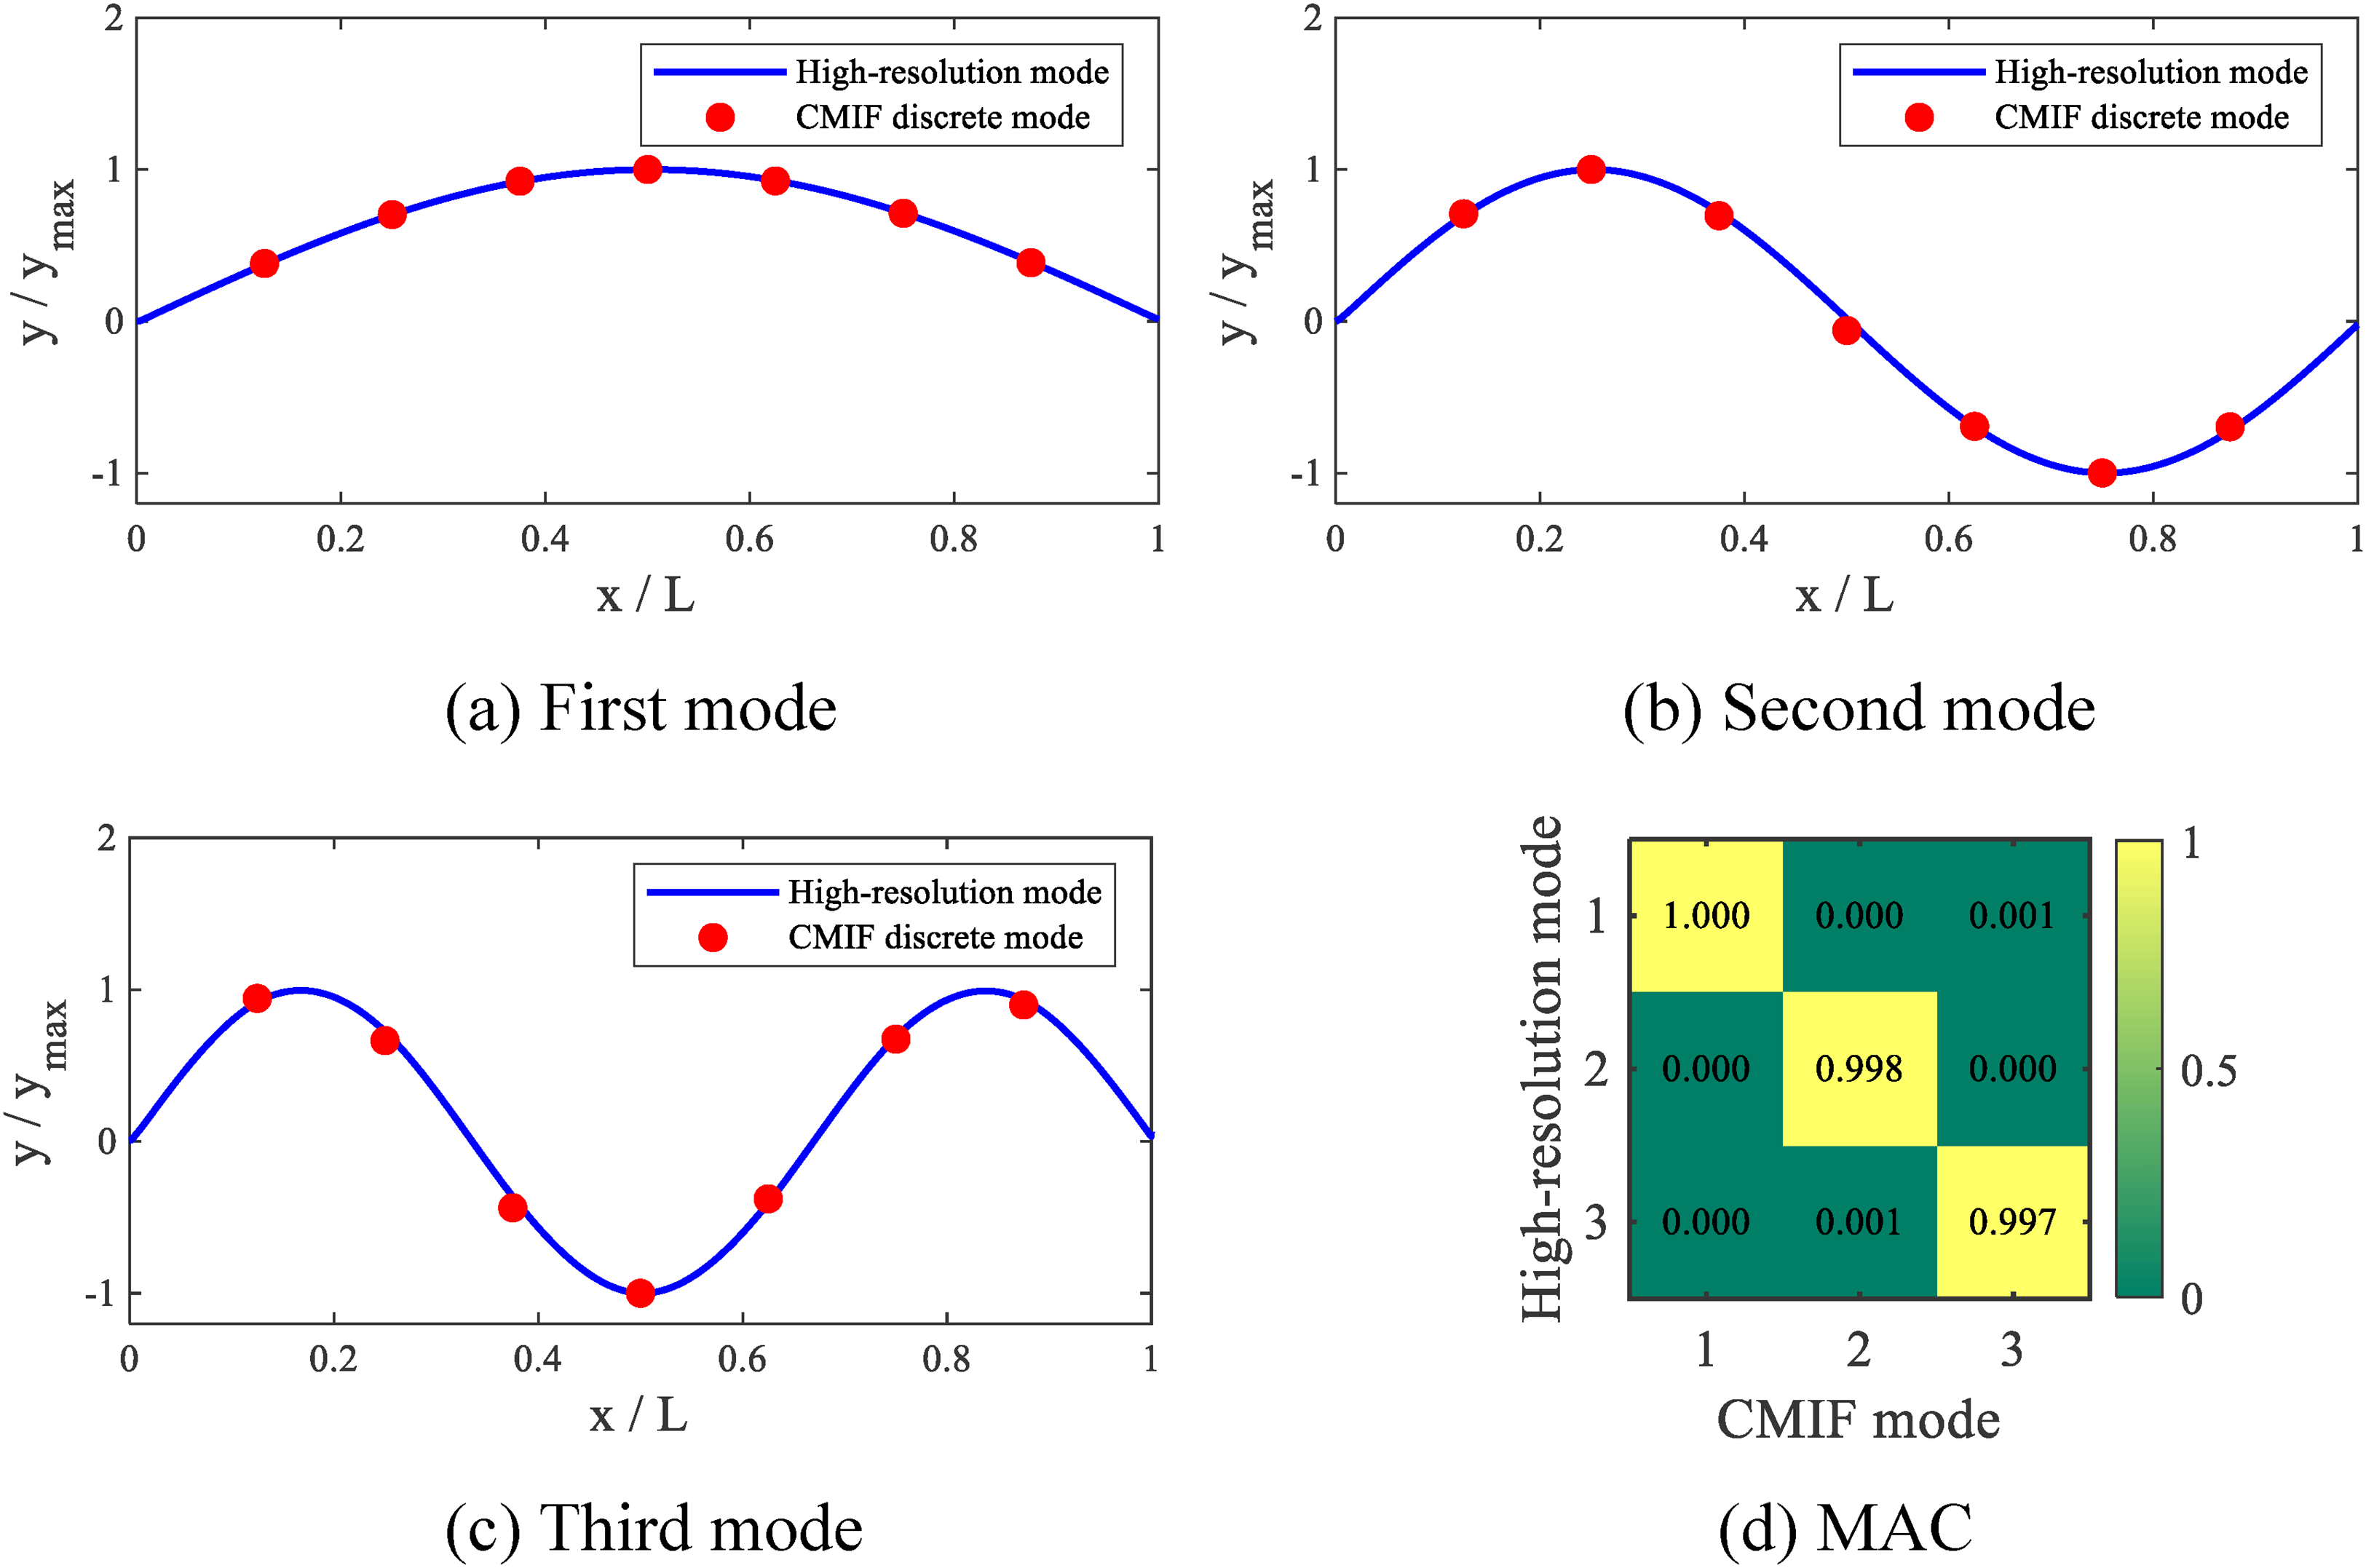
Comparison of mode shapes: (a) first mode, (b) second mode, (c) third mode, and (d) modal assurance criterion (MAC).
The principal component of a damaged beam consists of the damage-induced modal component and the dynamic component. The modal component can be further decomposed into the undamaged mode shape and the damage-related component. Figure 6(a) illustrates the composition of the first principal component under a 20% damage case, where the triangular marker denotes the actual damage location. The principal component curve exhibits noticeable oscillations, primarily originating from the dynamic component corresponding to the beam's first natural frequency.
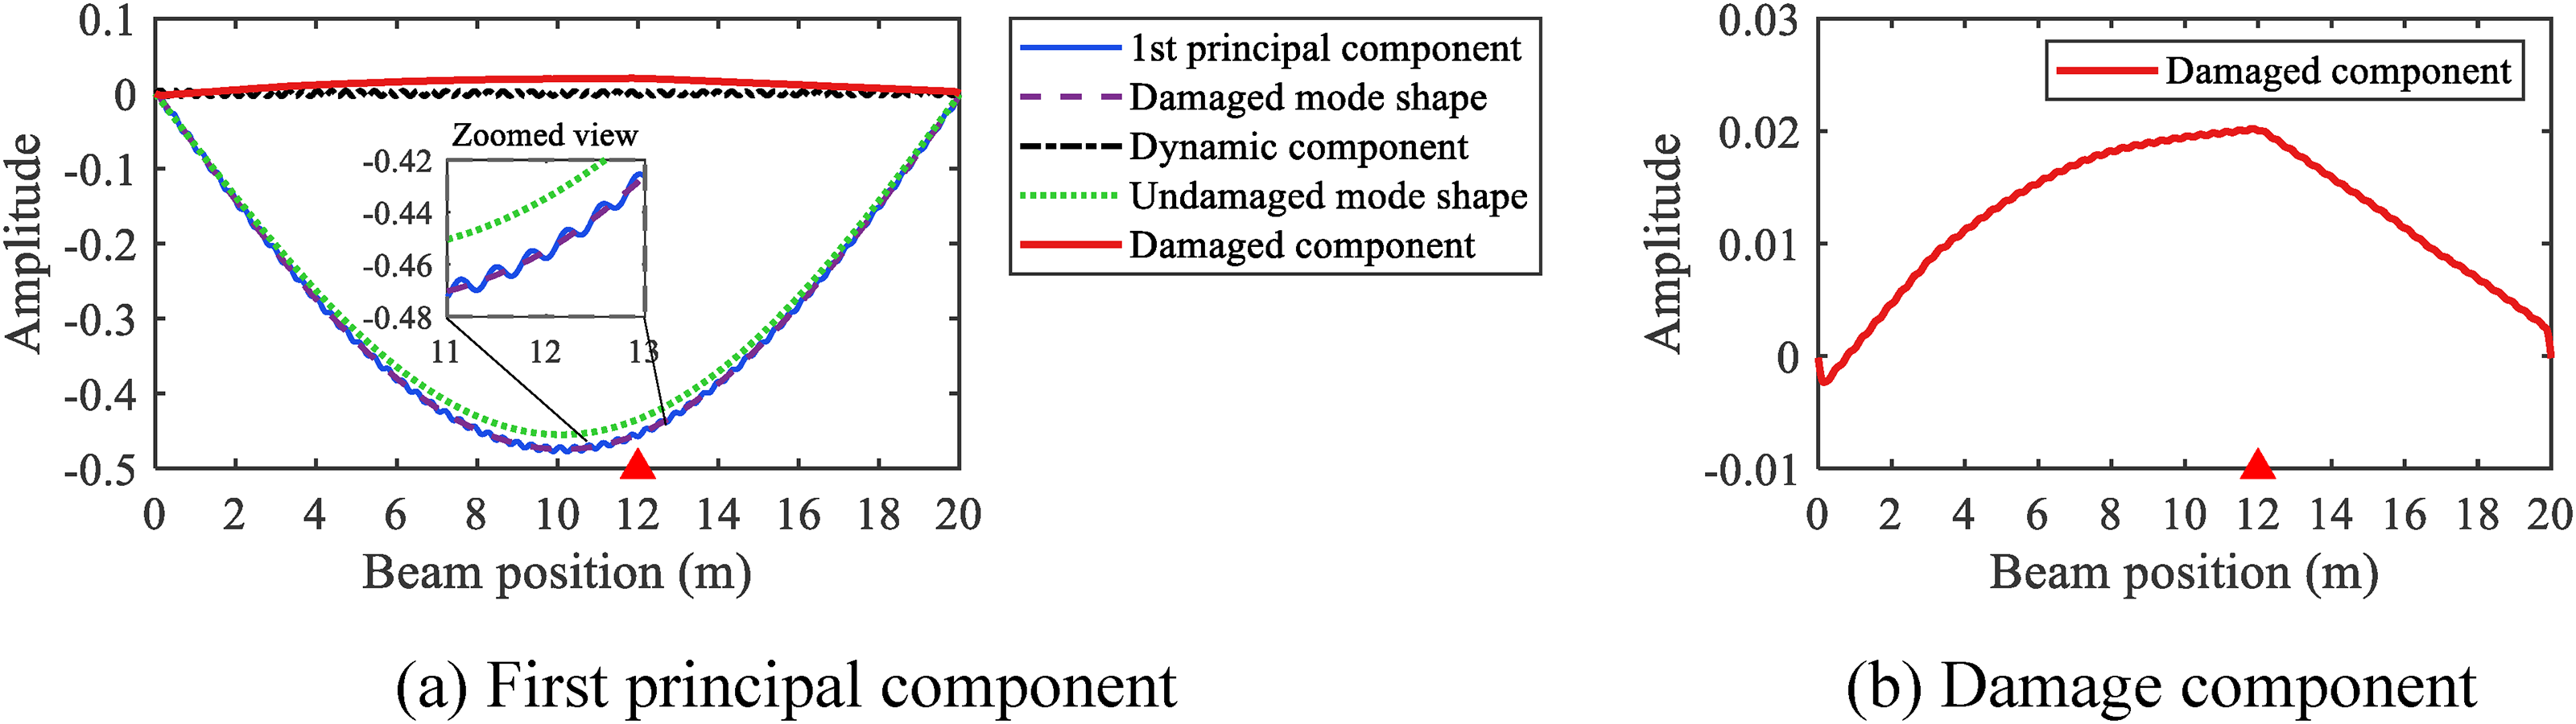
Composition of the first principal component (
Direct identification of the damage location from the modal component alone is challenging. However, after separating the damage component, a distinct peak appears at the damaged section. Figure 6(b) presents the isolated damage component to more clearly demonstrate the irregularity introduced by the damage component. The irregularity reaches its maximum value at the damage location, clearly indicating the presence of local stiffness reduction. This observation demonstrates that separating the damage component effectively locates structural damage.
Single damage identification
In this section, the displacement responses of simply supported beams with a single damage were processed to extract the damage indicator. Figure 7 illustrates the identification results for various damage locations. For the undamaged beam, the damage indicator curve remains smooth. When damage occurs, peaks emerge at the damage sites, and their amplitudes increase with the severity of the damage. These results highlight the high sensitivity of the proposed method and confirm its effectiveness in detecting damage at arbitrary locations. To quantitatively evaluate the localization performance, the normalized localization error is defined as follows:
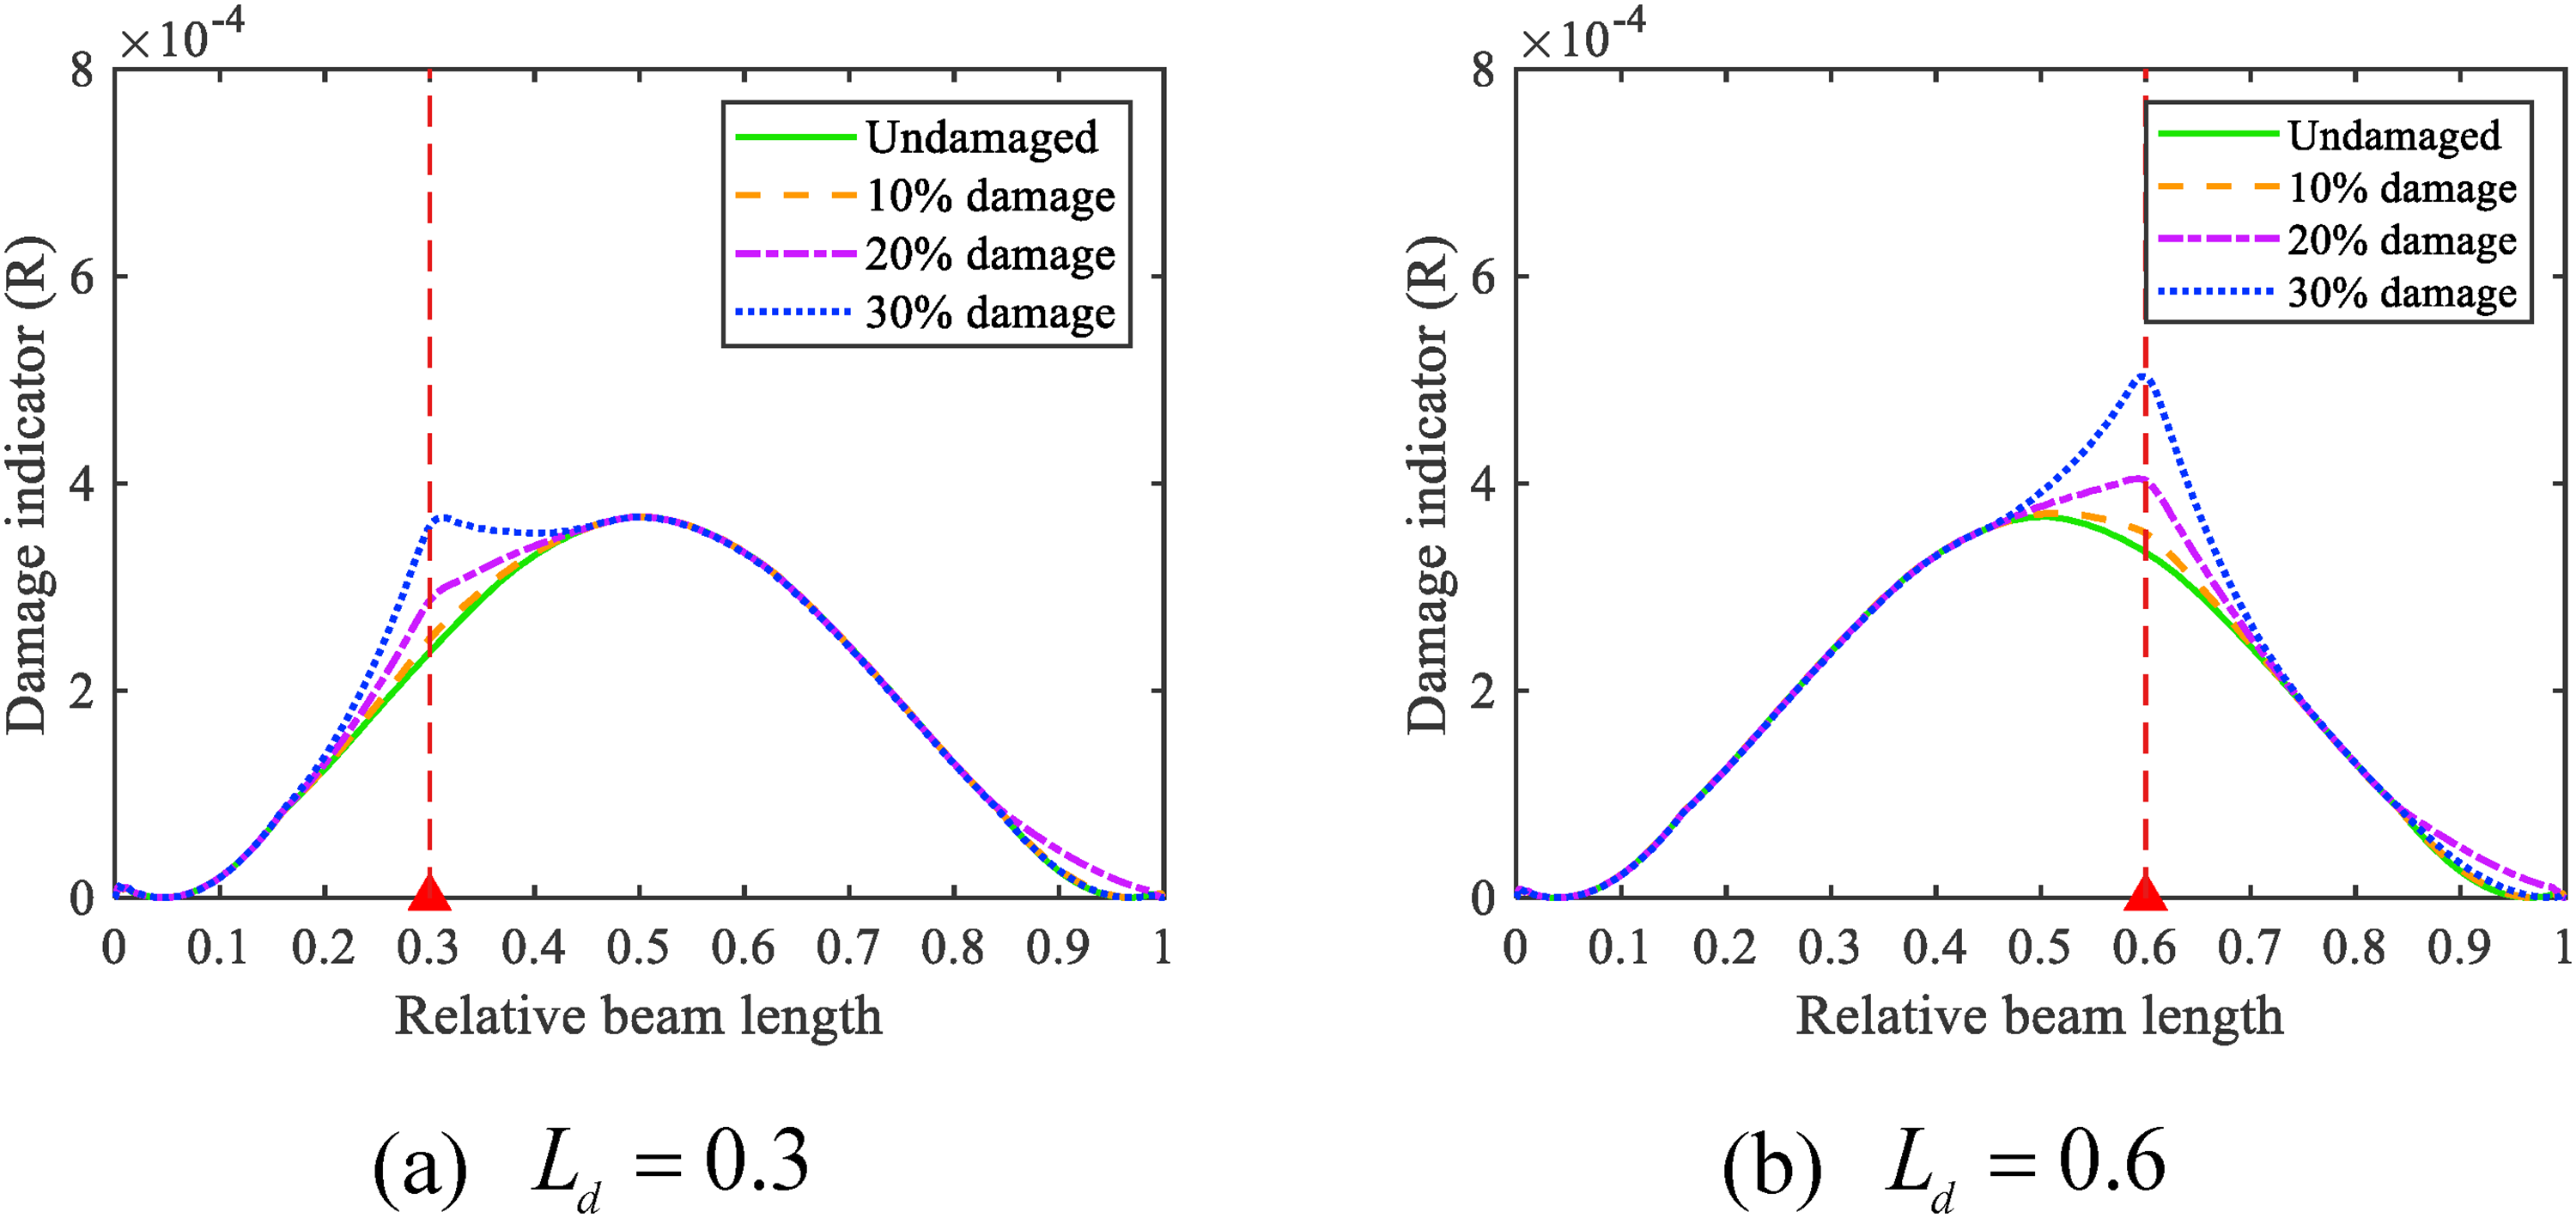
Single damage identification results (
However, as shown in Figure 7, the damage indicator of the undamaged beam is not equal to zero. This discrepancy arises from the inherent characteristics of the MAF. The MAF can be mathematically described as the convolution of the input signal with a rectangular pulse of unit area, whose Fourier transform is expressed as follows (Smith, 1997):
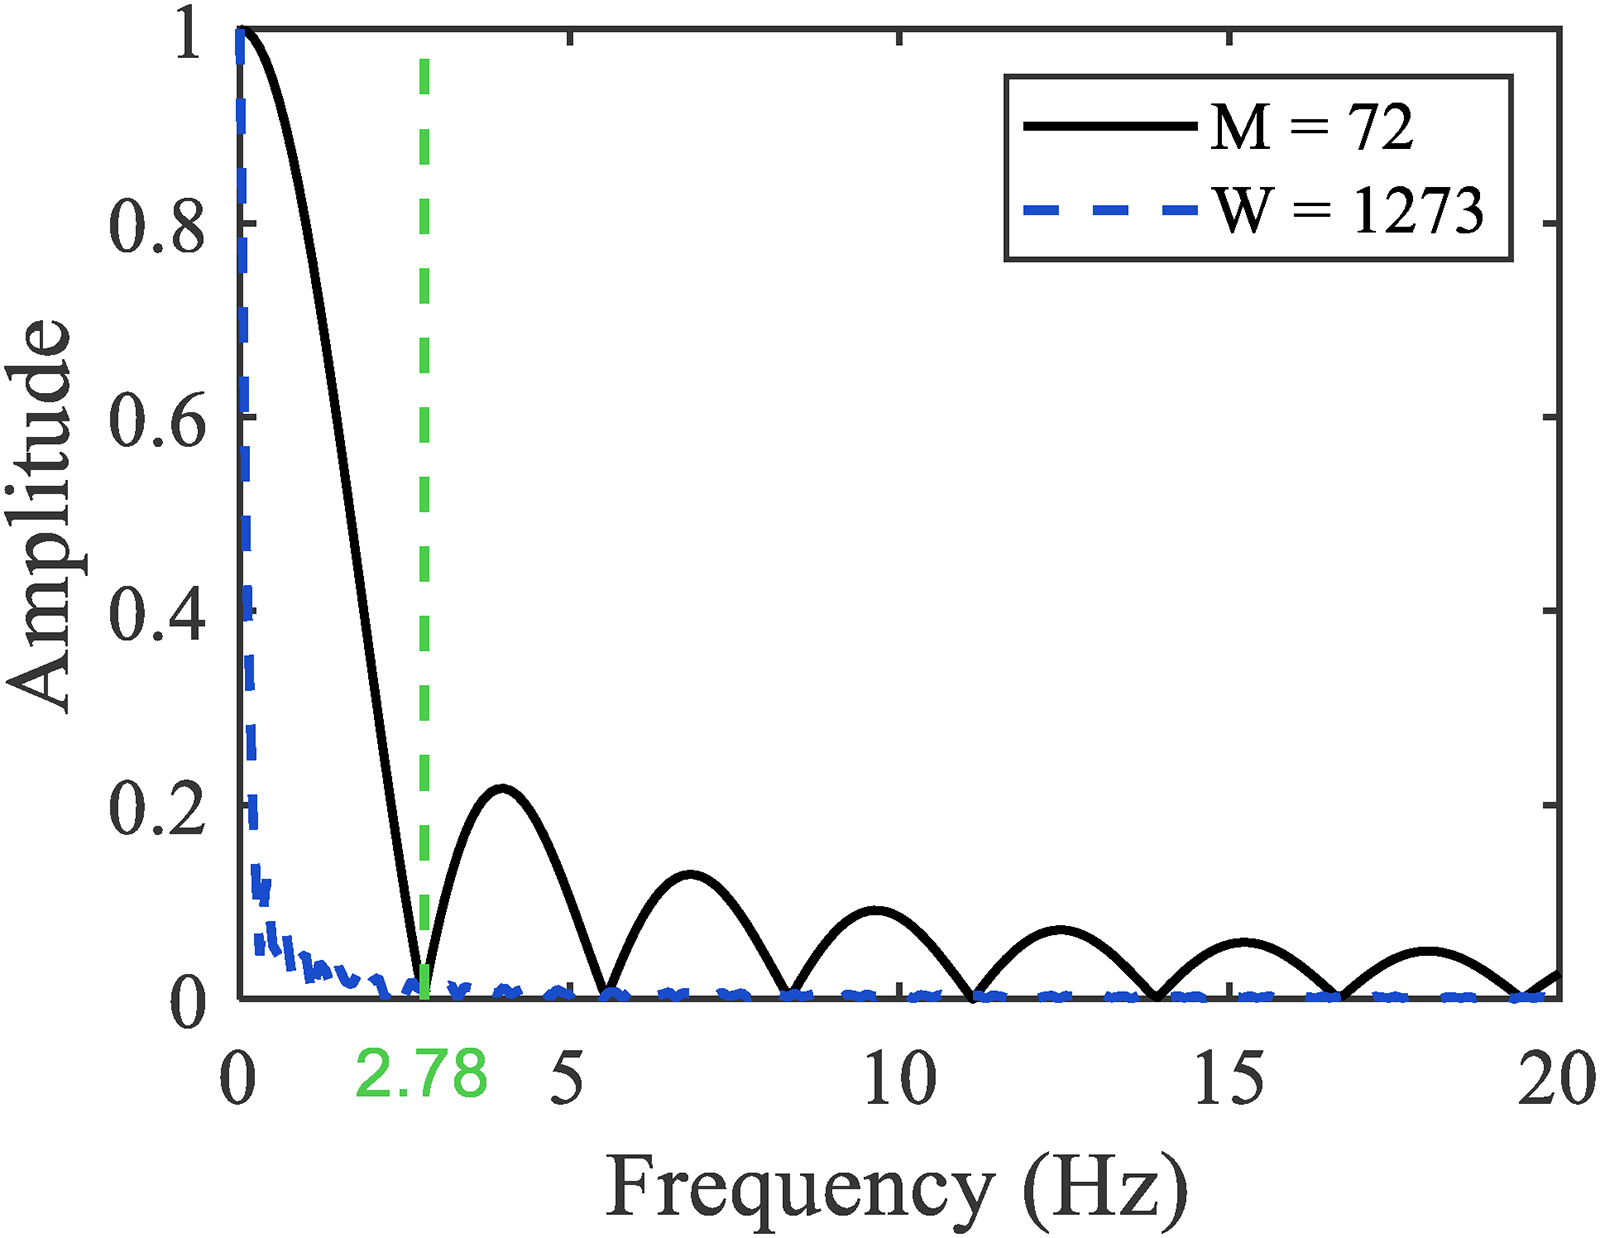
Frequency response of the moving average filter (MAF).
When
In addition, a comparison between Figure 7(a) and (b) reveals that when the damage is located at
Double damages identification
For the double damages scenarios, one damage was introduced at
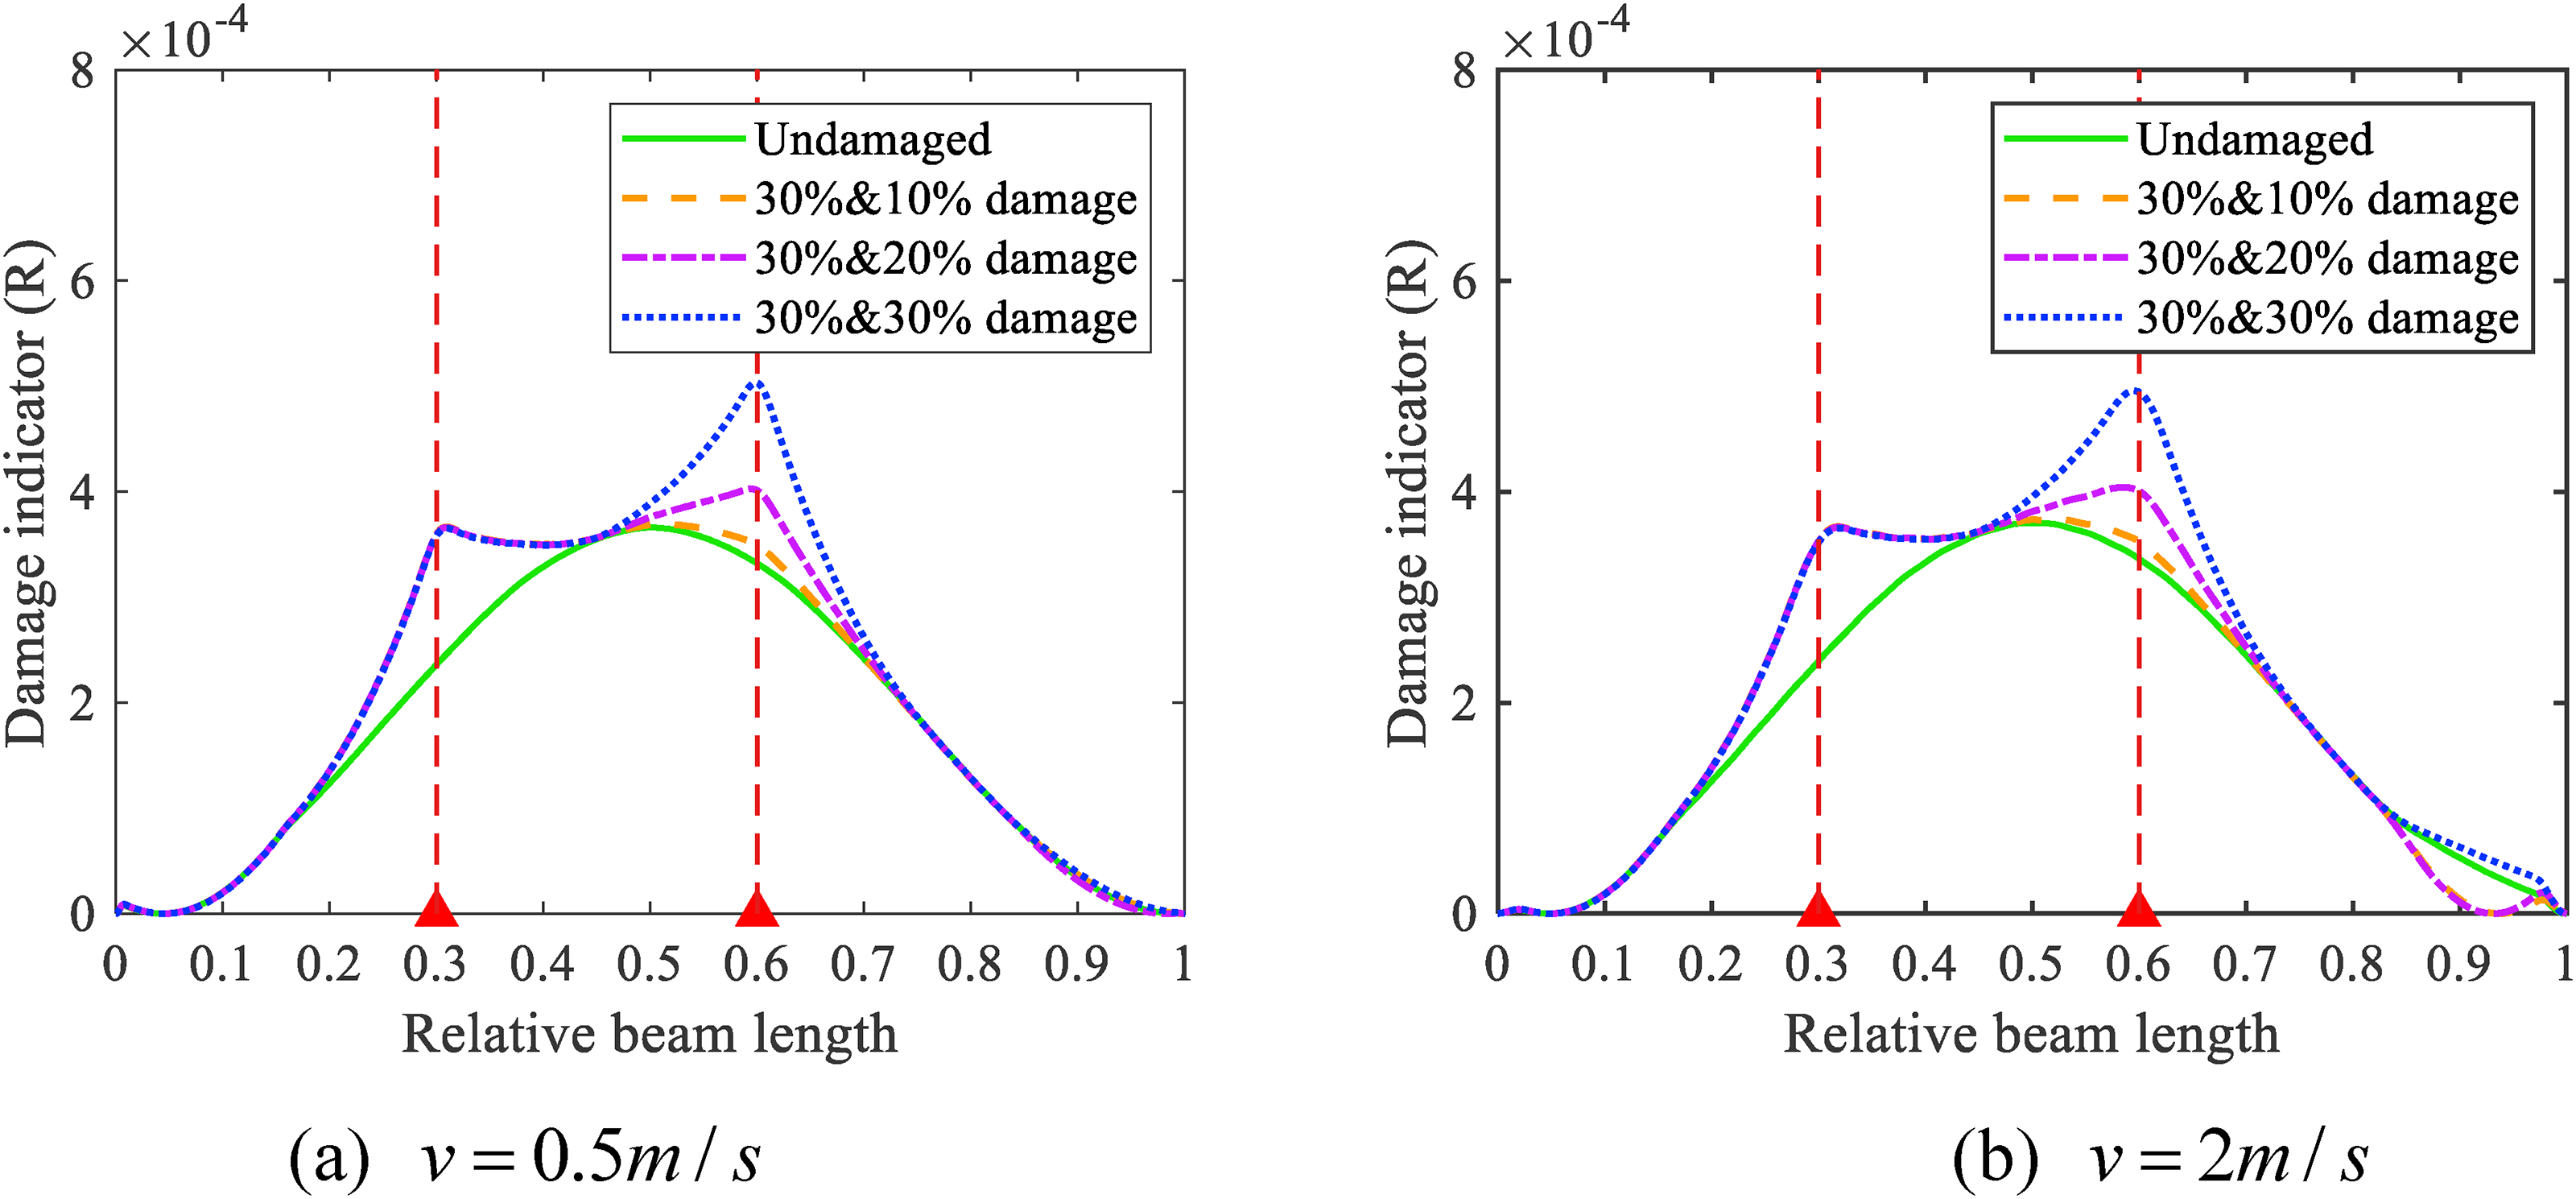
Double damage identification results at different speeds: (a)
As shown in Figure 9(a) and (b), the proposed method remains effective under different moving load speeds, and the damage indicator can accurately identify the actual damage locations. These results demonstrate that the method possesses strong adaptability and high accuracy to various vehicle speeds.
Noise robustness
Sensor measurements are inevitably affected by external noise. Gaussian white noise was introduced into the simulated data to assess the robustness of the proposed method. The noise intensity was quantified using the signal-to-noise ratio (SNR), defined as follows:
Additional Gaussian white noises with SNR levels of 40 dB (high noise) and 60 dB (low noise) were introduced into the responses. The corresponding identification results are shown in Figure 10. The proposed method successfully identifies and locates double damage locations under different moving speeds. Noise affects the smoothness of the damage indicator distribution. As the noise level increases, the fluctuations in the curve become more evident. Nevertheless, the damage locations remain clearly identifiable, demonstrating that the proposed method possesses strong noise resistance and robustness against measurement disturbances.
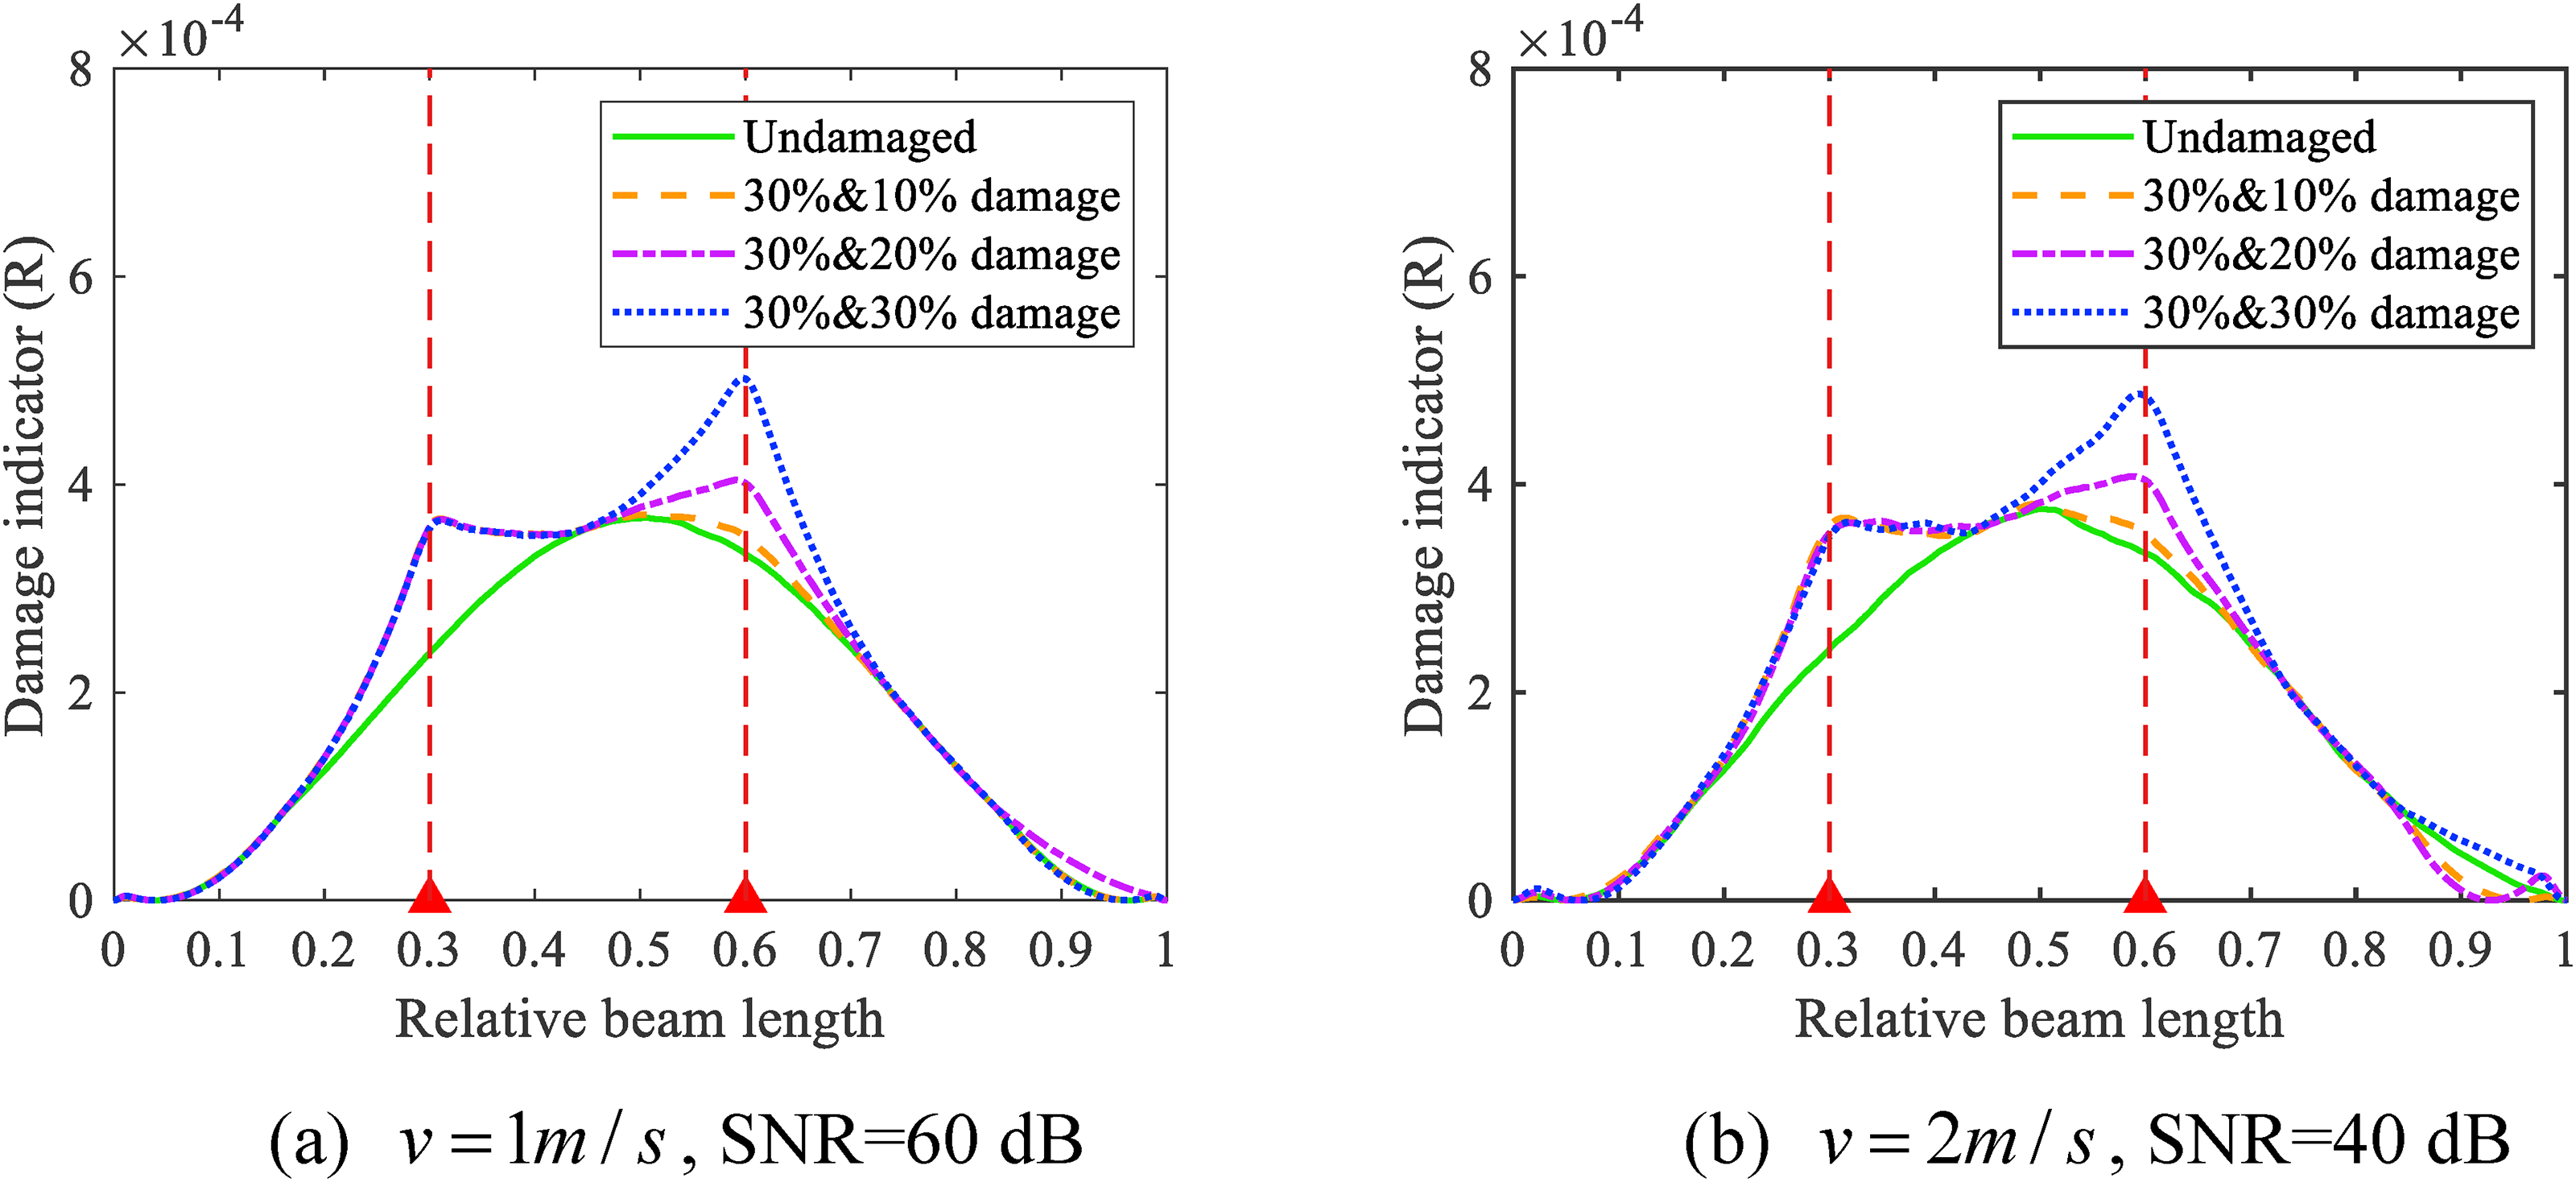
Damage identification results under noise influence: (a)
Results with fewer sensors
Two sensor configurations were designed to further evaluate the proposed method under sparse sensing conditions. In the first configuration, four sensors (S2, S3, S5, and S6) were used, whereas in the second configuration, only two sensors (S2 and S6) were installed. Gaussian white noise with an SNR of 50 dB was added to the simulated displacement responses.
As shown in Figure 11, the damage identification results under sparse sensing conditions demonstrate that the proposed method can accurately detect double damage. Even at higher load speeds, the identification performance remains satisfactory. Notably, when only two sensors are used, the indicator for the undamaged case exhibits local variations at the sensor locations because the mode shape components are influenced by the sensor placement. However, this approach does not affect the accuracy of damage identification. Therefore, the proposed method remains accurate and reliable for damage detection, even with sparse sensor deployment.
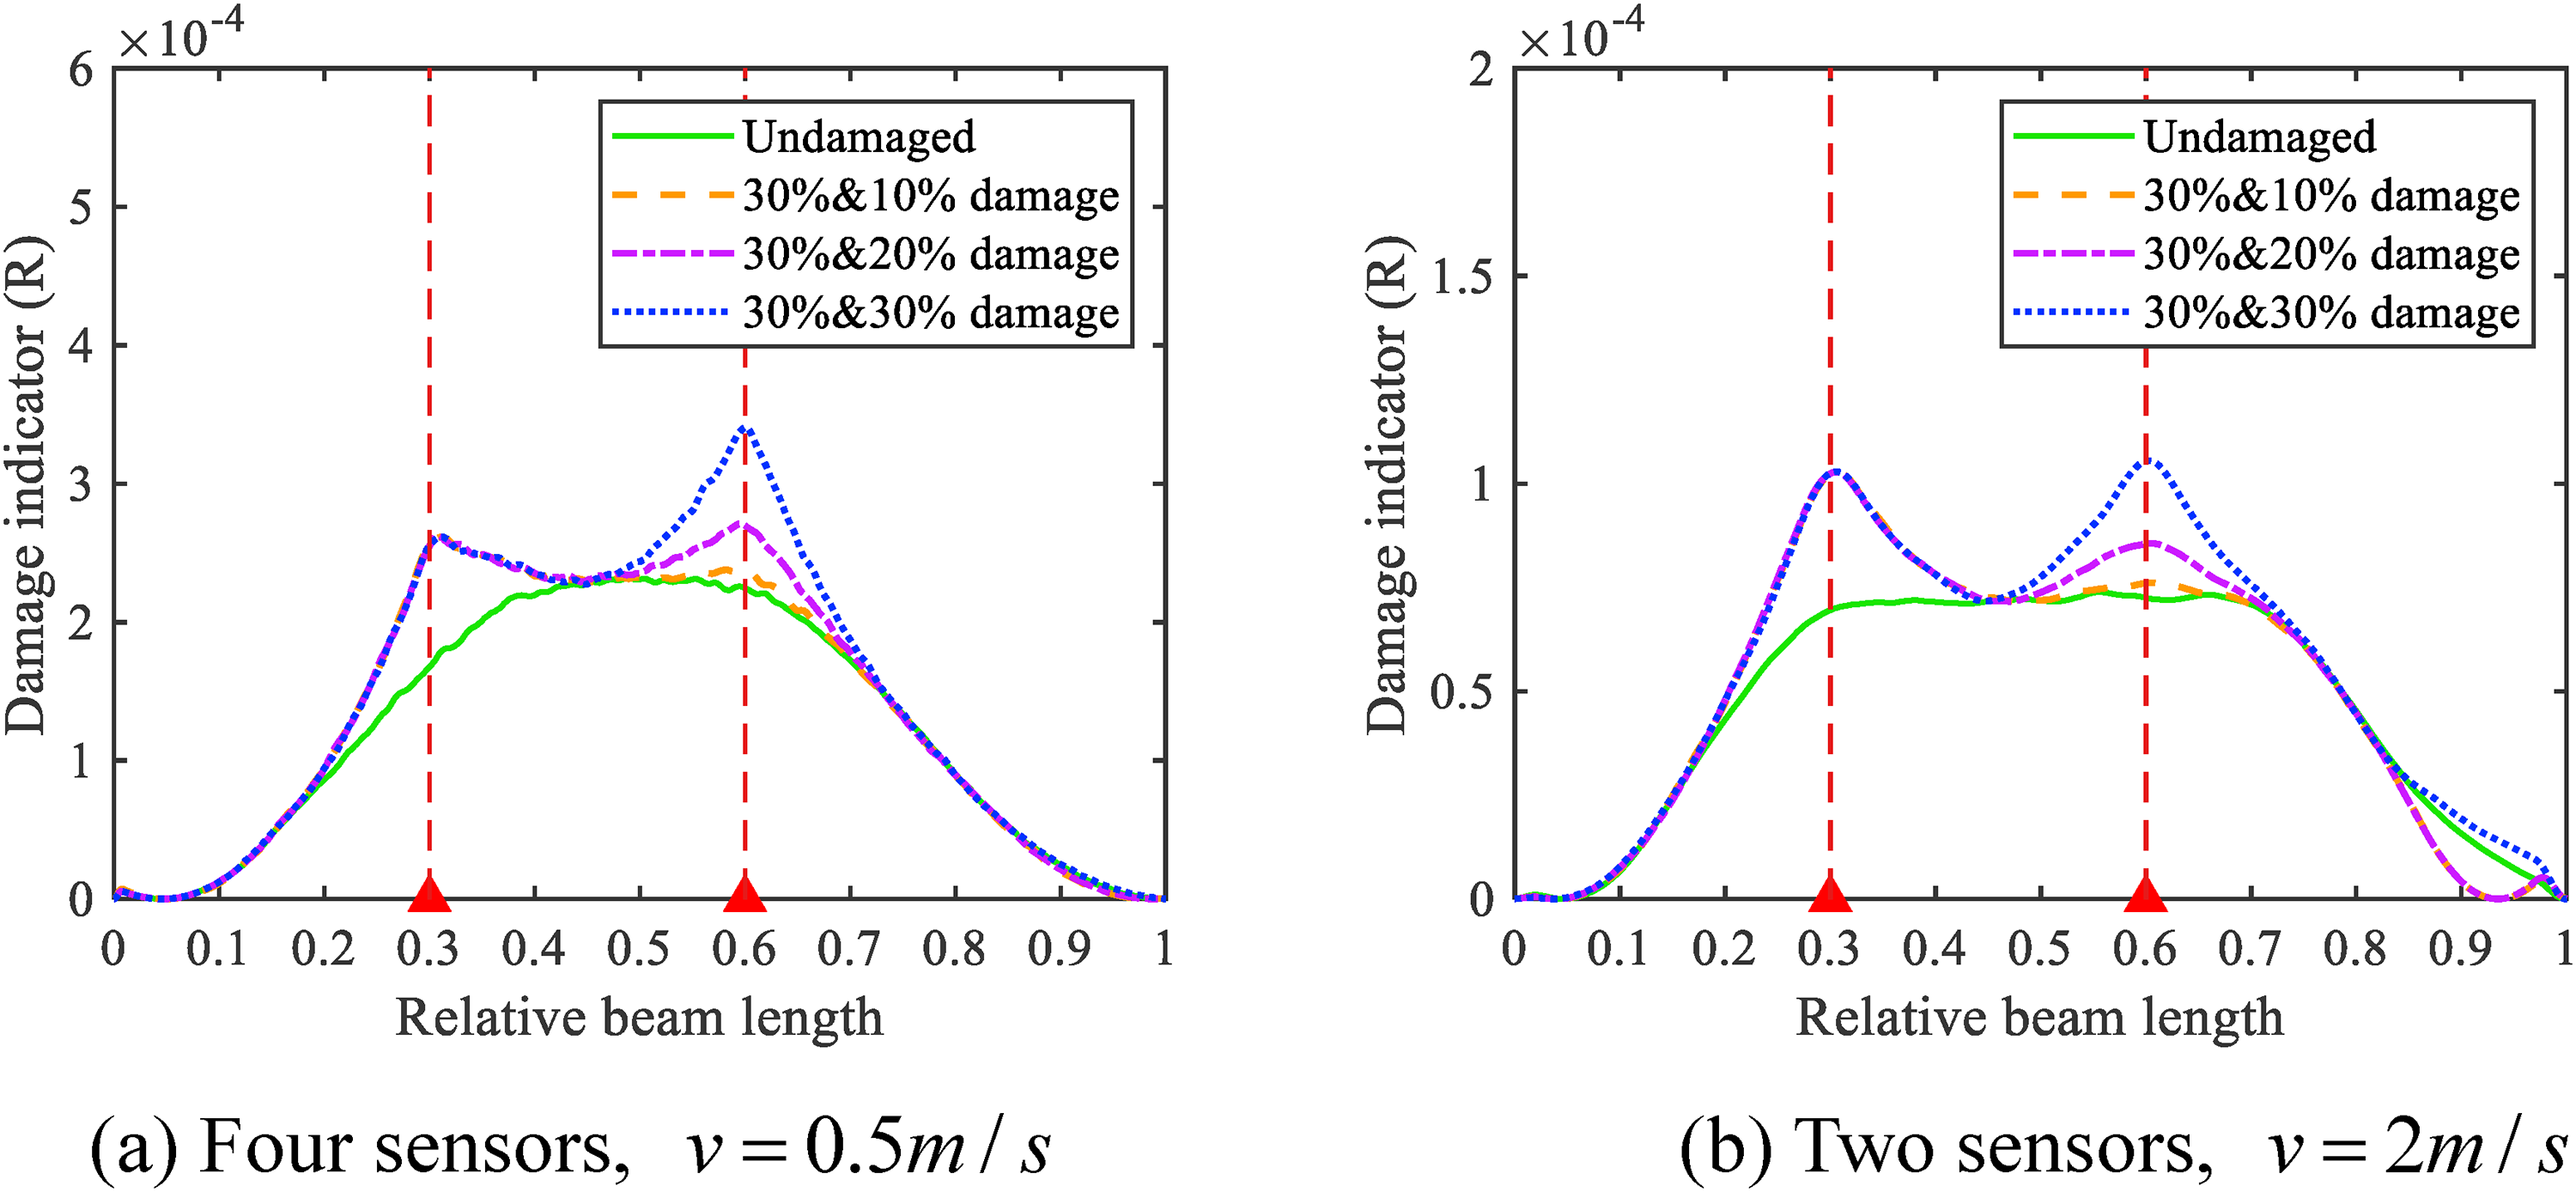
Damage identification results under different sensor configurations: (a) four sensors,
Experimental verification
Setup of the experimental model
Experimental validations of a simply supported beam bridge were conducted to assess algorithm performance. The structure was a square hollow steel box beam with dimensions of 200 mm × 100 mm, and a thickness of 3 mm, as shown in Figure 12(a). Both ends were rigidly supported on steel bases, as illustrated in Figure 12(b). The vehicle model was assembled using a rectangular steel plate and four V-shaped pulleys connected by bolts, with a self-weight of 11.18 kg.
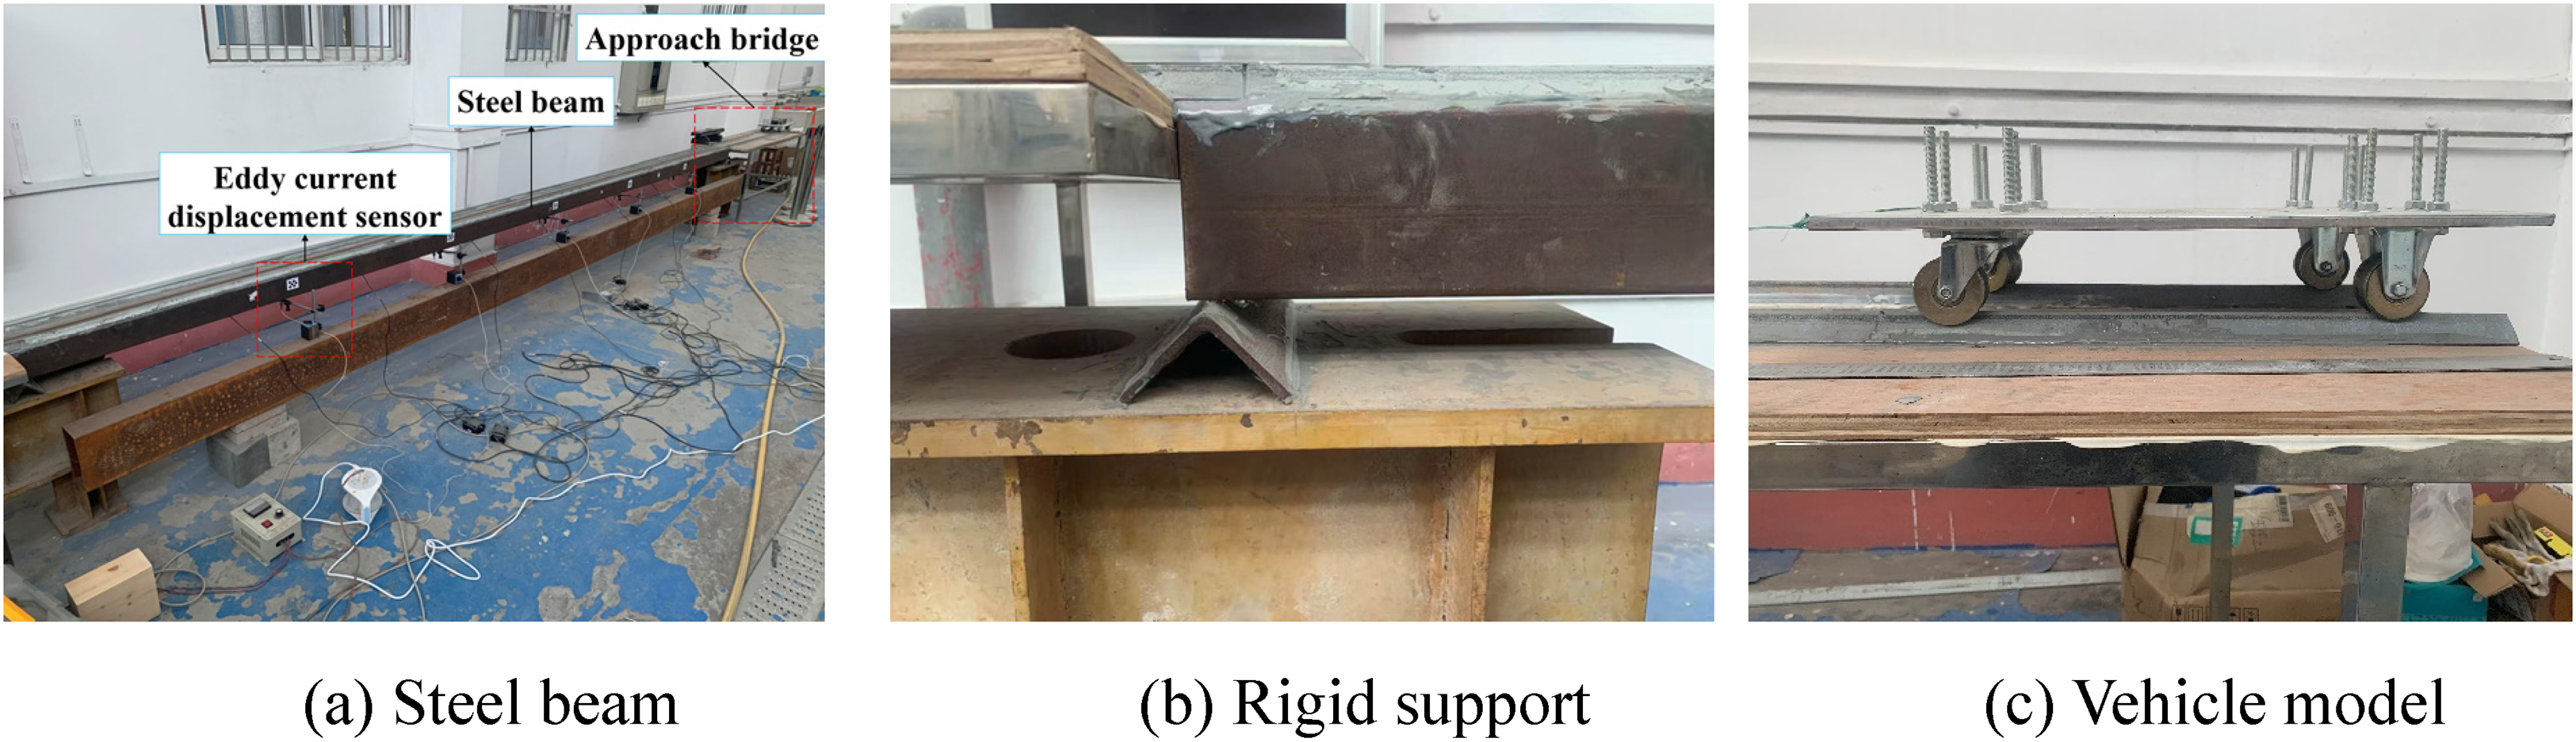
Experimental setup: (a) steel beam, (b) rigid support, and (c) vehicle model.
Two parallel angle steels were firmly fixed to the top surface of the beam to serve as rolling tracks, with the pulleys accurately aligned to ensure uniform and smooth vehicle motion. Approach bridges were installed at both ends to maintain a constant traveling speed along the main beam. The entrance approach allowed the vehicle to accelerate to the target speed prior to entering the main span, whereas the exit approach enabled a stable deceleration after crossing the beam. A schematic of the experimental setup is shown in Figure 13.
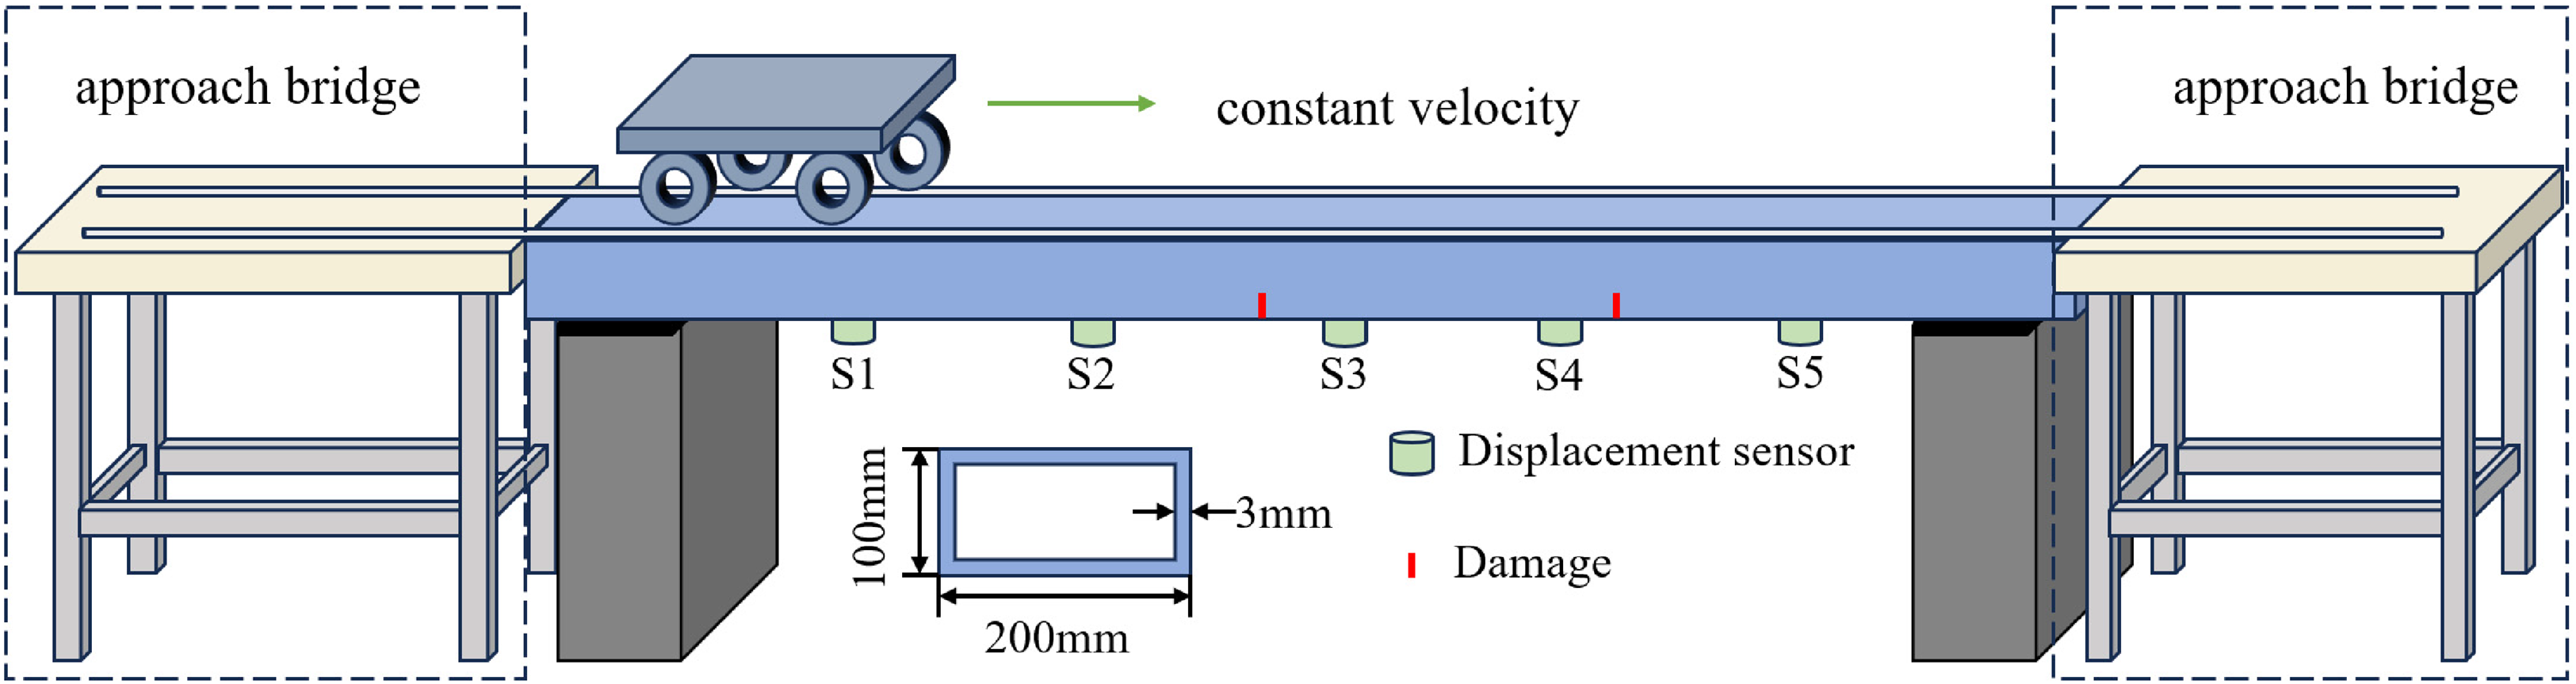
Schematic diagram of the experimental setup.
The vehicle model was connected to a motor via a nonelastic cord, and the vehicle speed was controlled by adjusting the motor's rotational speed, with two operational conditions set at 0.5 and 0.75 m/s. Five eddy current displacement sensors (S1–S5) were evenly installed along the beam bottom with a sampling frequency of 500 Hz.
Damage scenarios
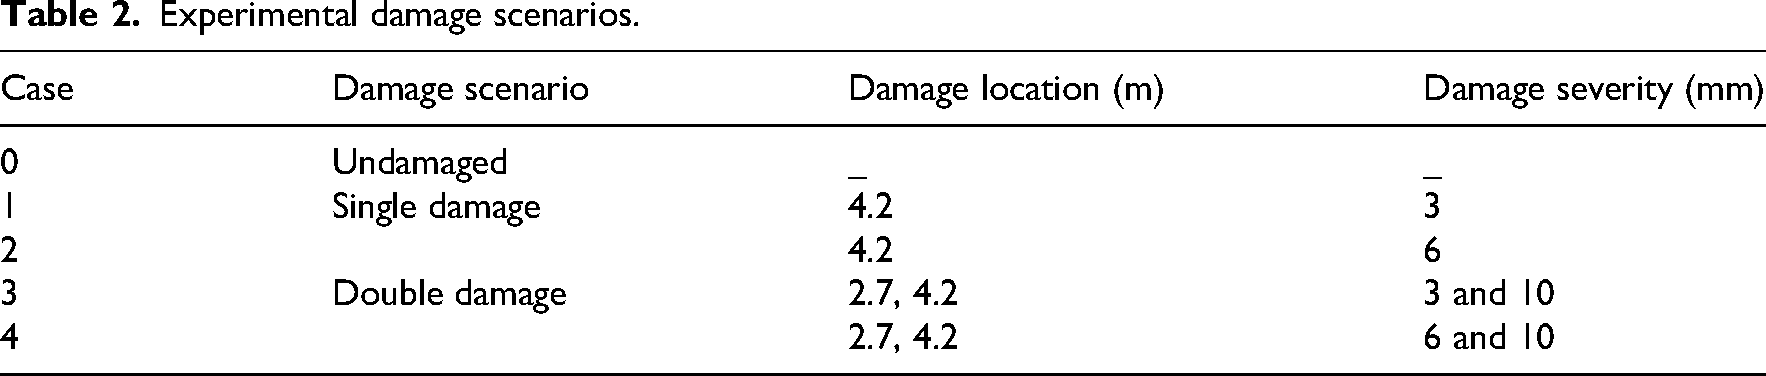
Structural damage was introduced at predetermined locations on the bridge bottom using a handheld cutting machine. All cuts were made between adjacent sensors to ensure that these sensors were unaffected by the process. The first damage was introduced 4.2 m from the left end of the beam (
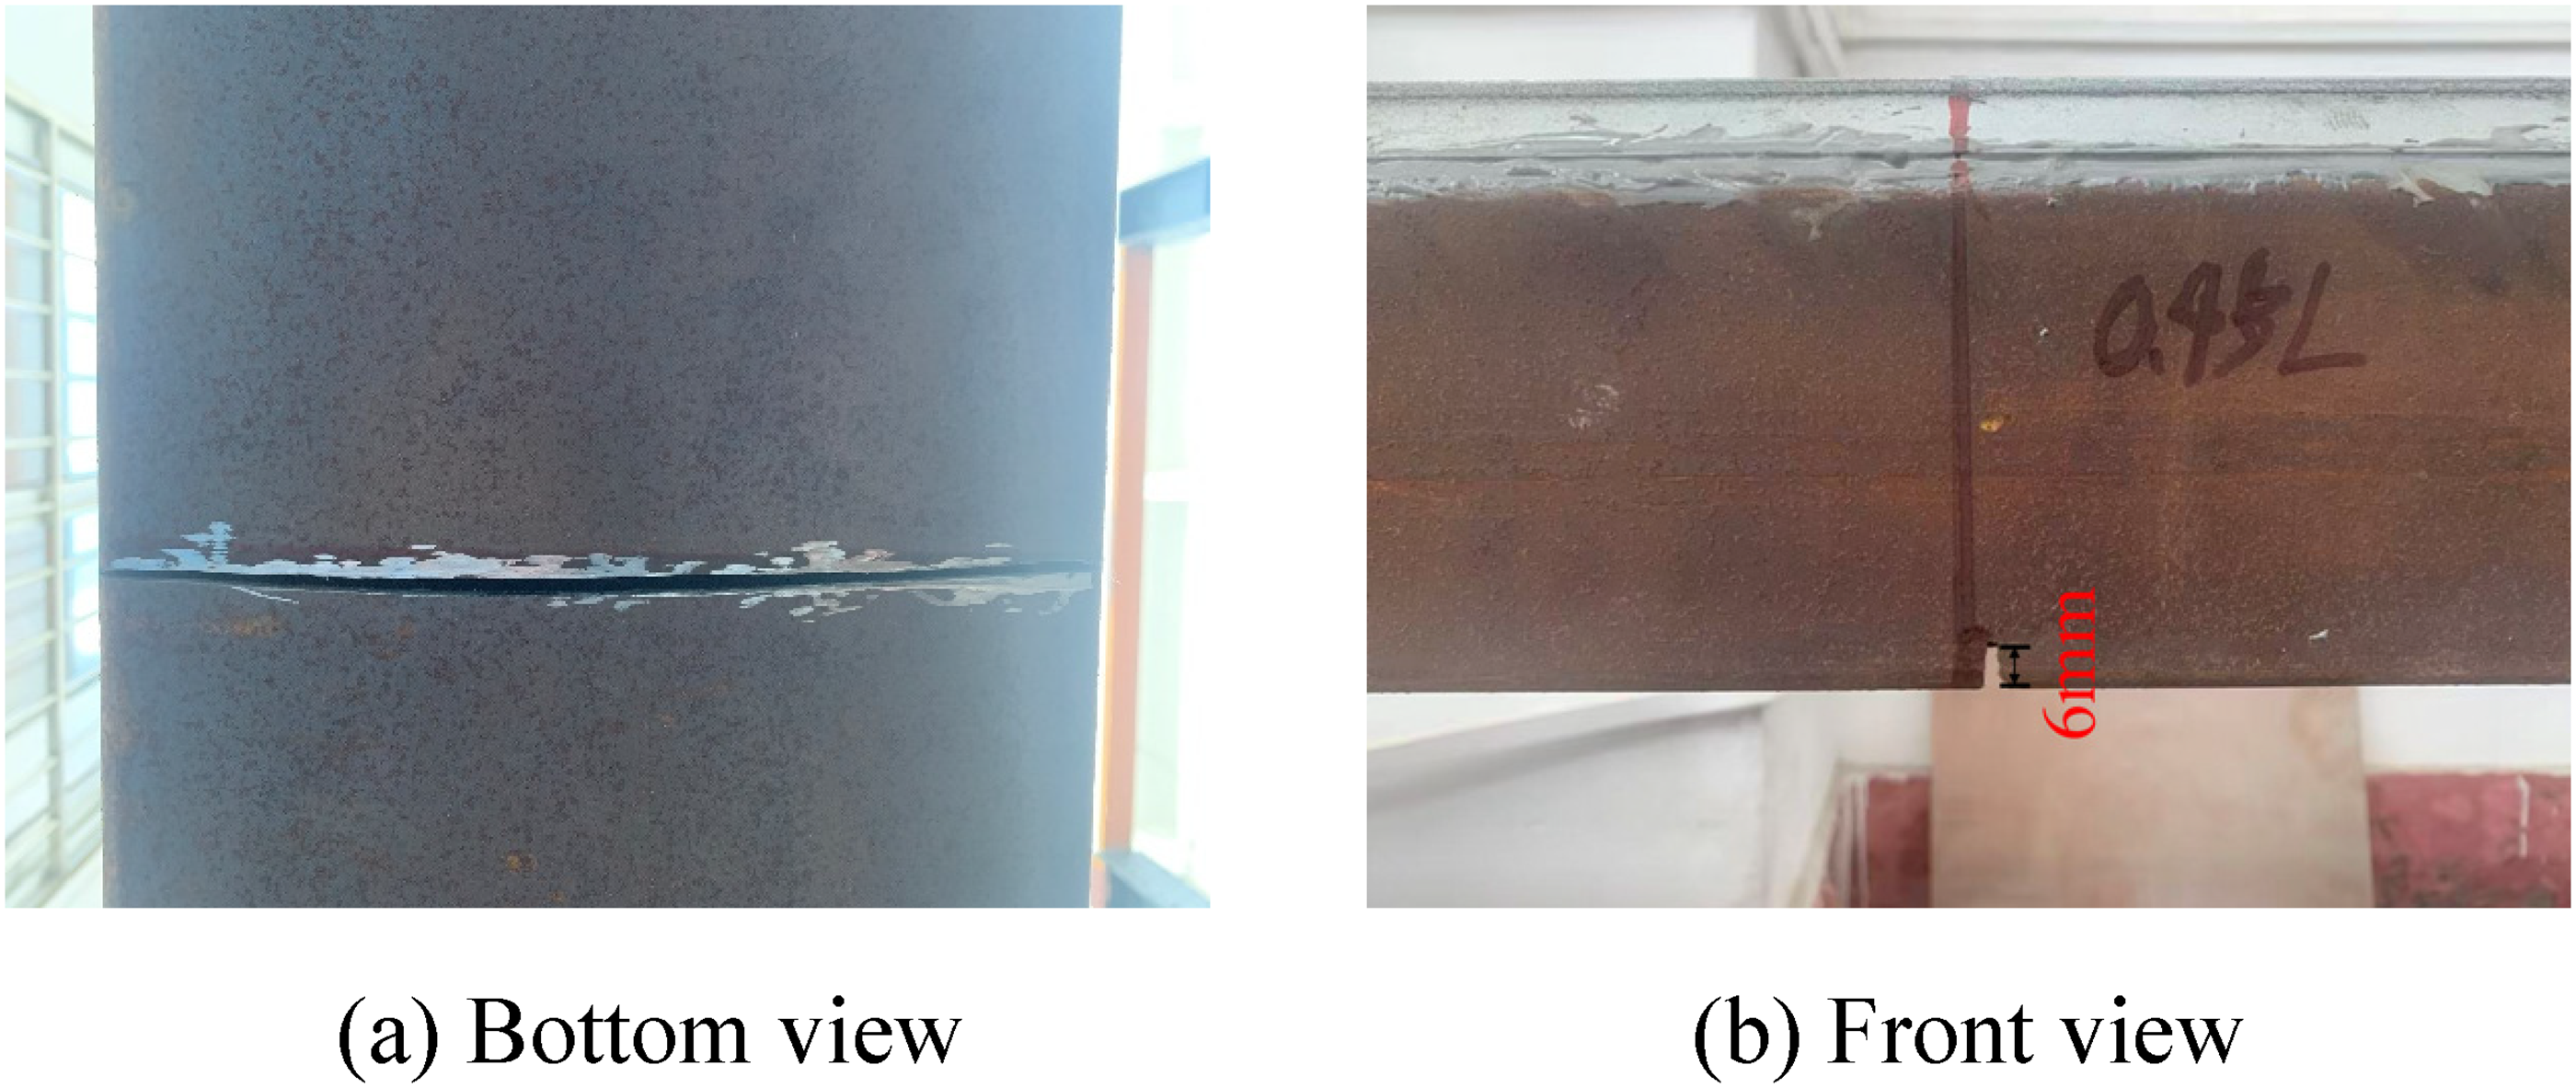
Experimental damage setup (6 mm): (a) bottom view and (b) front view.
Experimental damage scenarios.
Results of experiment
Single damage identification
Figure 15 presents the displacement time histories and corresponding frequency spectra at the midspan measurement point for a vehicle speed of 0.5 m/s under undamaged and damaged conditions. Compared with the numerical simulations, the experimental displacements exhibit more evident fluctuations and more complex spectral compositions, which were caused by environmental disturbances and sensor measurement noises.
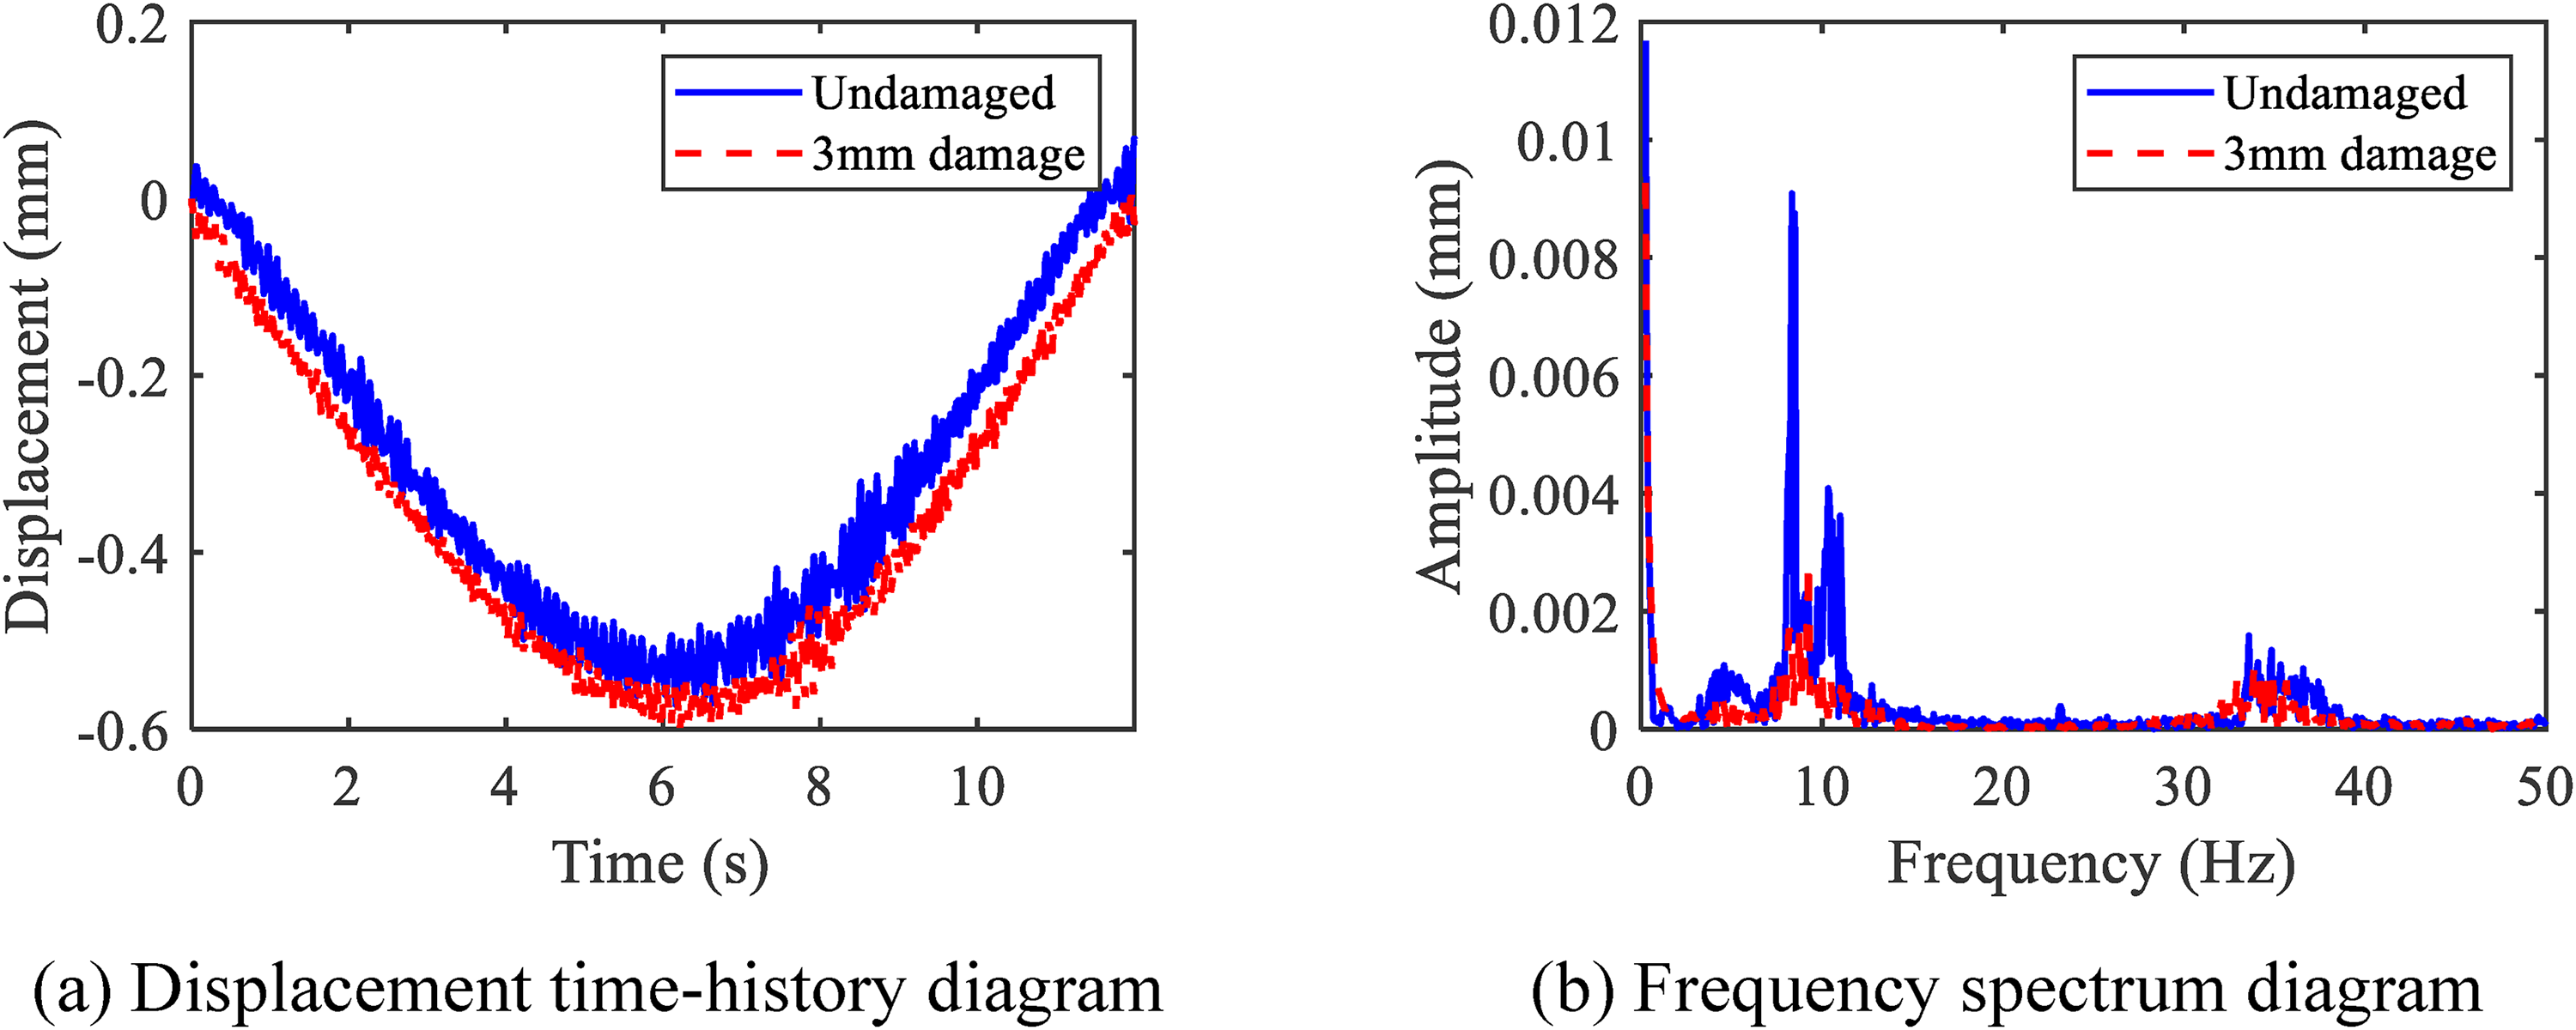
Time-domain and frequency-domain responses at midspan: (a) displacement time–history diagram and (b) frequency spectrum diagram.
Figure 16 presents the damage identification results for a single-damage case under varying vehicle speeds. The damage indicator curve of the undamaged beam remains smooth with minimal fluctuations, whereas the damaged beam exhibits a distinct peak at the actual damage location. The peak magnitude increases progressively with greater damage severity. Compared with the numerical simulation, the experimentally obtained damage indicator curves display higher irregularity. This finding is primarily attributed to the complexity of the experimental environment, including external noise interference and operational uncertainties. In addition, minor fluctuations are observed near the beam ends (0–0.15 L), which are not caused by damage but rather by local unevenness at the connection between the main beam and the approach bridges. However, these irregularities do not affect the overall accuracy of damage identification.
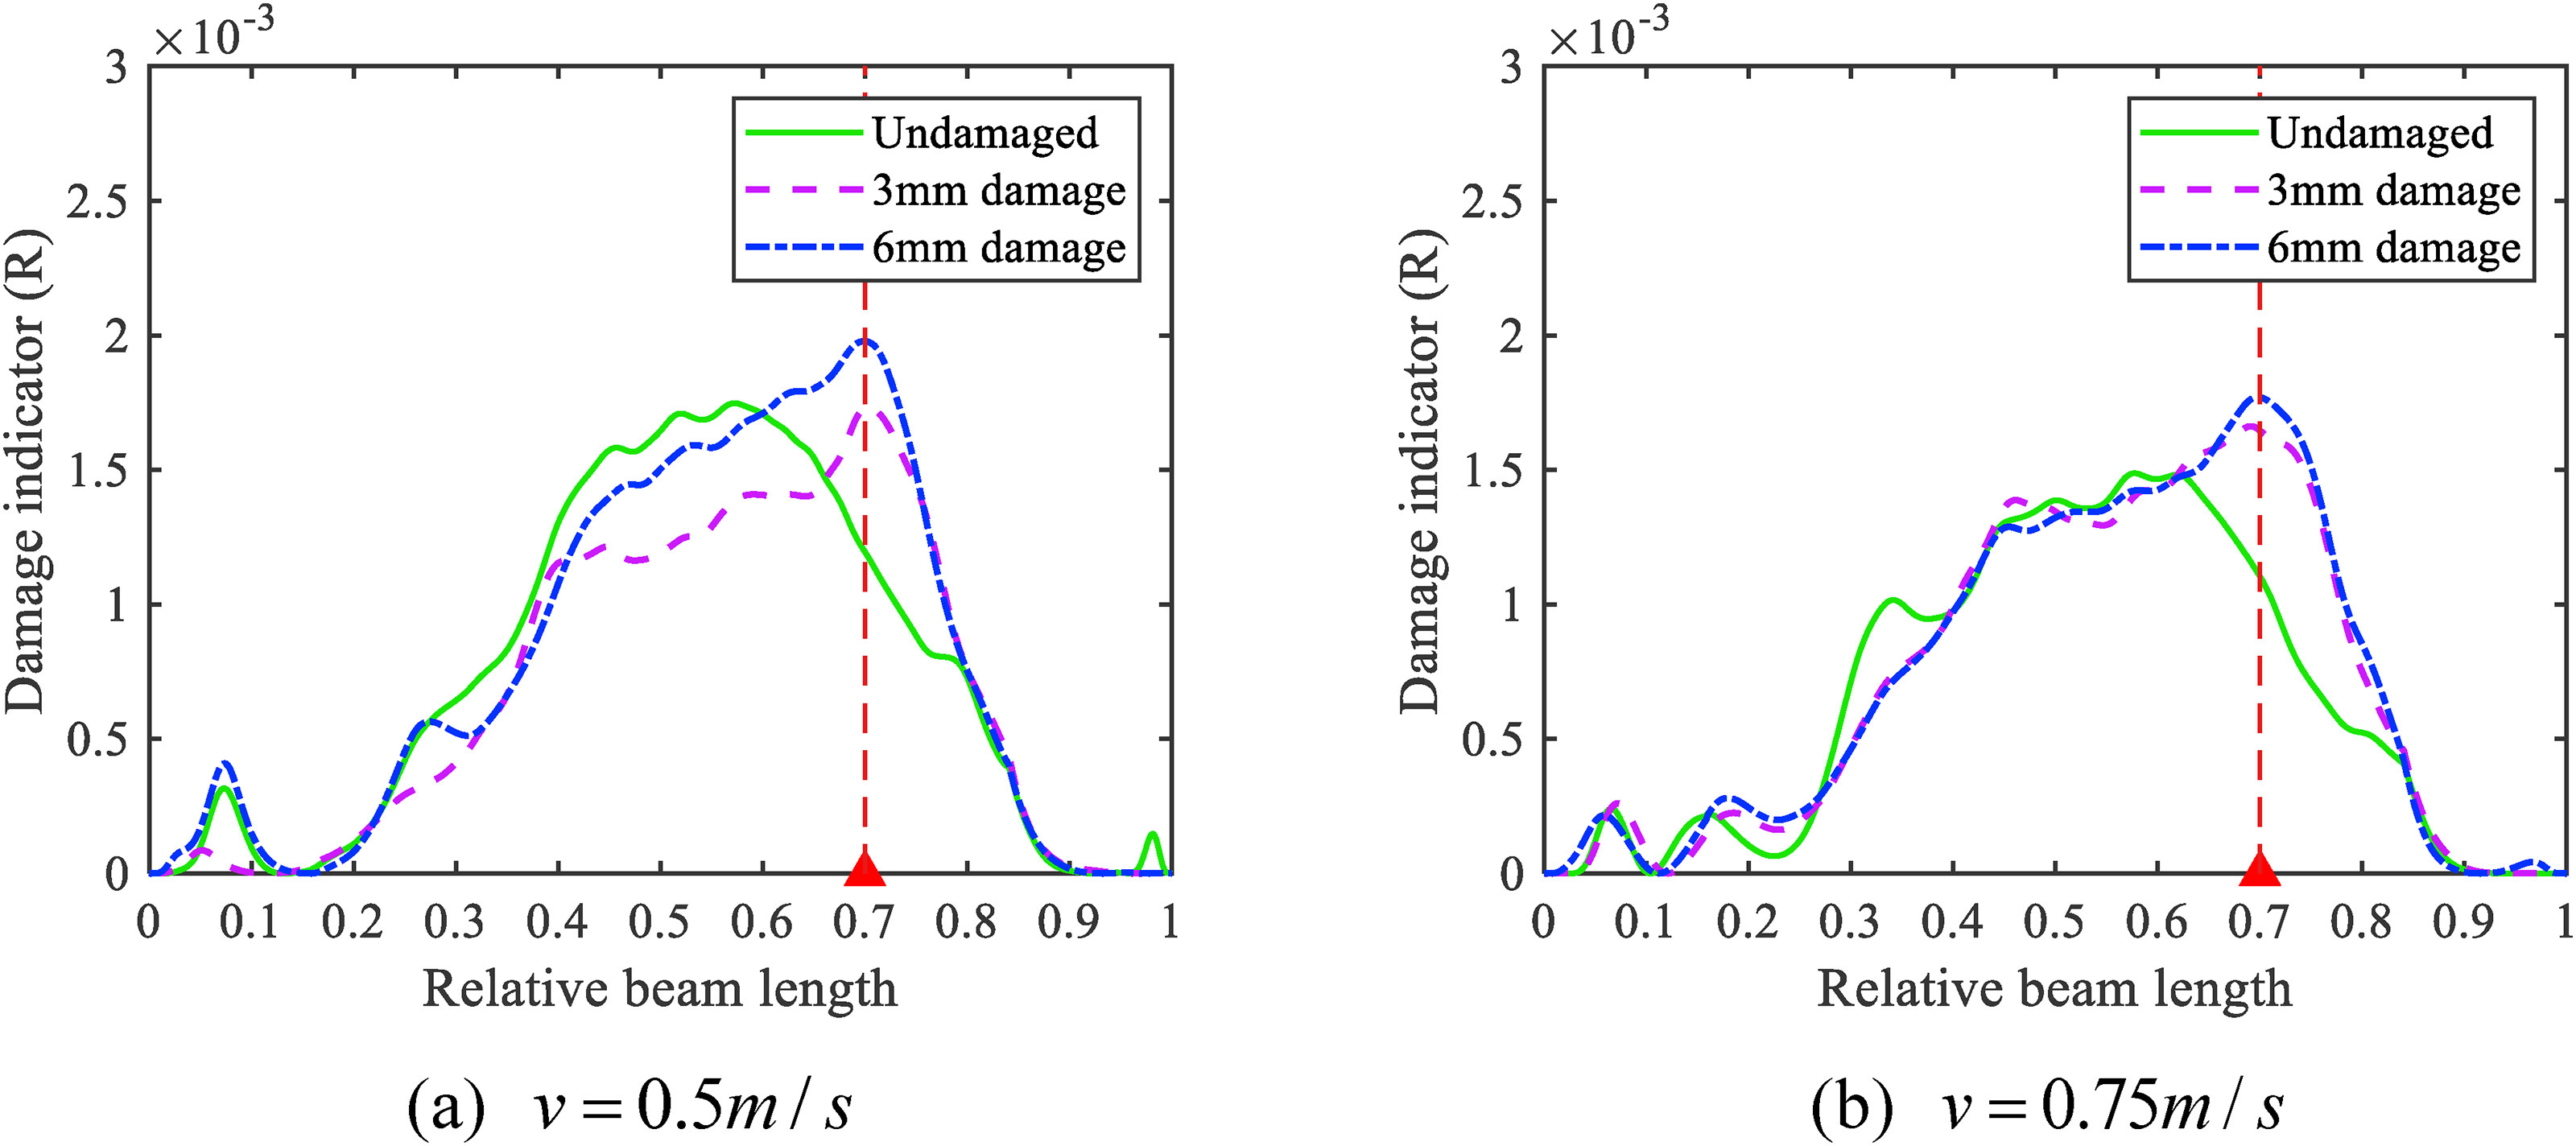
Single damage identification results at different speeds: (a)
A comparison of results across different vehicle speeds demonstrates that the damage indicator curve exhibits more oscillations at the higher speed of 0.75 m/s. Although a higher speed excites a stronger dynamic response, it also reduces the number of effective data samples, leading to poorer identification performance than the case of 0.5 m/s. Therefore, the vehicle speed should not be excessively high.
Double damage identification
In the experimental setup, a fixed-depth damage of 10 mm was introduced at
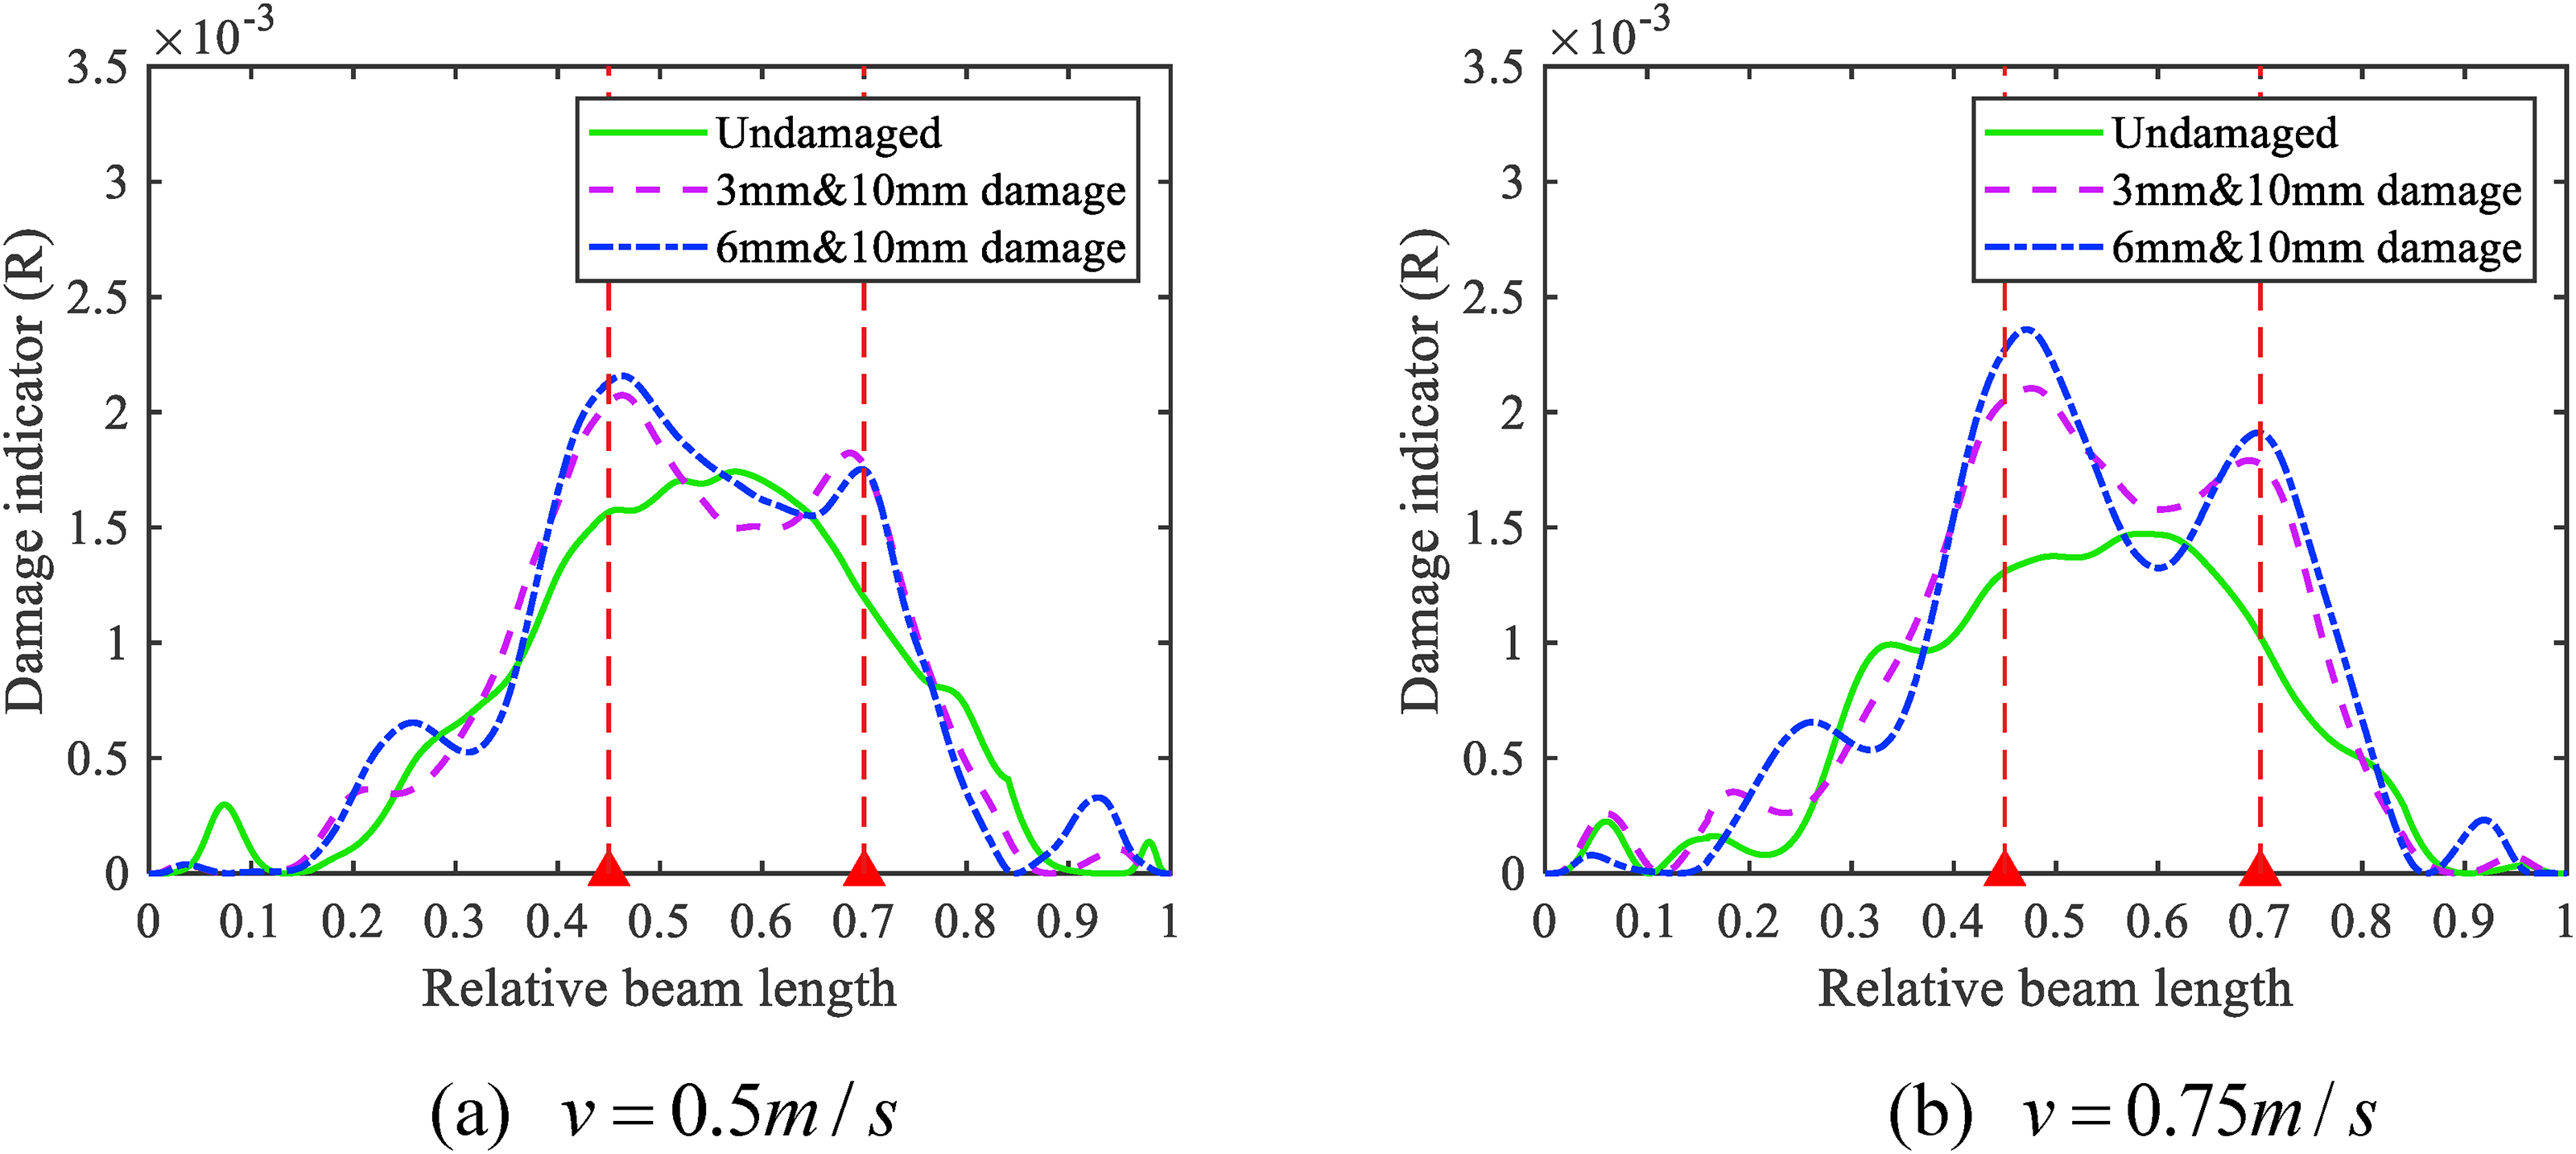
Double damage identification results at different speeds: (a)
Similar to the numerical simulation results, the damage indicator at
Results with fewer sensors
The capability of the proposed technique was further examined under a reduced sensor arrangement from sensors S2 and S4, as shown in Figure 18. The results demonstrate that reducing the number of sensors does not deteriorate the identification performance. The damage localization results obtained using two sensors are nearly identical to those derived from the five-sensor configuration, accurately identifying the damage locations.
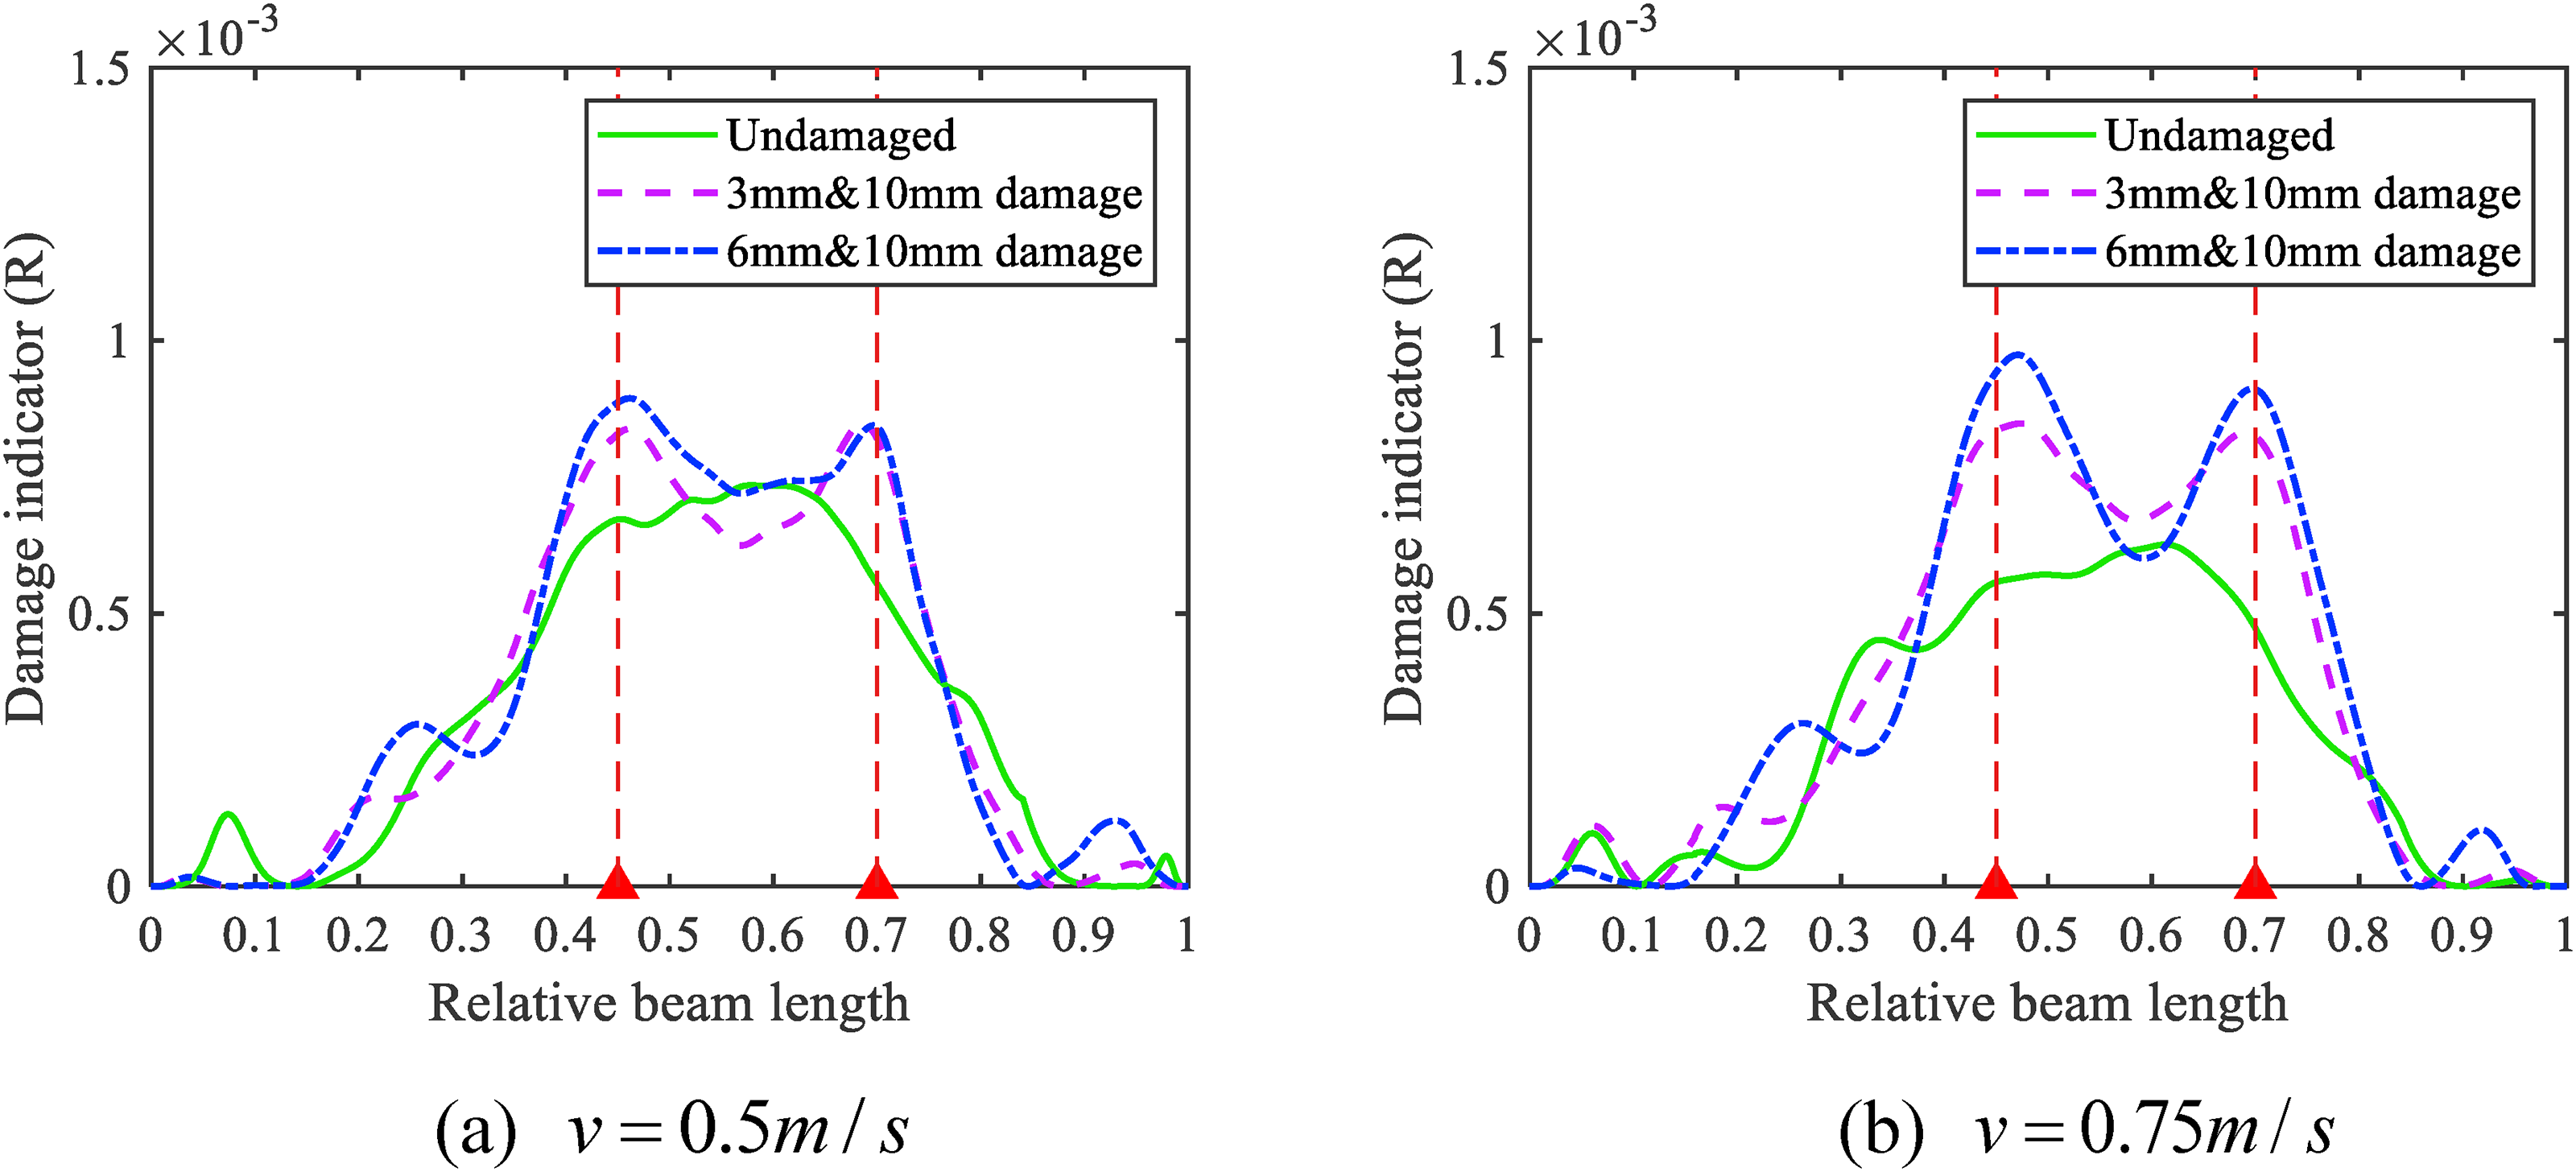
Damage identification results using two sensors: (a)
Unlike Figure 17, the damage indicator at 0.7 in Figure 18 is comparable to that at 0.45, although the latter is closer to the midspan. This can be partly attributed to the greater damage severity at 0.7. More importantly, sensor S4 is positioned closer to the damage location at 0.7, thereby enhancing the accuracy of identification. This finding implies that sensors located nearer to the damage site yield more reliable detection results, providing a useful guideline for sensor placement when only a limited number of sensors are available.
Conclusions
This study proposes a baseline-free damage identification method based on the displacement response of beam bridges subjected to moving vehicle loads. The principal components of the displacement response are extracted and analyzed by applying POD, thereby revealing their intrinsic composition. The analysis demonstrates that the principal component of a damaged structure consists of dynamic, modal, and damage-related components. By isolating the damage component, a damage indicator is constructed to achieve accurate localization of structural damage. The main conclusions are summarized as follows:
The mathematical expression of the principal components of bridge displacement responses under moving loads is derived, and the composition of the principal components for damaged beams is analytically clarified. These components include dynamic, undamaged modal, and damage-related parts. Although the modal and damage components are primarily governed by the moving load frequency, their spectral distributions may differ. The presence of the damage component introduces irregularities into the modal response. This component amplifies local anomalies in the vibration pattern near the damage location, enabling effective damage localization through component separation. The method achieves accurate damage localization using only two sensors, eliminating the need for dense sensor networks used in traditional modal-based approaches. This approach substantially reduces monitoring costs and provides a cost-effective solution for SHM of short- and medium-span bridges. The approach relies solely on response data from the current structural state, without requiring baseline information from the undamaged condition. This technique greatly reduces dependence on historical data and environmental stability, effectively overcoming challenges associated with missing or environmentally degraded reference data.
Nevertheless, the proposed method identifies damage based on the modal-related component contained in the bridge response under moving loads, and its applicability is affected by vehicle operating conditions. The present study mainly considers the case of a vehicle moving at a constant speed, whereas in practical traffic environments, vehicle speed is often random and time-varying. Therefore, the applicability of the proposed method under variable-speed conditions still requires further investigation.
In addition, the damage-related component is a very low-frequency and weak signal, and its extraction largely depends on the effectiveness of the signal separation technique. This limitation is particularly evident in the case of very slight damage, for which the sensitivity remains limited. In future work, the integration of more accurate signal separation techniques may further improve the efficiency and accuracy of damage identification.
Footnotes
Acknowledgements
The authors are grateful for the financial support from the National Natural Science Foundation of China (Nos. 52178289 and 52508347), and the Fundamental Research Funds for the Central Universities (No. 21625325). However, the findings and opinions expressed here are those of the authors alone and not necessarily the views of the sponsors.
Author contributions
Enguo Guo: writing–methodology, original draft, data curation, and software. Yuming Lin: writing–original draft, data curation, and formal analysis. Zimo Zhu: writing–review and editing, supervision, and funding acquisition. Hongwei Ma and Jun Li: writing–review and editing, validation. Zhenhua Nie: conceptualization, validation, writing–review and editing, supervision, and funding acquisition.
Funding
The authors disclosed receipt of the following financial support for the research, authorship, and/or publication of this article: This work was supported by the National Natural Science Foundation of China, Fundamental Research Funds for the Central Universities (grant numbers 52178289, 52508347, and 21625325).
Declaration of conflicting interests
The authors declared no potential conflicts of interest with respect to the research, authorship, and/or publication of this article.
Data availability statement
Data will be made available on request.