
Abstract
Rock masses are inhomogeneous, fractured, anisotropic, and initially stressed in their natural state. They consist of intact rock or rock monolith and macro-damages, which include fractures, bedding planes, faults and other forms of discontinuity. It has been experimentally confirmed that with the increase of the rock mass scale, the mechanical properties of the rock mass decrease as a consequence of discontinuities. The subject of this paper is the analysis and determination of the scale effect on the damage plasticity model parameters, which describe the mechanical behaviour of the rock mass for different loads and scales. The scale effect is analysed on a constitutive model that can simulate the most complex mechanical behaviours in rock masses (elasto-plastic with damage in stiffness and strength). The analysis is based on the results of experimental tests of rock mass, which were carried out for different scales (scale of the rock mass sample in laboratory and scale of the in situ test – shear test), while the tests were performed at the same microlocation. For the considered experimental tests, appropriate finite element models (FEMs) were formed with boundary conditions that correspond to the ones from the experiments. By simulating the performed experiments with a series of FEM analyses with complex optimization algorithms, the parameters of damage plasticity model were determined for both values of the rock mass scale, proving the scale effect numerically. Based on the obtained results, analysis and discussion of the scale effect for a given rock mass were performed.
Introduction
Rock masses are inhomogeneous, fractured, anisotropic, and initially stressed geological media. They consist of intact rock mass and various types of discontinuities, such as fractures, bedding planes, faults, and joints. The spatial distribution of these discontinuities is typically irregular, resulting in pronounced anisotropy, heterogeneity, and complex mechanical behaviour. As a result, the mechanical response of a rock mass differs significantly from that of intact rock. One of the key phenomena governing this difference is the scale effect, which describes the dependence of the mechanical properties of a rock mass on the size of the investigated domain. Experimental evidence consistently shows that increasing the scale of observation leads to a reduction in mechanical strength due to the increasing influence of discontinuities.
The scale effect has been extensively investigated through laboratory testing on specimens of different sizes and in situ experiments at different observation scales. Early studies established the fundamental trend of strength reduction with increasing scale. Bieniawski (1968) demonstrated a decrease in uniaxial compressive strength of coal with increasing specimen size. Subsequent research extended these observations from intact rock to rock mass behaviour and discontinuities. Muralha and Da Cunha (1990) compared laboratory shear tests with in situ tests on an arch dam foundation in Portugal and reported significantly lower peak shear strength at the field scale. In a similar direction, Barton (2013), among others, analyzed the scale dependence of shear strength of rock discontinuities, showing that both peak and residual strengths decrease with increasing scale. It has also been shown that shear strength along discontinuities is strongly influenced by surface roughness and infill material, while purely frictional resistance is less sensitive to scale effects. Da Cunha and Muralha (1990) further demonstrated a reduction in deformation modulus with increasing scale.
In parallel with experimental investigations, several authors have proposed empirical and semi-empirical relationships to estimate rock mass strength from intact rock properties and discontinuity characteristics. Goldstein et al. (1966) and Pinto da Cunha (1990), among others, contributed early formulations linking rock mass behaviour to measurable small-scale parameters. More recent approaches incorporate scale effects directly into constitutive formulations. Masoumiet al. (2016) directly incorporated the scale effect into a constitutive model proposed by Christensen (2000) through parameters that correlate uniaxial compressive and tensile strength with sample size. Barton and Bandis (1982) introduced a yield function correction for discontinuities, accounting for the scale of discontinuities in situ. Geomechanical classification systems such as RMR, GSI, and Q are widely used in engineering practice and, although not explicitly scale-dependent, implicitly reflect the scale of engineering structures through their empirical correlations with rock mass properties. Geomechanical classifications are often correlated with failure criteria for rock masses, such as the Hoek-Brown constitutive model or the model proposed by Aubertin, Li and Simon (2000), where parameters from the yield function are correlated with parameters from the GSI classification, indirectly introducing the scale effect into the yield condition. Numerical studies by Gaoet al. (2014), Wang et al. (2016), and Chen et al. (2011) further confirm the reduction of rock mass strength with increasing scale and highlight the role of fracture density and distribution.
(1) Regarding the scale effect, there are different approaches in the case of the analysis of the scale effect in concrete, such as the method presented by Van Mier and Man (2008) and by Yu, Jin and Du (2023), in which different experimental and numerical methods for identifying the scale effect in concrete are presented. Like the scale effect observed in rock masses or concrete, the performance of geotechnical composite materials also significantly depends on the interaction between the microstructure and field conditions. Sun et al. (2026) demonstrated that variations in the composition, gradation, and application conditions of modified synchronous grouting materials lead to significant changes in the mechanical characteristics and system behaviour under real field conditions, indicating a pronounced dependence of performance on system scale and heterogeneity. Han et al. (2025) showed that the mechanical response of the grout–soil interface is significantly influenced by specimen dimensions and interface heterogeneity, with both peak and residual shear strengths decreasing as the specimen height increases.
Despite extensive research, the quantification of scale effects remains challenging due to the complexity of discontinuity networks and the limited availability of consistent multi-scale datasets. This makes it difficult to establish unified mechanical parameters valid across different scales.
(2) The present study aims to identify the parameters of a damage–plasticity model through the application of advanced optimization algorithms integrated with a finite element model (FEM) framework. The FEM model was developed to simulate both laboratory (small-scale) and in situ (large-scale) tests conducted on the same rock mass. The scale effect is investigated using a constitutive model capable of capturing the complex mechanical behaviour of rock masses, including elastoplastic response with degradation of stiffness and strength. The analysis relies on experimental data obtained at different scales, encompassing both rock mass specimens and in situ testing at the same micro-location. For each experimental configuration, corresponding FEM models were established with boundary conditions consistent with the testing conditions. The integration of numerical simulations, experimental results, and optimization procedures enabled the identification of damage–plasticity model parameters for both considered scales. The results provide a basis for evaluating and discussing the scale effect in the analyzed rock mass.
Experimental research
Within this section, experimental tests of the rock mass are presented, based on which numerical and scale effect analysis were performed. The results of tests on the rock mass in the exploratory gallery of the future gravity concrete dam “Pošćenje” in Bosnia and Herzegovina are available, namely in situ shear test and uniaxial compression test with unloading on the rock mass sample. Considering the scale effect analysis, these experiments are representative because they were performed at the same location and corespond to different values of the observation scale.
Uniaxial compression test with unloading
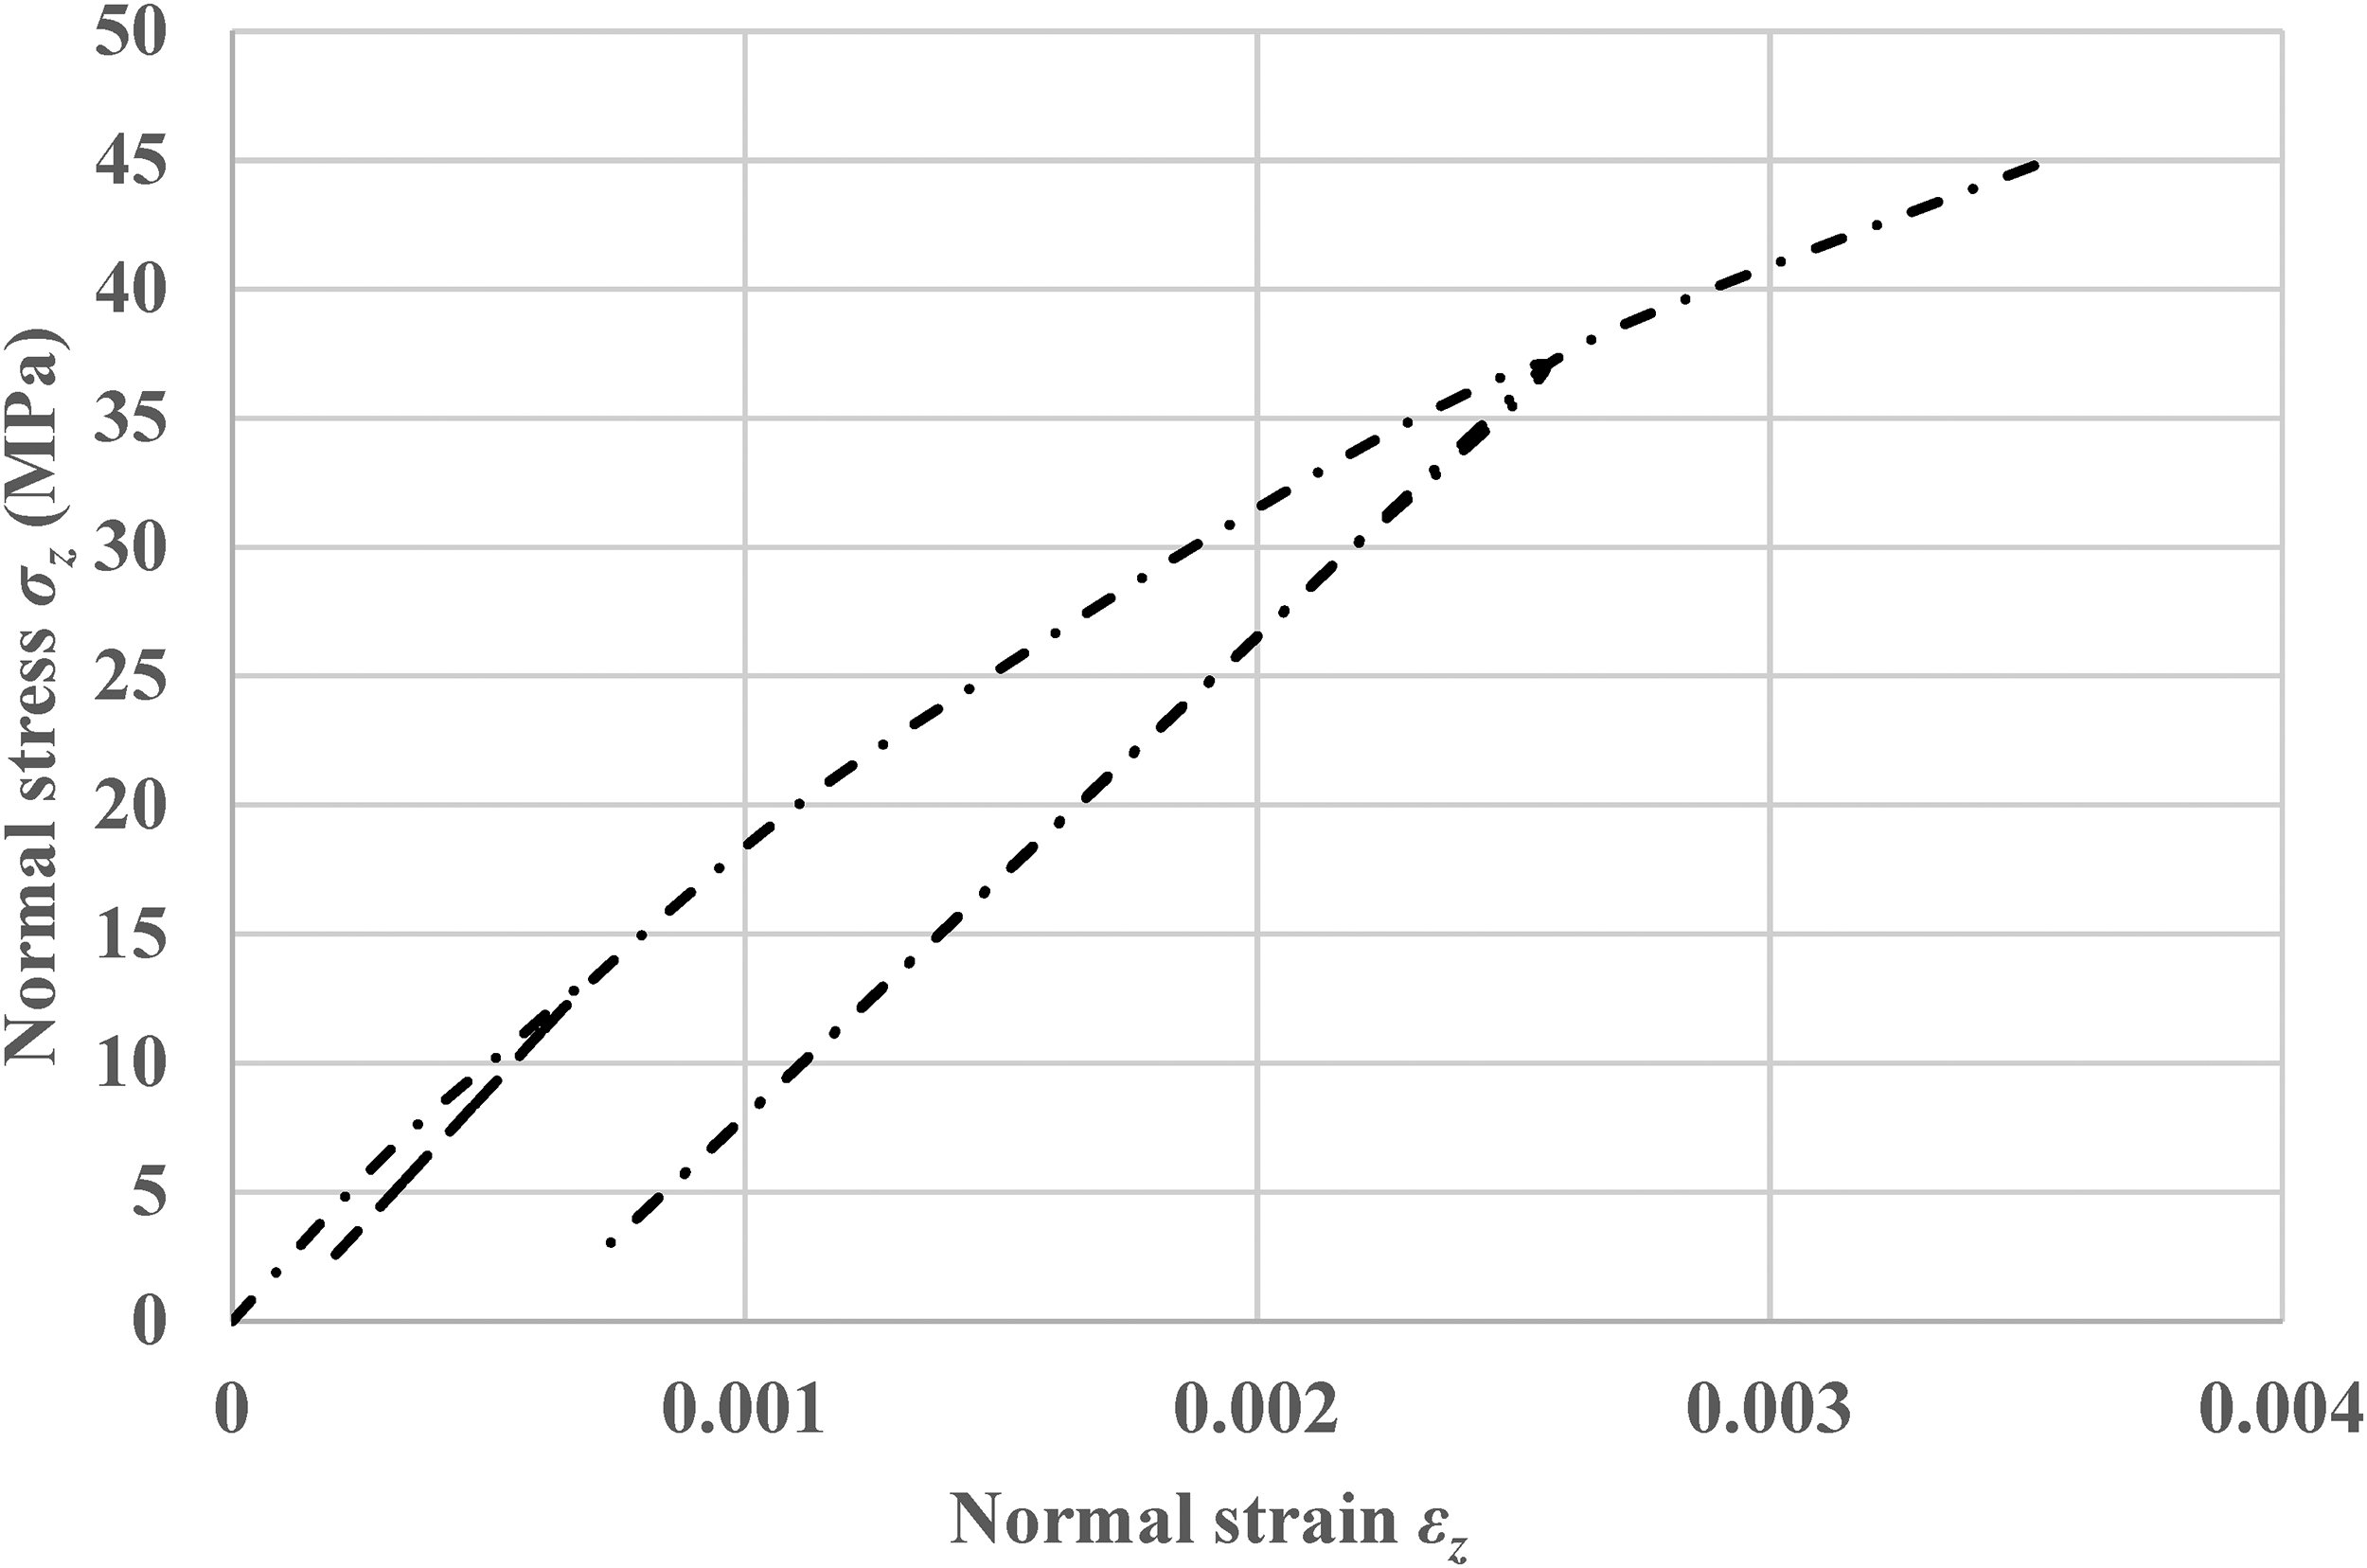
Uniaxial compression test with unloading is performed on the rock mass samples according to the recommendations of ISRM.31 The values of compressive strength and modulus of elasticity of the rock mass samples are obtained with this test. Often, testing of rock mass samples is carried out in cycles of loading and unloading with deformation measurements so that elastic and plastic deformations can be separated. At the location in question, the experiment was performed with two cycles of loading and unloading, and in the third cycle the sample was brought to failure. In Figure 1, the layout of the test and loading scheme is presented. In Figure 2 the normal stress – normal strain diagram, which was obtained based on the test results of the rock mass sample for all levels of the specified normal stresses is shown.
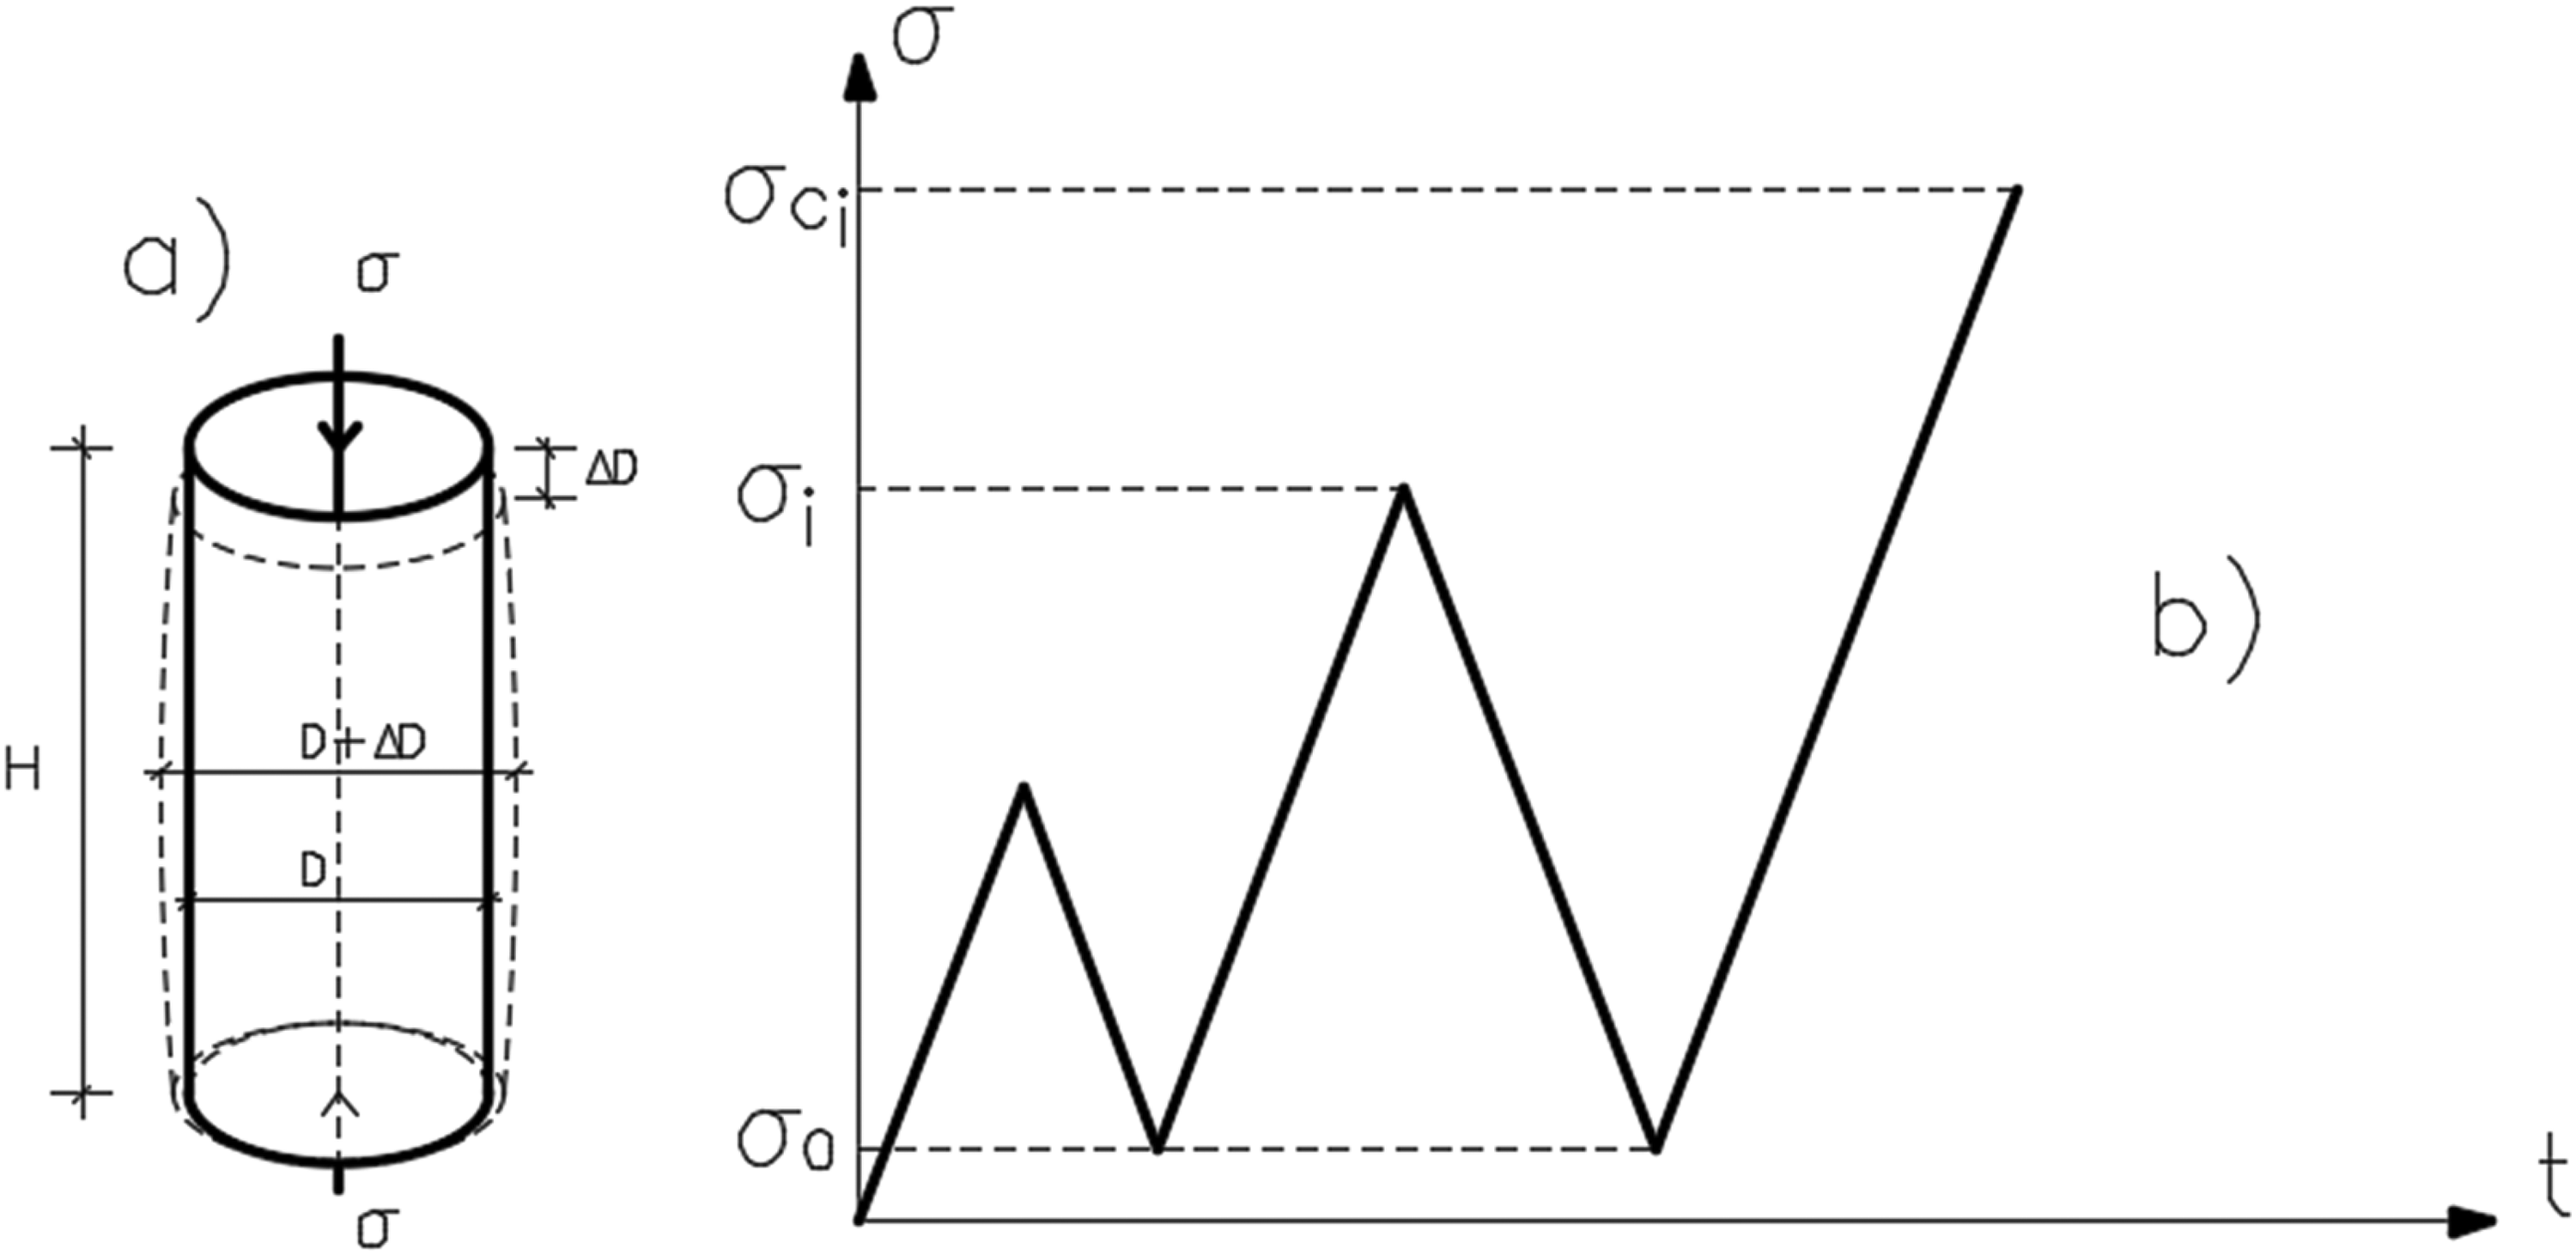
(a) Layout of uniaxial compression test, (b) Load scheme of the rock mass sample under uniaxial cyclic compression with loading to failure.
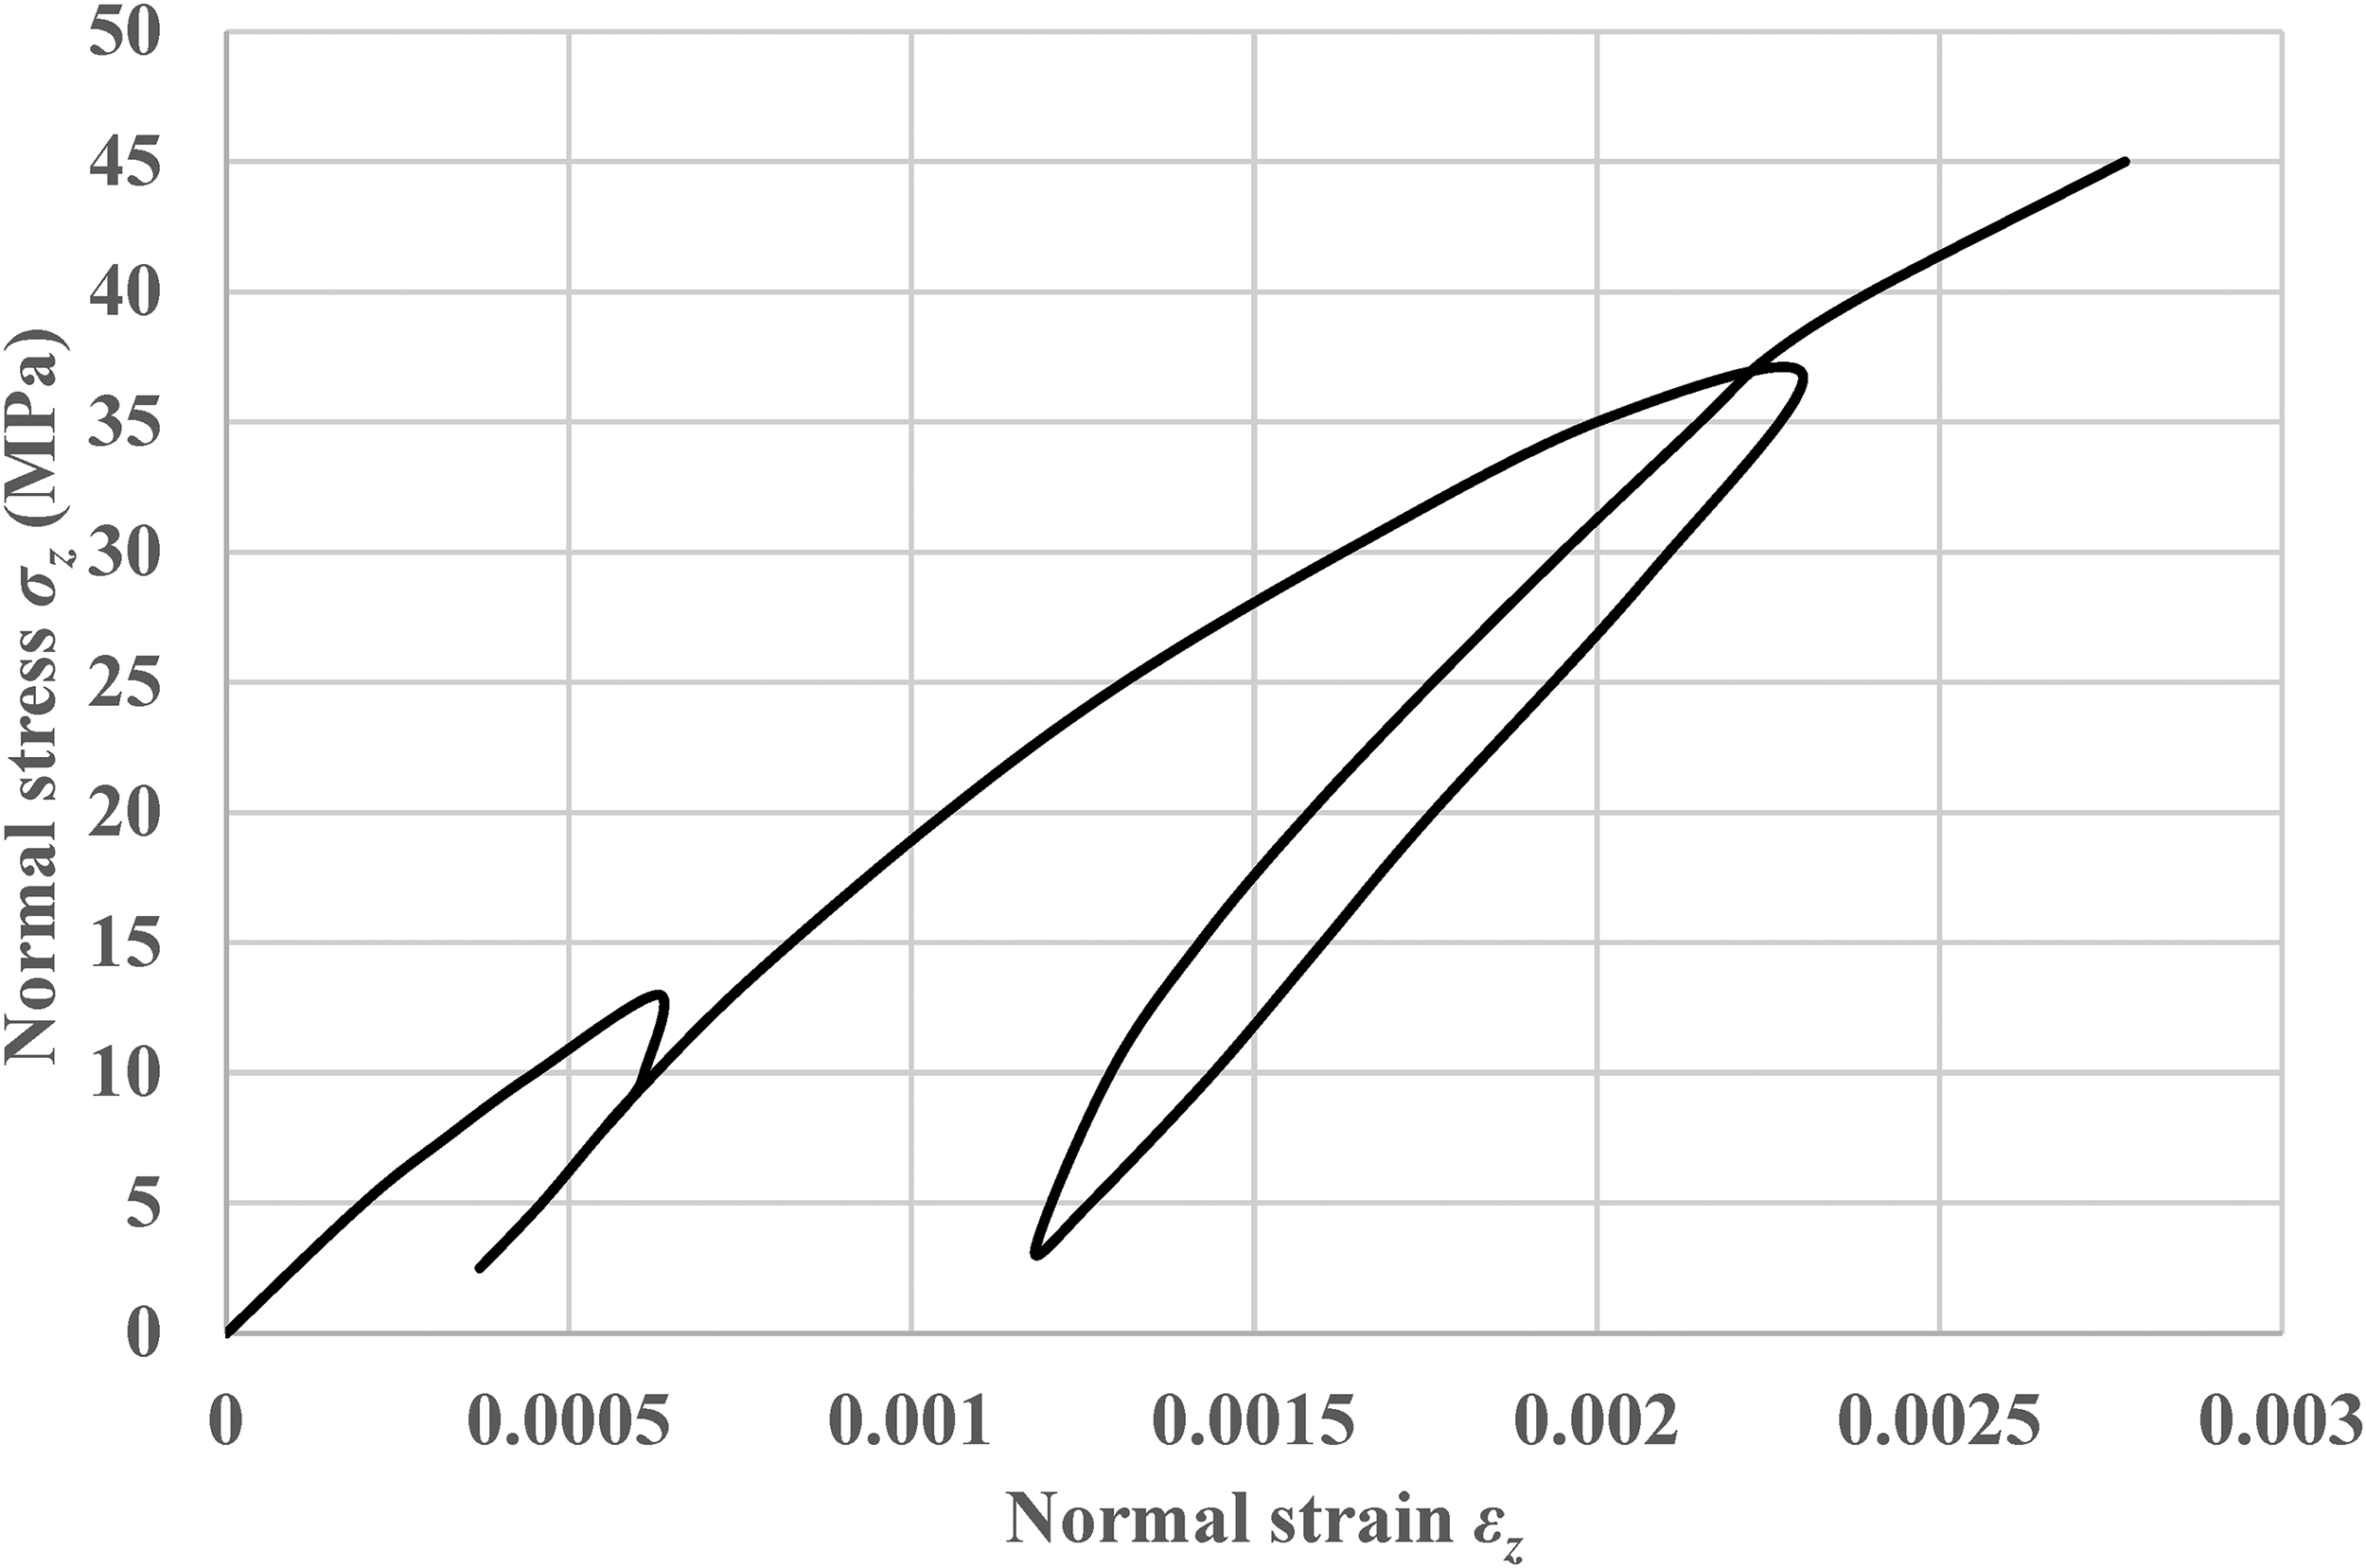
Uniaxial cyclic compression test: normal stress – normal strain.
In situ shear test
In situ shear test is performed with the aim of determining mechanical properties of the rock mass for which failure occurs. During the test, normal and shear stress are applied. Load on the rock mass is applied via a concrete block. In Figure 3 the layout and scheme of shear test are given.
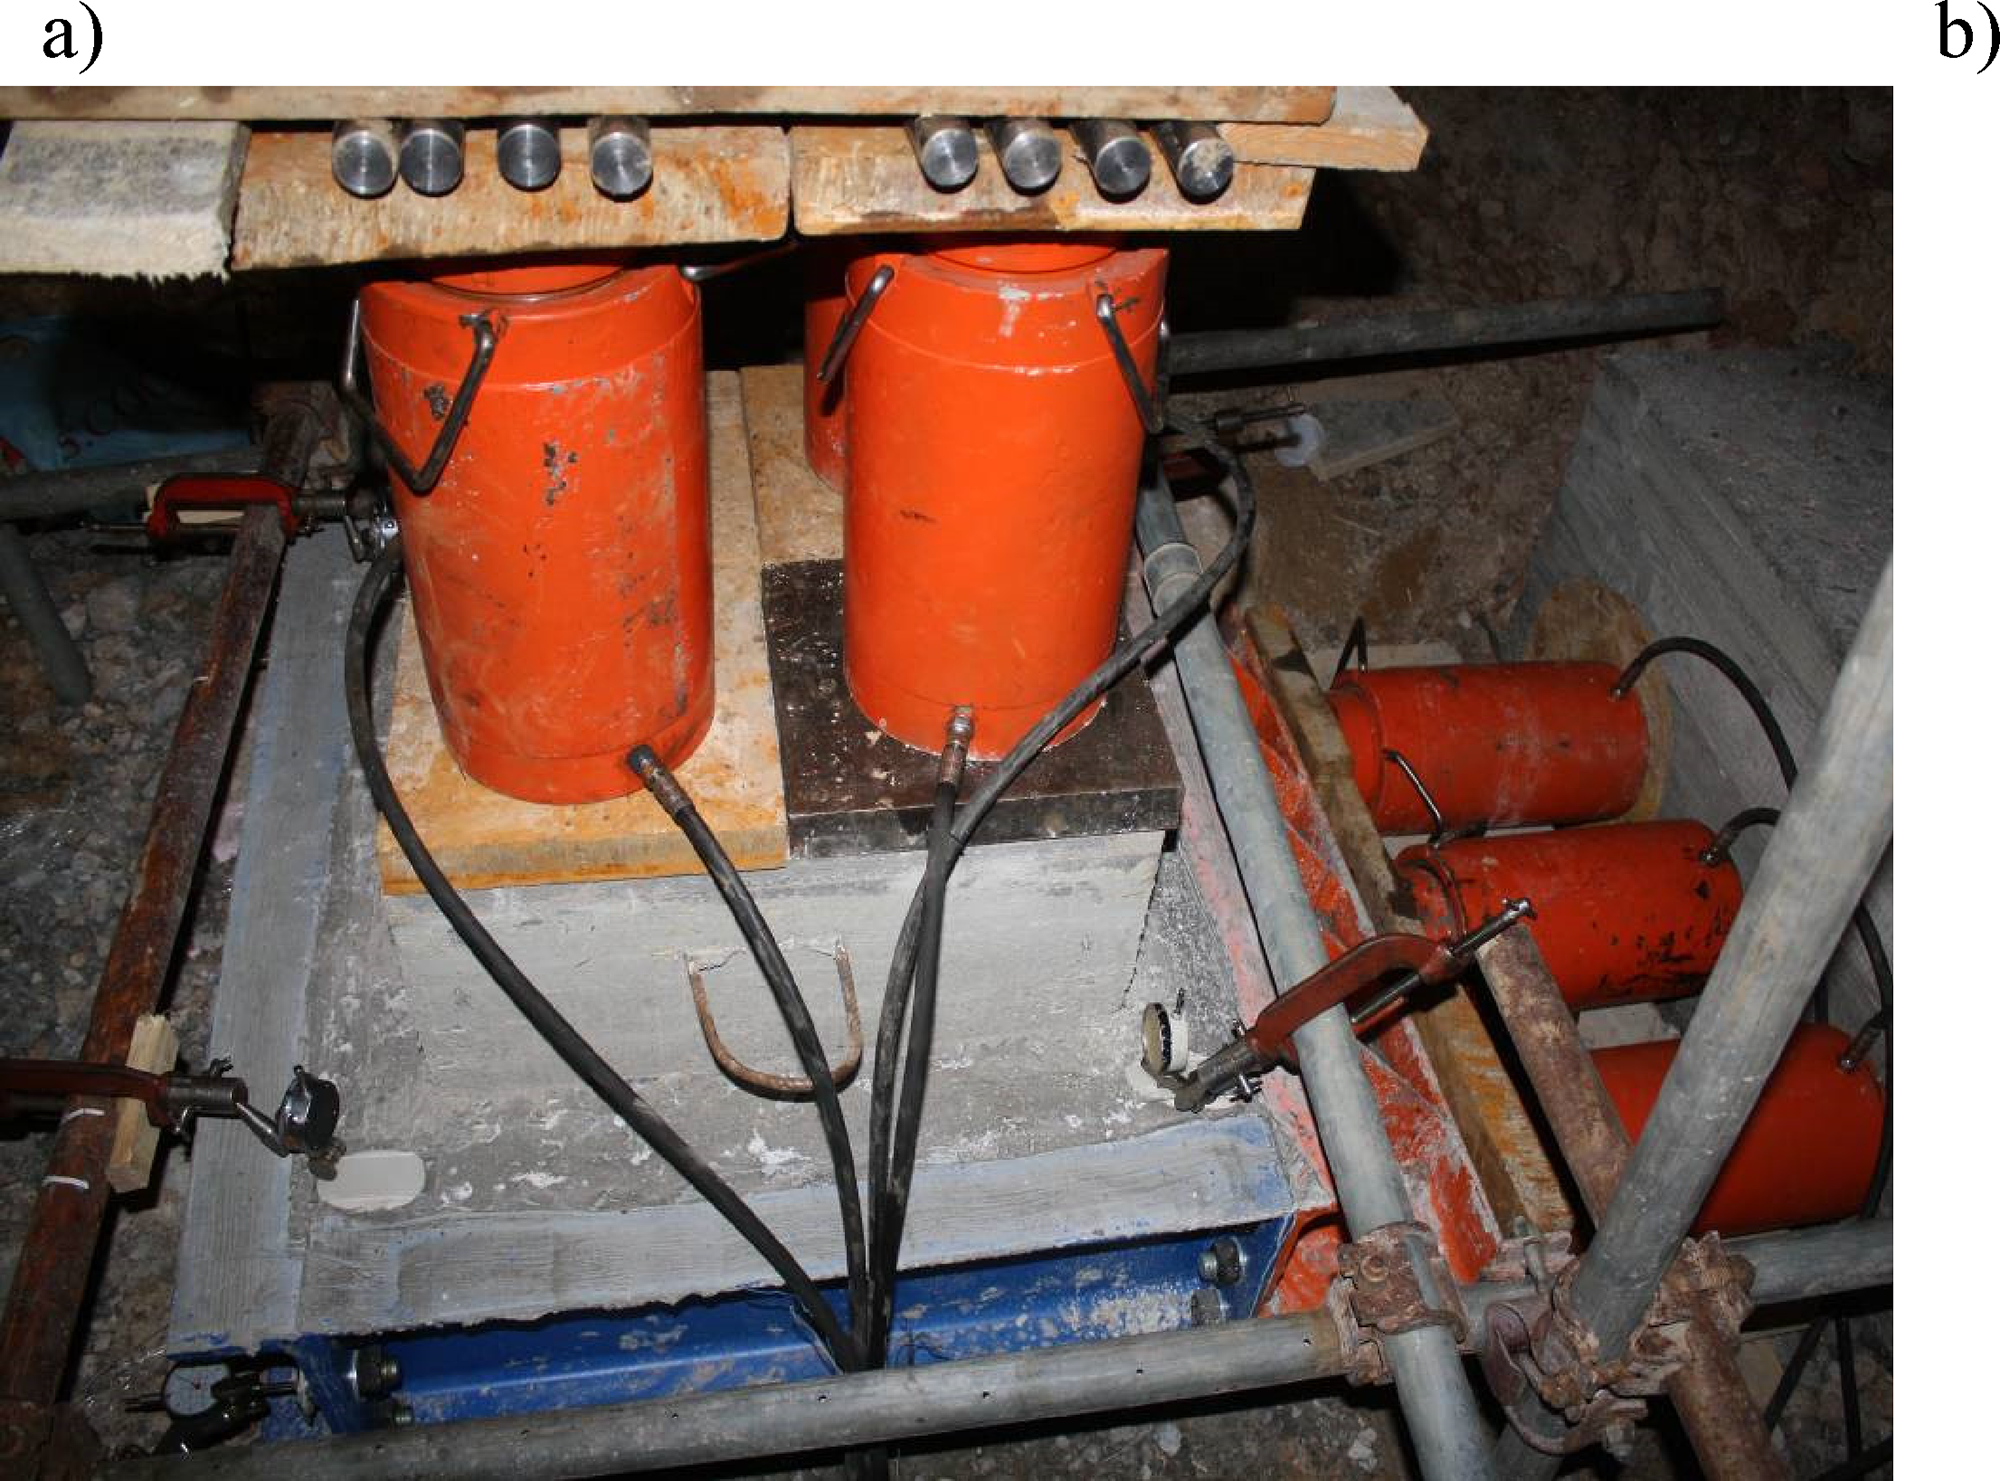
(a) Field shear test setup (photograph) and (b) Shear test configuration (schematic).
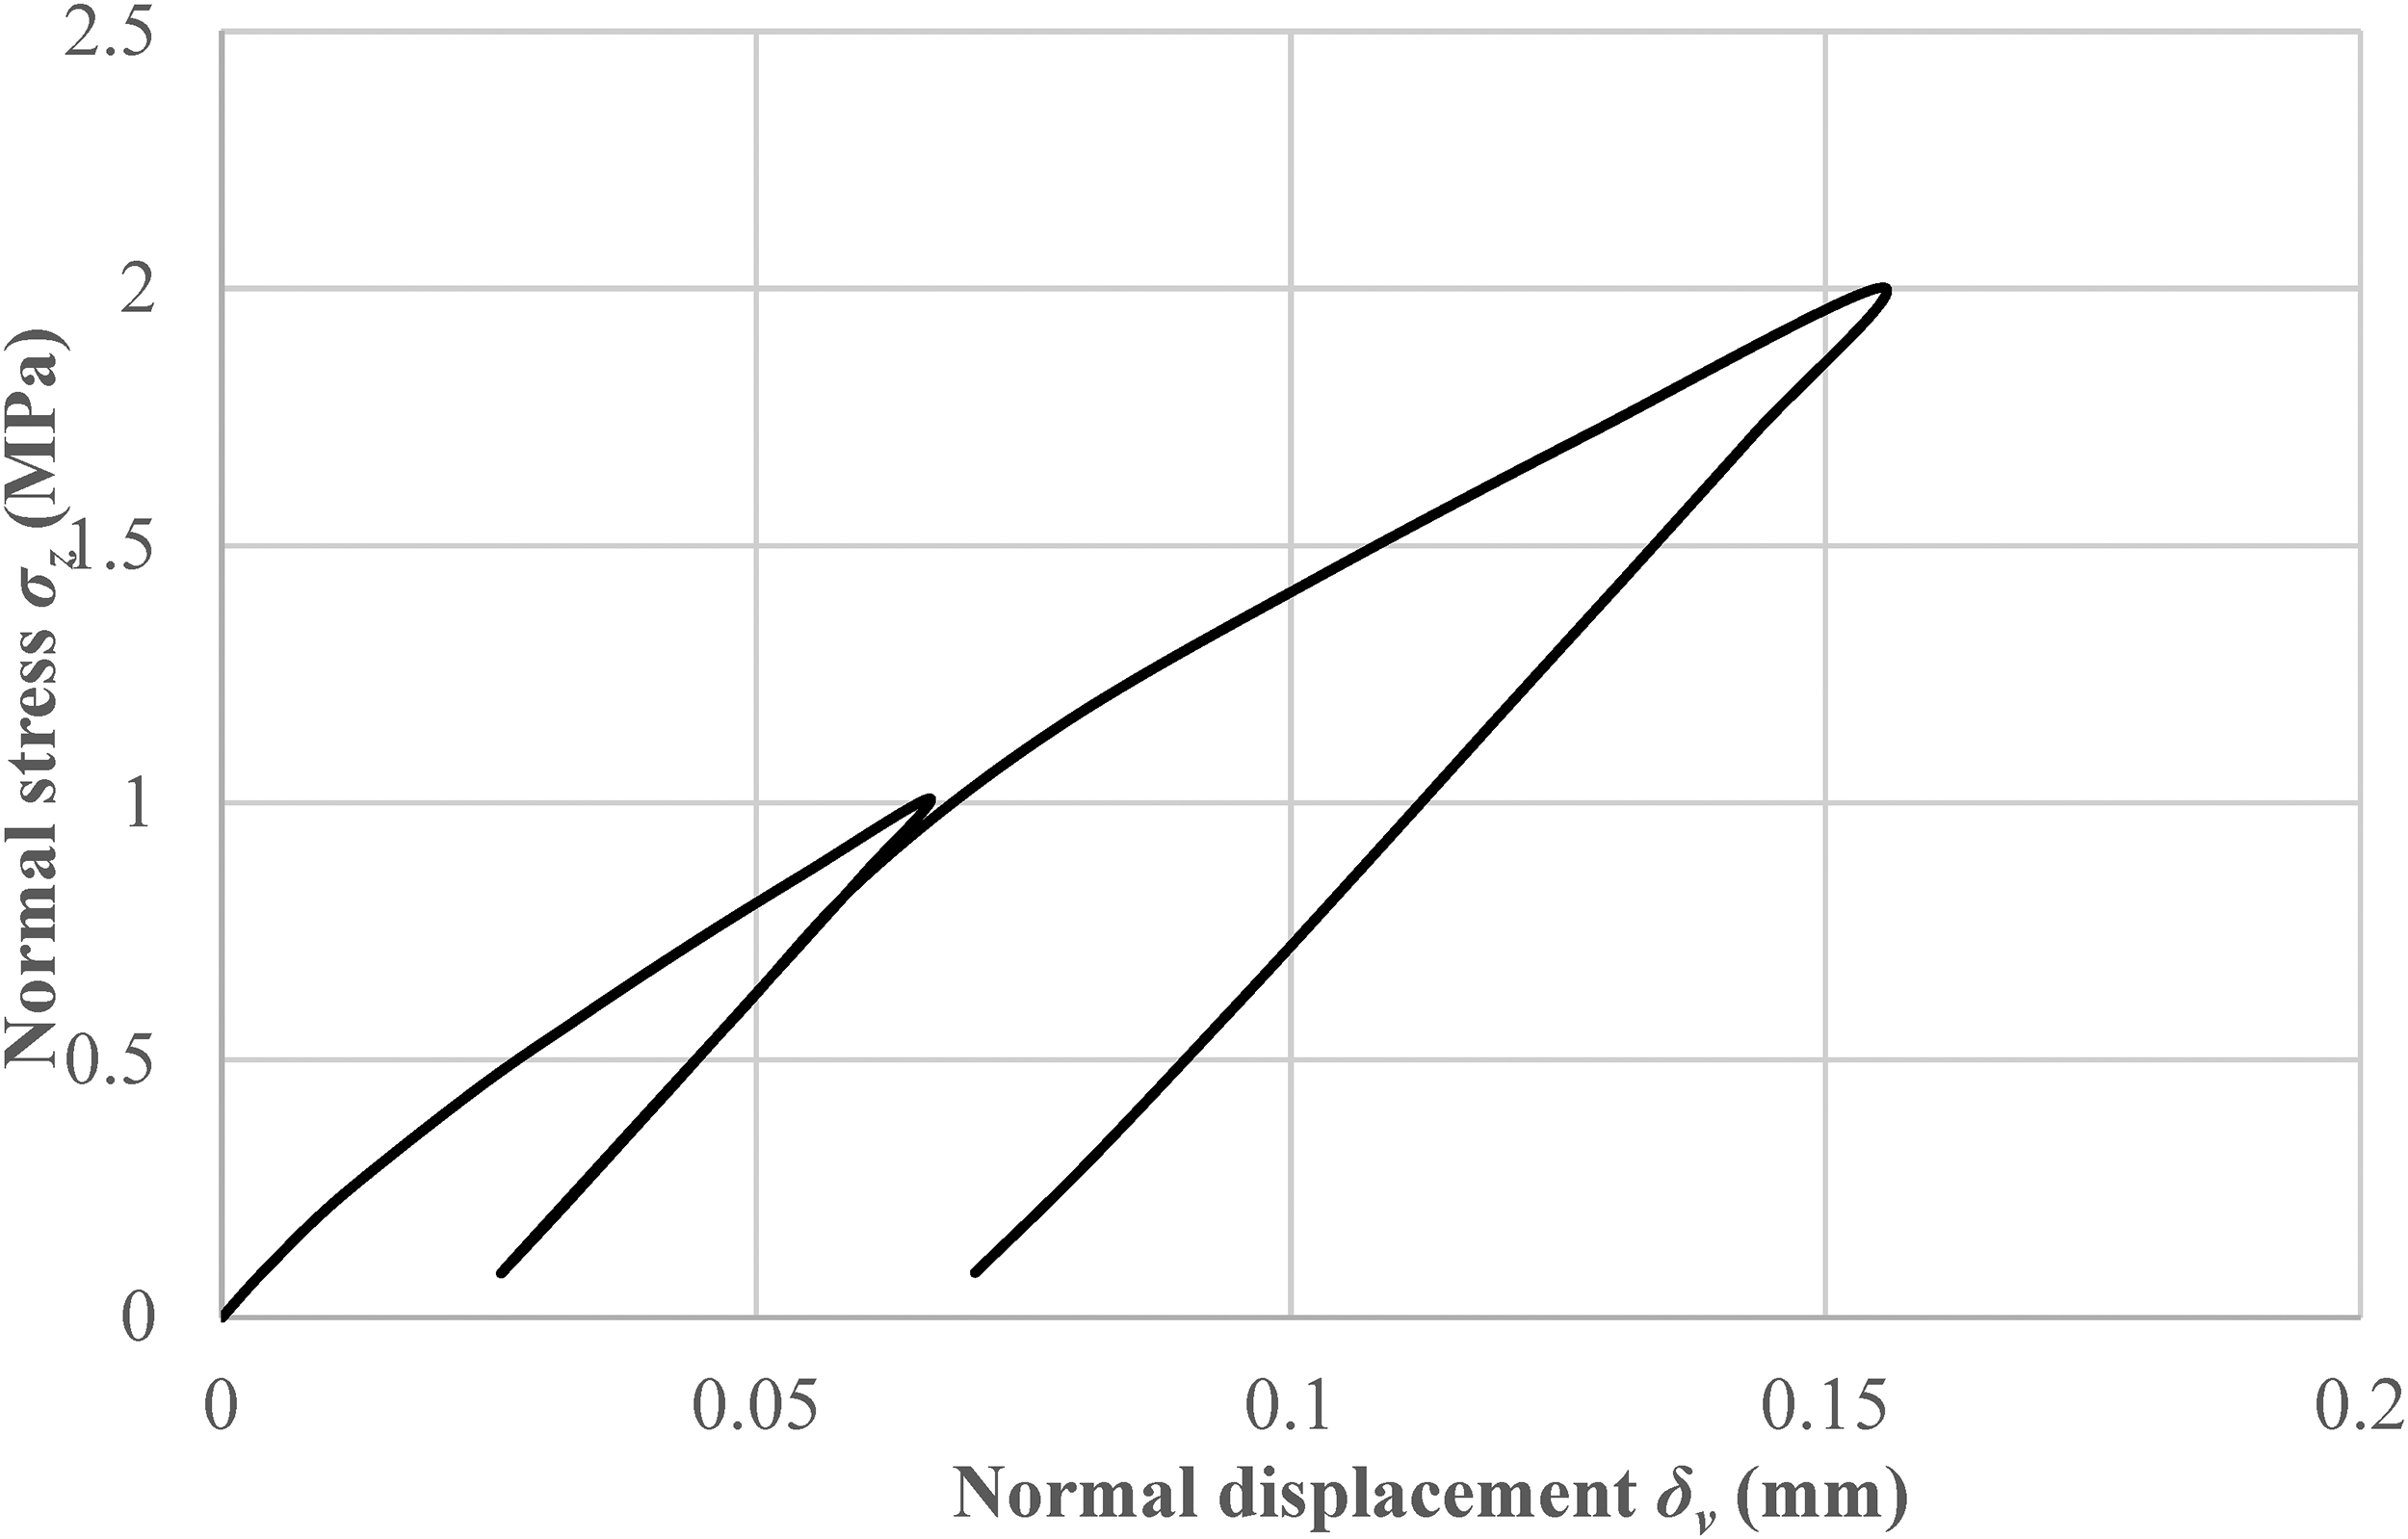
At the specific location, the test was performed by first applying normal stress in two loading–unloading cycles, followed by the application of constant shear stress. When normal stress is applied (Figure 4), normal displacements (
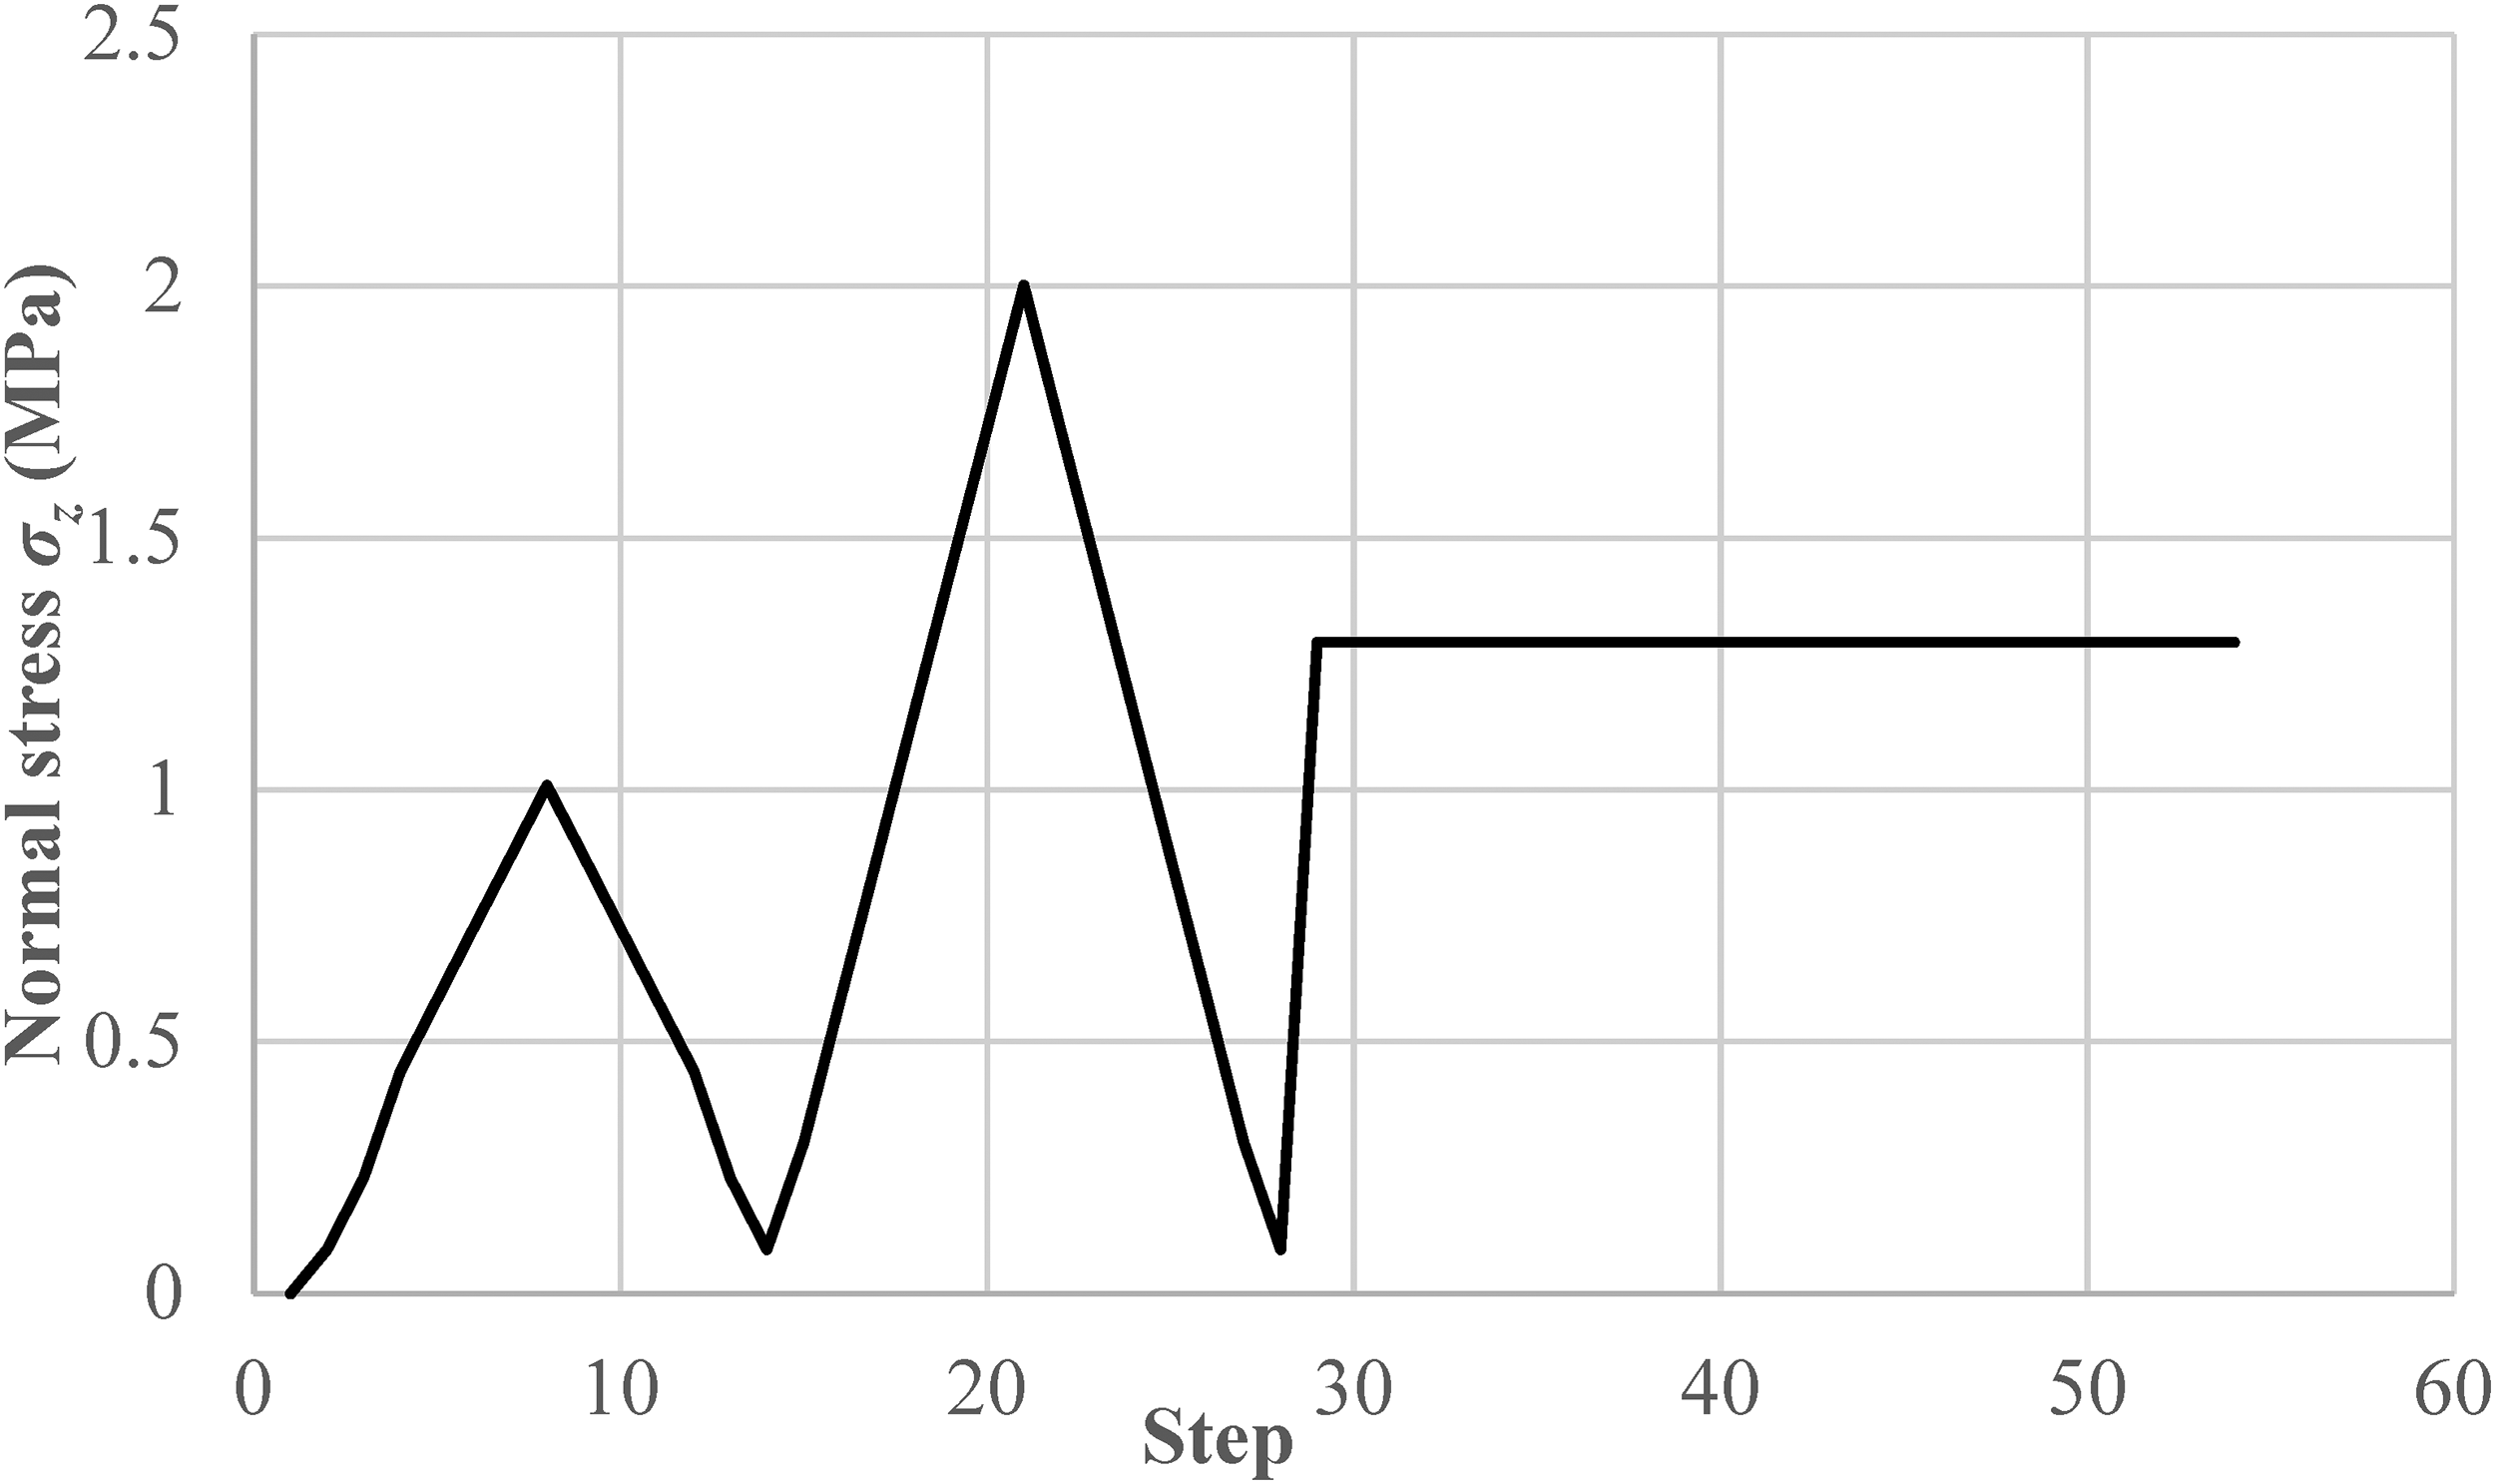
Normal stress loading function.
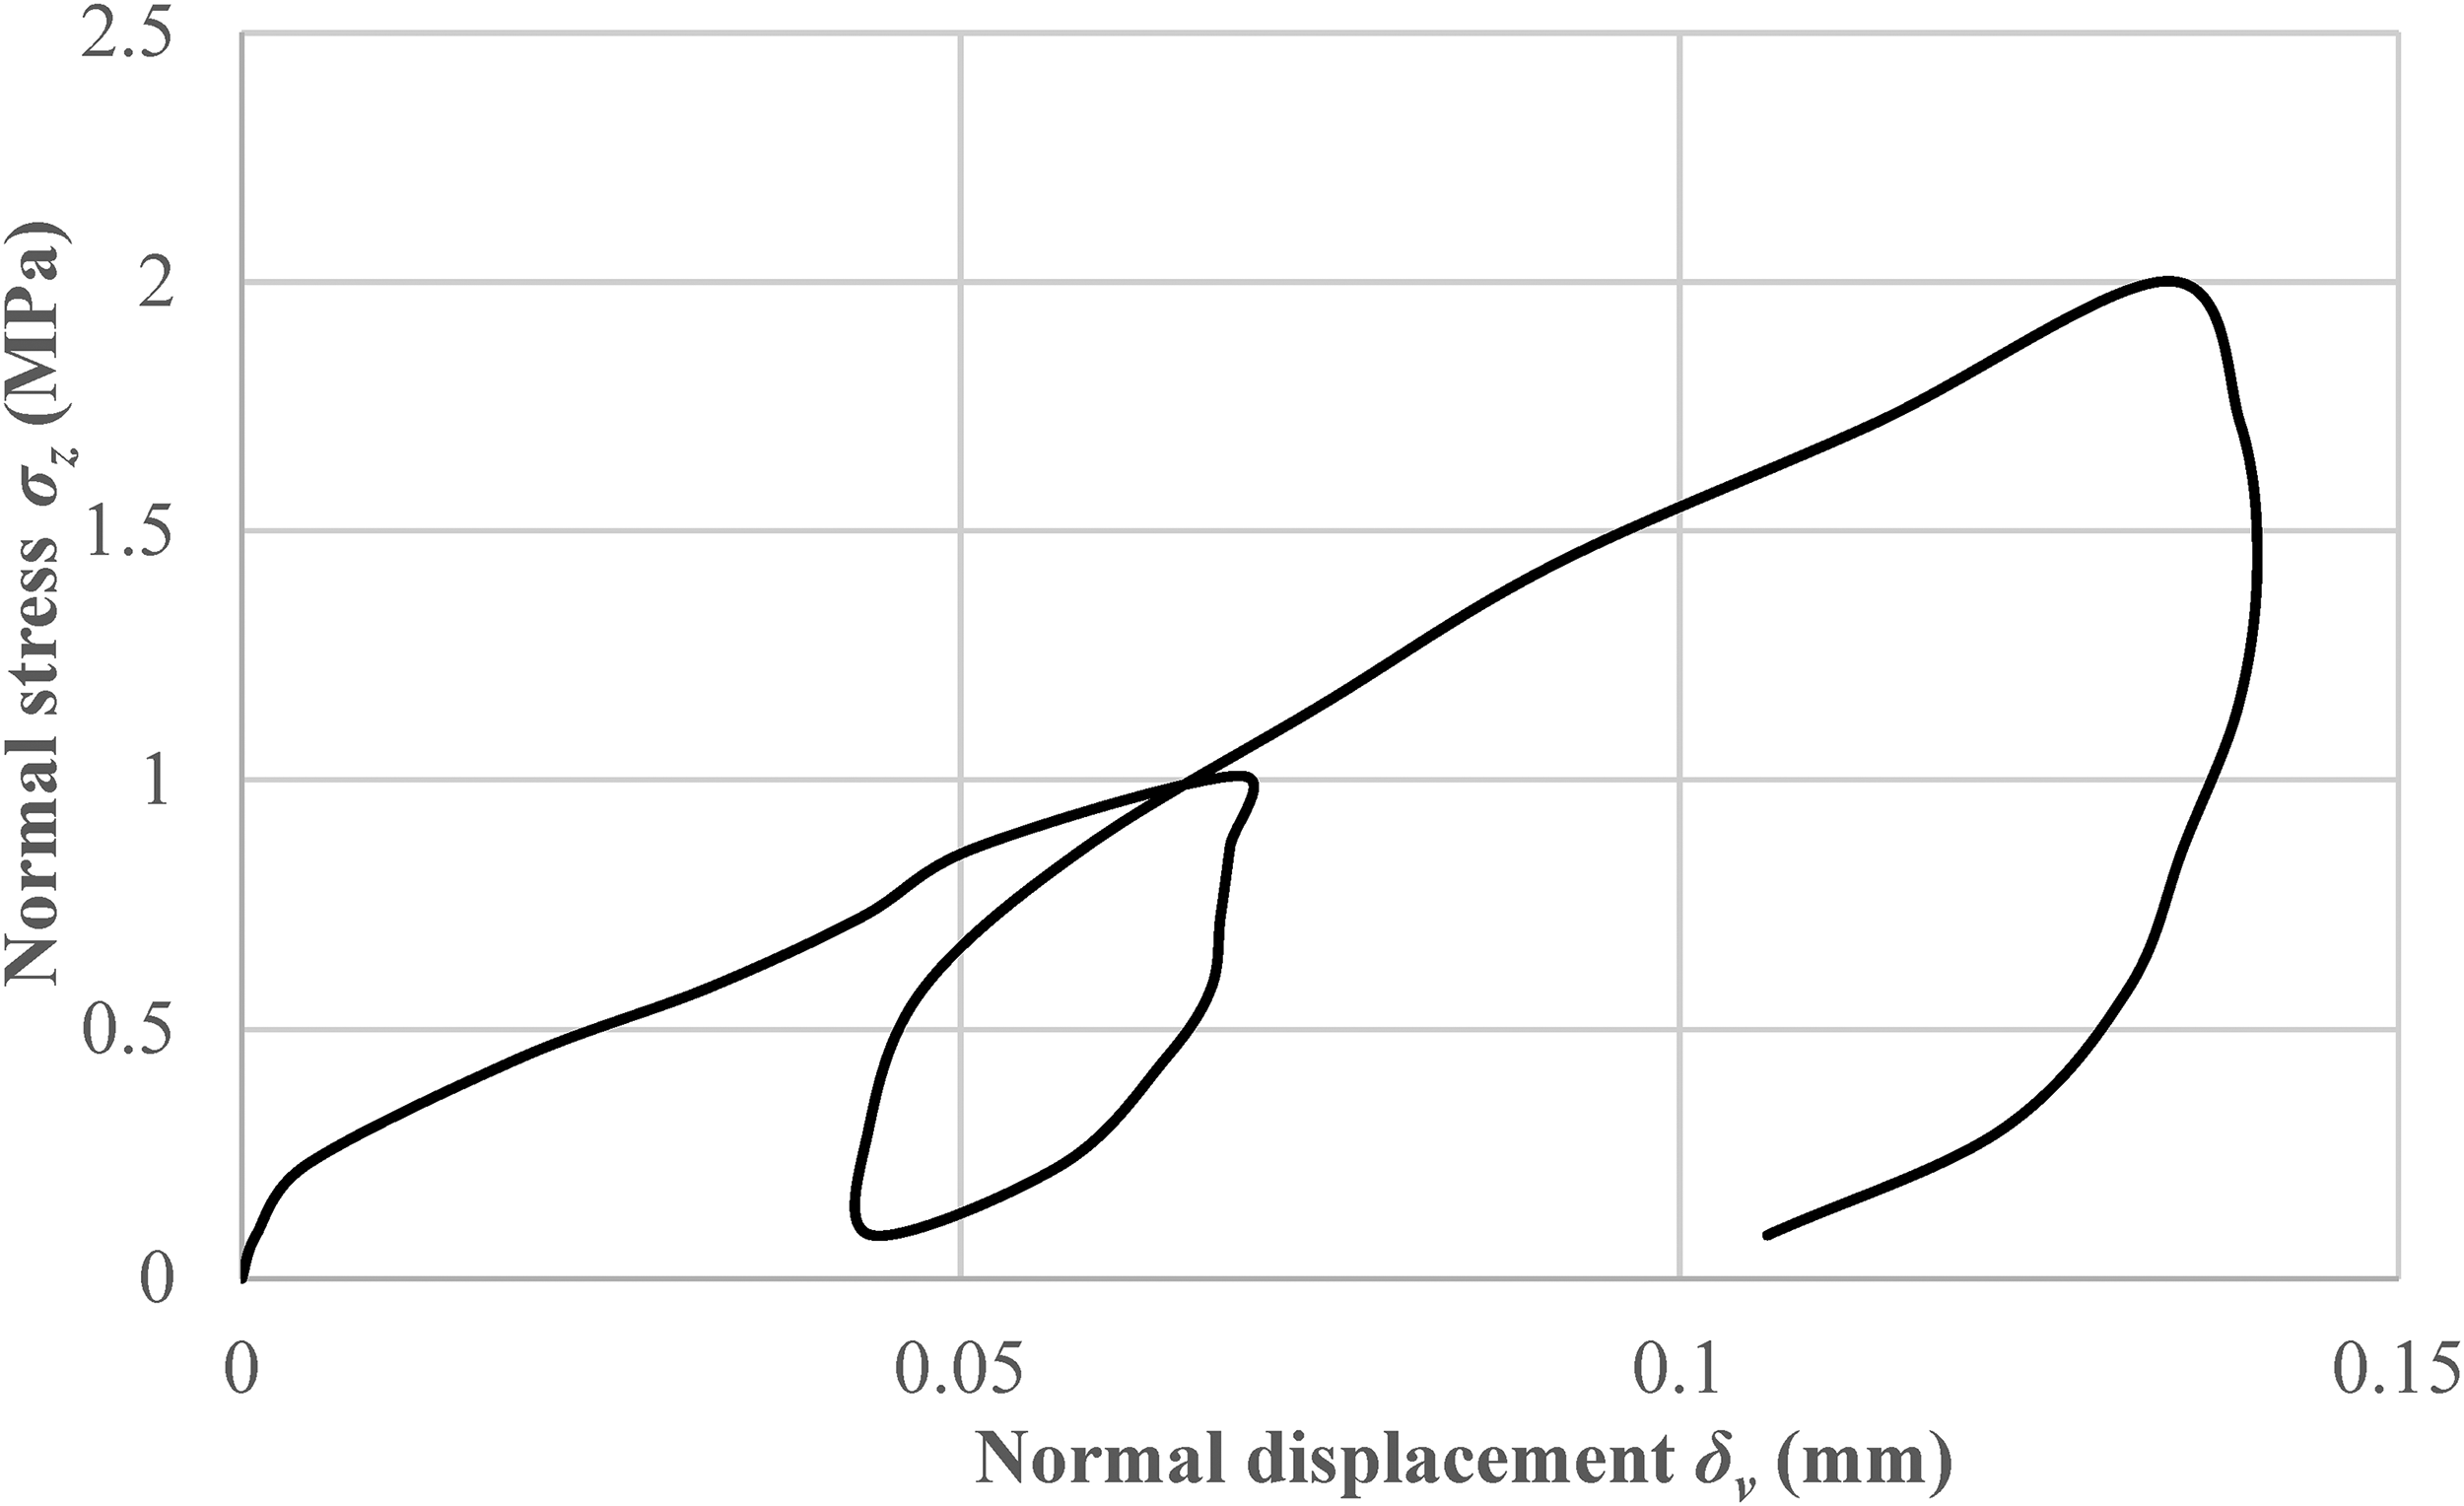
Normal stress – normal displacement during concrete-rock shear test (results of the experiment for the first two loading–unloading cycles).
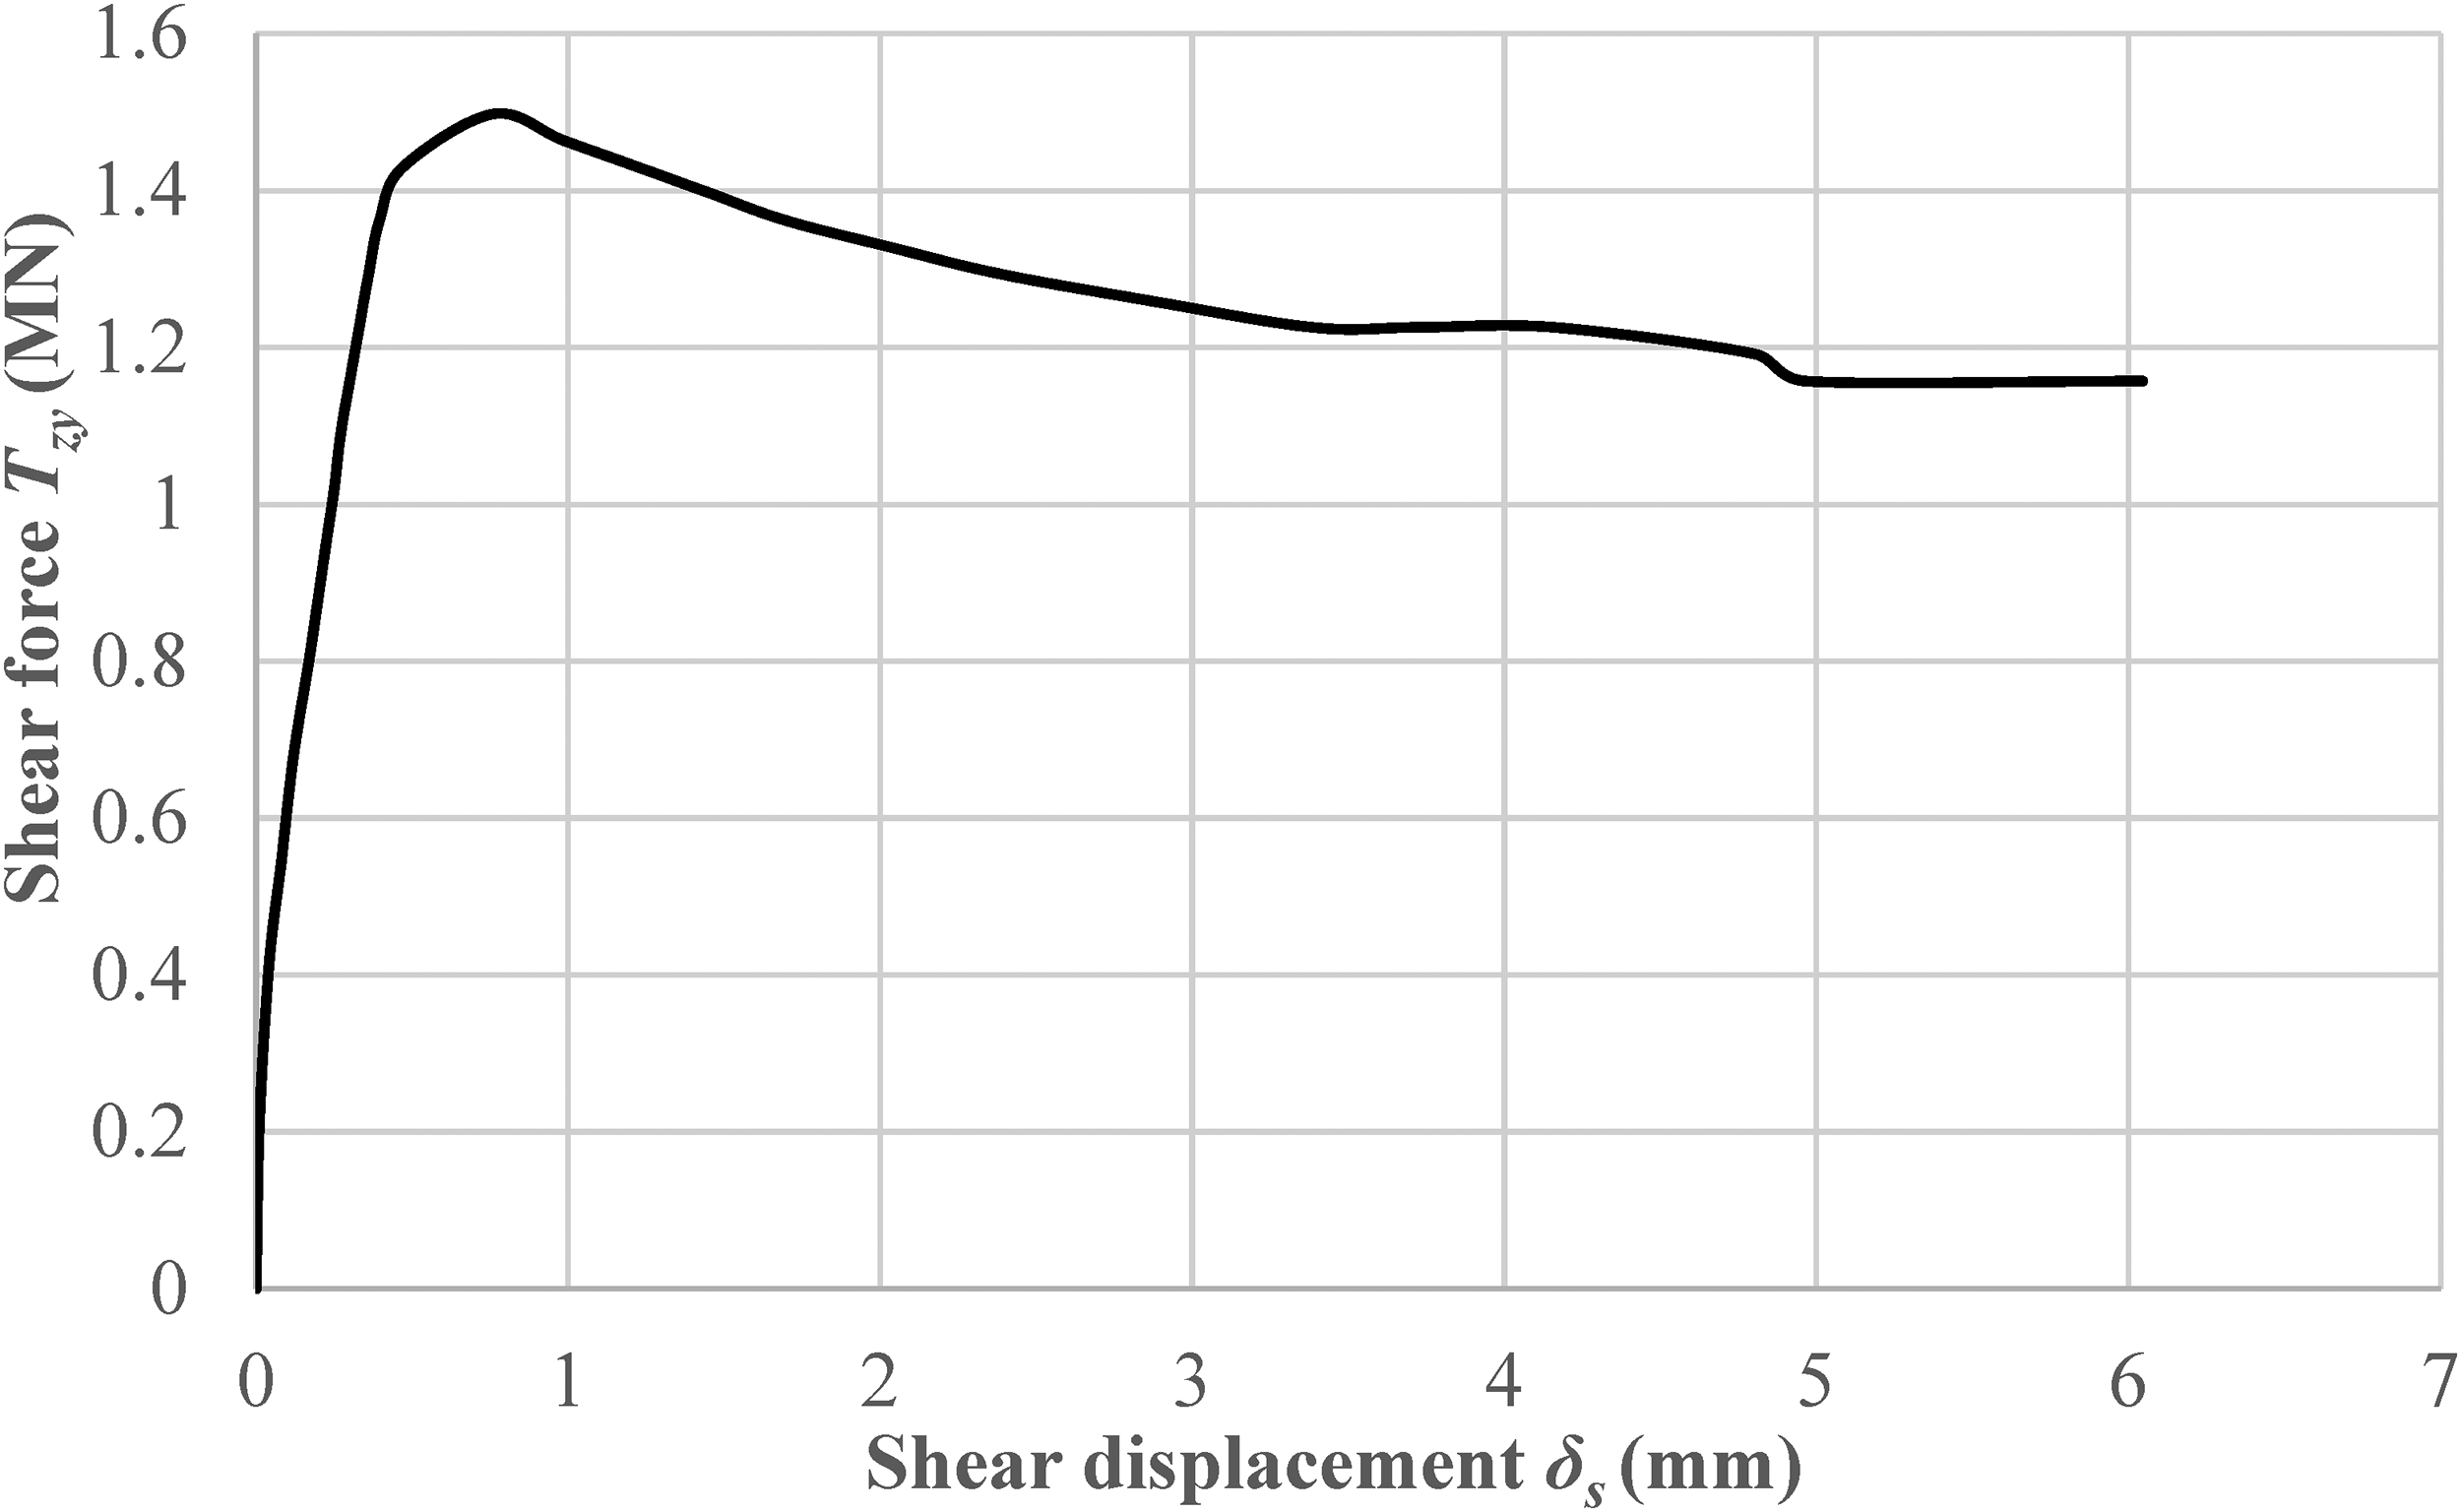
Shear force – shear displacement obtained during concrete-rock shear test (results of the experiment).
Numerical analysis
Constitutive model for mechanical behaviour of rock mass
For the scale effect analysis and modelling of mechanical behaviour of rock mass within this research, a constitutive model with plastic damage (hereinafter referred to as the DP model) (Lubliner et al., 1989; Lee and Fenves, 1998, 2001; Omidi and Lotfi, 2010) was applied. It was numerically implemented in the software package PAK (Živković et al., 2019a, 2019b). By applying this model, it is possible to simulate the complex material behaviours rock masses like elasto-plastic and damage in stress and stiffness.
In the case of an elasto-plastic model with damage, the relationship between total stress tensor and effective stress tensor is given by the damage variable d. The total tensor stress σ is defined asfollows:

where d represents the damage variable (degradation) and
The effective stress is calculated using the elastic constitutive matrix without damage, which depends on the initial modulus of elasticity
During deformation, there is a change in material stiffness as a consequence of the development of plastic deformations and stiffness degradation. For the sake of illustration, the stress–strain curve is shown for uniaxial compression test (Figure 7(a)) and uniaxial tension test (Figure 7(b)), where unloading after reaching the peak strength is also analyzed.
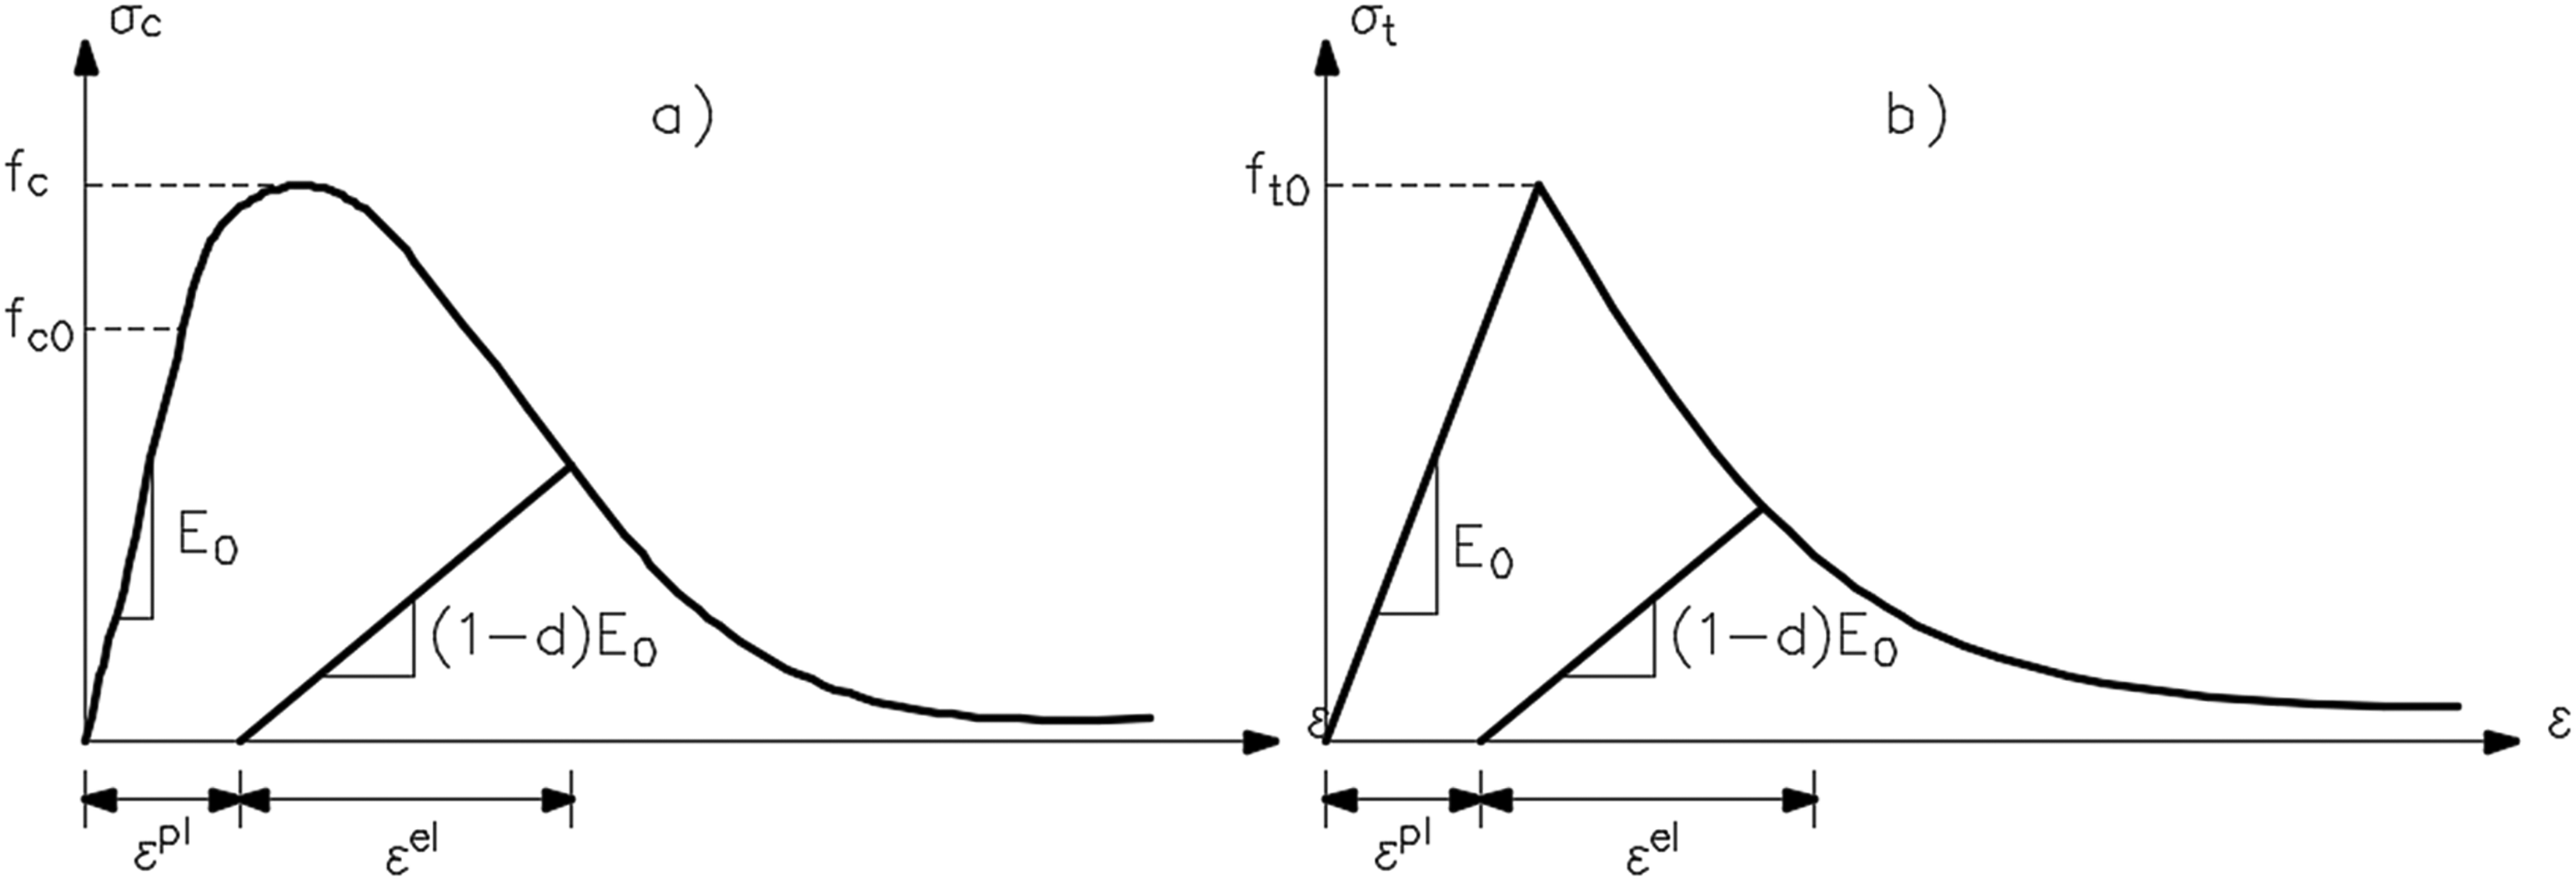
Behaviour of the DP model during uniaxial compression test (a) and uniaxial tension test (b).
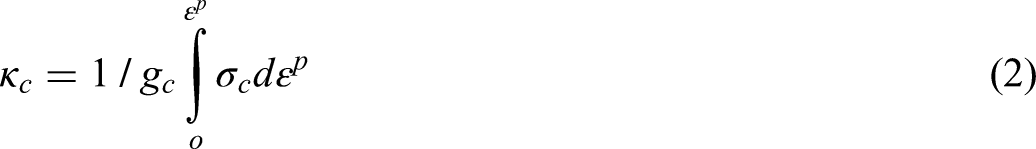
For damage in the model, two internal variables are used for compression
where
The quantities
In the following text, the general notation
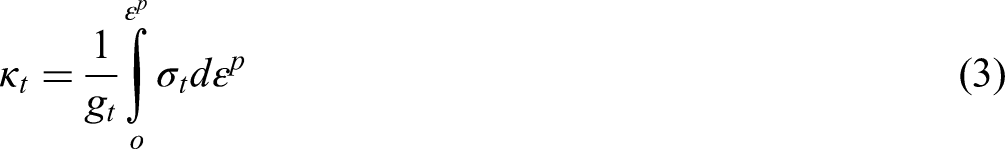
Based on the relation between stress and plastic deformation given by Lubliner et al. (1989), it is possible, by introducing appropriate exponential approximations, to obtain the relation between the total stress and the internal damage variable

where

where
Considering the relationship between total and effective stress by introducing degradation, the expression for effective stress can be written in the following form (Lubliner et al., 1989; Lee, 1996) (Equations 8 and 9):


where
The parameters of the DP model, which adjust the shape of the stress–strain curve to the experimental curve, are:


For multiaxial problems, the degradation variable (Equation 12) is calculated by interpolating between the compressive and tensile degradation variable values (Lee, 1996; Lee and Fenves, 1998)

In the case of cyclic loading, stiffness recovery during the transition from tension to compression is considered (Equation 13).

where s is an internal variable that depends on the stress state and the stiffness recovery parameter
The yield function of the DP model is defined by Equation 14 (Lee, 1996).

where:
According to the research (Lee and Fenves, 1998), parameter

The parameter

The parameter

The change in plastic deformation is defined by Equation 18.

where:

and represents the plastic potential function (Equation 19) which is a linear function of the mean stress and the stress deviator (Lee, 1996).
FEM models for experiment simulation
FEM model for uniaxial compression load–unload test
For numerical simulation of a rock mass compression loading-unloading test, a unit-dimension model consisting of a single tetrahedral finite element was created. One-eighth of the problem was modelled by applying symmetrical boundary conditions across three coordinate planes. The model loading was defined as a vertical stress applied to the free top surface of the model. The pressure was specified in accordance with the loading function shown in Figure 1, while the FEM used in the simulation is presented in Figure 8.
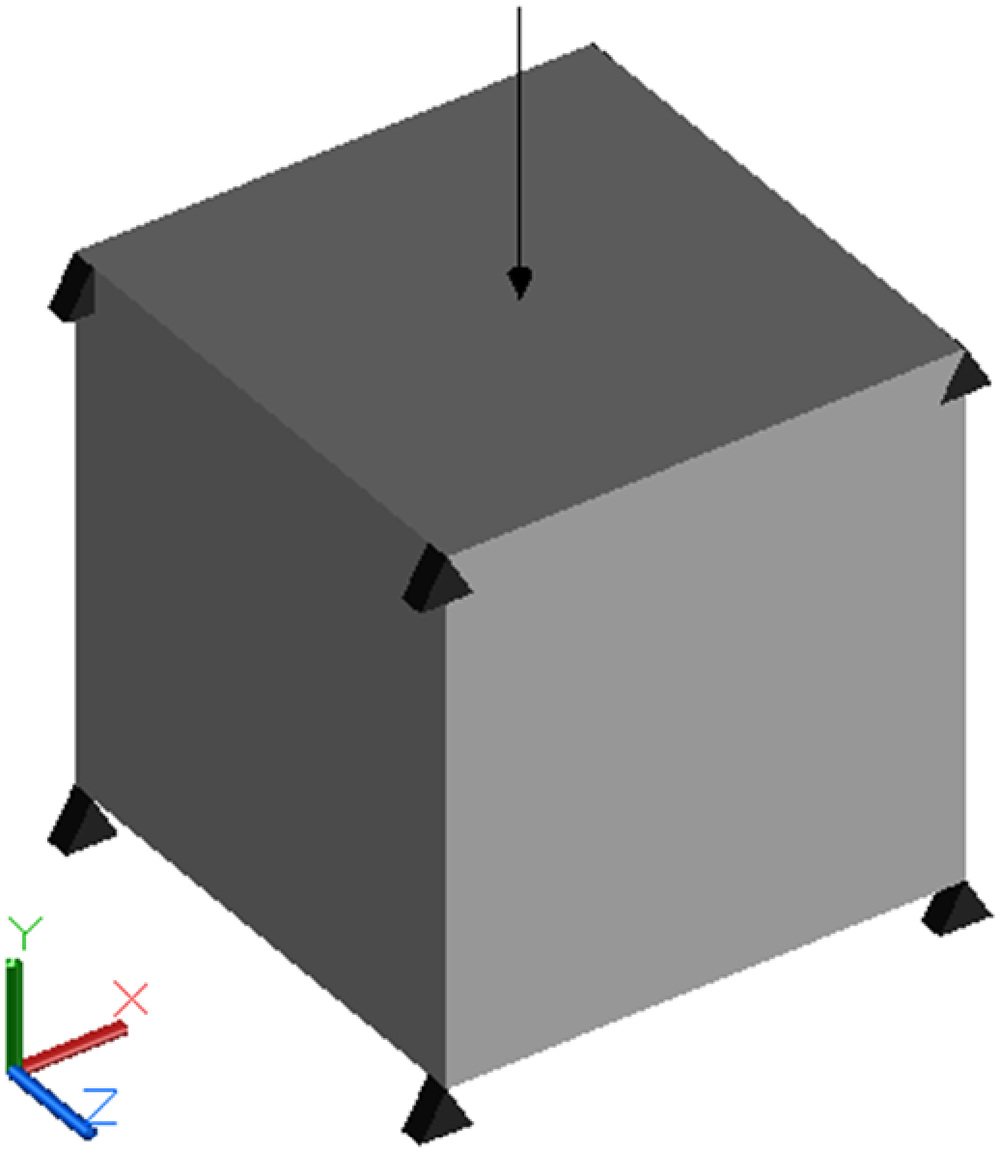
Finite element model (FEM) model for uniaxial loading-unloading compression test.
By using the developed model, numerical simulations were performed, and the calculated stress–strain relationship, was used for the optimization of the constitutive model parameters as shown in the ‘Dp model parameters’ section. During the numerical simulation, the loading of the model was performed in 35 steps. The Figure 9 ilustrates the stress–strain relationship for arbitrary constitutive model parameters.
Normal stress–strain diagram obtained based on the results of the numerical simulation of the experiment (finite element model (FEM) model).
Based on shown relationship, it can be observed that the model exhibits linear elastic behaviour up to a certain stress level (initial yield stress), after which nonlinearity occurs due to the development of plastic strain accompanied by material hardening. During unloading, the model behaves linearly elastic, with an evident change in the modulus due to the development of material stiffness degradation.
FEM model for in situ shear test
For the numerical simulation of an in situ large-scale shear test, a FEM was developed to replicate real testing conditions. Тhe fractured rock mass is treated as an equivalent continuum, which implicitly accounts for the combined influence of intact rock material and discontinuities, because the analysis based on in situ large-scale shear tests, in which stresses (normal and shear) are transferred through a concrete block into the rock mass, inducing failure within the tested volume. Due to the scale of the experiment, the measured response reflects the integrated behaviour of both intact rock and discontinuities, thus justifying the use of an equivalent continuum model.
The geometry and dimensions of the numerical model are given in Figure 10, while the corresponding FE model is presented in Figure 11. Due to the symmetry of the problem, only one-half of the domain was modelled by applying boundary conditions of symmetry. The model was discretized using 10-node tetrahedral finite elements. The finite element mesh was strategically refined: a higher mesh density was employed in the rock mass zone where the development of plastic strain is anticipated. Conversely, coarser elements were used towards the model boundaries to optimize computational efficiency. A concrete block with dimensions of 80 × 40x 55 cm was modelled on the upper surface, acting as a loading platen through which the load is transferred to the rock mass. These two components are rigidly connected (nodes are merged), thereby simulating material failure without accounting for potential sliding at the concrete-rock interface. The final FE model consists of 5879 nodes and 3802 finite elements. The boundary conditions were defined by restricting horizontal displacements normal to the planes for all nodes on the vertical boundaries, alongside symmetry constraints, whereas the nodes at the base of the model were fully fixed. The DP constitutive model was utilized to simulate the mechanical behaviour of both materials.
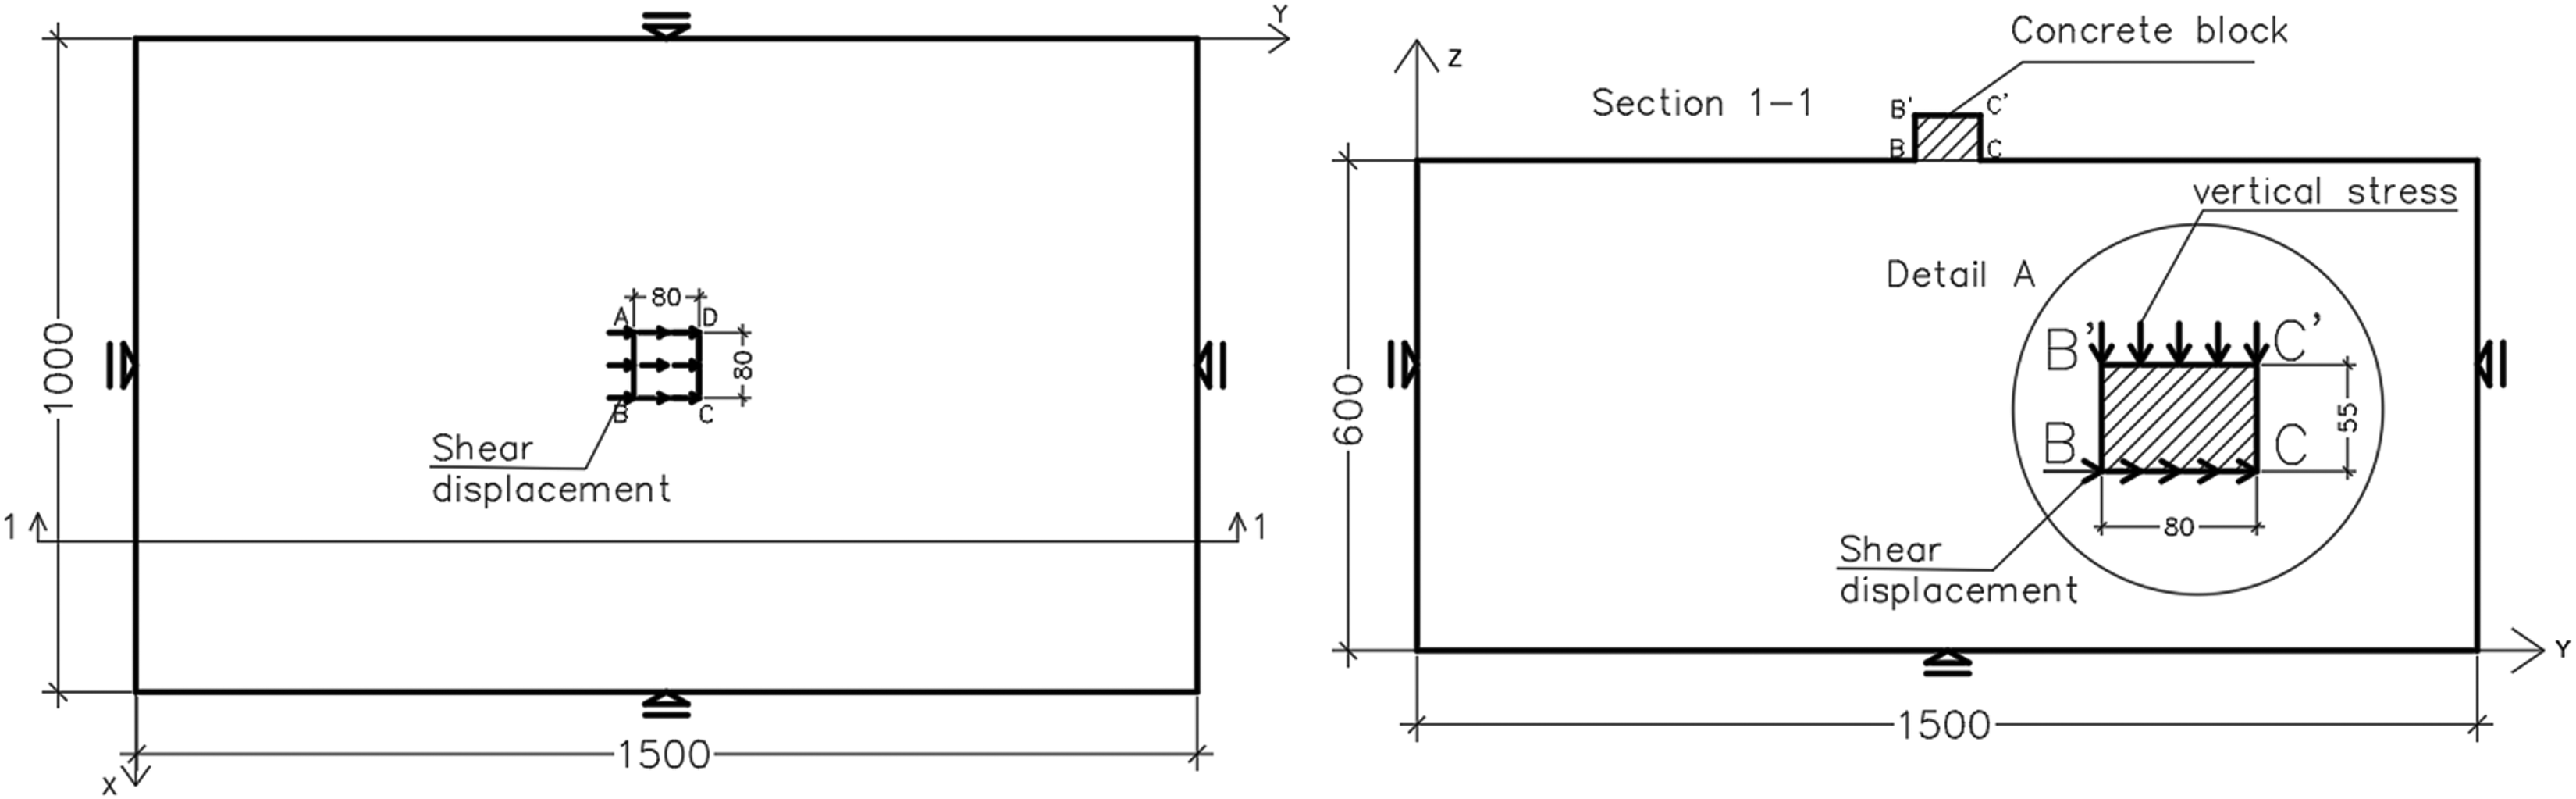
Mesh geometry for concrete-rock shear test with boundary conditions (distances are in cm).
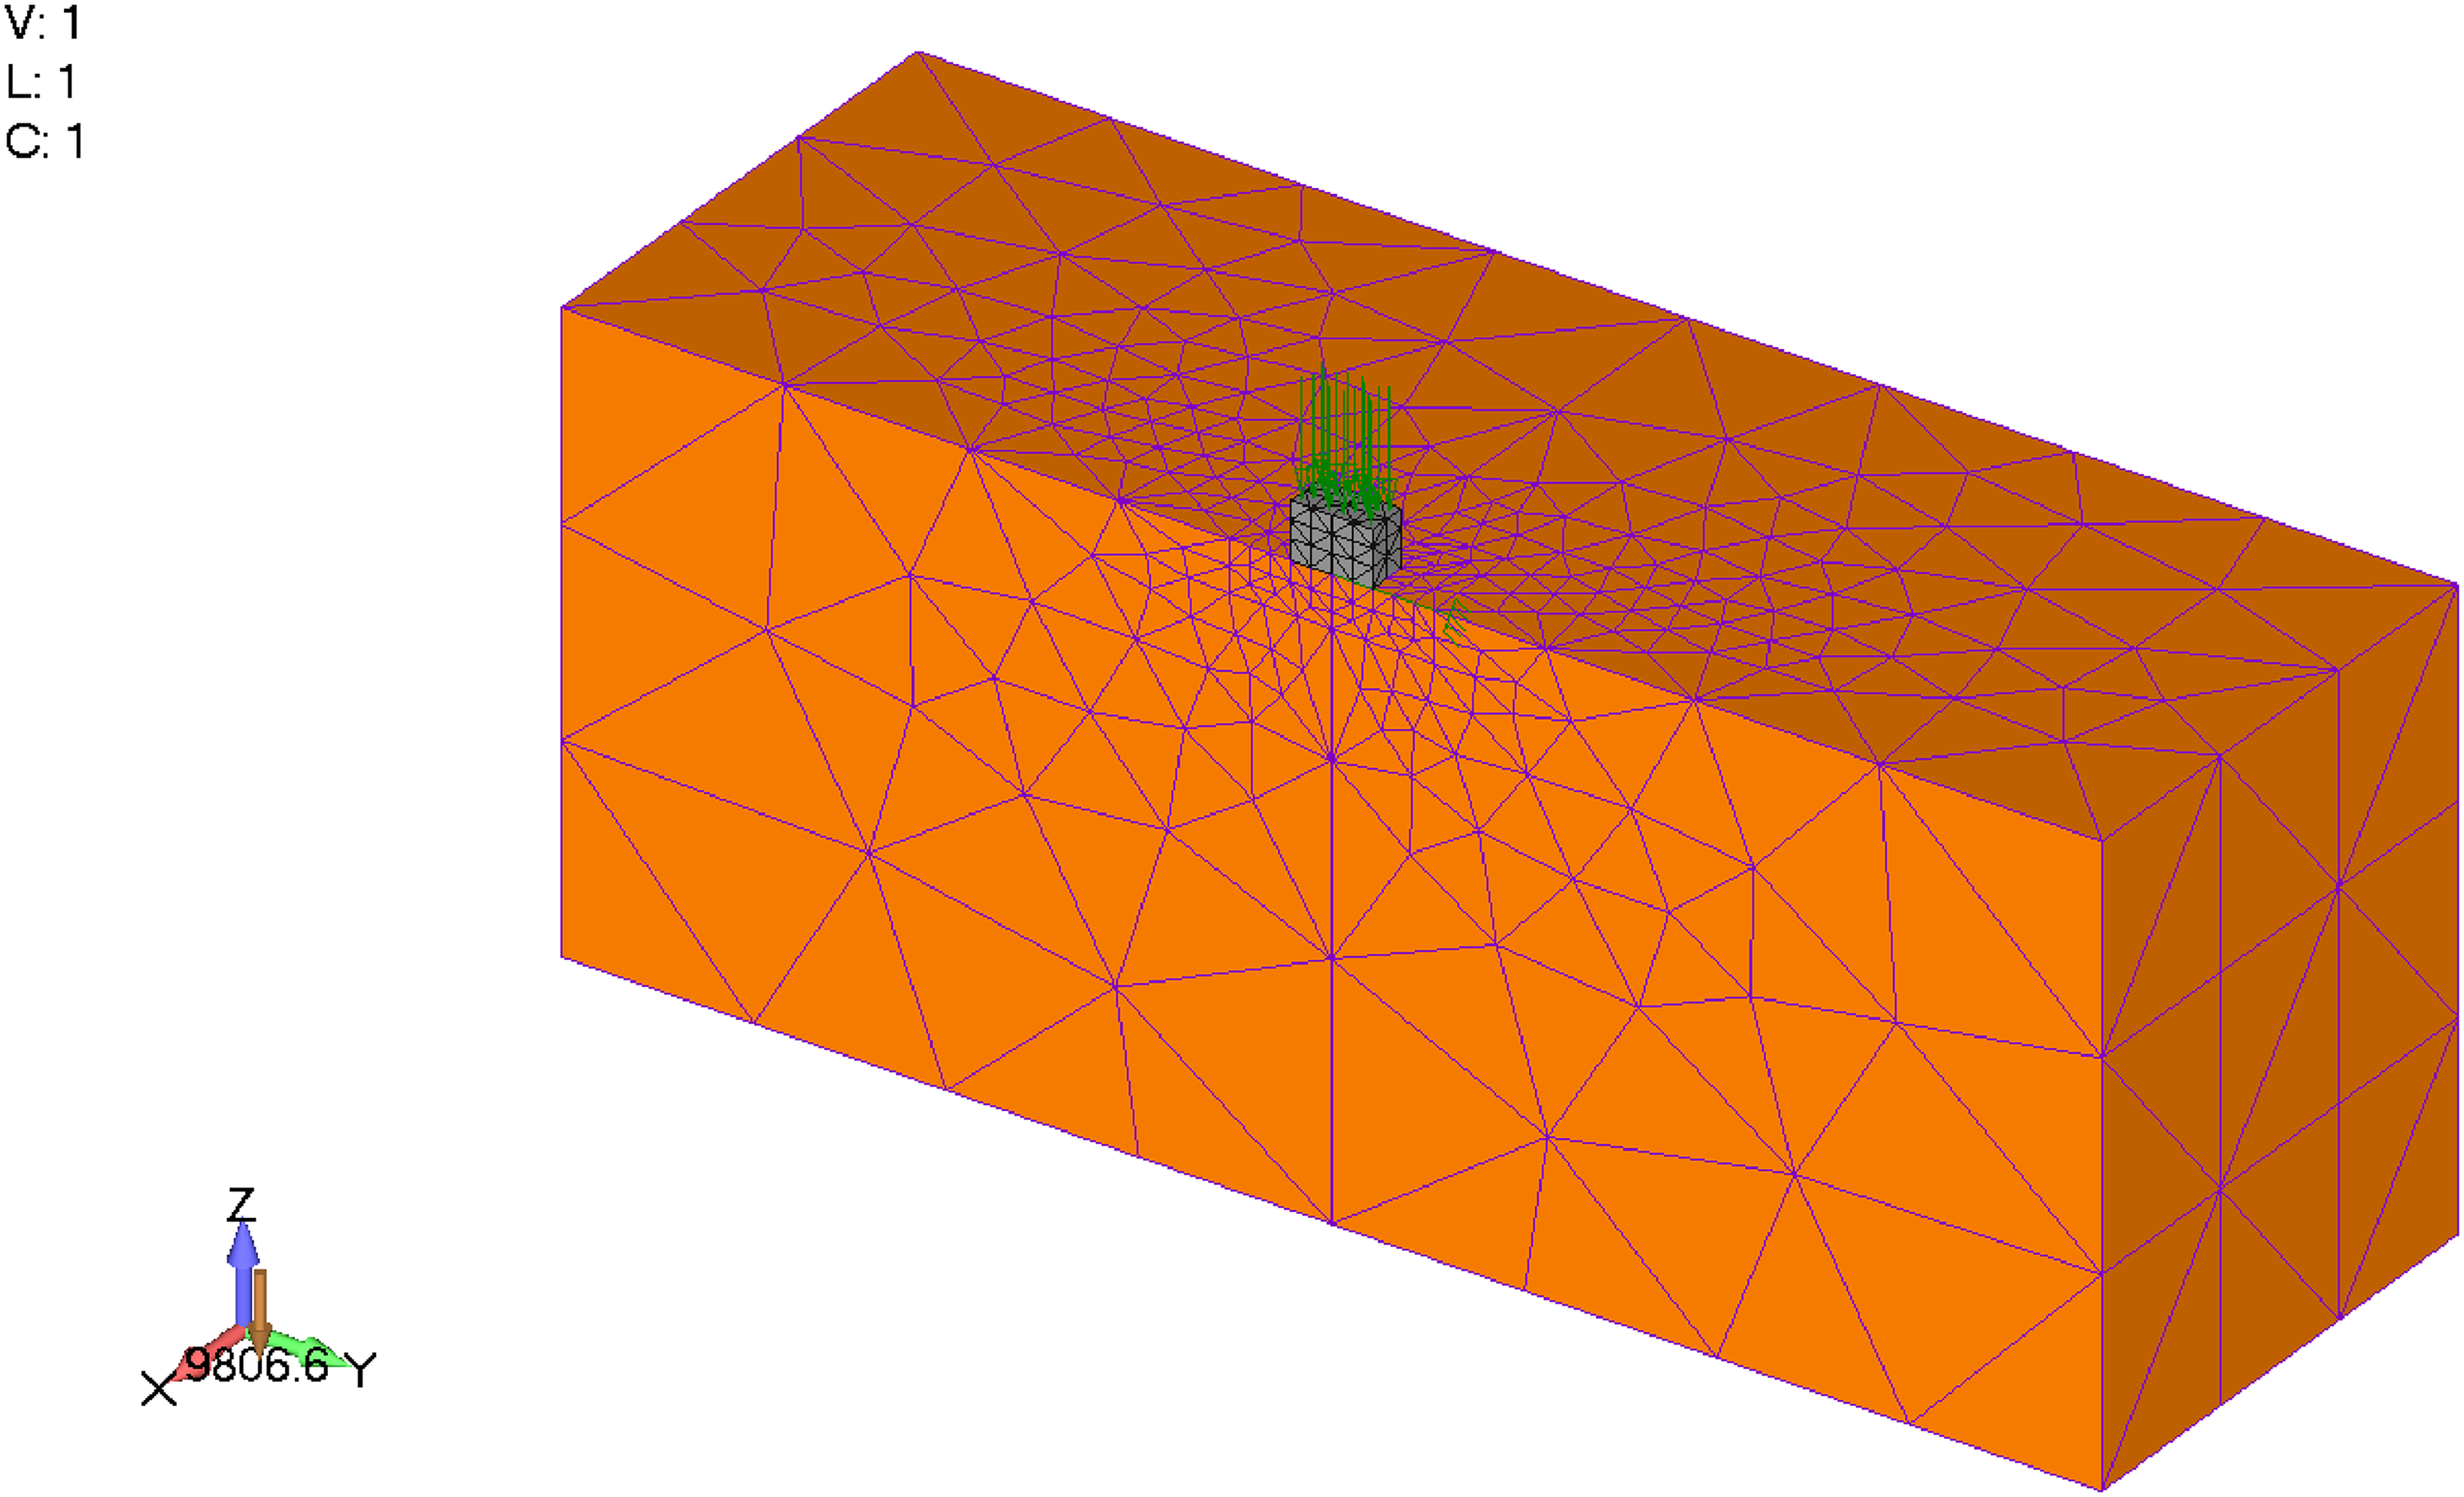
Finite element model (FEM) model for concrete-rock shear test (isometry).
The loading was applied in two phases: phase 1 – a vertical compressive load was applied by prescribing a normal stress on the top surface of the concrete block; phase 2 – a shear load was applied via prescribed displacements to the concrete block. These displacements were assigned to a single node, which was linked to the remaining nodes on the top surface of the concrete block. Displacement control was specifically implemented to mitigate numerical instabilities often encountered in the constitutive model's response after reaching peak strength. On the FEM model, the normal stress on the surface A'B'C'D’ is applied over 54 increments in accordance with the loading function during the experiment (Figure 4). After establishing a constant normal stress, shear displacement in the y-axis direction is set in equal increments (27 steps) so that the maximum shear displacement corresponds to the maximum value obtained during the experiment, which is 6.045 mm (see Figure 6). As a result of the numerical simulation of shear test, average values of vertical displacements in the corners of the loaded surface A'B'C'D’ are read from the FEM model for each step of normal stresses. As a result of the shearing phase, for each step of shearing displacement, the total shear force in the y-axis direction is obtained, which represents the resultant of all shear forces in the nodes of the surface ABCD.
The results shown in Figures 12 and 13 refer to arbitrary parameters of the constitutive model, whereas the results obtained following parameter optimization are detailed in the ‘Dp model parameters’ section. The shear stress during numerical simulation was calculated following the experimental methodology: as the ratio of the shear force derived from the numerical simulation to the area of the foundation interface.
Normal stress – vertical displacement for two normal stress loading cycles (finite element model (FEM) model).
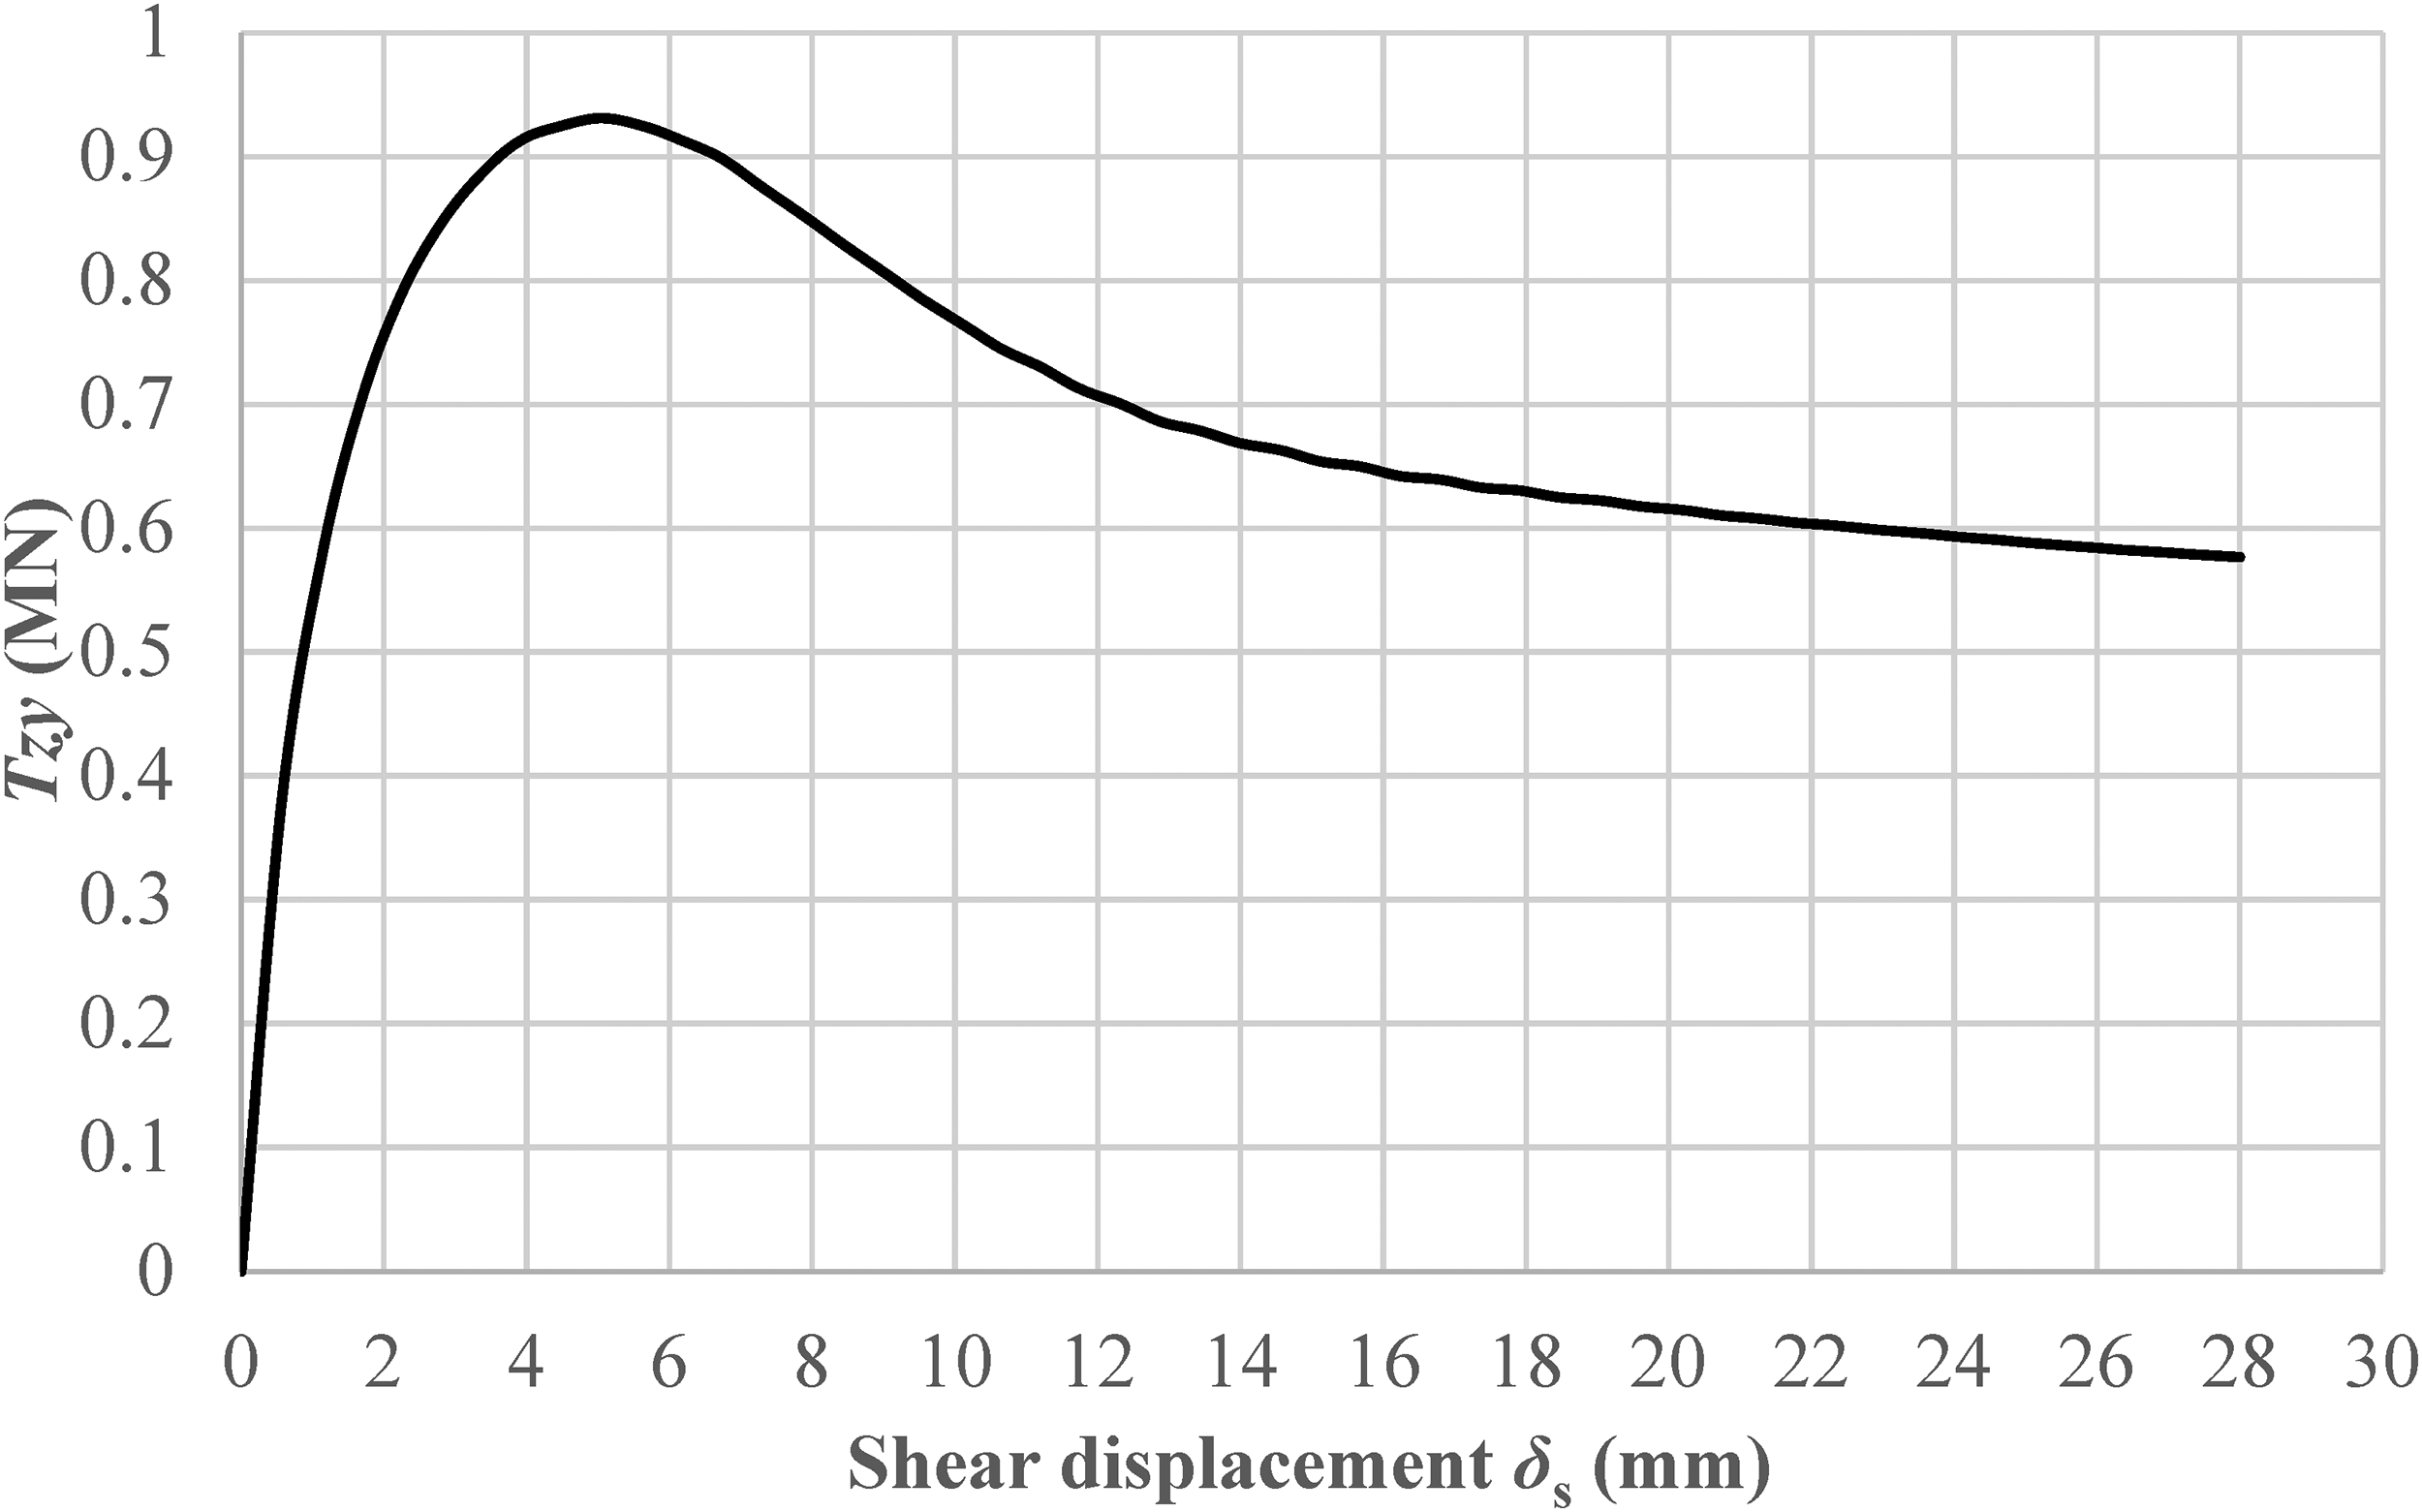
Shear stress–shear displacement from sharing phase of the finite element model (FEM) model.
Based on the shear results obtained from the numerical simulation, it is observed that, for the given shear displacements, the DP model simulates material damage upon reaching the peak shear strength, when degradation occurs, which is followed by a reduction in the shear strength to the residual value.
Algorithm for parameter identification
To define the mechanical behaviour of the constitutive DP model, it is necessary to determine a large number of numerical parameters. Due to their physical meaning, these parameters cannot be directly obtained from experiments, as there are no in situ results that can be directly applied. Therefore, appropriate numerical methods must be used. The proposed algorithm for determining the parameters of the DP model in this paper is based on the use of the FEM model (Section 3.2) and corresponding experimental results (Section 2), one or more combinations of parameters are determined based on which the smallest deviations are obtained between the results from numerical using FEM models and the results obtained from experimental testing.
This process involves performing a large number of numerical simulations and searching for the optimal parameter combination that ensures agreement between experimental test results and FEM model. The problem is formulated as an optimization problem and issolved by using optimization algorithms. The optimization problem is generally defined as follows: It is necessary to determine the minimum of the function


Solving the optimization problem involves finding an
Given that the determination of parameters is a systematic search for the optimal values of a set of parameters, the necessary steps must be defined. In addition, it is determined which steps can be automated and to what extent. The general steps of the optimization algorithm are:
selection of parameter values from the search space, performing a numerical simulation using the FEM model, comparison between the results obtained using the FEM model with the experimental results based on optimization criteria, correction of parameters and, if necessary, re-running the simulation.
The first step is to identify the set of parameters that are significant for optimization from the widest set of parameters. The set of parameters obtained through the optimization process is determined based on the parameter sensitivity analysis (see Chapter 4.3). Based on the results of the sensitivity analysis, the parameters to be included in the optimization algorithm are defined.
After defining the set of parameters, the search space for the parameters in the optimization algorithm is defined. Calculations using the FEM model, comparison of numerical results with experimental data and evaluation of the objective function are repeated iteratively until the minimum value of the objective function is reached. Numerical simulations are carried out each time using a new combination of parameters. These steps in the optimization algorithm can be automated.
Automatic parameter determination represents a mixed optimization problem aimed at minimizing the difference between measured and calculated values. It is based on a large number of possible solutions, where a wide set of equations and inequations must be taken into consideration, as well as logical restrictions defined within the optimization algorithm. Therefore, to solve the mentioned optimization problem, an automatic optimization approach was applied, which supports multi-objective optimization and is based on algorithms that can be parallelized.
Objective functions (criteria) are defined for each experiment separately.
For the uniaxial compression test with unloading, the criterion function is defined by Equation 23.

where:
In the shear test, two criteria are defined: one refers to the minimization of results deviation due to normal stresses, and the other refers to the minimization of the deviation between the results obtained in the shearing phase.
The first criterion is defined by Equation 24.

where

where
It can be observed that in some tests, a single criterion is defined, while in others, two optimization criteria are used. In the case of a single criterion, the parameter combination from the admissible search space that minimizes the proposed criterion is identified.
In the case of two or more criteria (multi-criteria optimization), there is a set of compromise solutions called the Pareto front (Deb et al., 2002). The set of Pareto optimal solutions contains solutions that are superior to all other solutions from the search space for each criterion, but are inferior to other solutions from this set for other criteria (Srinivas and Deb, 1994). Based on the set of compromise solutions, the decision maker chooses that solution which he considers optimal, taking into account all criteria. In this paper, the solution comprehends a combination of the DP model parameters. To solve the optimization problem of single-criteria and multi-criteria optimization, the parallelized NSGA-II algorithm was used (Deb et al., 2002).
Sensitivity analysis
Sensitivity analysis methodology
Sensitivity analysis shows how much variations of certain parameters affect mechanical behaviour of the rock mass under certain loads. This analysis gives a hierarchical influence of certain parameters on the specific behaviour of the rock mass. This means that certain parameters can have a significantly greater influence on the rock mass behaviour under certain loads compared to other parameters. Based on sensitivity analysis, the number of parameters is reduced, and a set of important parameters is obtained to which more attention is paid in terms of the precise determination of their values. Other parameters are adopted with less regard for their accuracy, because they have no significance on the rock mass behaviour under a certain load. The sensitivity analysis in this research was carried out for the uniaxial cyclic compression test and for the shear test. DAKOTA programme (Adams et al., 2014) and Morris One at a Time (MOAT) (Morris, 1991) methods were used for sensitivity analysis. The MOAT method is intended for computer model research in terms of categorization of input parameters. The idea is to differentiate between the input parameters by the level of influence on the output variable.
According to the MOAT method, each parameter (dimension) of the

where
The idea of the MOAT method is to estimate the distribution of the elementary effects
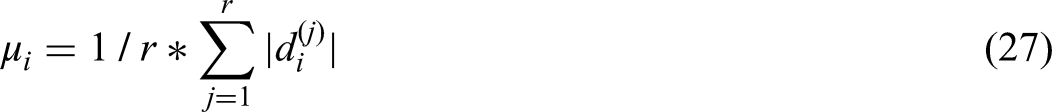
The variable
The sensitivity analysis of the DP model parameters was carried out on the FEM models of uniaxial cyclic compression and shear tests. As a result of the sensitivity analysis, hierarchically distributed parameters are obtained according to the effect on the output variables in certain experiments.
Results of the sensitivity analysis of uniaxial cyclic compression test
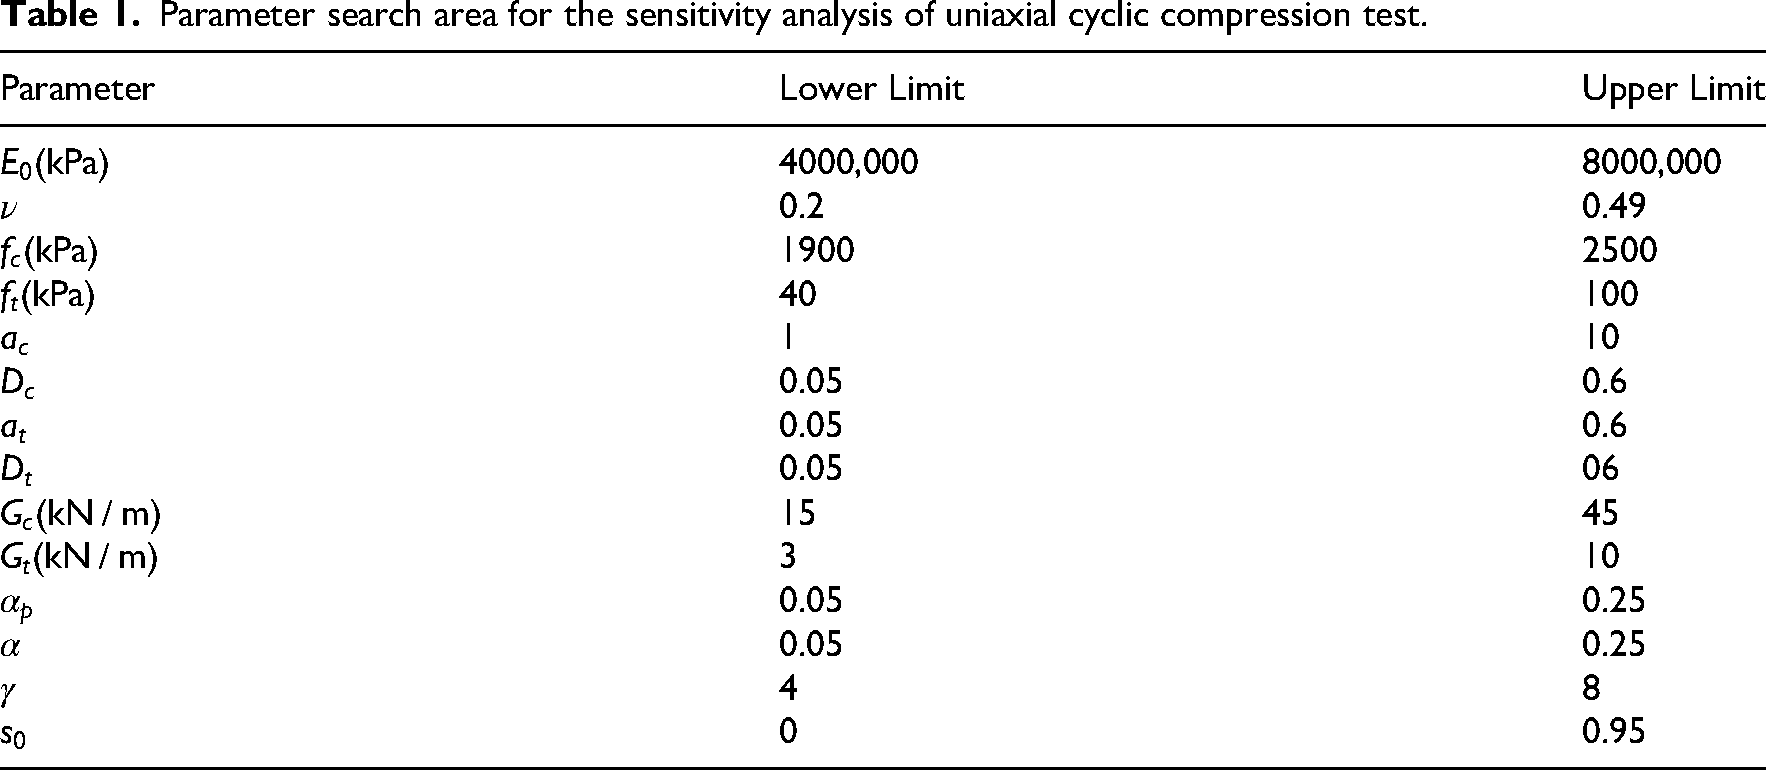
Table 1 provides the search areas for each of the DP model parameters for the sensitivity analysis. Figure 14 shows the sensitivity indicators (mean value) of all analyzed parameters.
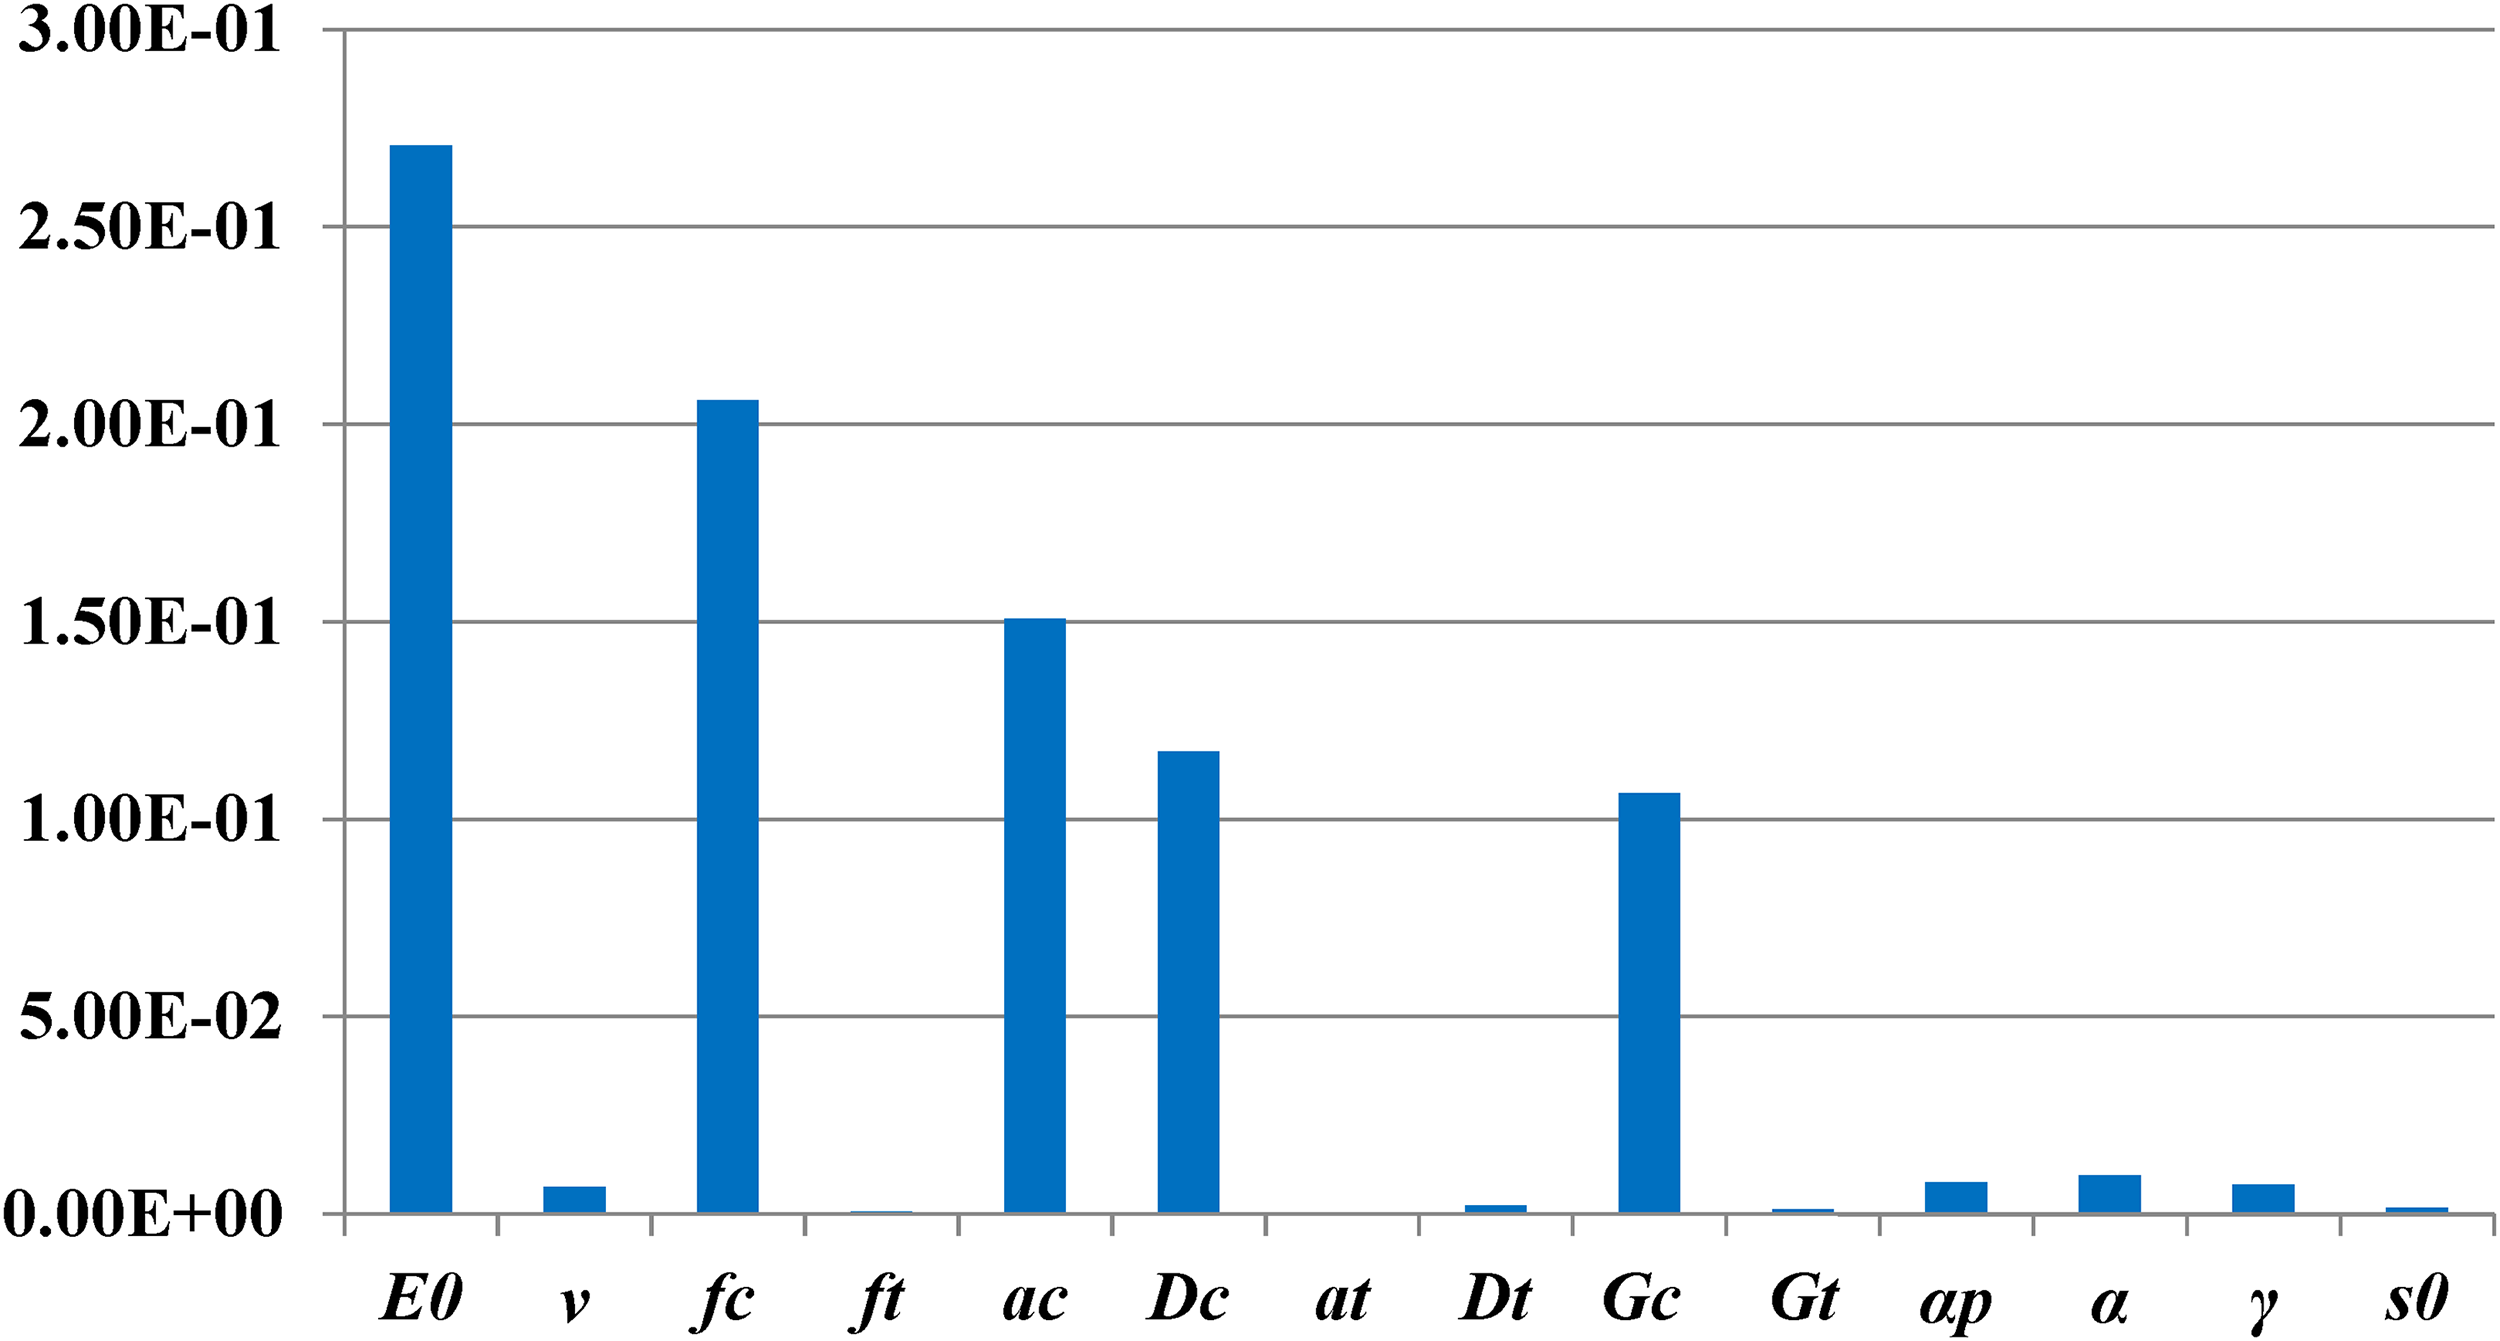
Indicators of parameter sensitivity to total deformation during uniaxial cyclic compression test.
Parameter search area for the sensitivity analysis of uniaxial cyclic compression test.
It can be concluded that parameters
Results of the sensitivity analysis of shear test in situ
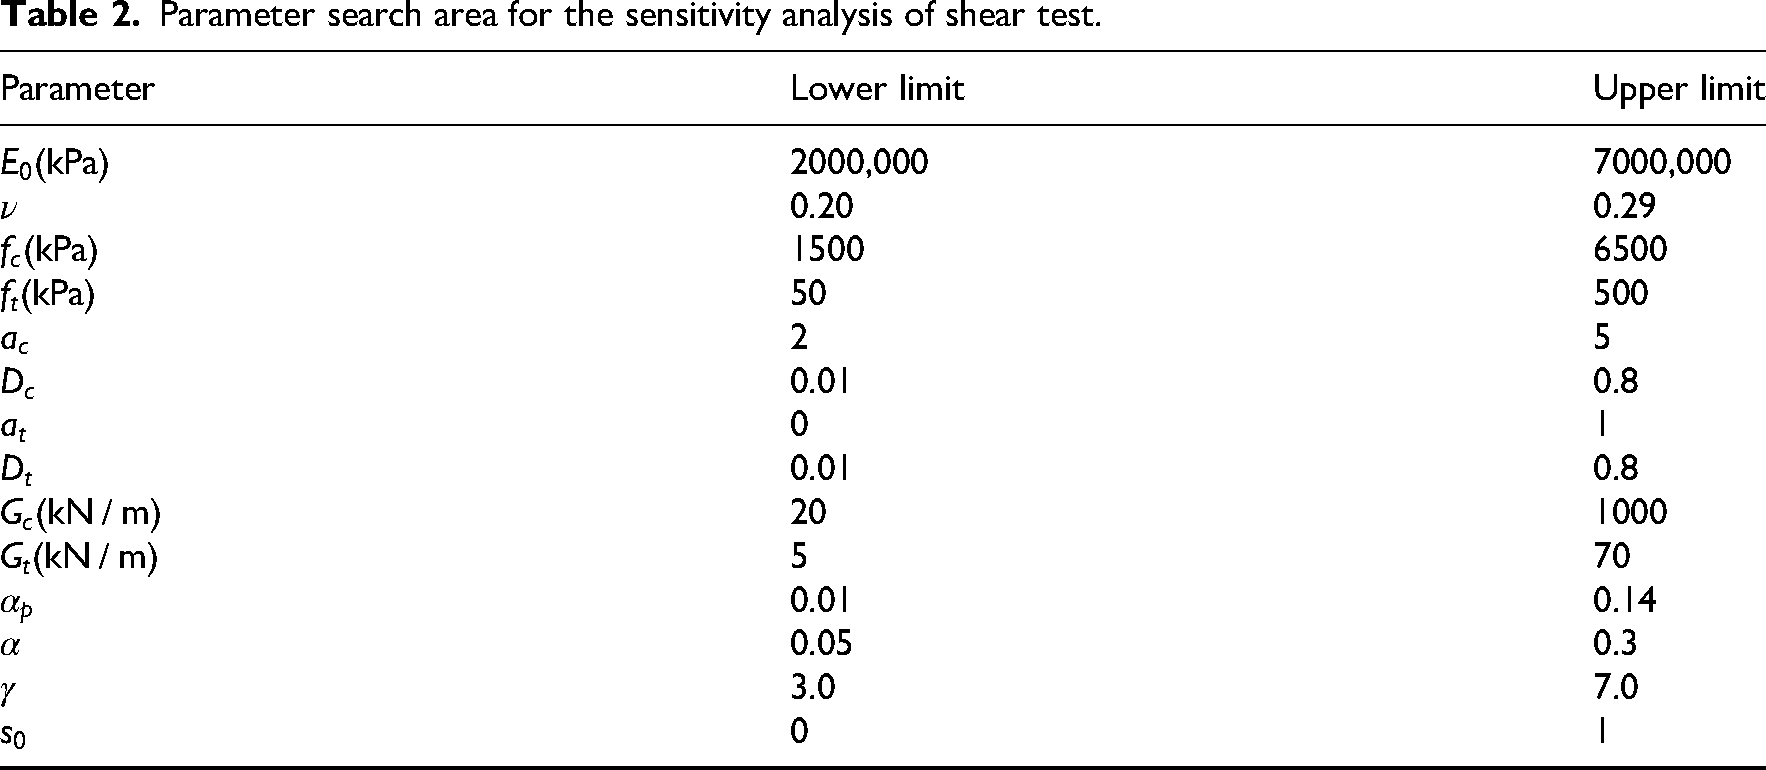
Table 2 gives the search areas for each of the parameters of the DP model for the purposes of the sensitivity analysis of shear test.
Parameter search area for the sensitivity analysis of shear test.
Indicators of the individual parameter influence on the shear test simulation outcomes are presented graphically in Figure 15, from highest impact parameters, to the lowest ones.
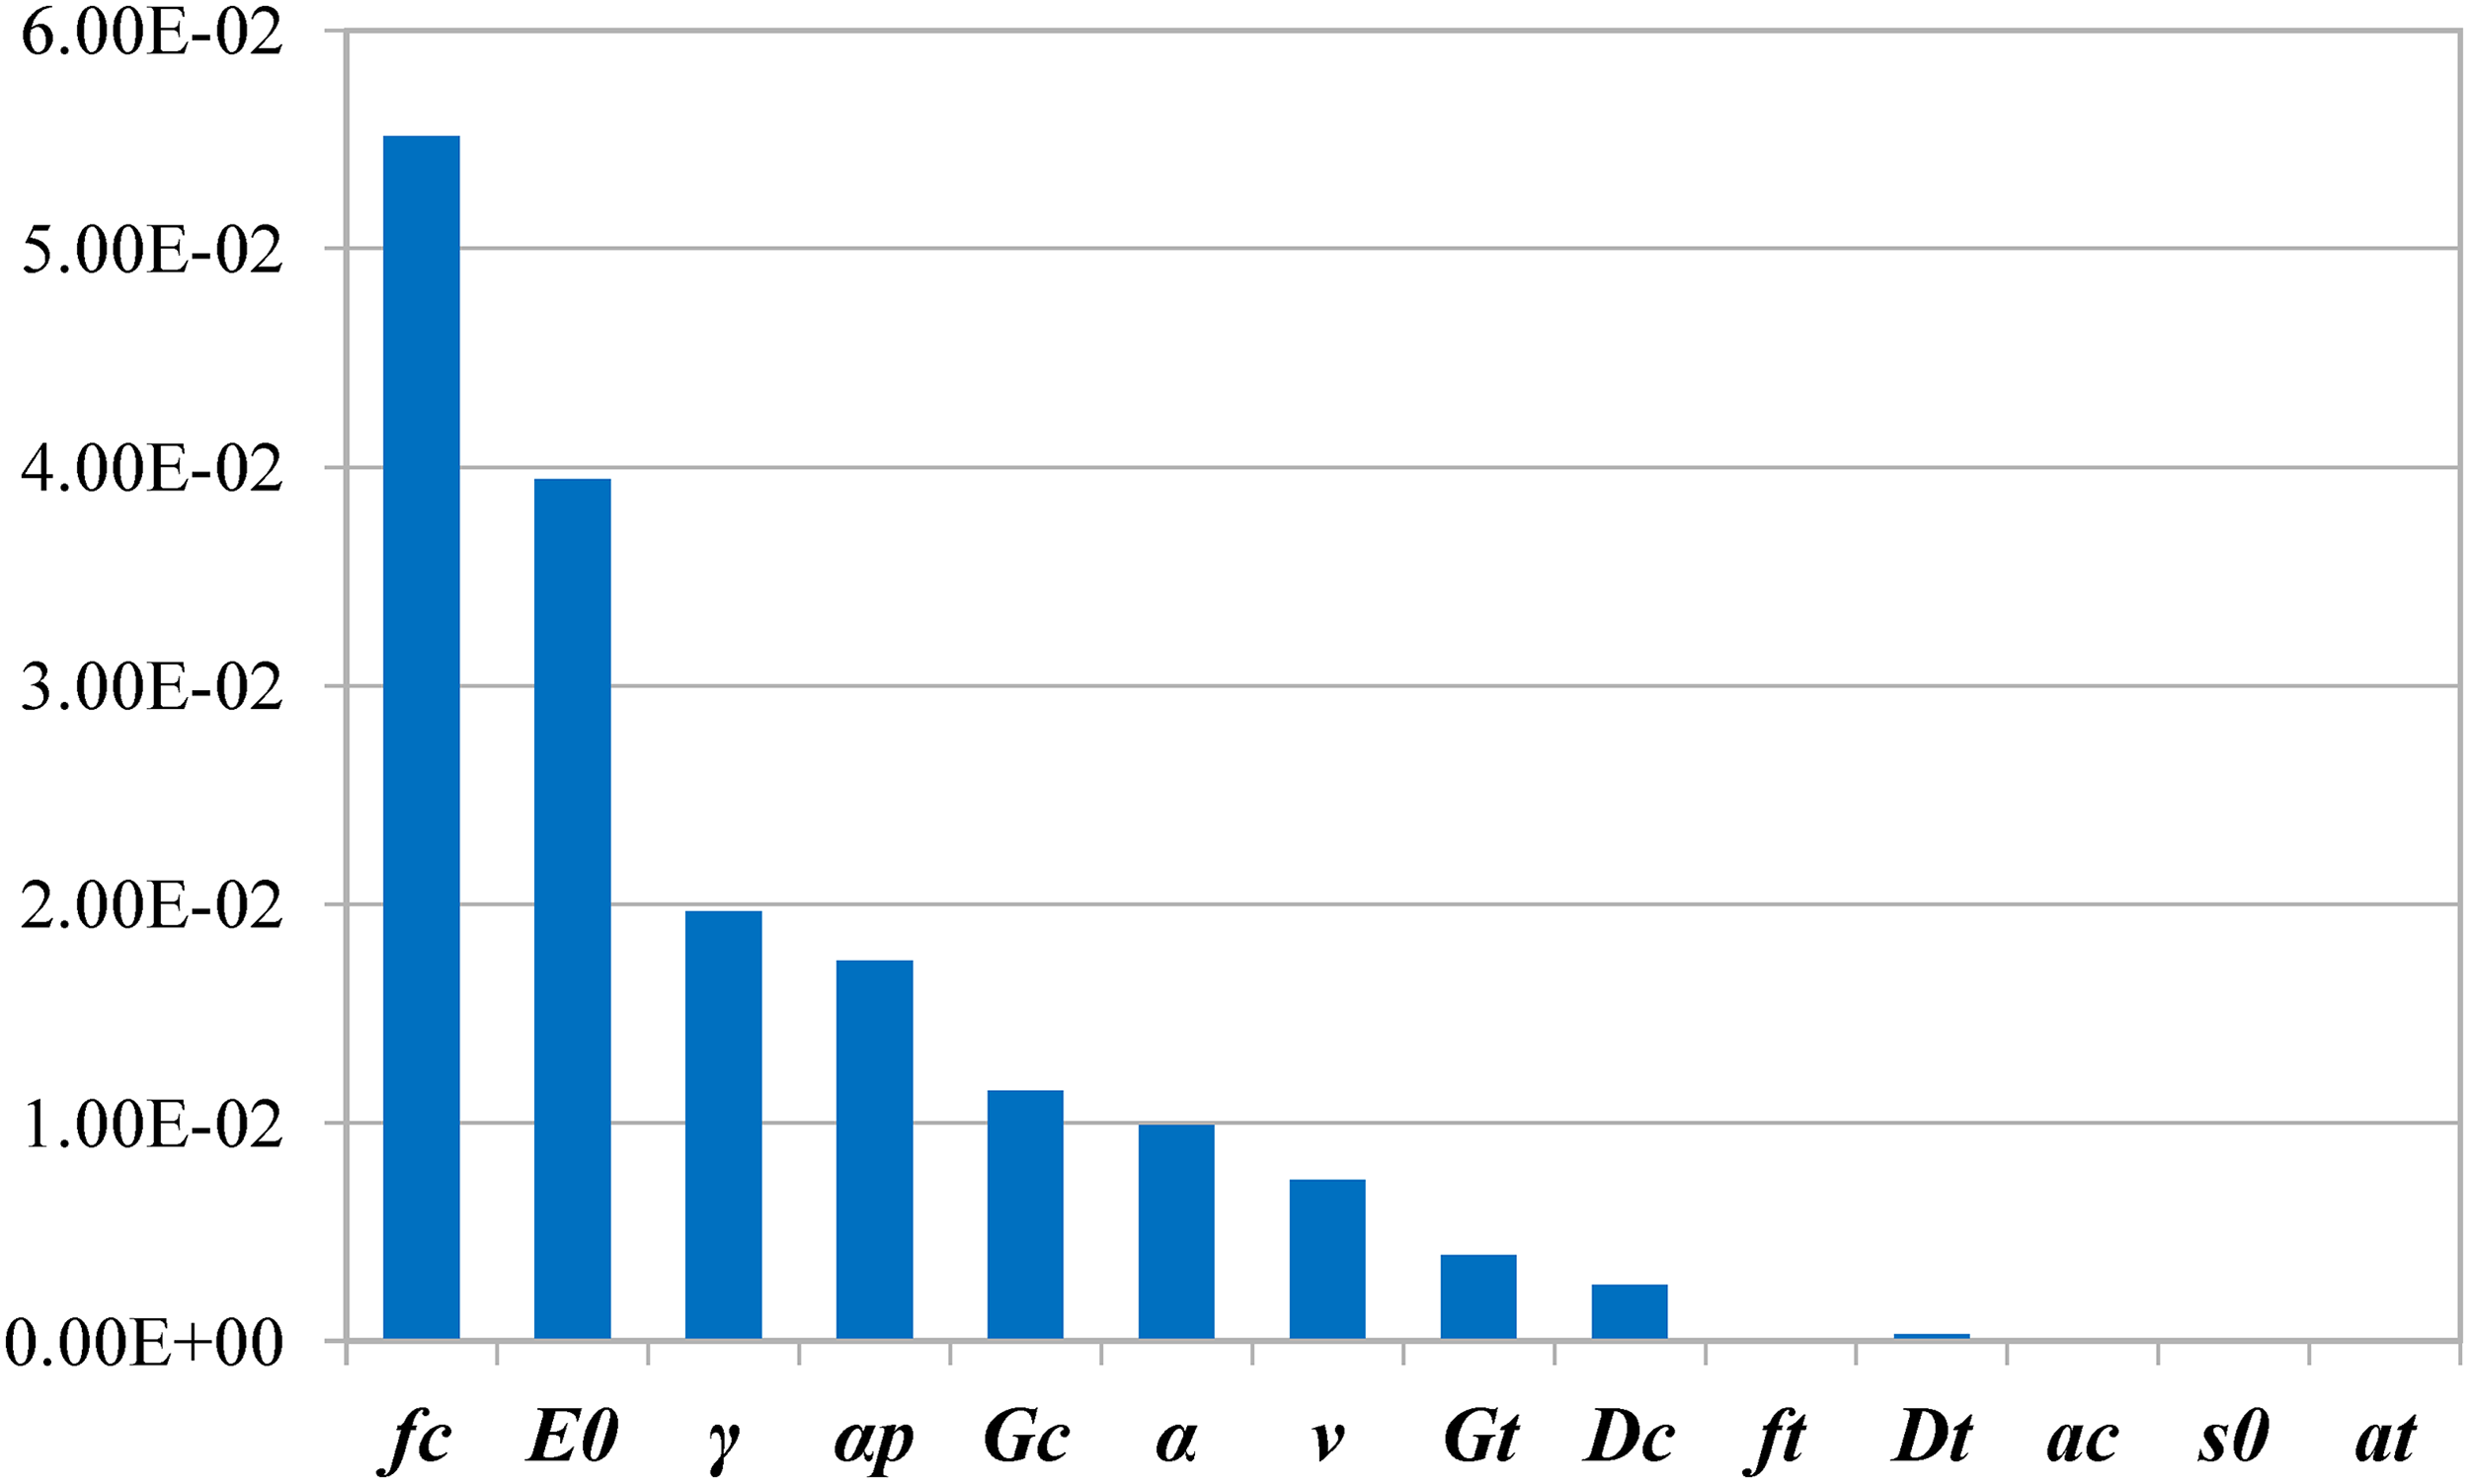
Influence of parameters on shear force in shear tests.
The influence of individual parameters is analysed through the mean value. It can be seen from Figure 15 that the parameters that determine material shear strength have the greatest influence on the output variable. In this case, these are parameters
Dp model parameters
DP model parameters for uniaxial compression test scale
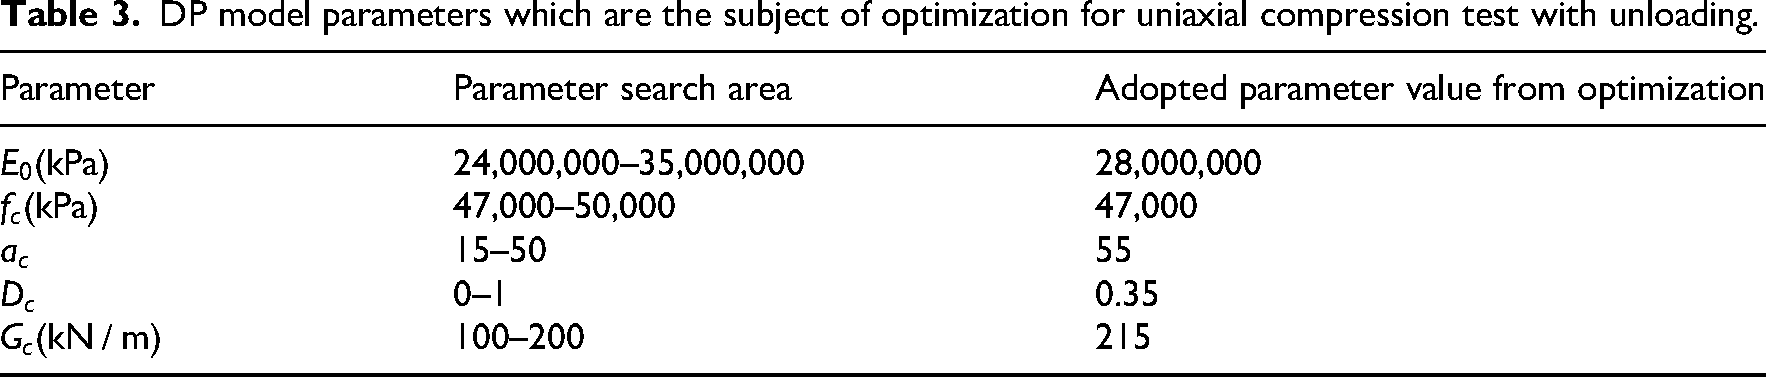
Based on the sensitivity analysis results (Section 4.3.2), the optimization parameters were adopted (Table 3). Out of 14 parameters of the DP model, 5 parameters were selected that have the greatest influence on the total deformation obtained from uniaxial compression test with unloading. Other parameters do not have a significant impact on the output variable during uniaxial compression test with unloading and are not the subject of optimization. Based on the conducted optimization analysis, using the FEM model for uniaxial compression test with unloading (Section 4.1.1) and experimental results, and the proposed search areas (Table 3) for certain parameters, the parameters that give the lowest value of the optimization criteria were adopted (Table 3).
DP model parameters which are the subject of optimization for uniaxial compression test with unloading.
DP model parameters for in situ shear test scale
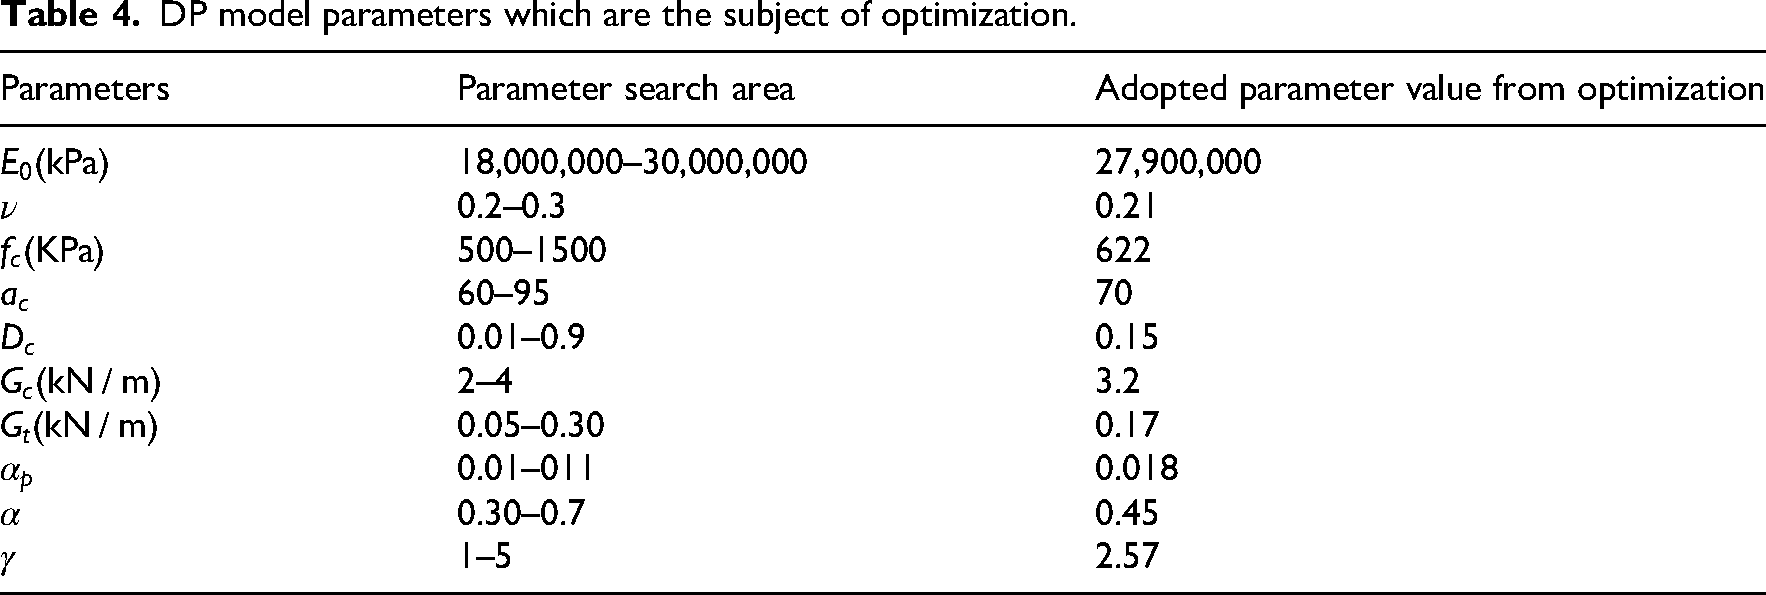
Based on the results of the sensitivity analysis (Section 4.3.3), the parameters that are the subject of optimization were adopted (Table 4). From 14 parameters of the DP model, 10 parameters were selected that have the greater influence on the mean deformation under normal stress and on the shear force in the shearing phase. Search areas (Table 4) in the optimization algorithm are given for each parameter that is the subject of optimization.
DP model parameters which are the subject of optimization.
The result of the optimization analysis is the values of criteria (objective functions) for different combinations of parameters, which are displayed through the Pareto front of optimal solutions (Figure 16). The horizontal axis shows the values of criterion 1, which refers to normal displacements under the action of normal stress. The vertical axis shows the values of criterion 2, which refers to shear forces during shear test. From the Pareto front, the combination of parameters that gives the lowest value according to both criteria is adopted. The authors adopted the solution with criterion values
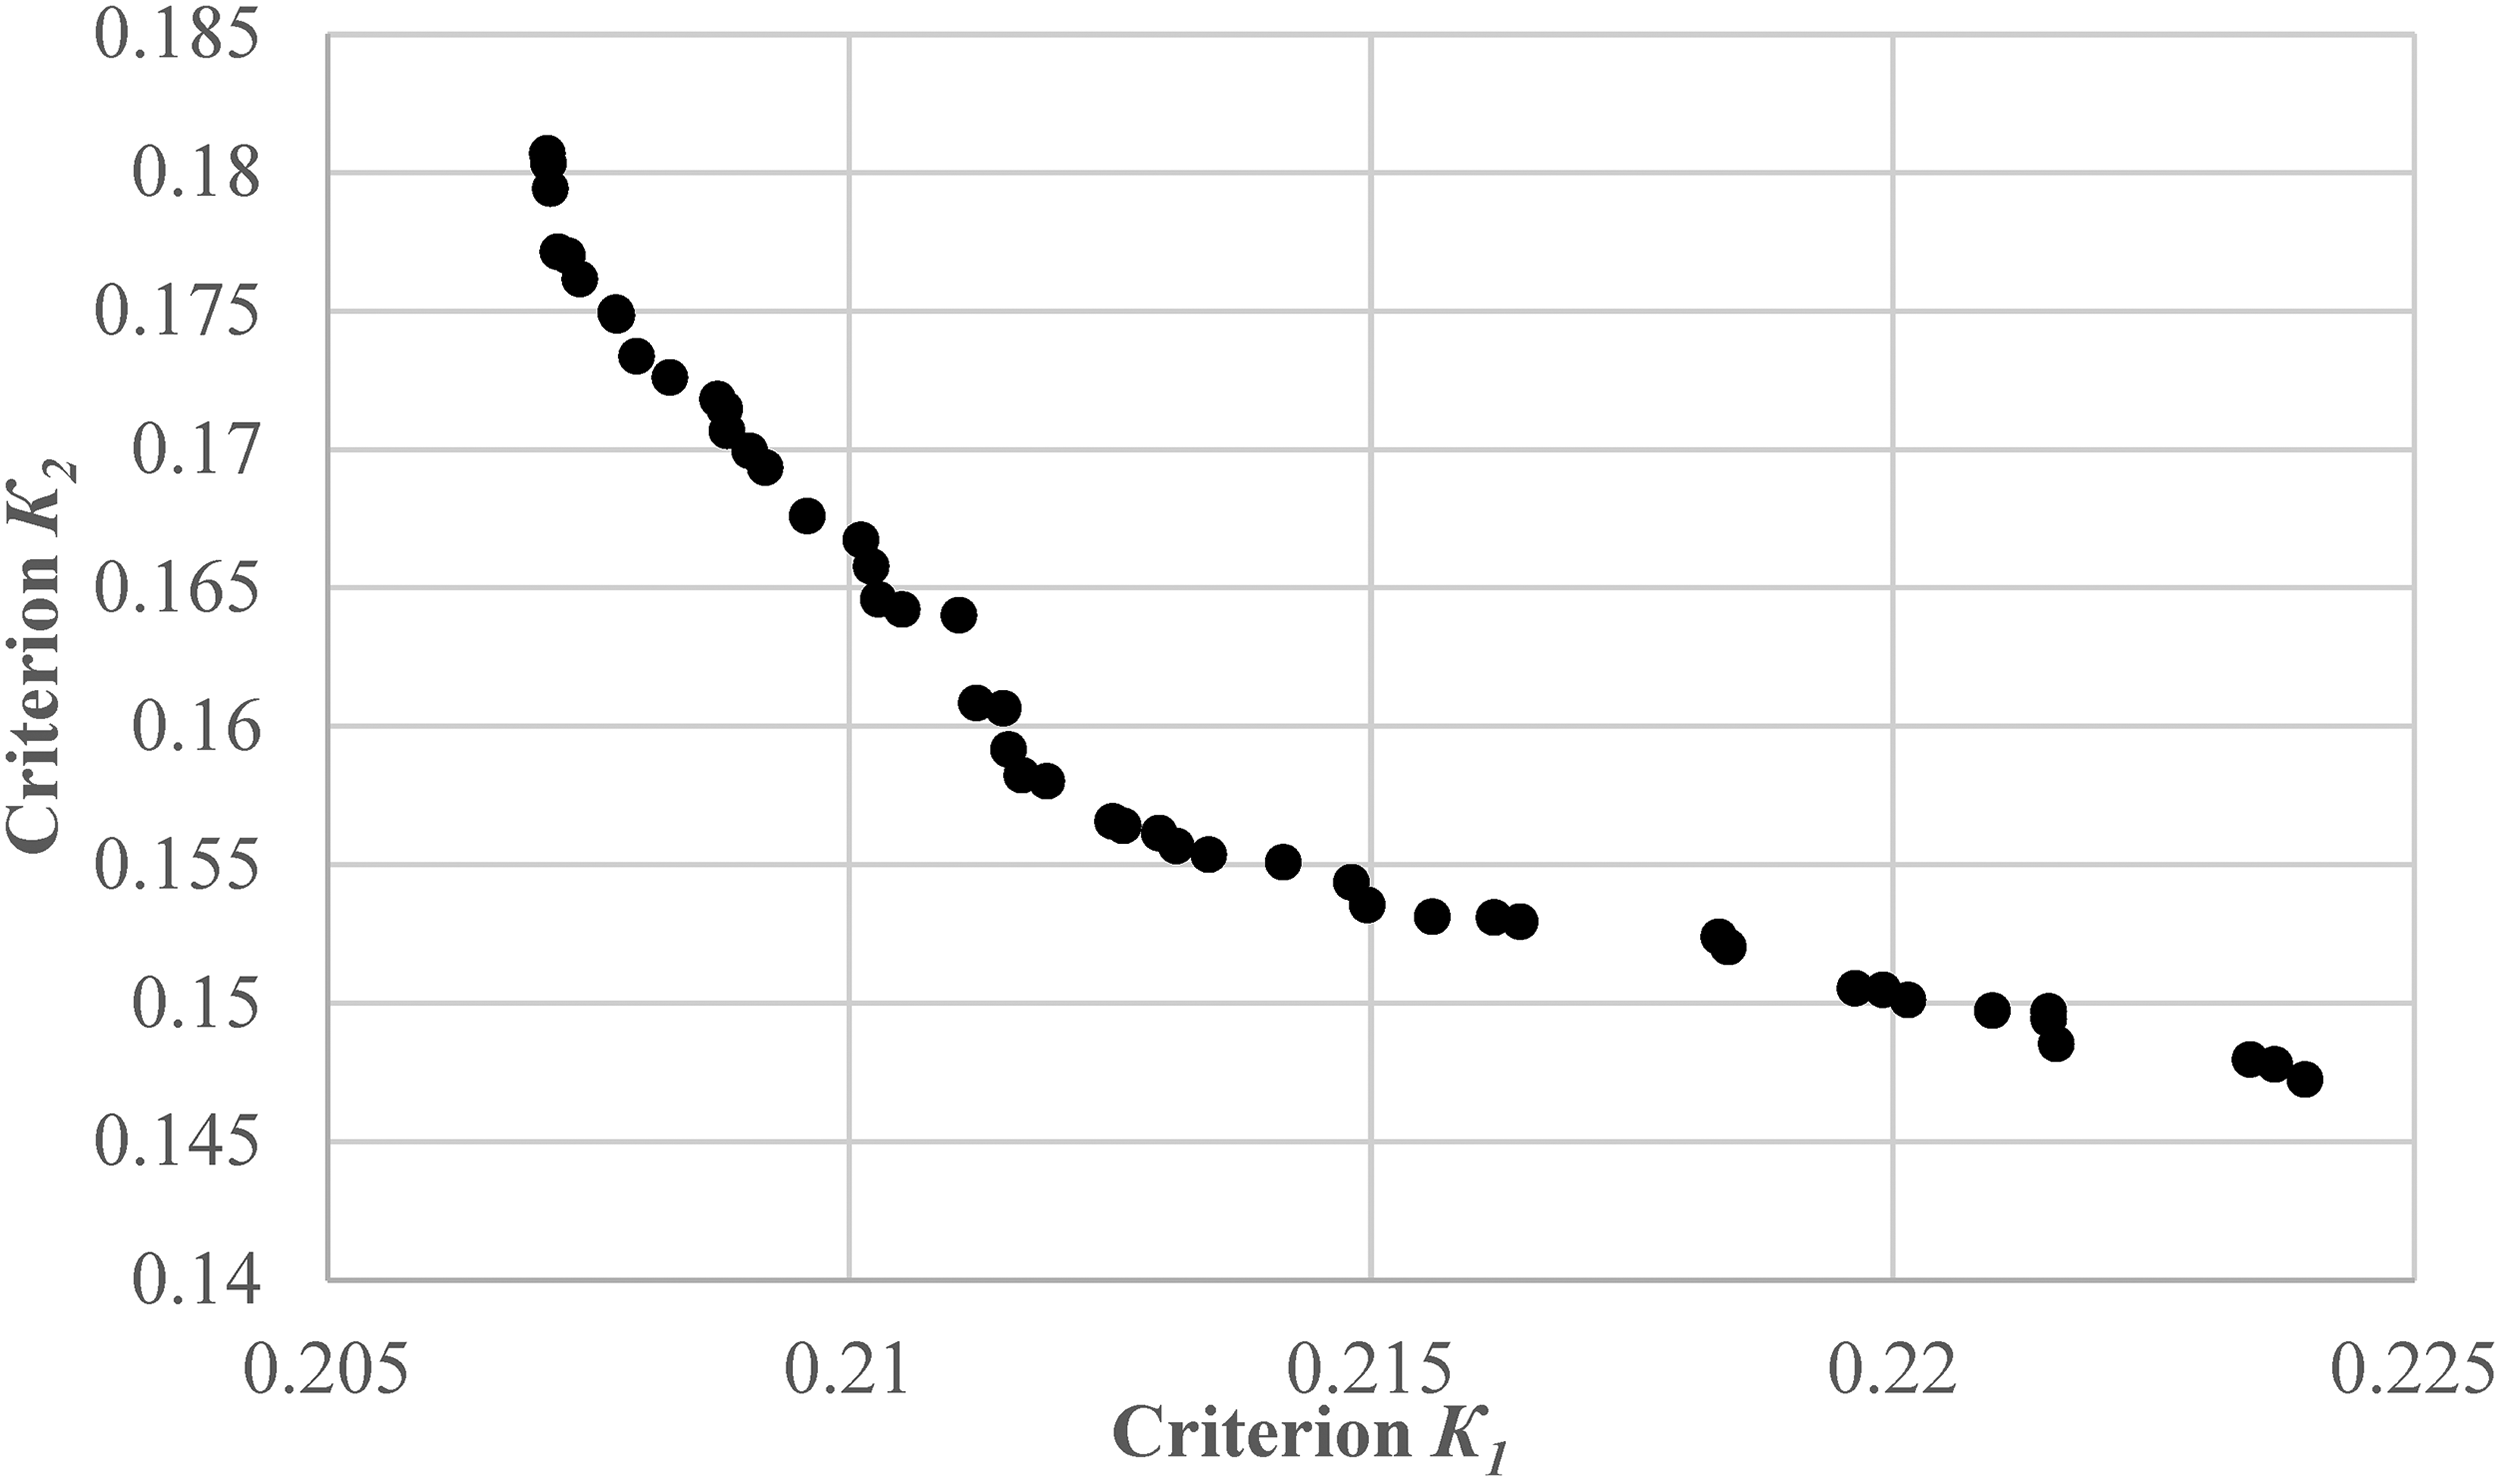
Pareto front of optimal solutions.
Results and discussion
For the adopted values of the DP model parameters, using the FEM model of uniaxial compression test with unloading, the results of compressive stress – total strain were obtained. These results are shown alongside the experimental results for the same compressive stress levels (Figure 16). The average deviation of the experimental results from the FEM ones is 16.9%.
For the adopted parameters, results of the shear test simulation using the FEM model were calculated. Figure 17 shows the comparison of normal displacements during the experiment and during the numerical simulation for the same values of normal stresses. In Figure 18, the comparison of shear forces during the experiment and during the numerical simulation for the same values of shear displacements is presented.
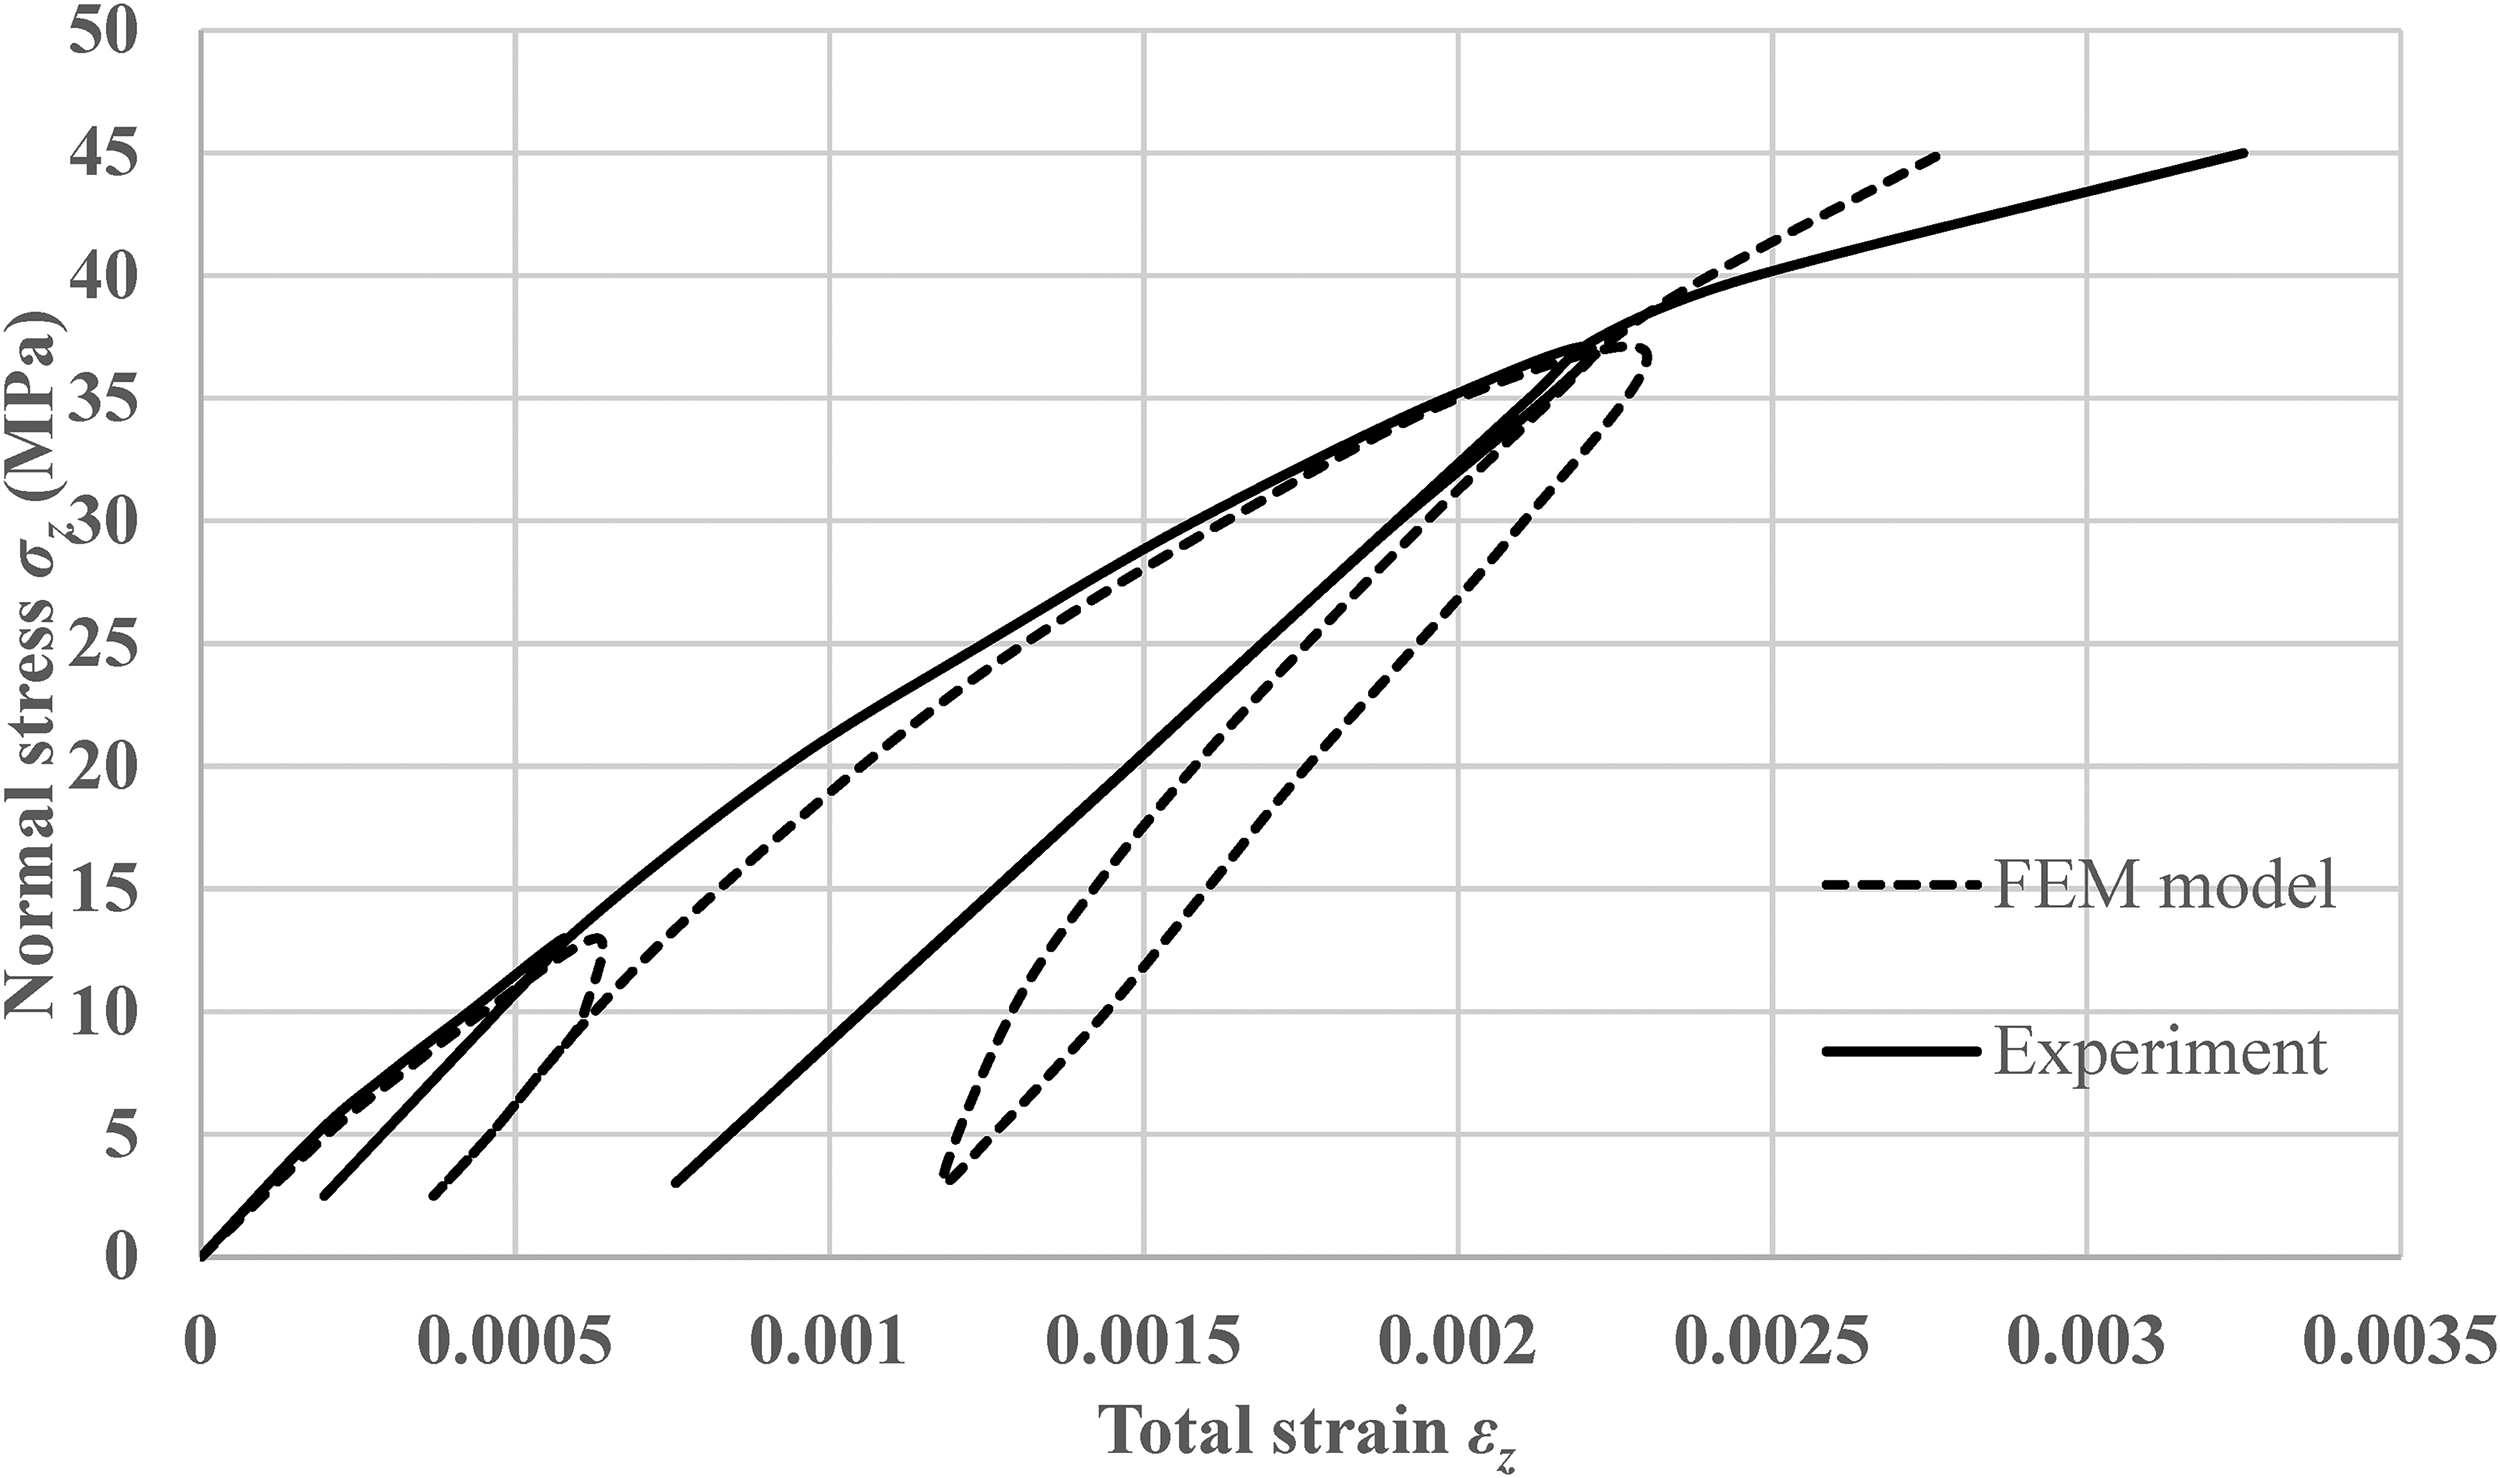
Uniaxial compression test with unloading: normal stress – total strain (experimental and finite element model (FEM) results for the adopted DP model parameters).
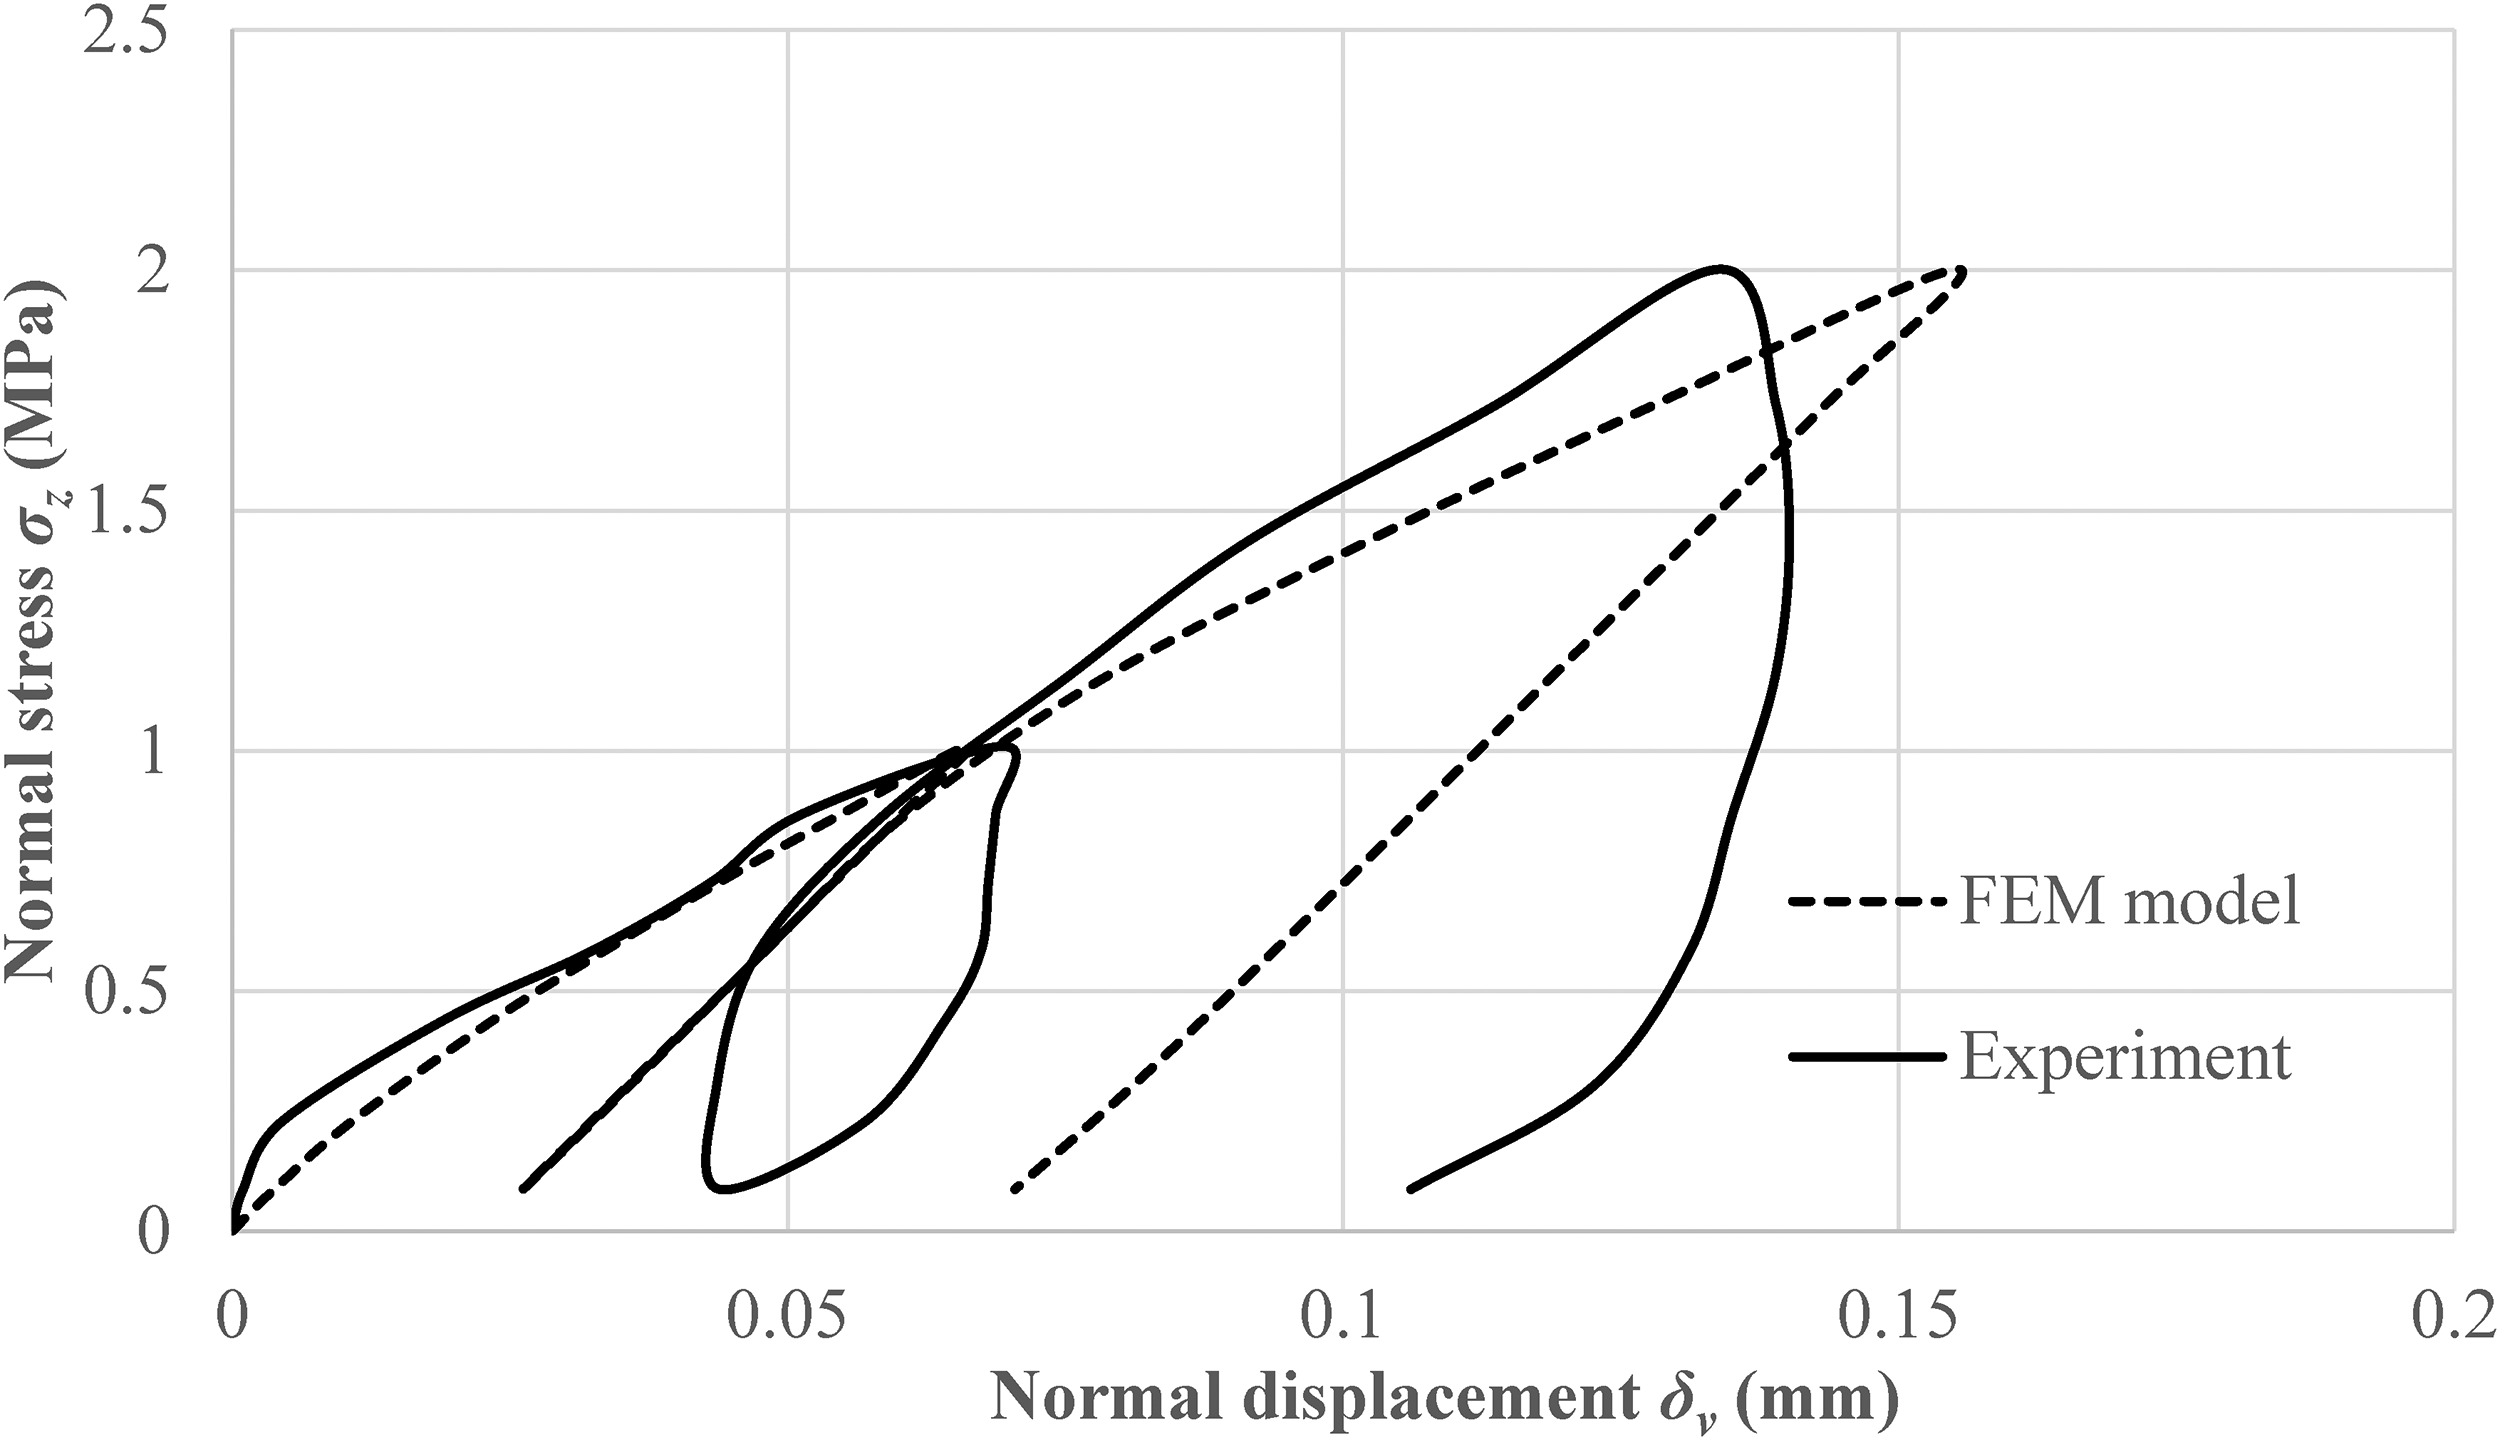
Shear test: normal stress – normal displacement from the experiment and the finite element model (FEM) model (comparative presentation).
Table 5 shows the DP model parameters obtained for the sample scale and for the in situ scale of shear test.
Comparative presentation of the obtained parameters for different scales of the rock mass.
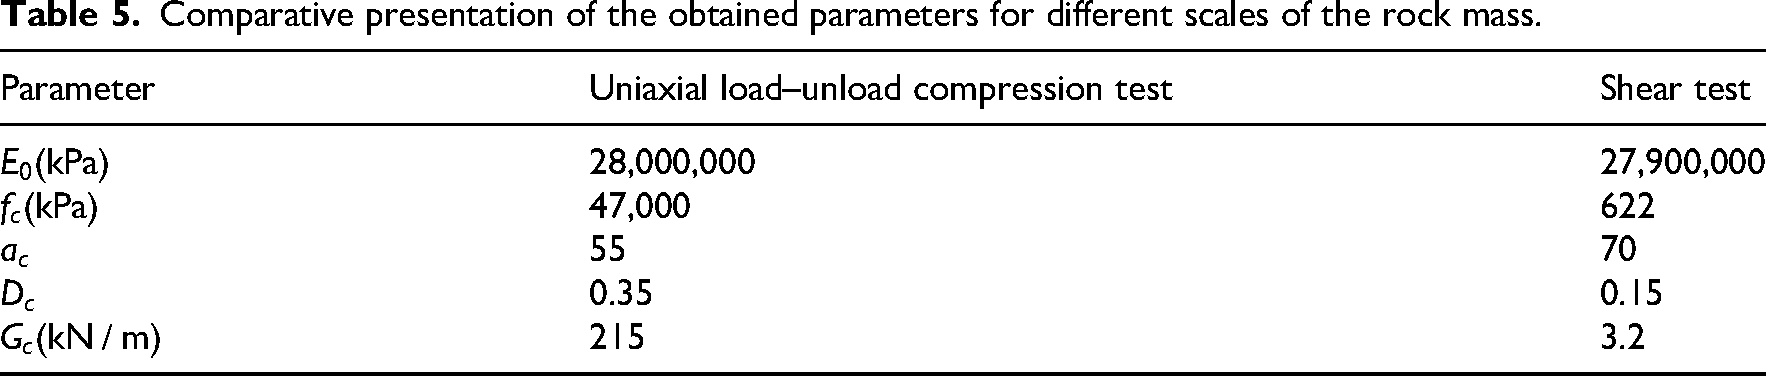
Based on the results shown in Table 5, ratio between the parameters obtained from uniaxial cyclic compression test and the shear test are shown (Figures 19 and 20).
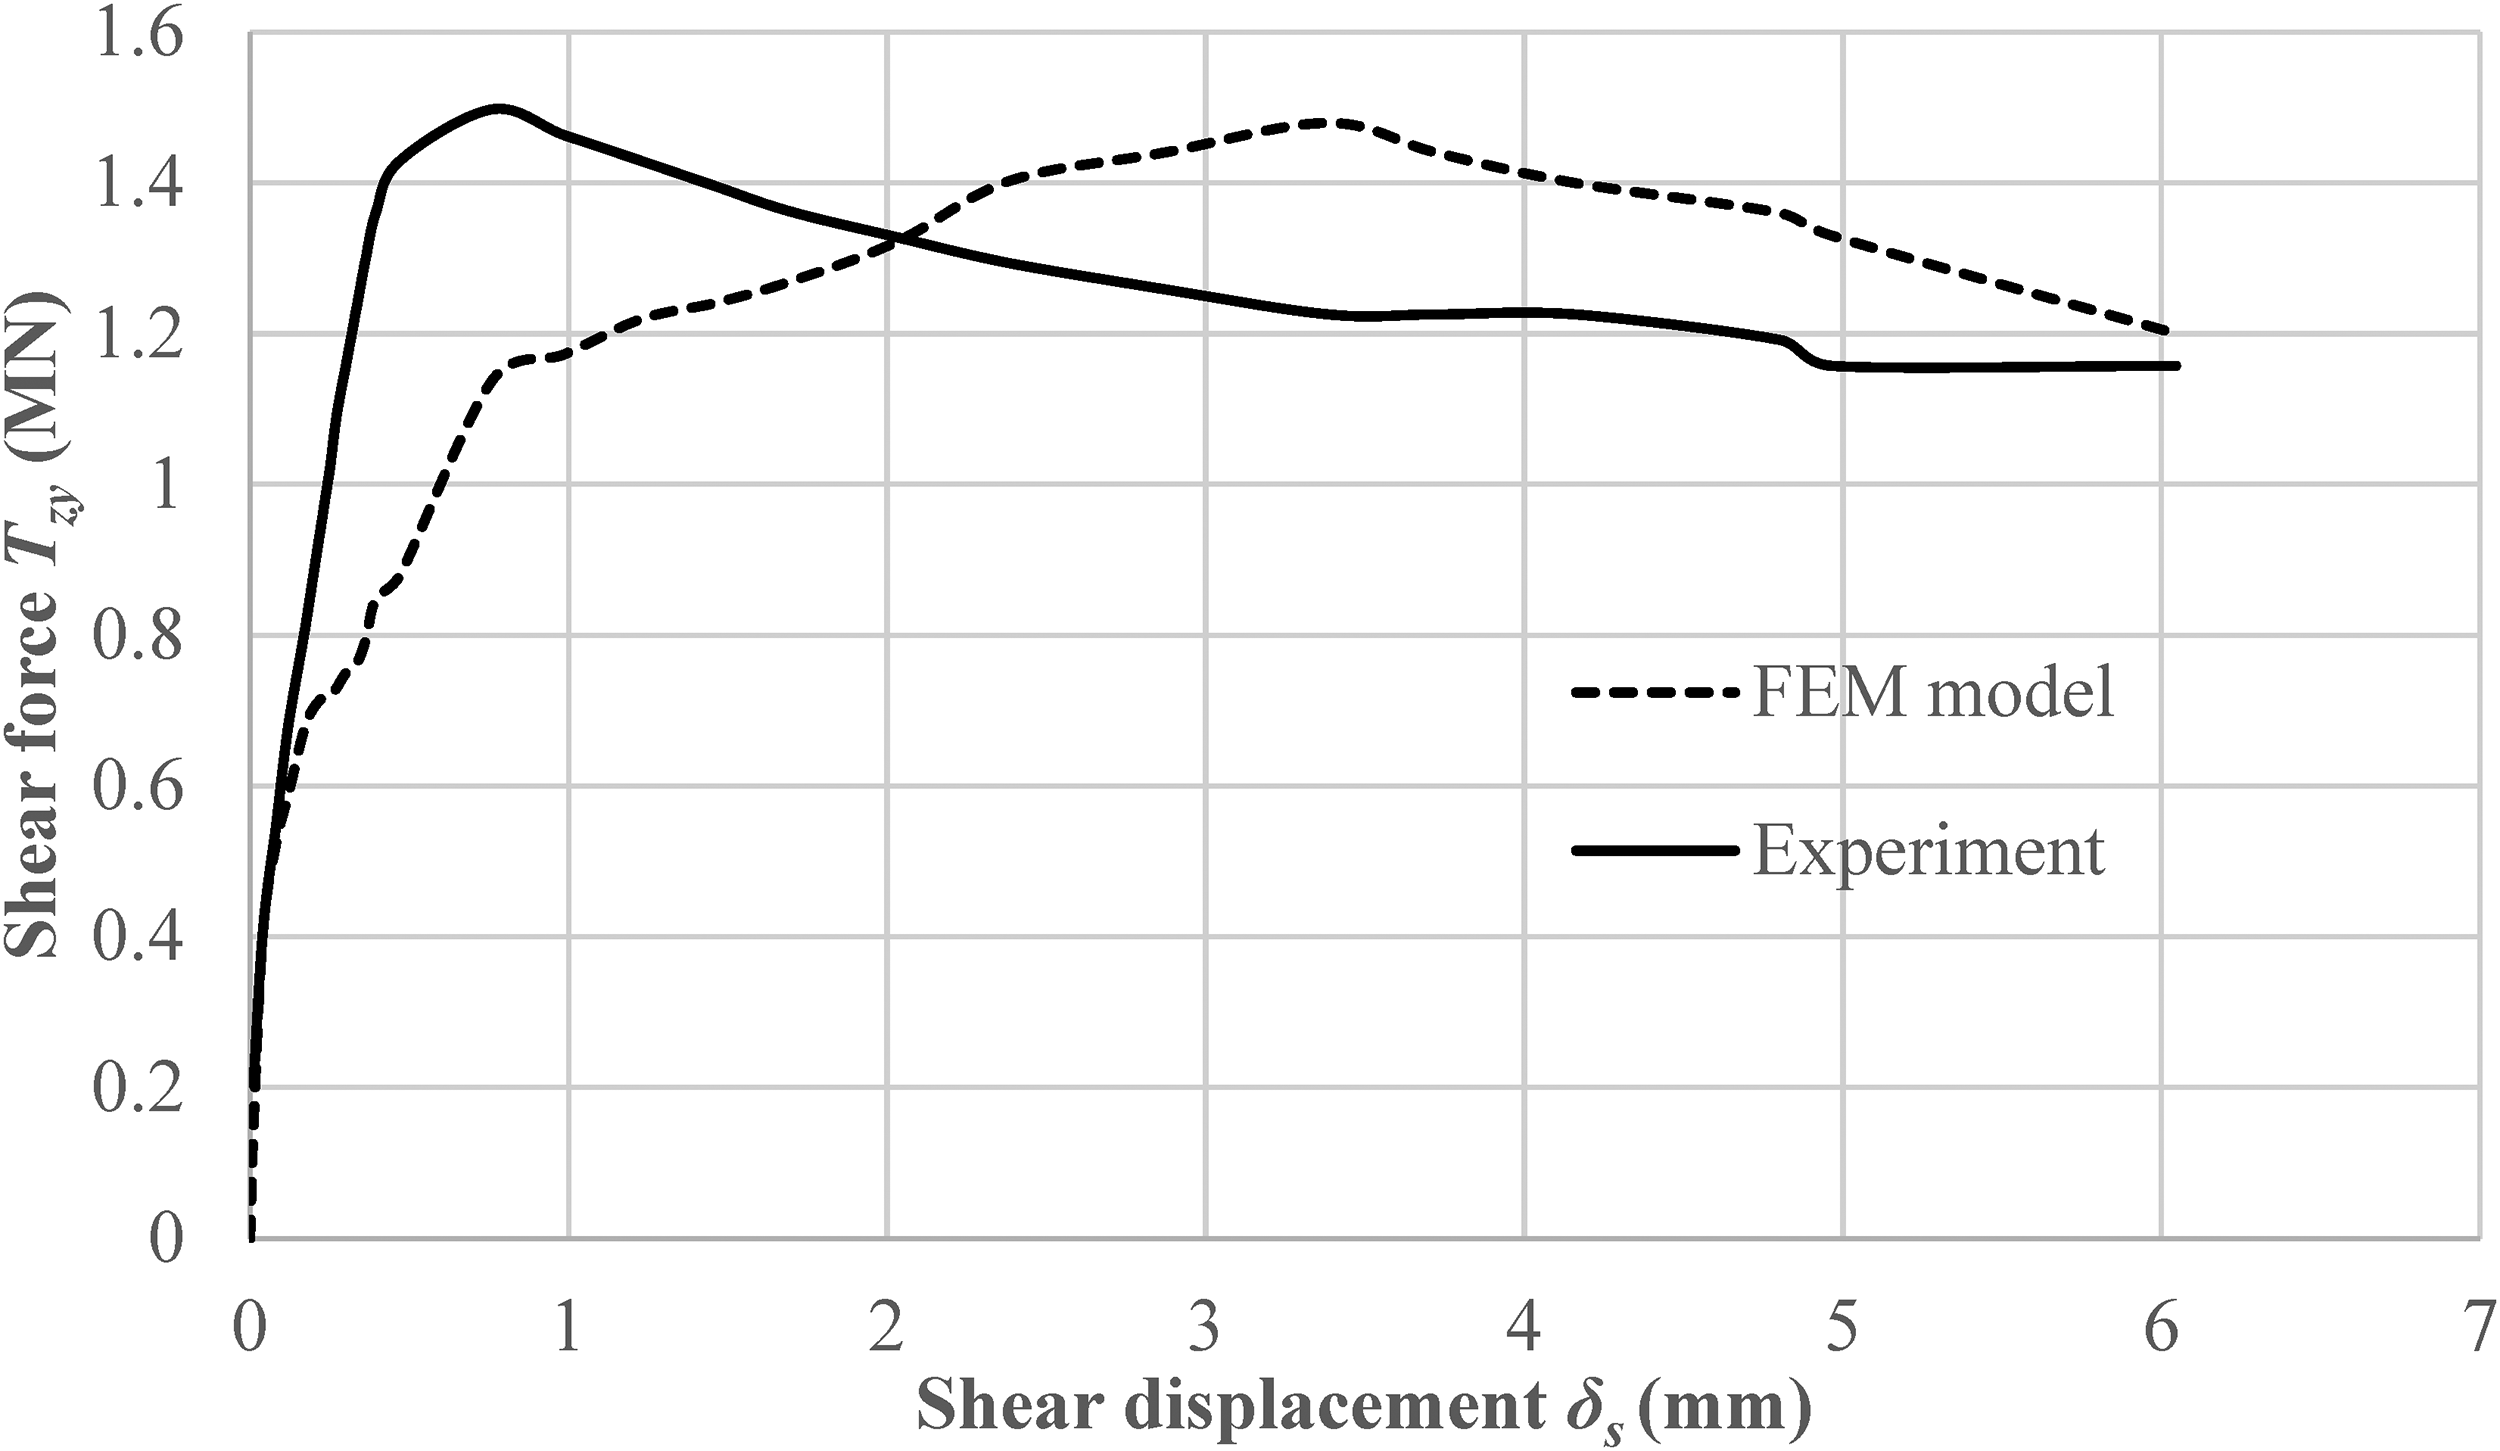
Shear test: shear force – shear displacement from the experiment and the finite element model (FEM) model (comparative presentation).
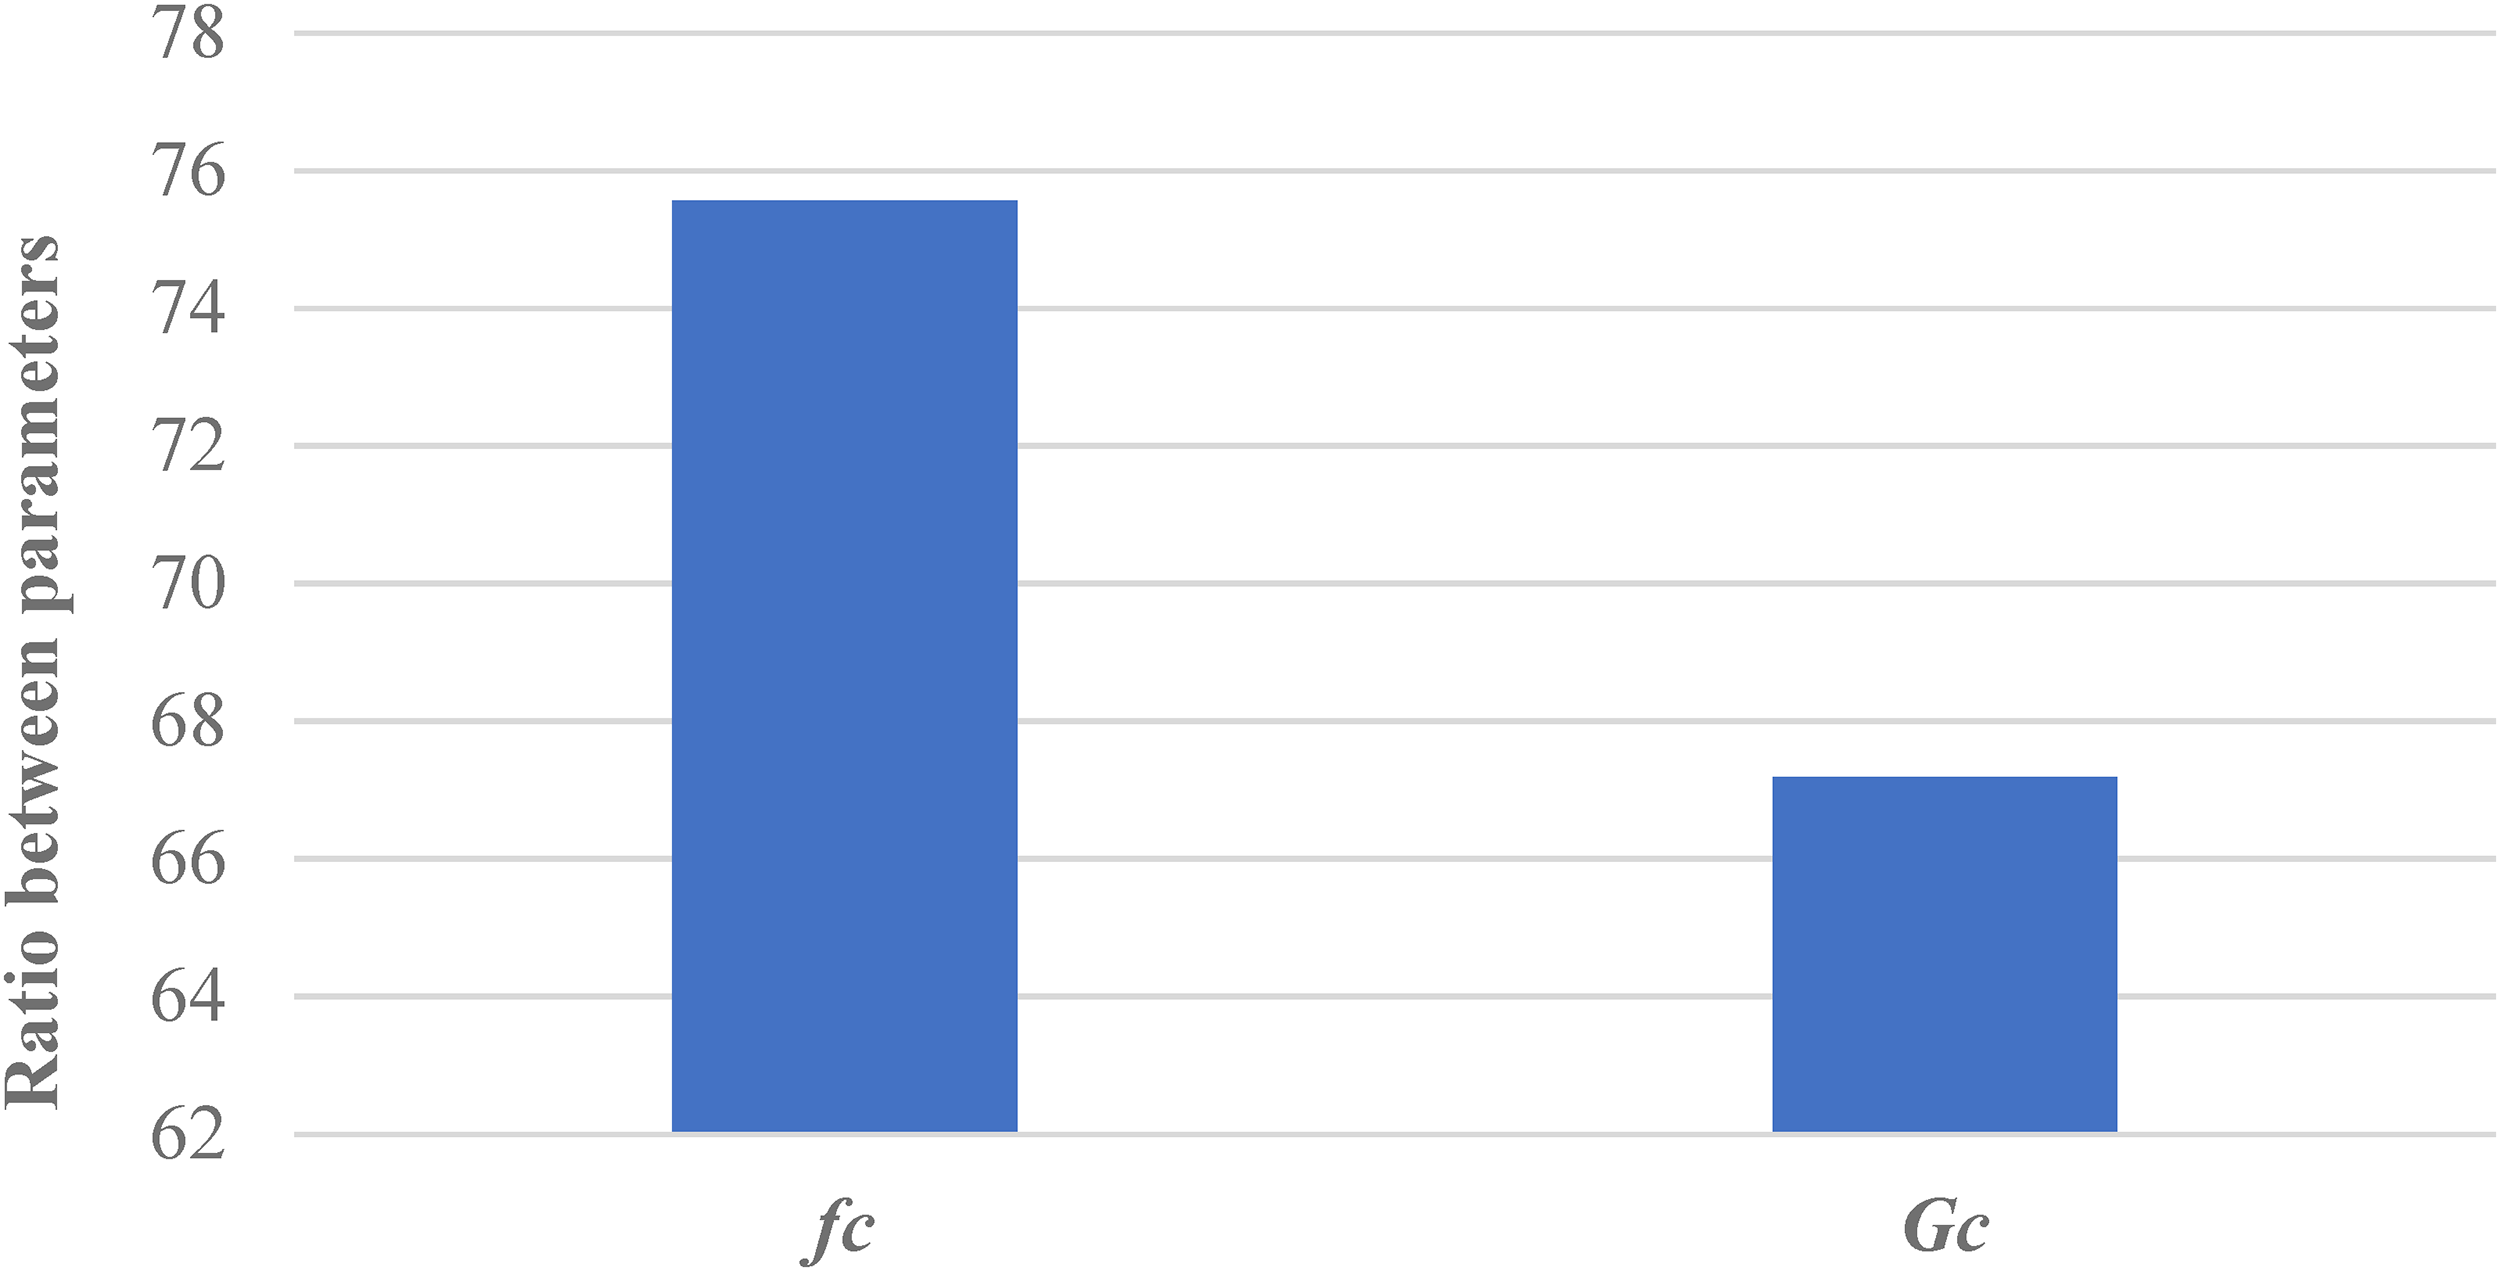
Ratio between parameters
Based on the results obtained, it can be said that certain differences are observed for the analyzed parameters depending on the scale size (Figure 21):
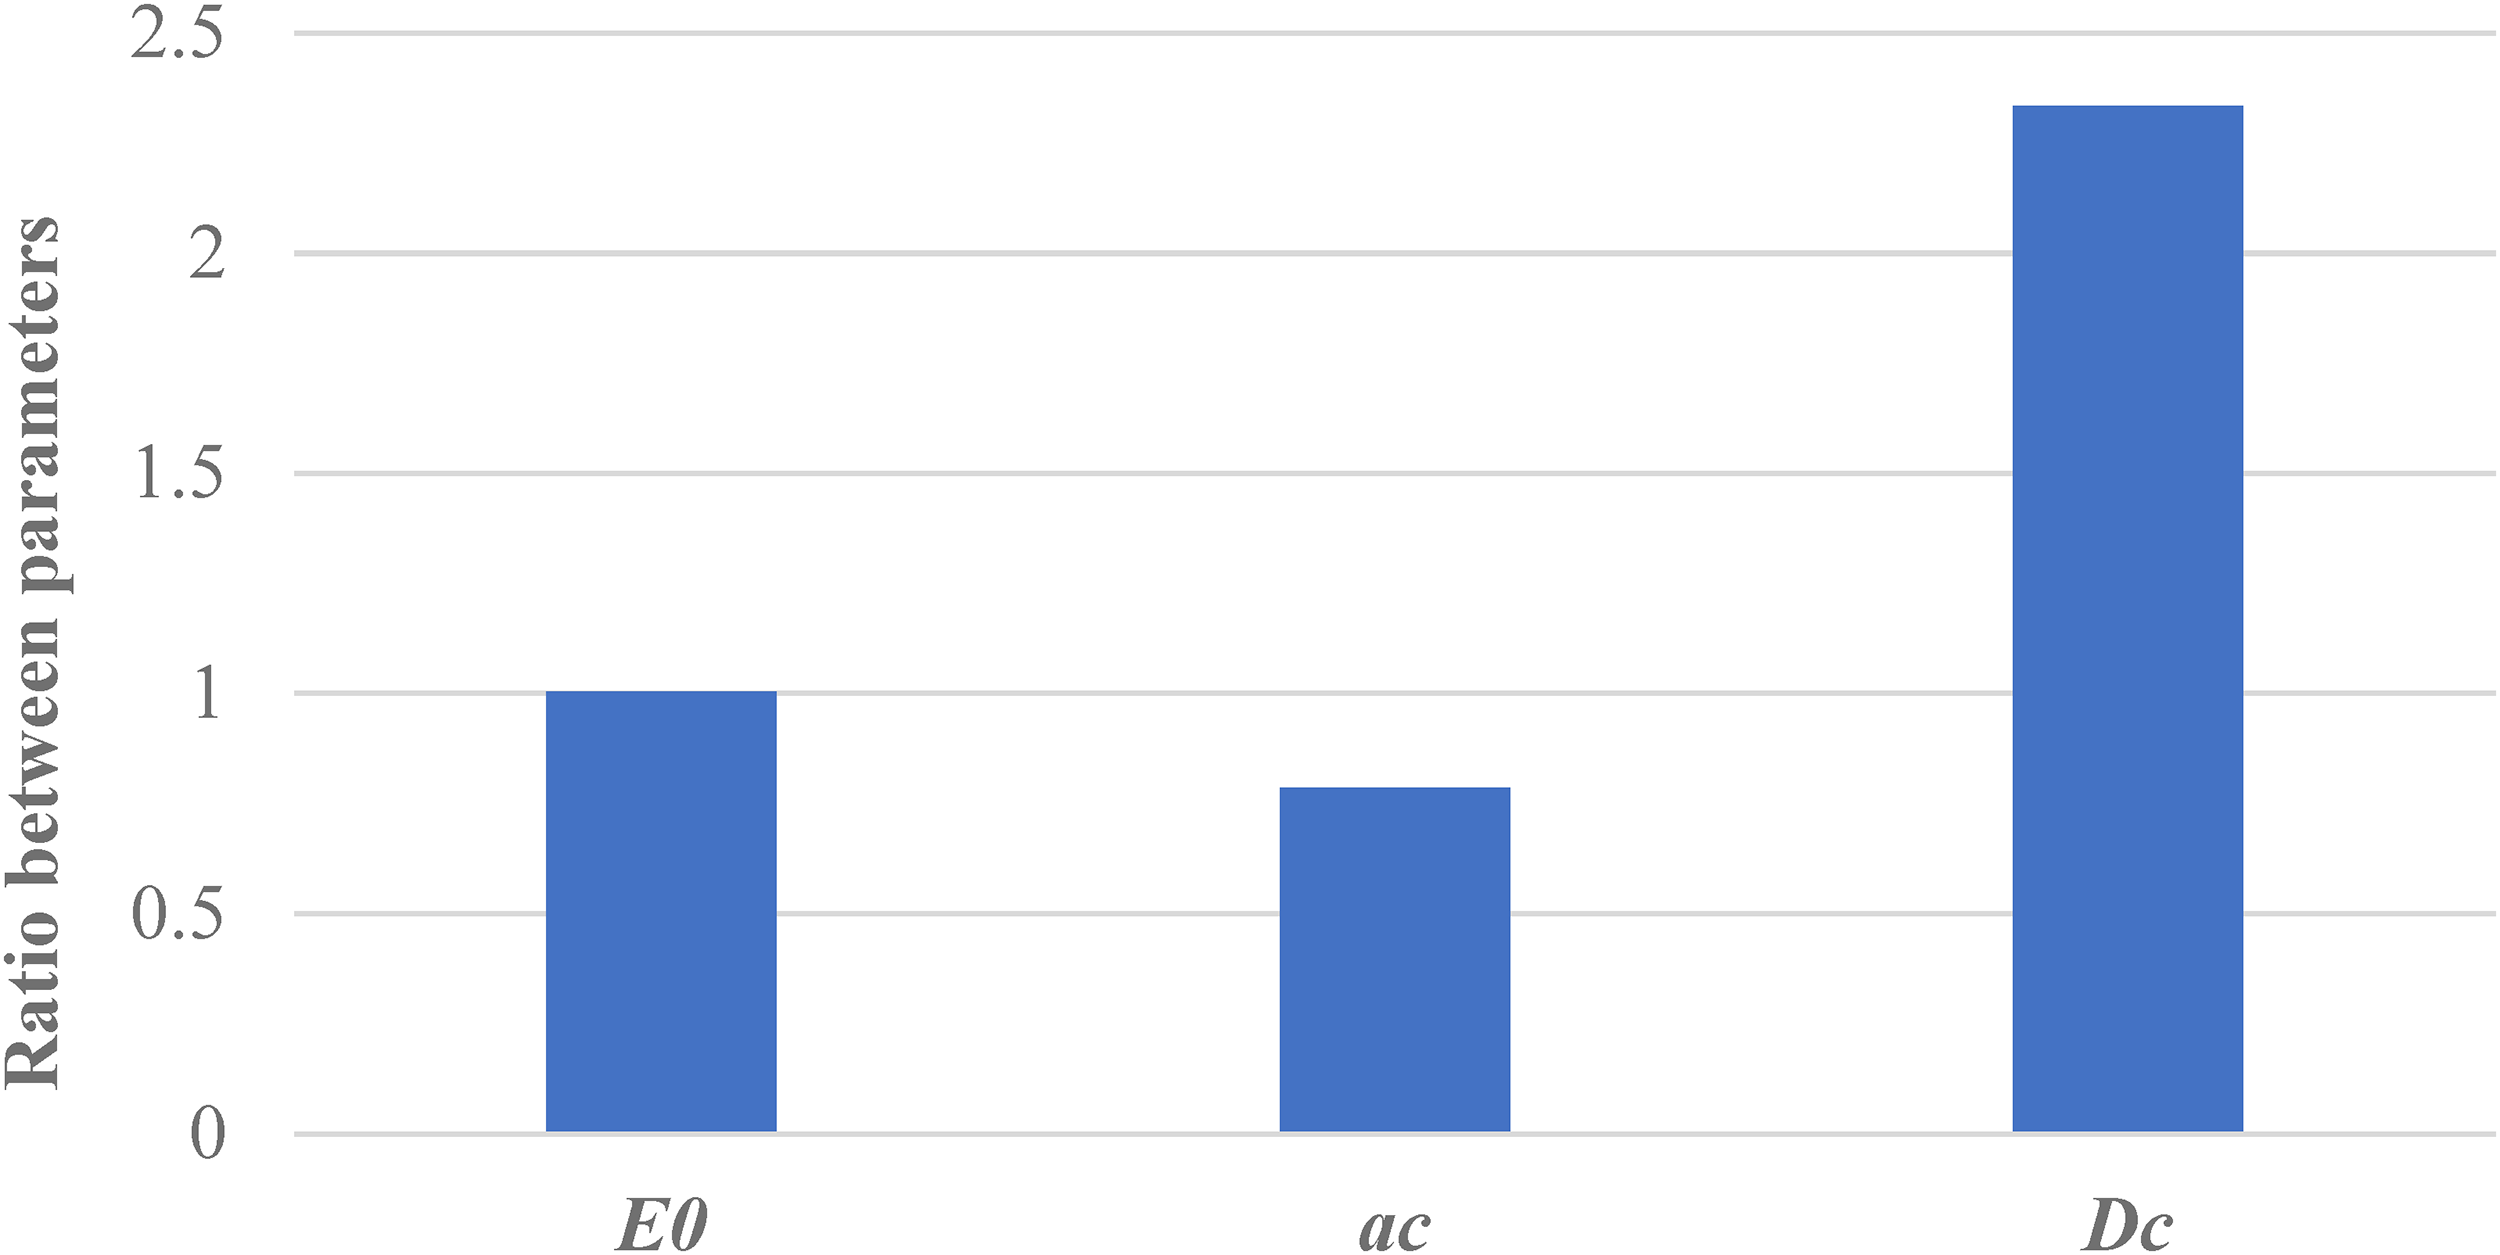
Ratio between parameters
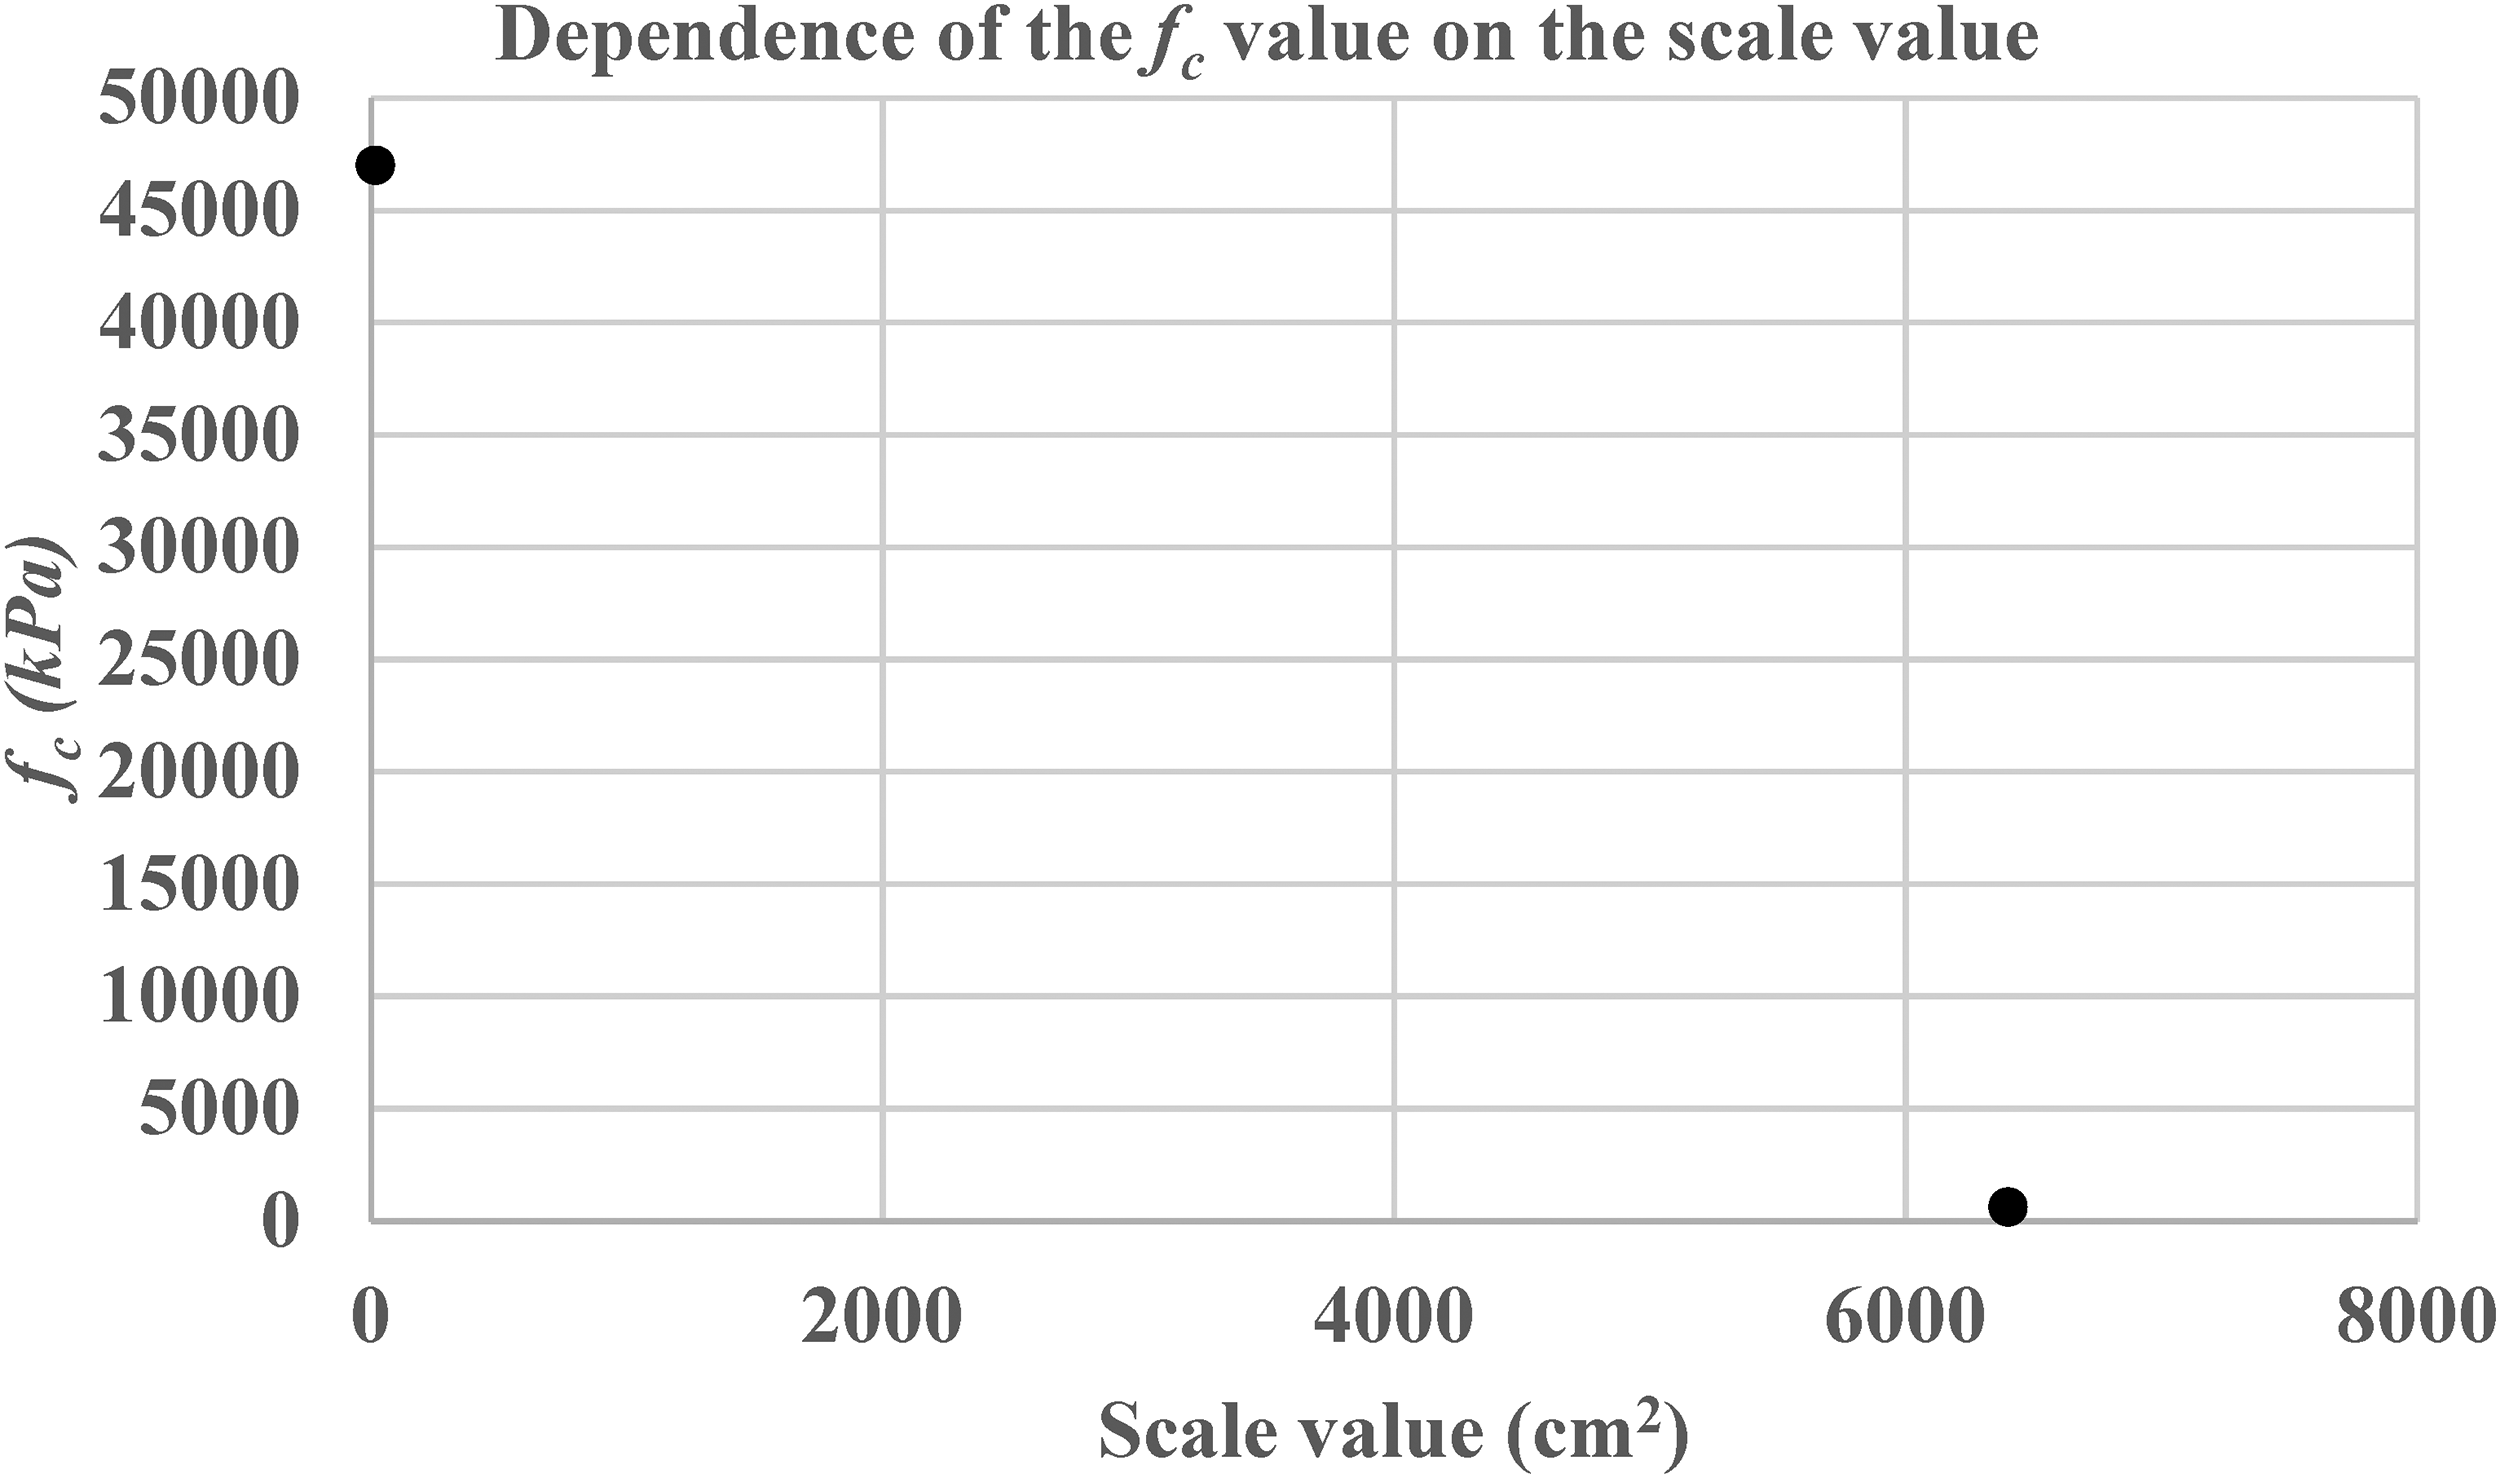
The uniaxial compressive strength
Parameter
The parameter
A pronounced influence of the scale effect on the
It is observed that practically the same value of the initial modulus of elasticity of the rock mass
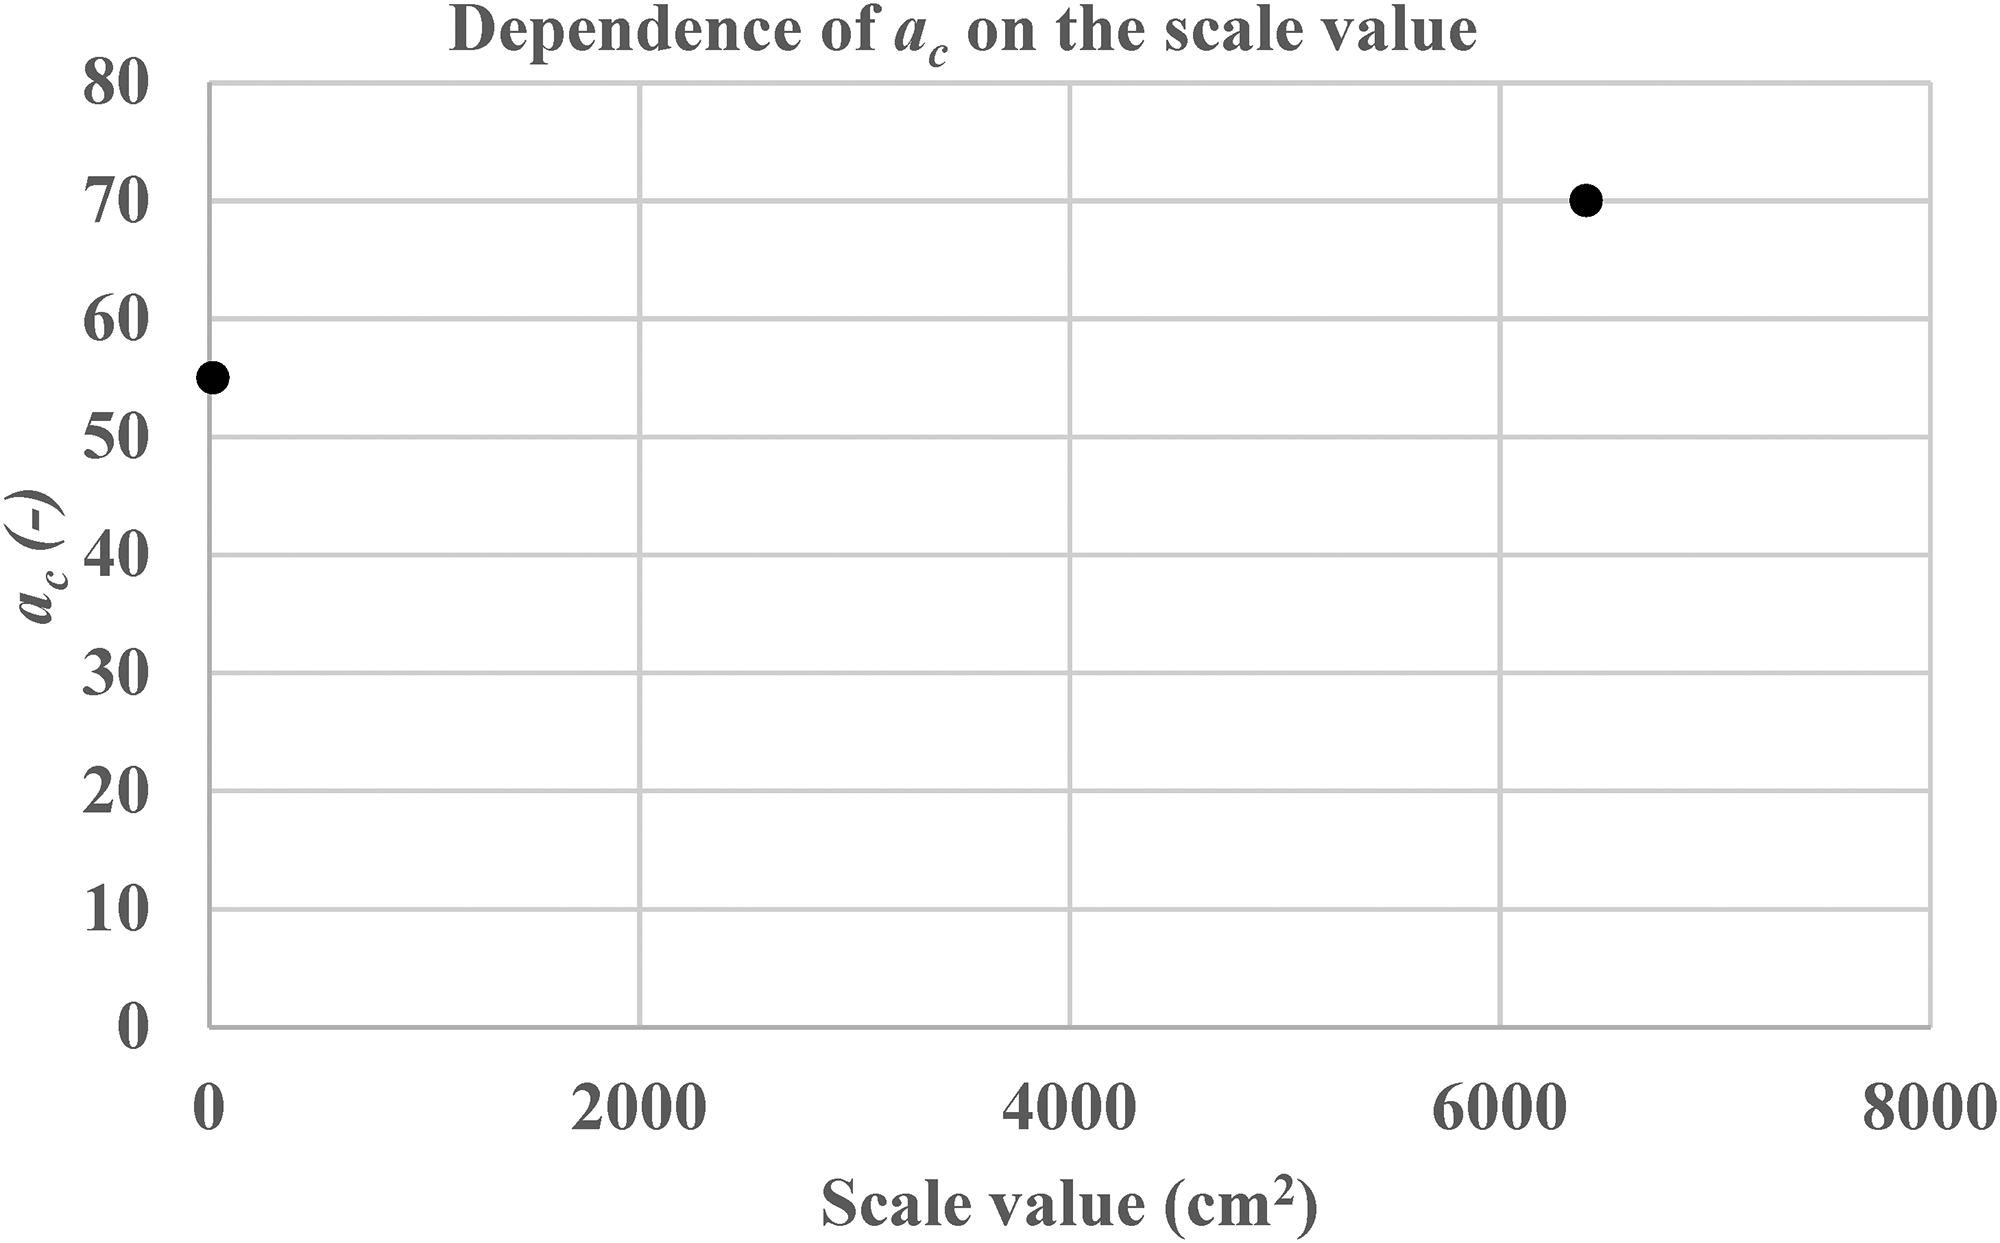
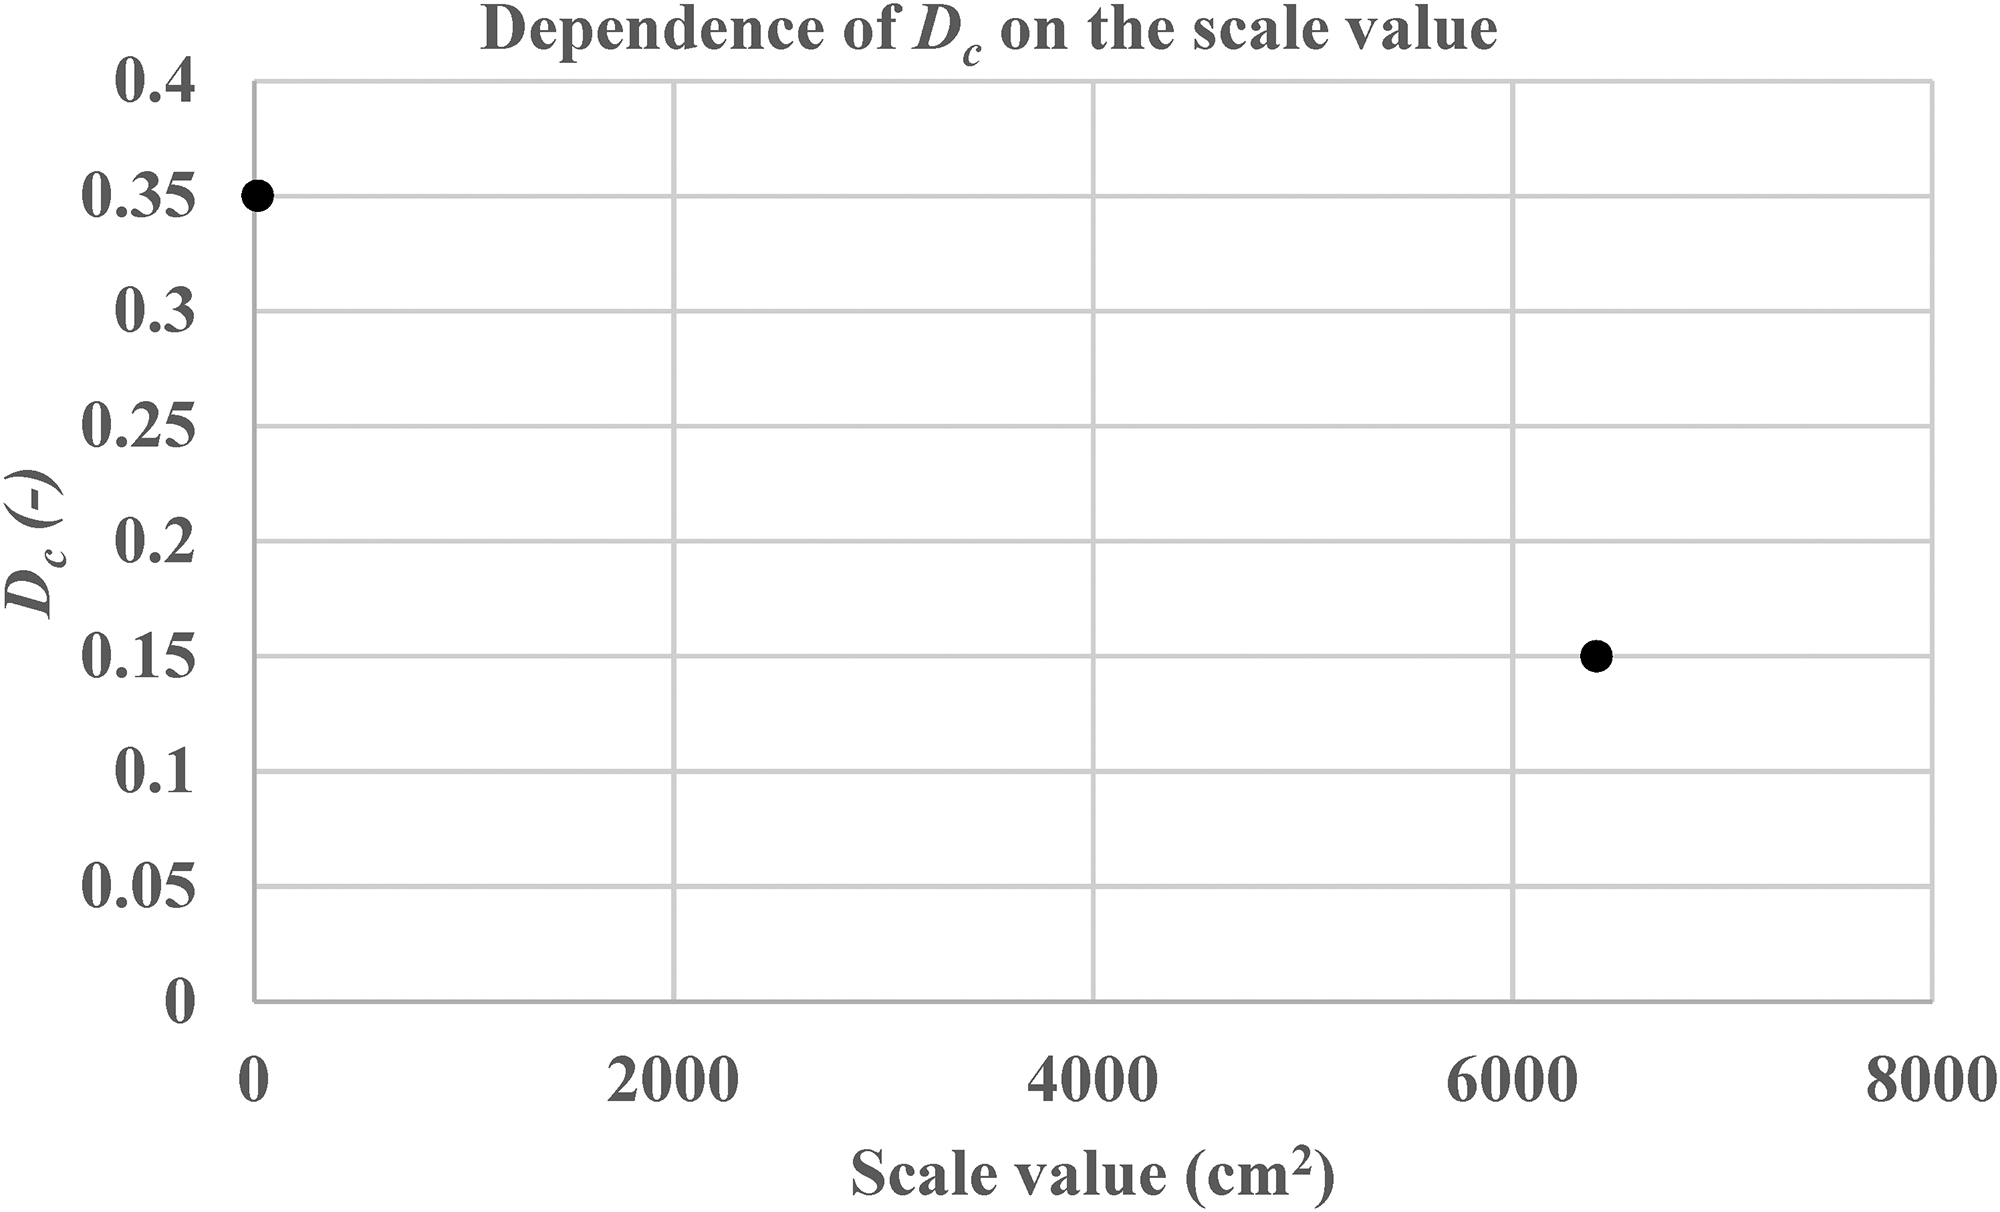
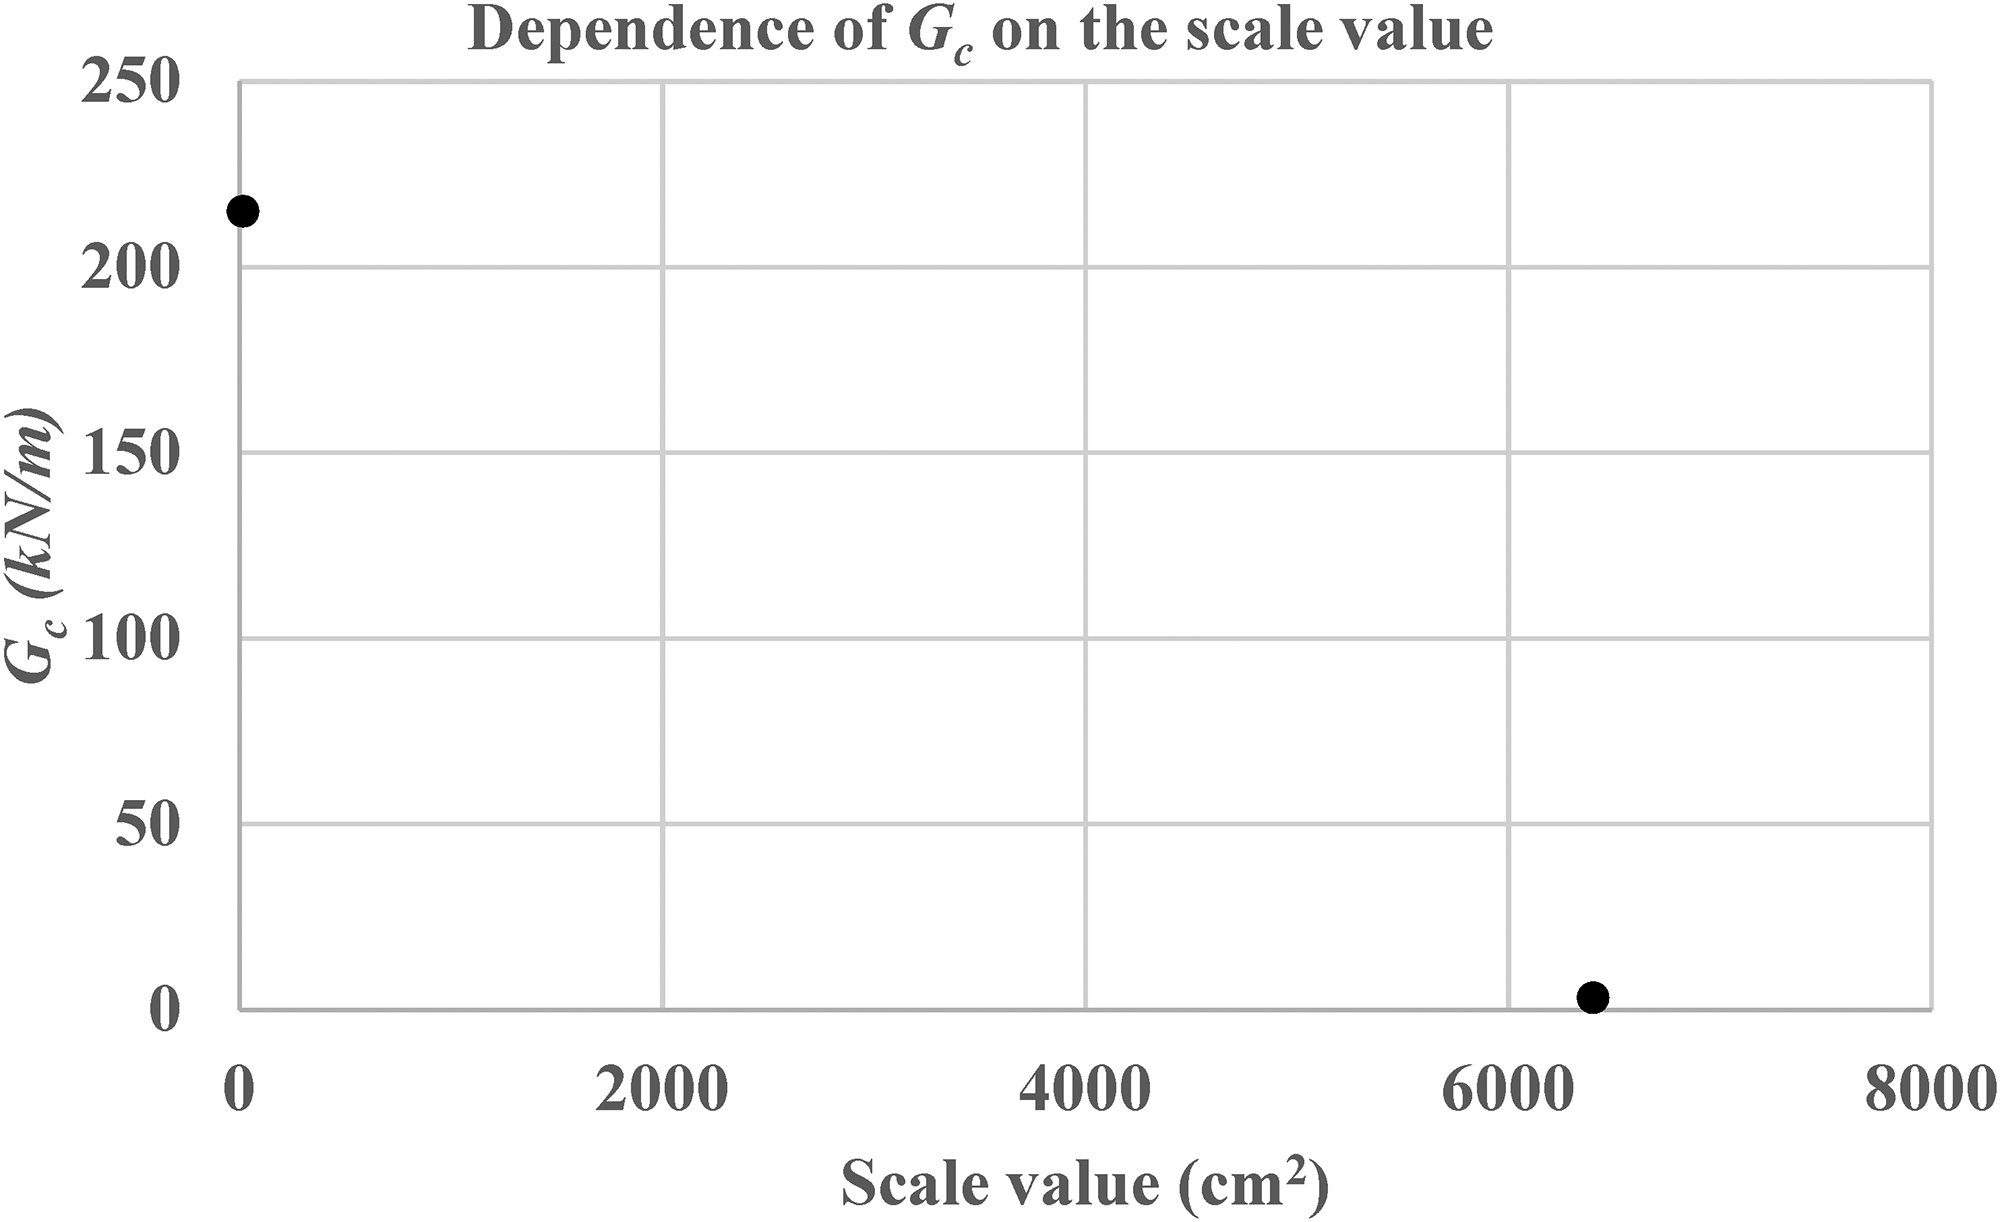
Figures 22 to 26 show the relationships between the values of the identified parameters obtained from the uniaxial cyclic compression test and the shear test, and the corresponding scale values. The characteristic scale for the laboratory test is 16.61 cm2, while for the shear test it is 6400 cm2.
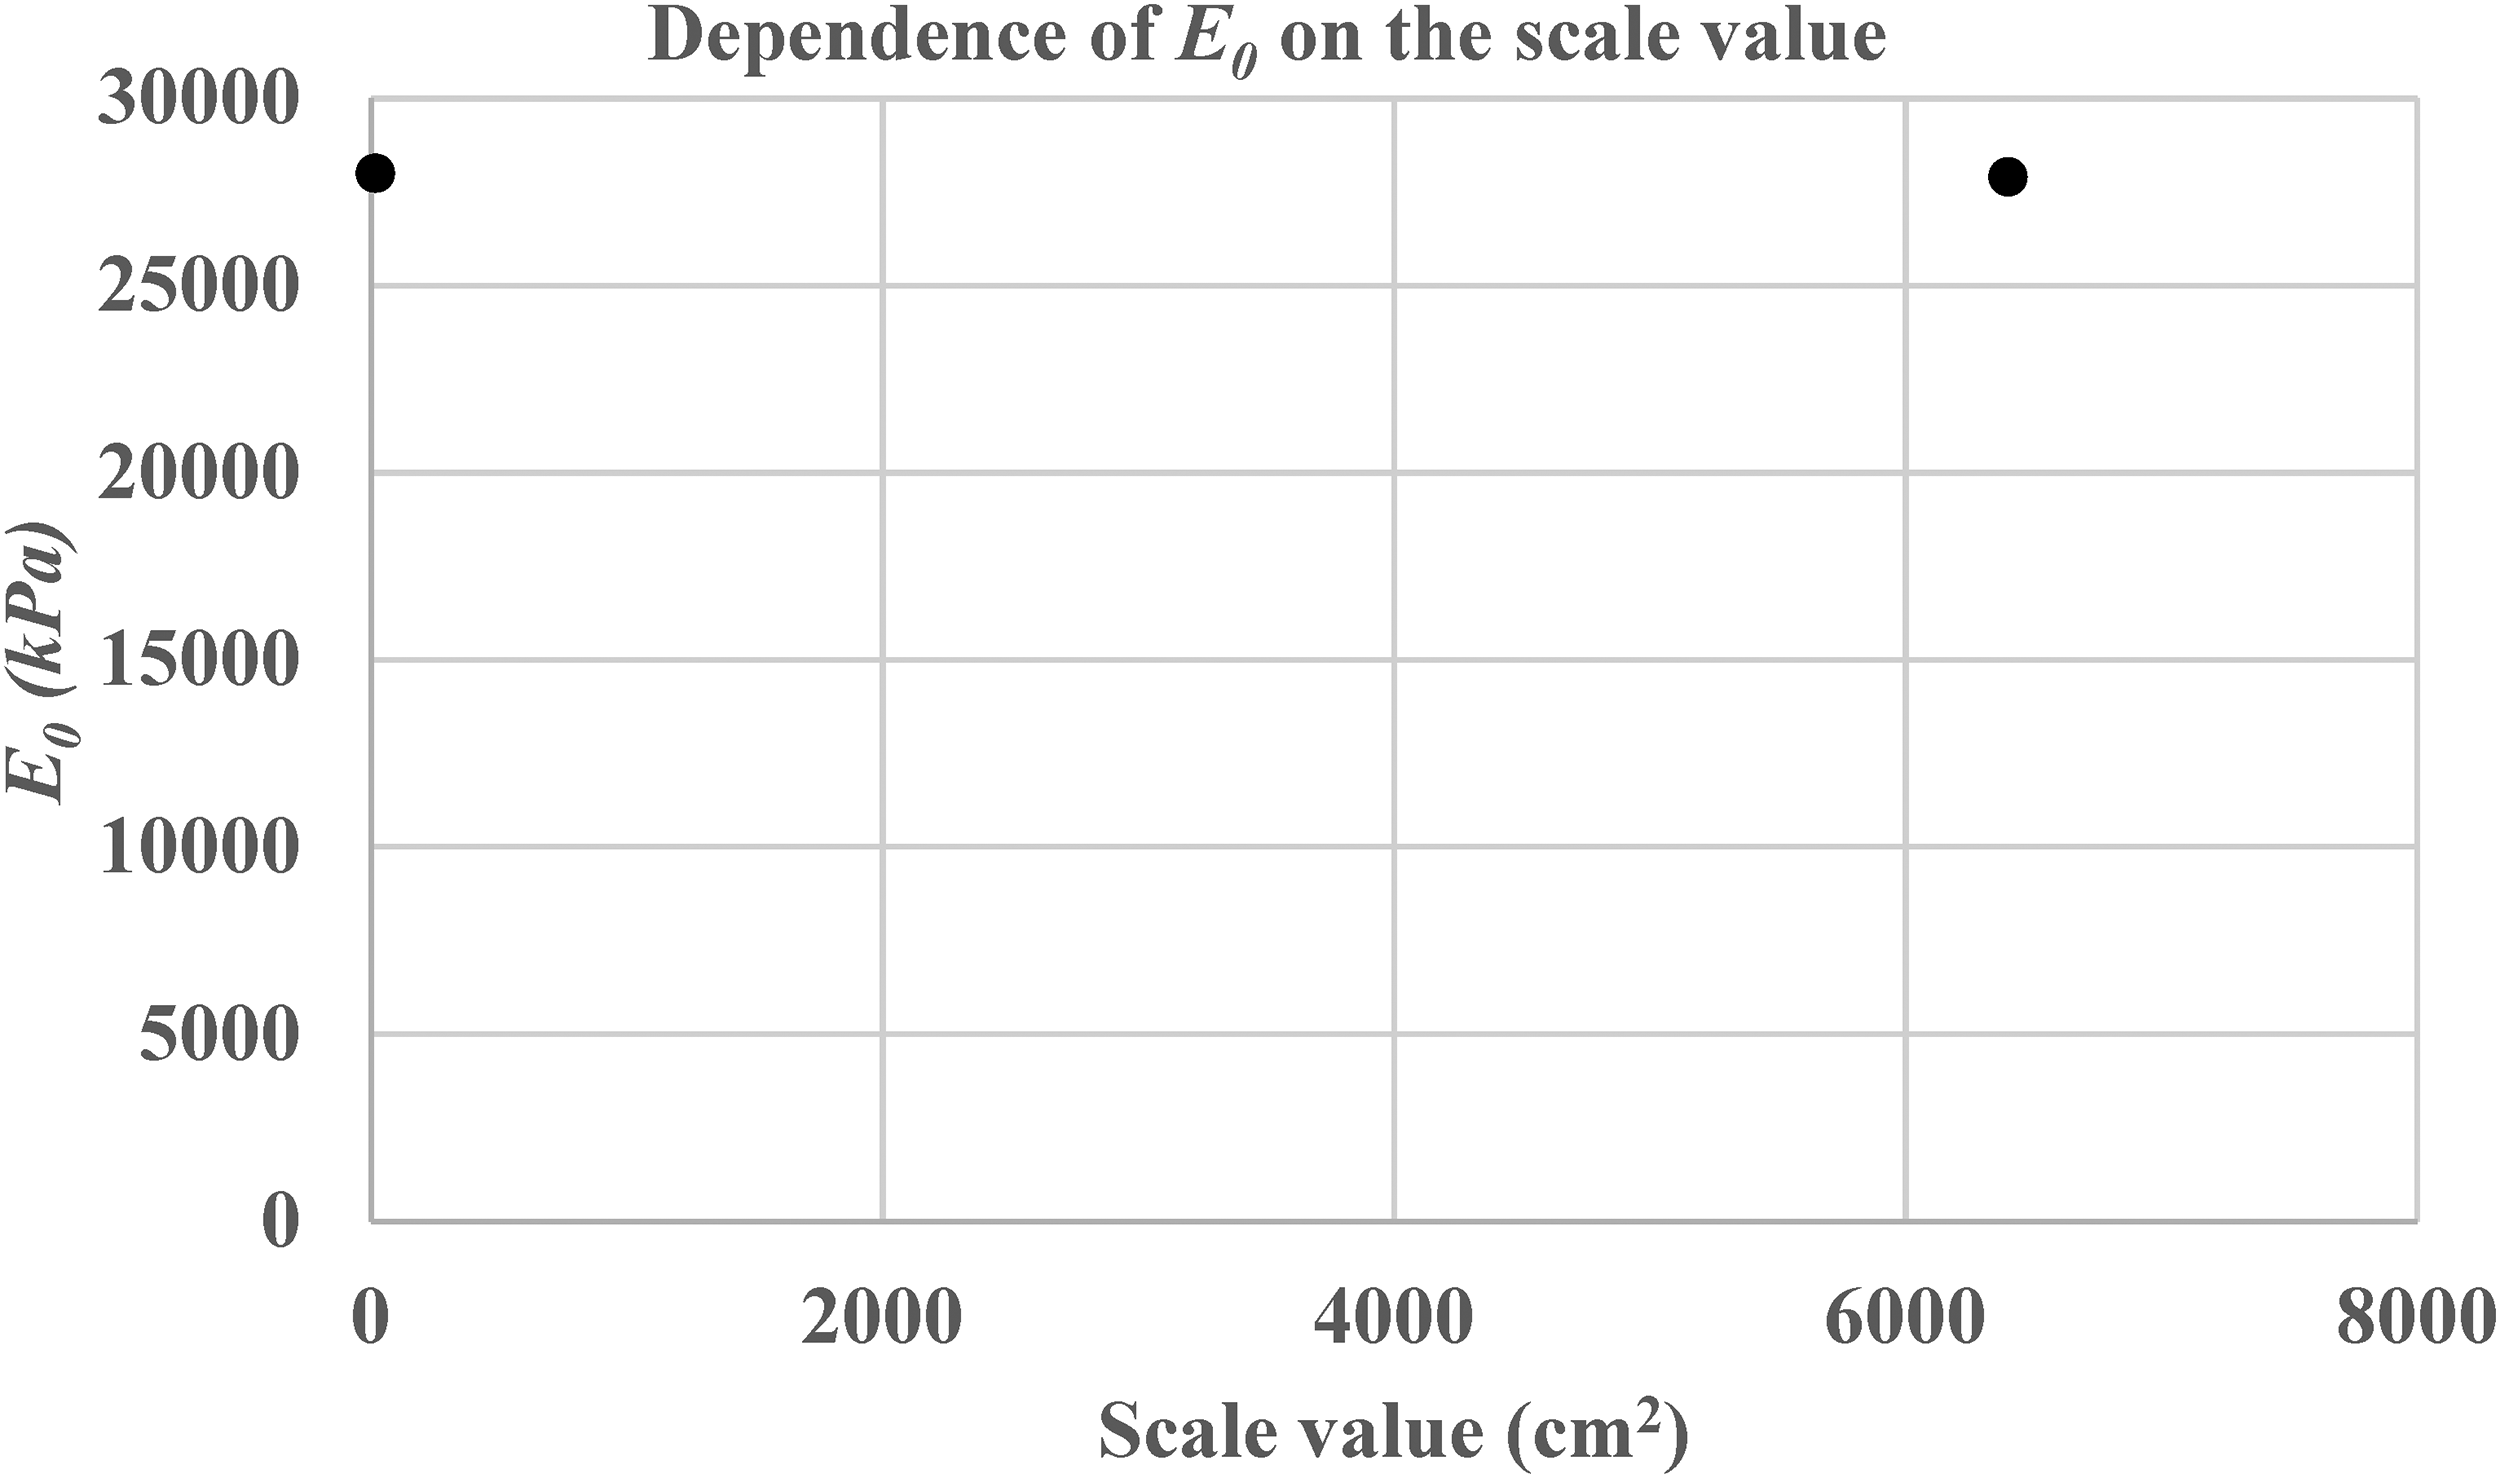
Dependence of value of the
Dependence of value of the
Dependence of value of the
Dependence of value of the
Dependence of value of the
As for the remaining parameters of the DP model that are not listed here, some of them were the subject of optimization analysis for the shear test. However, for the uniaxial cyclic compression test, they did not have a significant impact on the results and were not the subject of optimization. For this reason, it is not possible to compare and interpret those parameters for the considered scale sizes.
Analysis of the influence of the scale effect on the mentioned parameters could be carried out if there were laboratory test results for a complex stress state, for example, a triaxial test. In that case, the parameters
Conclusion
The applied DP model has numerically adequately described the mechanical behaviour of rock mass. The uniaxial unloading test and shear test were simulated using the DP model. The obtained results are consistent with the observed behaviour of the rock mass during the experiments. A methodology for identifying the parameters of the DP model, based on experimental results, numerical FEM models and optimization algorithms was proposed and successfully applied to experimental tests conducted in the research gallery at the “Pošćenje” dam, at different scales. The obtained parameters of the DP model show good agreement between the experimental results and the numerical models. By implementing an optimization algorithm for calibrating the DP material parameters within the FEM framework, a clear size-effect was obtained consistent with the results obtained of both laboratory and in situ experimental tests. Based on the results obtained for the two scales of the rock mass, a strong influence of the scale on the parameters
Footnotes
Author contributions
Slobodan Radovanović: Literature review of previous studies, methodology, analysis of experimental results, sensitivity analysis, analysis and discussion of results, manuscript writing.
Dejan Divac: Methodology concept, analysis and discussion, supervision.
Dragan Rakić: FEM analysis.
Dragoslav Šumarac: Supervision and review.
Funding
The authors received no financial support for the research, authorship, and/or publication of this article.
Declaration of conflicting interests
The authors declared no potential conflicts of interest with respect to the research, authorship, and/or publication of this article.
Data availability statement
The datasets generated during and/or analyzed during the current study are available from the corresponding author on reasonable request.