
Abstract
Seismic damage index for concrete bridges often quantifies only peak deformation and neglects residual response, which reflects cumulative damage and governs postearthquake recovery. Meanwhile, their use in risk-based fragility assessments renders the results highly sensitive to data scarcity, particularly for rare high-damage states under extreme earthquakes. This study develops an integrated probabilistic framework that couples damage quantification with data augmentation. A new damage index is proposed to combine maximum and residual displacements into a single interpretable measure. Optimized limit states are calibrated accordingly. To address data scarcity, a fragility-informed conditional generative adversarial network (cGAN) is introduced. The model incorporates adversarial, physics-based, and fragility-based losses to generate realistic combinations of intensity measures and engineering demand parameters for calibration and uncertainty quantification. By enriching the dataset with cGAN-generated samples, the method produces fragility curves with reduced dispersion and improved reliability in severe-damage regimes for the bridge demonstration. The integration of enhanced damage index and statistically consistent data augmentation offers a robust basis for seismic performance evaluation and supports informed decisions on inspection, repair, retrofit, and resilience planning.
Keywords
Introduction
Bridges are fundamental elements of transportation infrastructure, and maintaining their safety and postevent functionality is a central objective of seismic design and asset management (ASCE, 2022; Caltrans, 2025; Housner and Thiel Jr, 1995). In highway systems, reinforced-concrete (RC) columns are the principal load-bearing elements that concentrate inelastic demand during strong ground motions and thus largely determine both collapse risk and postearthquake usability (Caltrans, 2025; Kim et al., 2005; Todorov and Billah, 2021). Effective seismic assessment and decision-making therefore require damage metrics that meaningfully connect structural responses to practical outcomes such as inspection, repair and continued service. Performance-based seismic design (PBSD) provides the procedural foundation for linking seismic intensity measures (IMs) to engineering demand parameters (EDPs) and ultimately to performance decisions (Ghobarah, 2001; Zameeruddin and Sangle, 2016). Specifically, probabilistic seismic demand models (PSDMs) characterize the statistical relationship between IMs (e.g., peak ground acceleration) and EDPs (e.g., maximum displacement and residual offsets) and can be used to derive conditional exceedance probabilities. In many studies these probabilities are expressed as fragility curves to summarize the likelihood of exceeding predefined limit thresholds (Cornell et al., 2002; Du et al., 2019, 2023; Yazdani and Yazdannejad, 2019; Yin and Sun, 2005). Fragility curves serve as a fundamental component of risk-informed seismic assessment, yet their practical reliability depends on accurate and unbiased damage quantification, particularly the definition of the scalar damage index (DI) and limit states (LS) that link PSDM outputs to engineering decisions.
Most conventional bridge RC column assessments adopt a single metric, commonly used maximum displacement (MD) or a cumulative ductility metric such as residual displacement (RD) index, to define LS (Choi et al., 2004; Kim et al., 2005; Liu and Sun, 2005; Todorov and Billah, 2021; Yoon et al., 2019; Zhong et al., 2023). A MD-based DI was proposed to quantify column damage as an explicit function of peak displacement demand and the ultimate and yield displacements from the monotonic pushover backbone (Yoon et al., 2019, 2022). The DI is linked to six principal LS, each defined based on visually observable plastic-region damage from laboratory tests, which establishes a probabilistic connection between seismic peak demands and limit states of RC columns, serving as a fundamental component of PBSD for highway bridges. Peak metrics capture transient inelastic ductility demand and are straightforward to obtain from time-history analysis, but they do not directly quantify postearthquake functionality. Residual deformations govern postearthquake functionality and repairability, even when collapse does not occur (Gan et al., 2019; Mackie and Stojadinovic, 2004; Seyed Ardakani and Saiidi, 2018; Wei et al., 2023; Xiang et al., 2020). Accordingly, engineering practice and resilience assessment increasingly require damage assessment including both severity (peak response) and usability (residual response). Existing treatments for the damage index incorporating the joint behavior of MD and RD typically either define independent thresholds for each variable and combine them into discrete damage state matrix, or assume a bivariate lognormal model with a fixed correlation coefficient (Wei et al., 2023). Such approaches rely on strong parametric assumptions and coarse discretization, limiting their ability to capture conditional dependence, skewness, and tail dependence that are critical for representing severe and functional damage behaviors (Li and Sun, 2020; Saini and Saiidi, 2014; Wu et al., 2023).
Moreover, the scarcity of experimental and high-fidelity simulation data, particularly in the severe-damage regime, constrains reliable estimation of exceedance behavior and increases uncertainty in low-probability damage states. Recent studies have applied machine learning and surrogate modeling to improve the efficiency of seismic fragility assessment for bridge systems and reinforced concrete bridge columns, including neural-network-based fragility models (Nguyen et al., 2026), Gaussian-process surrogates with active learning (Ning et al., 2024), and machine-learning-aided frameworks for response estimation and fragility construction (Liu et al., 2026). These approaches have demonstrated clear advantages in reducing the computational burden associated with nonlinear analyses. However, these approaches are primarily oriented toward learning response or fragility mappings from available data, without explicitly constraining the resulting models to preserve consistency in joint probabilistic relationship between IMs and EDP or exceedance behavior across all the damage states and are often not validated against independent datasets. This limitation becomes particularly relevant when IM-EDP samples are unevenly distributed and damage assessment depends jointly on maximum and residual responses, for which variability is inherently higher and the severe-damage regime is often underrepresented.
To address data scarcity in characterizing the joint probabilistic relationship between IMs and EDP, a conditional generative adversarial network (cGAN) is employed within a probabilistically constrained framework (Kang et al., 2025; Marano et al., 2024; Wu et al., 2023). The model is trained using a loss formulation that integrates adversarial, physics-based, and fragility-consistency terms, enabling the generated samples to preserve conditional dependence and exceedance behavior across damage states. The discriminator module in the cGAN model is further guided by an independent set of IM-EDP results obtained from simulations under recorded ground motions, which serves as a probabilistic constraint for distributional consistency during training. Within those settings, the cGAN is used to reconstruct the joint IM-EDP distribution, particularly in underrepresented severe-damage regions.
The proposed method is demonstrated through a case study of an ordinary highway bridge, where the fragility-informed cGAN, trained from the OpenSees nonlinear time-history results, generates synthetic IM-EDP datasets to calibrate and validate the proposed DI and LS framework. Combined with the statistically optimized θJ, the proposed DJ establishes a balanced, probabilistically consistent tool for evaluating both peak and residual demands. The cGAN-augmented data enhances fragility reliability, particularly for high-damage states, and enables robust characterization of joint response statistics under data-scarce conditions. Consequently, the proposed DI and LS framework provides a parsimonious, physically interpretable link between PSDM-derived responses and decision-making for inspection, repair prioritization, retrofit planning, and resilience assessment.
Methodology
The proposed method integrates two complementary threads required for seismic damage fragility assessment: (i) a univariate fragility-equivalent damage index that summarizes both peak inelastic deformation and permanent deformation in a single, interpretable scalar metric, and (ii) a conditional generative model that augments scarce IM-EDP (intensity-response) data to stabilize estimation and calibration of exceedance of probability functions. The following subsections describe the damage-index formulation and derivation (see “Damage index and optimal limit states”) and the components of the cGAN model and the training procedures (see “cGAN augmentation”). The practical engineering implementation and tuning used in the case study are reported in “Case study of ordinary concrete highway bridge”.
Damage index and optimal limit states
MD-based and RD-based metrics are adopted as the primary DI in this study. The MD-based index can be calculated by
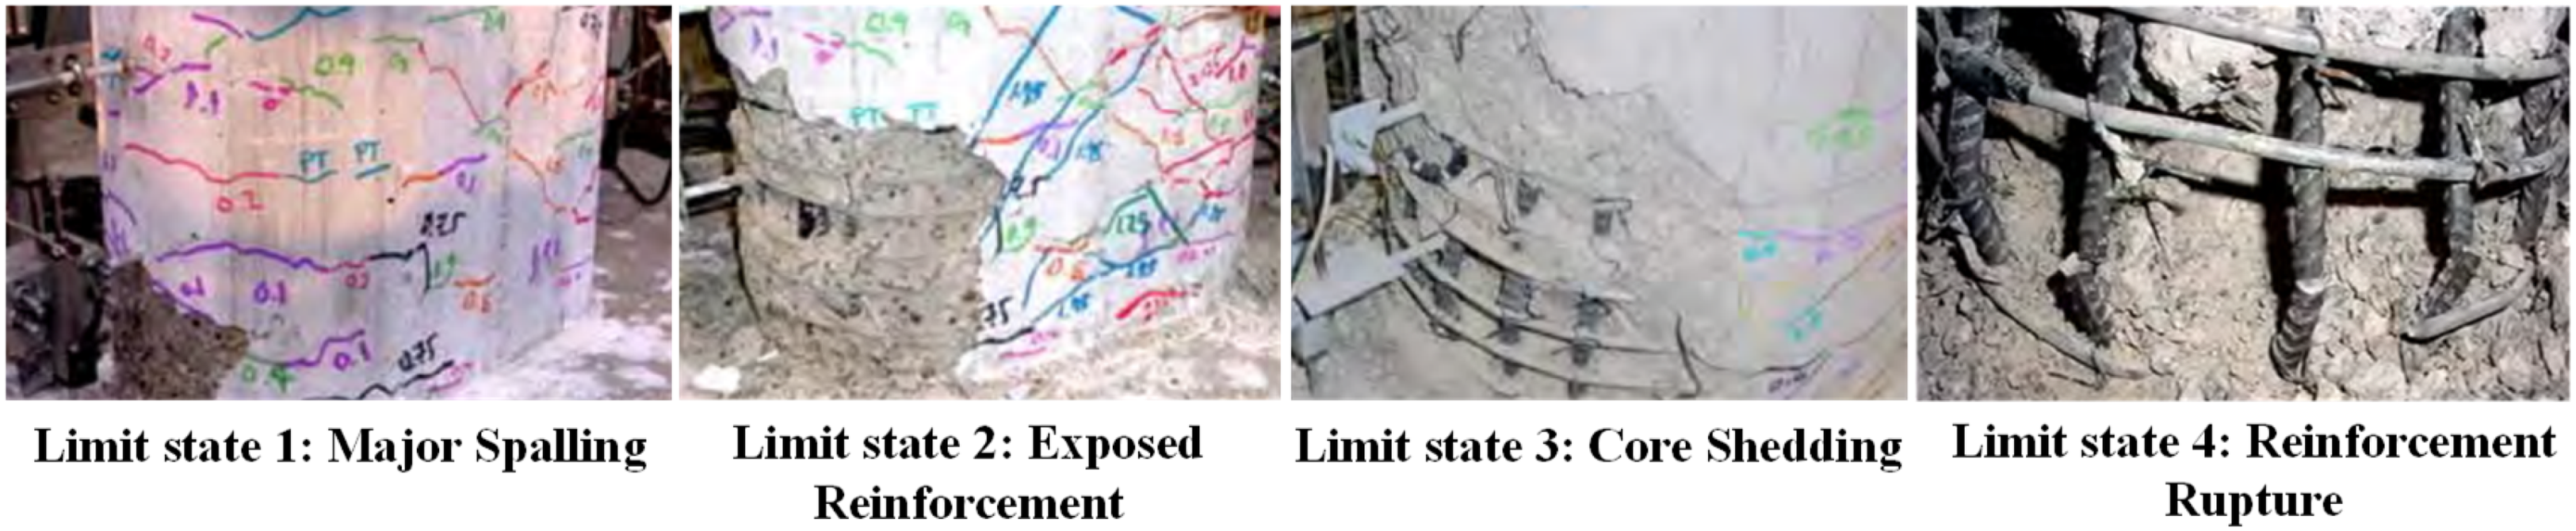
Damage limit states (from Saini and Saiidi, 2014).
Damage limit states via performance for MD-base and RD-based DI.
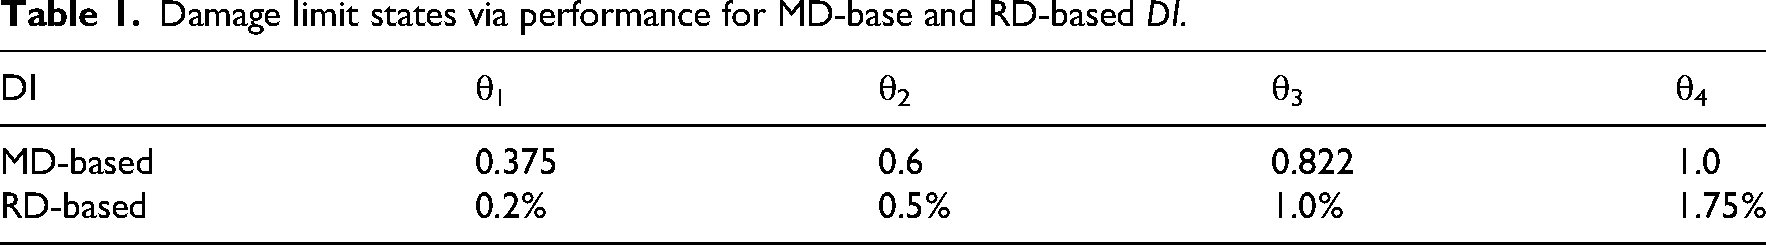
The residual drift metric, expressed as a percentage (%) of drift and adopted based on Wei et al. (2023) as summarized in Table 1, measures the permanent lateral offset remaining after ground shaking and governs postevent functionality and repairability. Four discrete RD-based limit states are defined, including Quick Repair (Limit State 1), Repairable (Limit State 2), Difficult to Repair (Limit State 3), and Reconstruction (Limit State 4), corresponding to increasing levels of residual damage.
All the LS with the DI are specified by set of thresholds θ1,k for RD-based metric (D1) and θ2,k for MD-based metric (D2) (index k enumerates damage levels). Because either peak demand or permanent deformation can independently trigger practical consequences, the joint exceedance rule used to define the target fragility surface must reflect a balanced engineering judgement between safety and economic considerations. A composite joint criterion is therefore adopted. For a chosen IM level, the joint exceedance event for limit state k is defined by the weighted normalized sum:


As illustrated in Figure 2, the parameters 
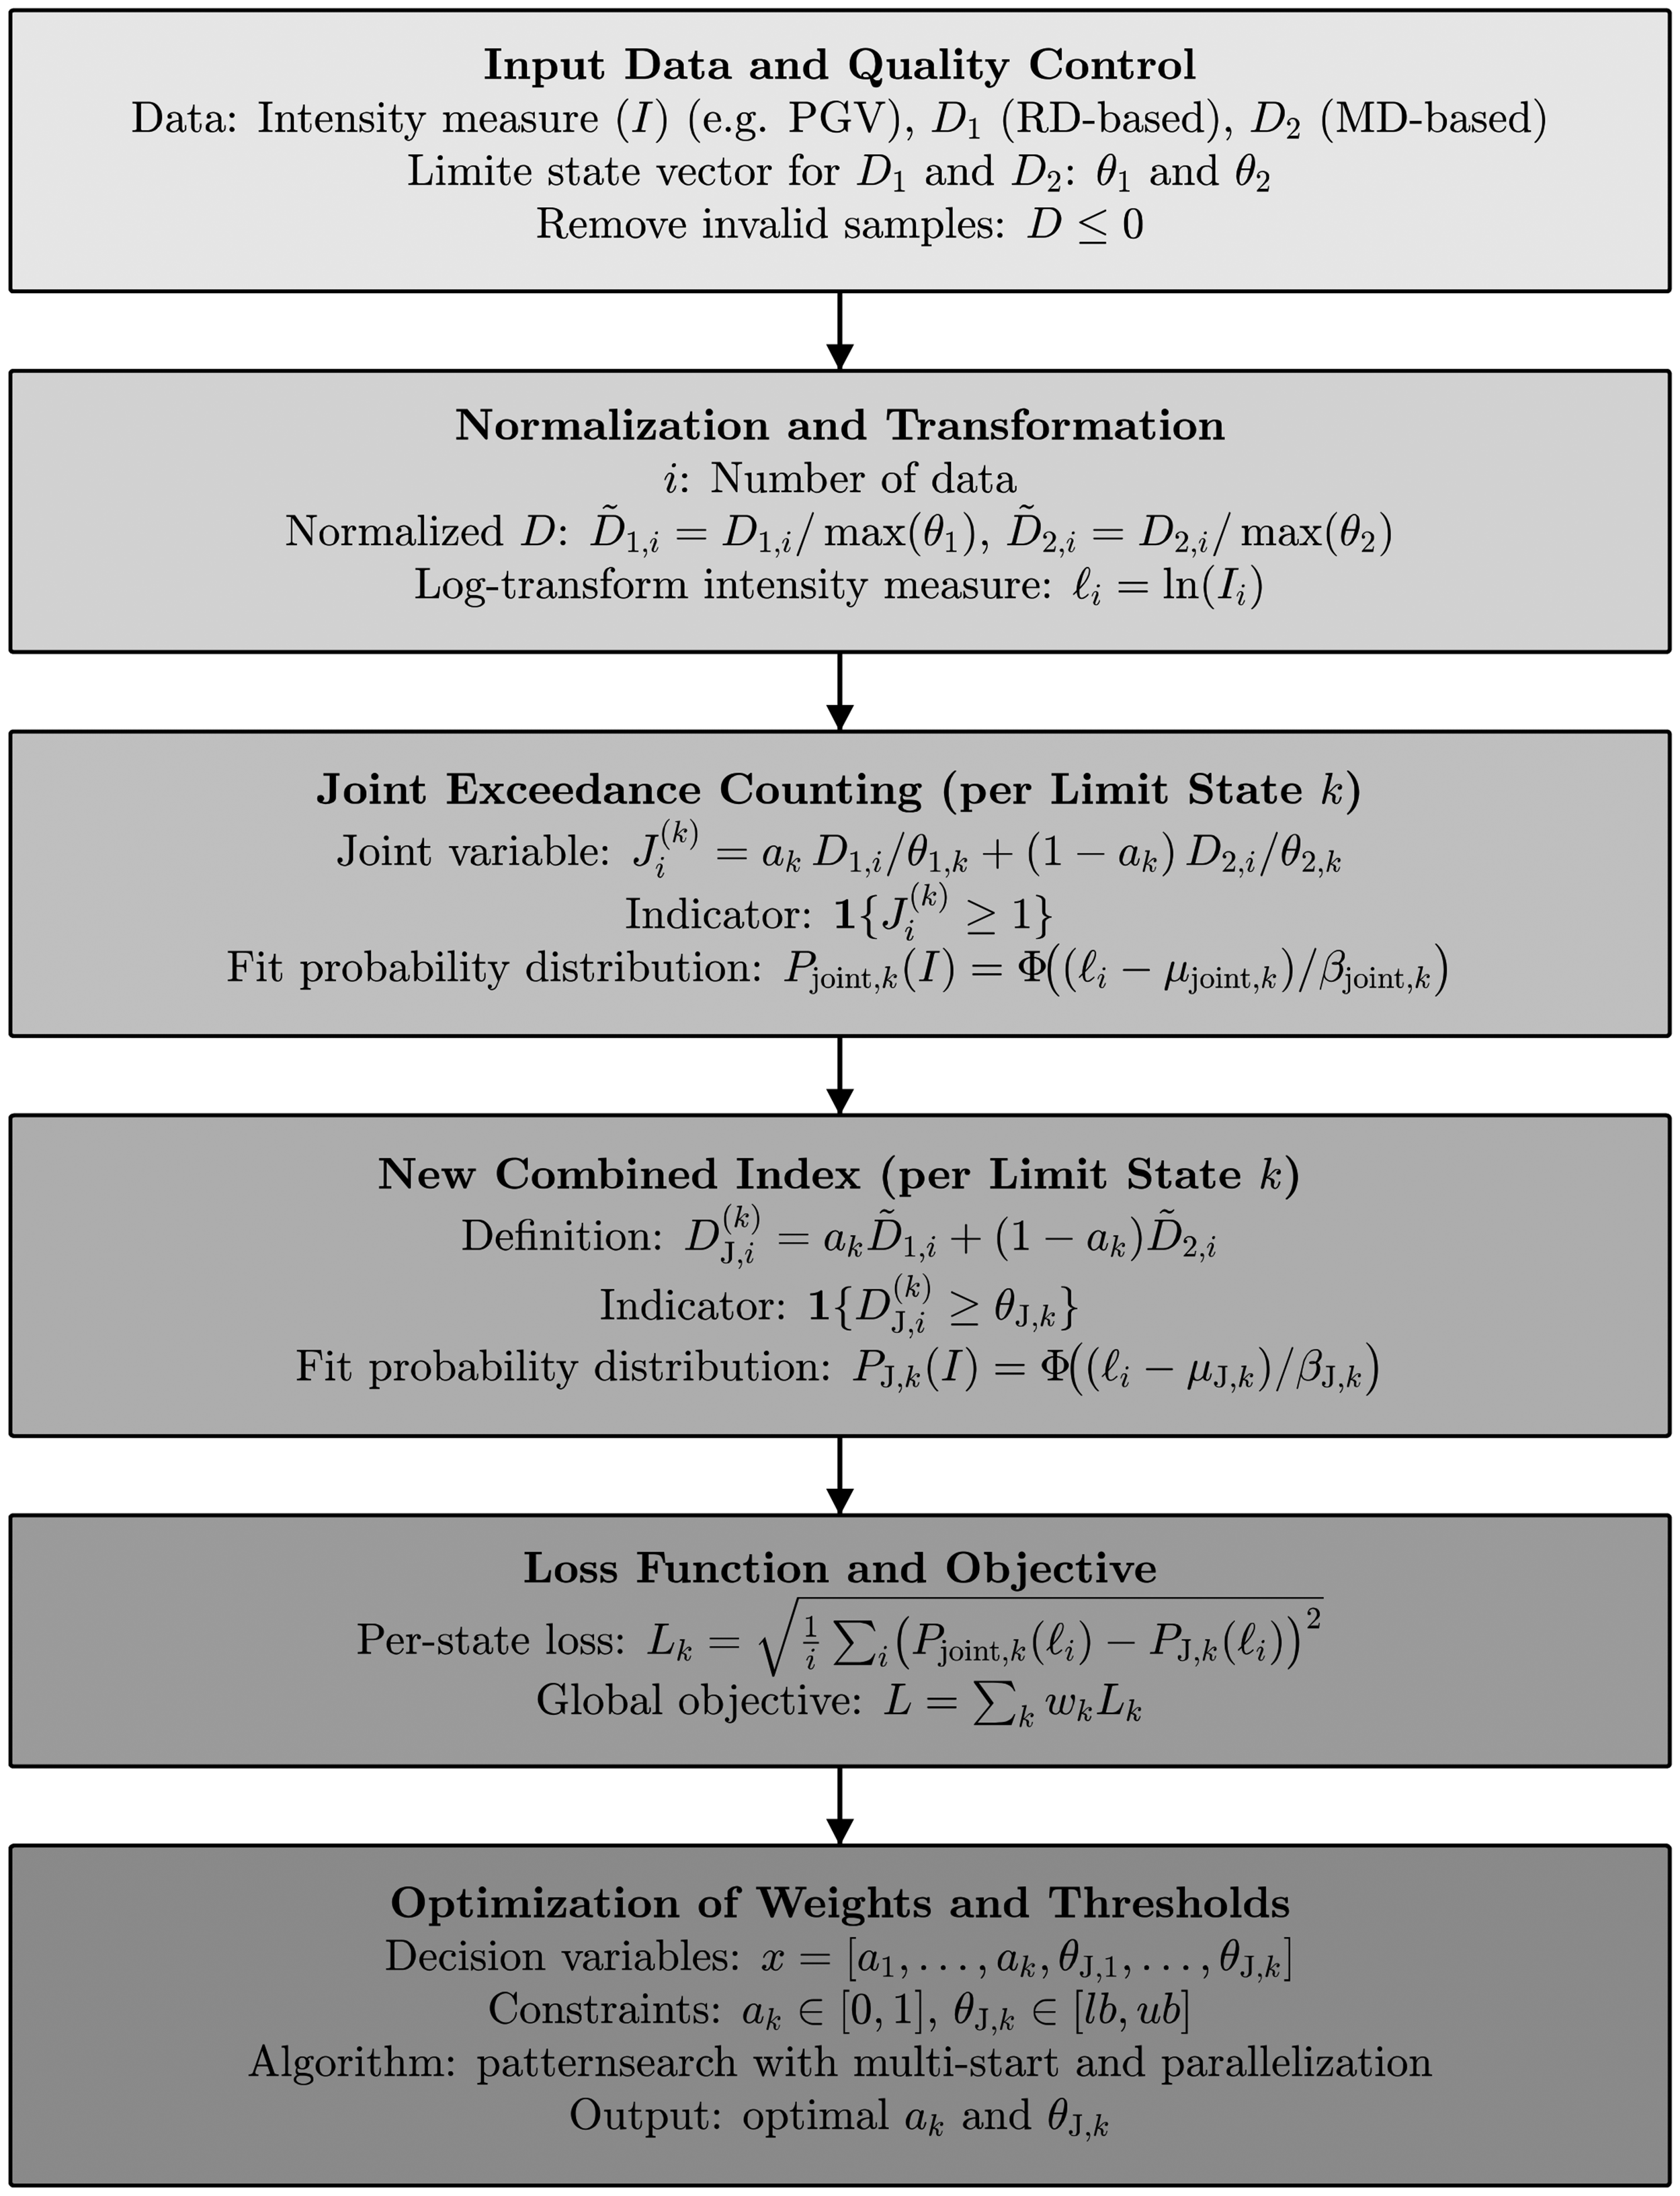
Development of a new damage index DJ that integrates both MD-based and RD-based damage index with principle of exceedance probability equivalence for each limit state.
In this manner, the resulting damage index DJ provides a compact surrogate that preserves the probabilistic characteristics of the original joint formulation while enabling a univariate fragility representation.
cGAN augmentation
Robust calibration of
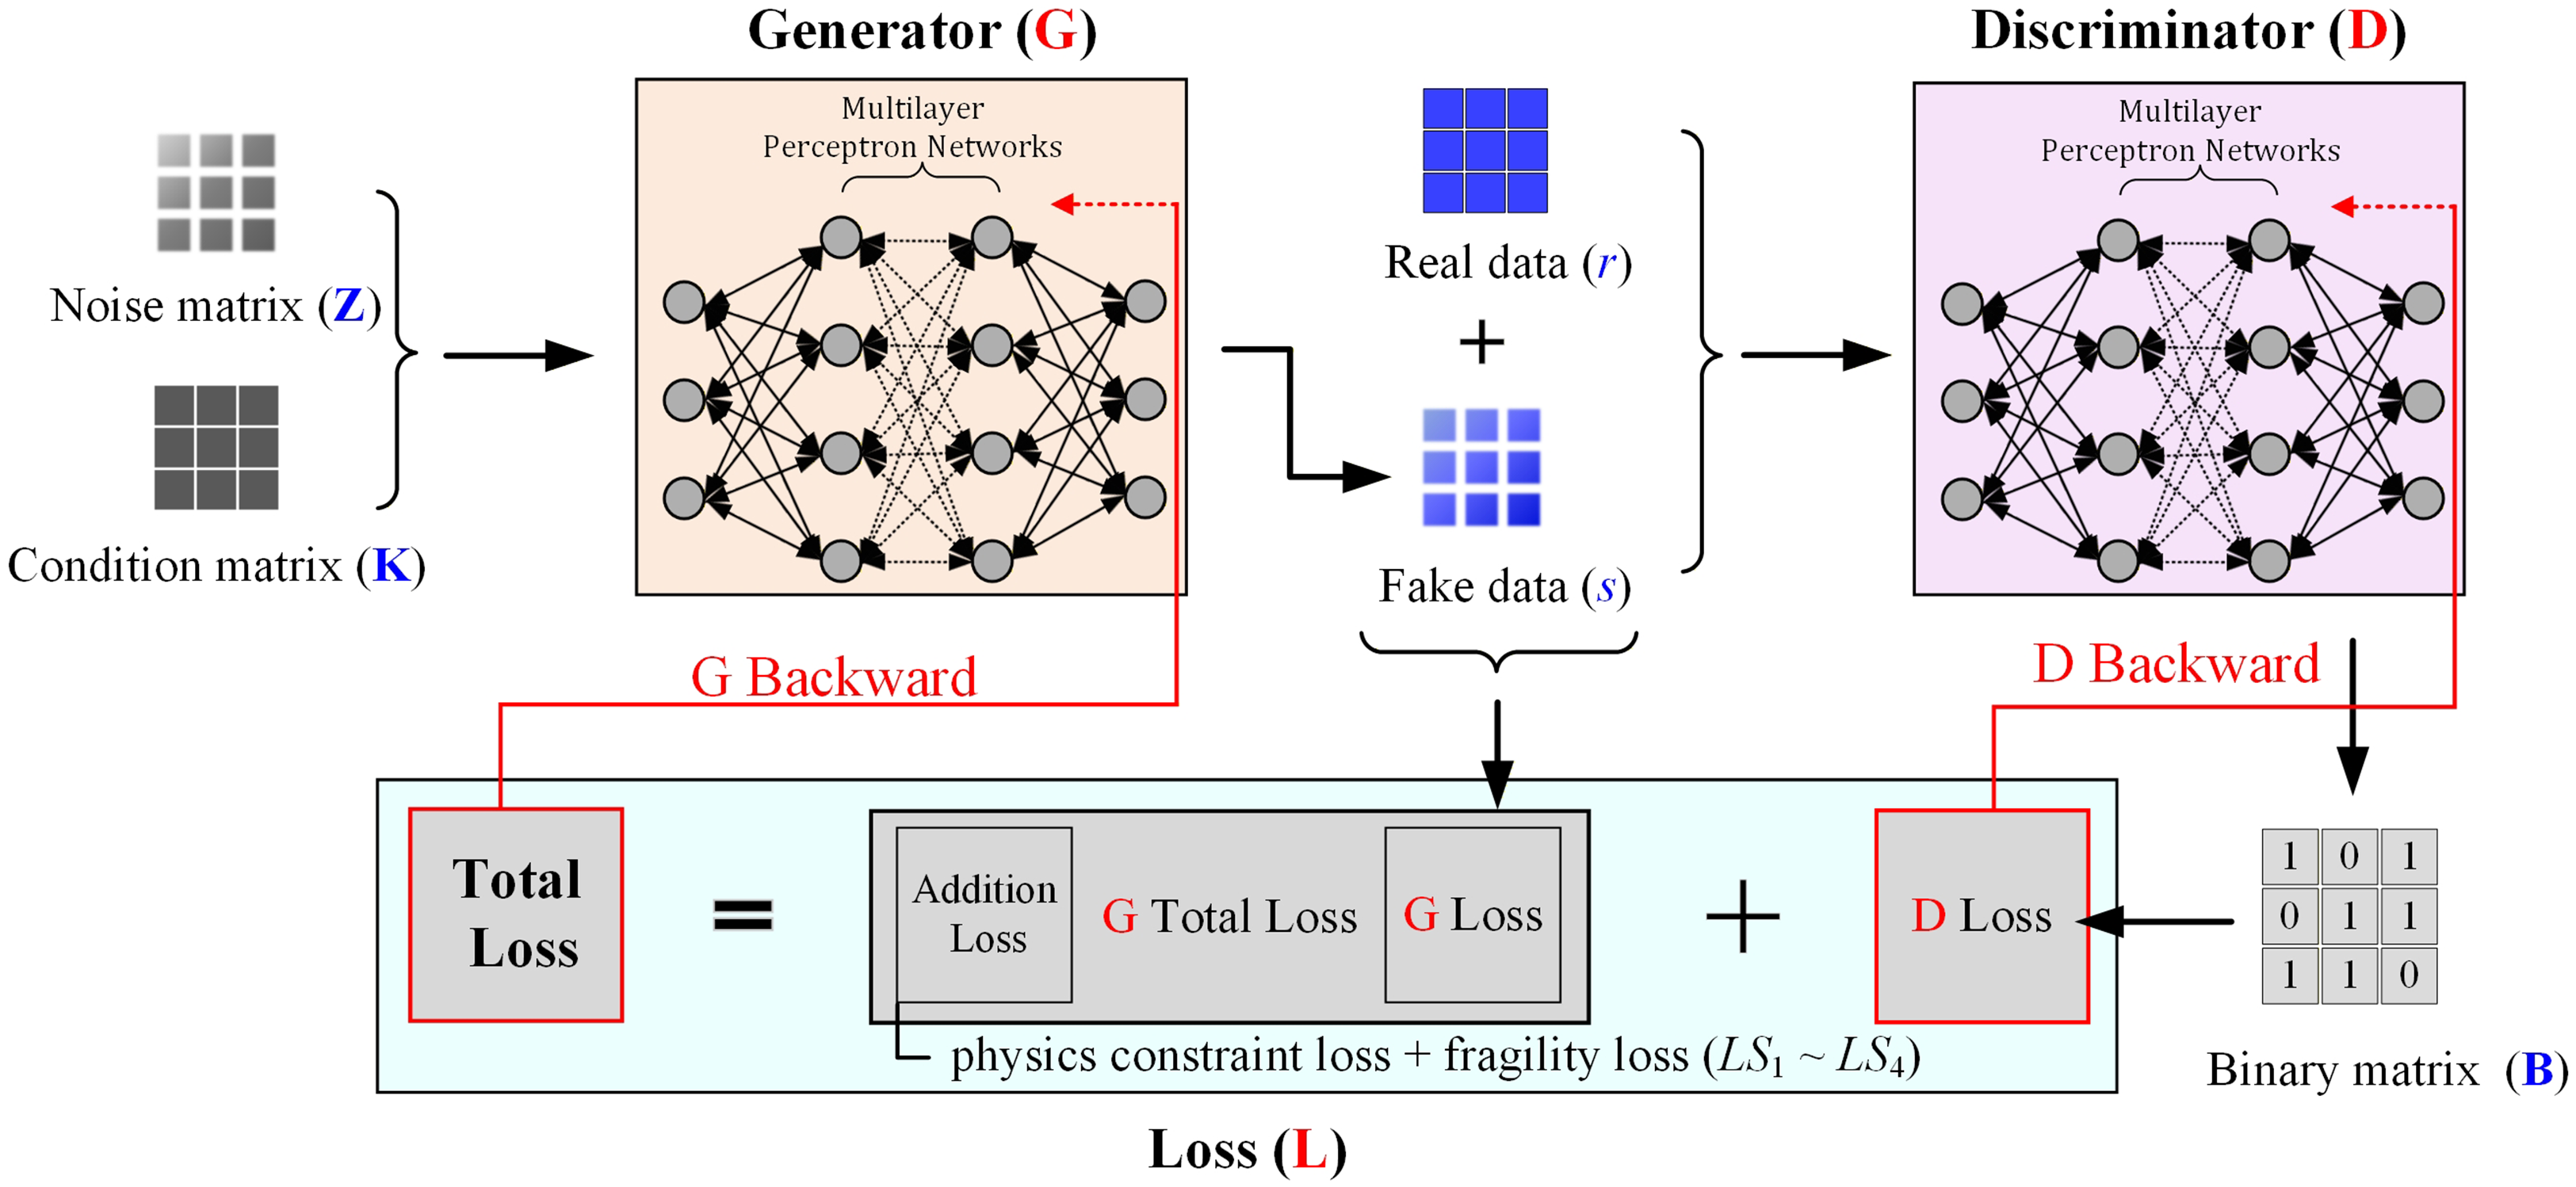
Schematic of cGAN model.
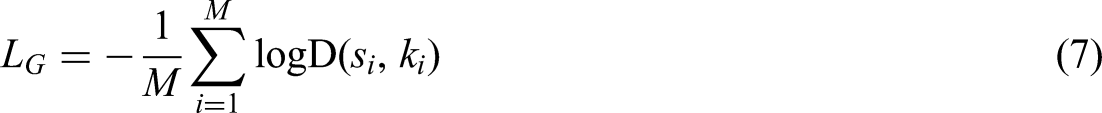
The discriminator is trained by minimizing the minibatch loss:
Adversarial training is driven by the minimax objective function:
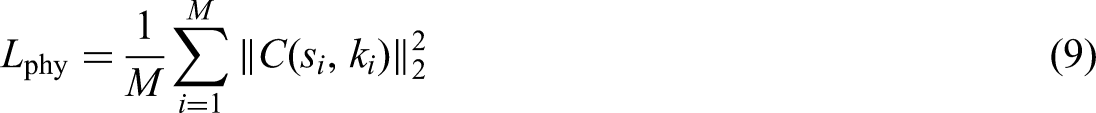
A fragility-consistency penalty is introduced to align the exceedance frequencies computed from generated samples with the empirical joint exceedance probability 

The total generator objective loss minimized in practice is
To ensure robust and stable model training, four major hyperparameters are needed to be systematically tuned (Gao et al., 2024; Wu et al., 2023): (1) Learning rate of the discriminator (lrD), which controls how aggressively the discriminator updates its parameters in response to classification errors. An excessively high lrD leads to discriminator dominance and generator collapse. (2) Learning rate of the generator (lrG), which determines the generator ability to adapt to the discriminator and loss feedback. (3) Noise dimension (noise dim), representing the length of the random latent vector z input to the generator, which governs the diversity of generated samples. (4) Batch size, defining the number of samples per training iteration. Smaller batches introduce high gradient variance. During training, the cGAN was optimized via alternating gradient updates using the Adam optimizer (Goodfellow et al., 2014; Marano et al., 2024). Spectral normalization and gradient penalties were imposed on D to prevent exploding gradients and to ensure Lipschitz continuity (Goodfellow et al., 2014; Marano et al., 2024). This training configuration ensured the convergence of both networks toward a Nash equilibrium (Marano et al., 2024; Ratliff et al., 2013), yielding physically consistent and statistically robust synthetic datasets that preserved the conditional dependence between IM and damage response.
Figure 4 depicts the iterative procedure used to train the cGAN model of Figure 3 and to convert the learned generator into a validated sampler for fragility calibration. Observational IM-EDP pairs are encoded in the condition matrix k and empirical joint exceedance frequencies
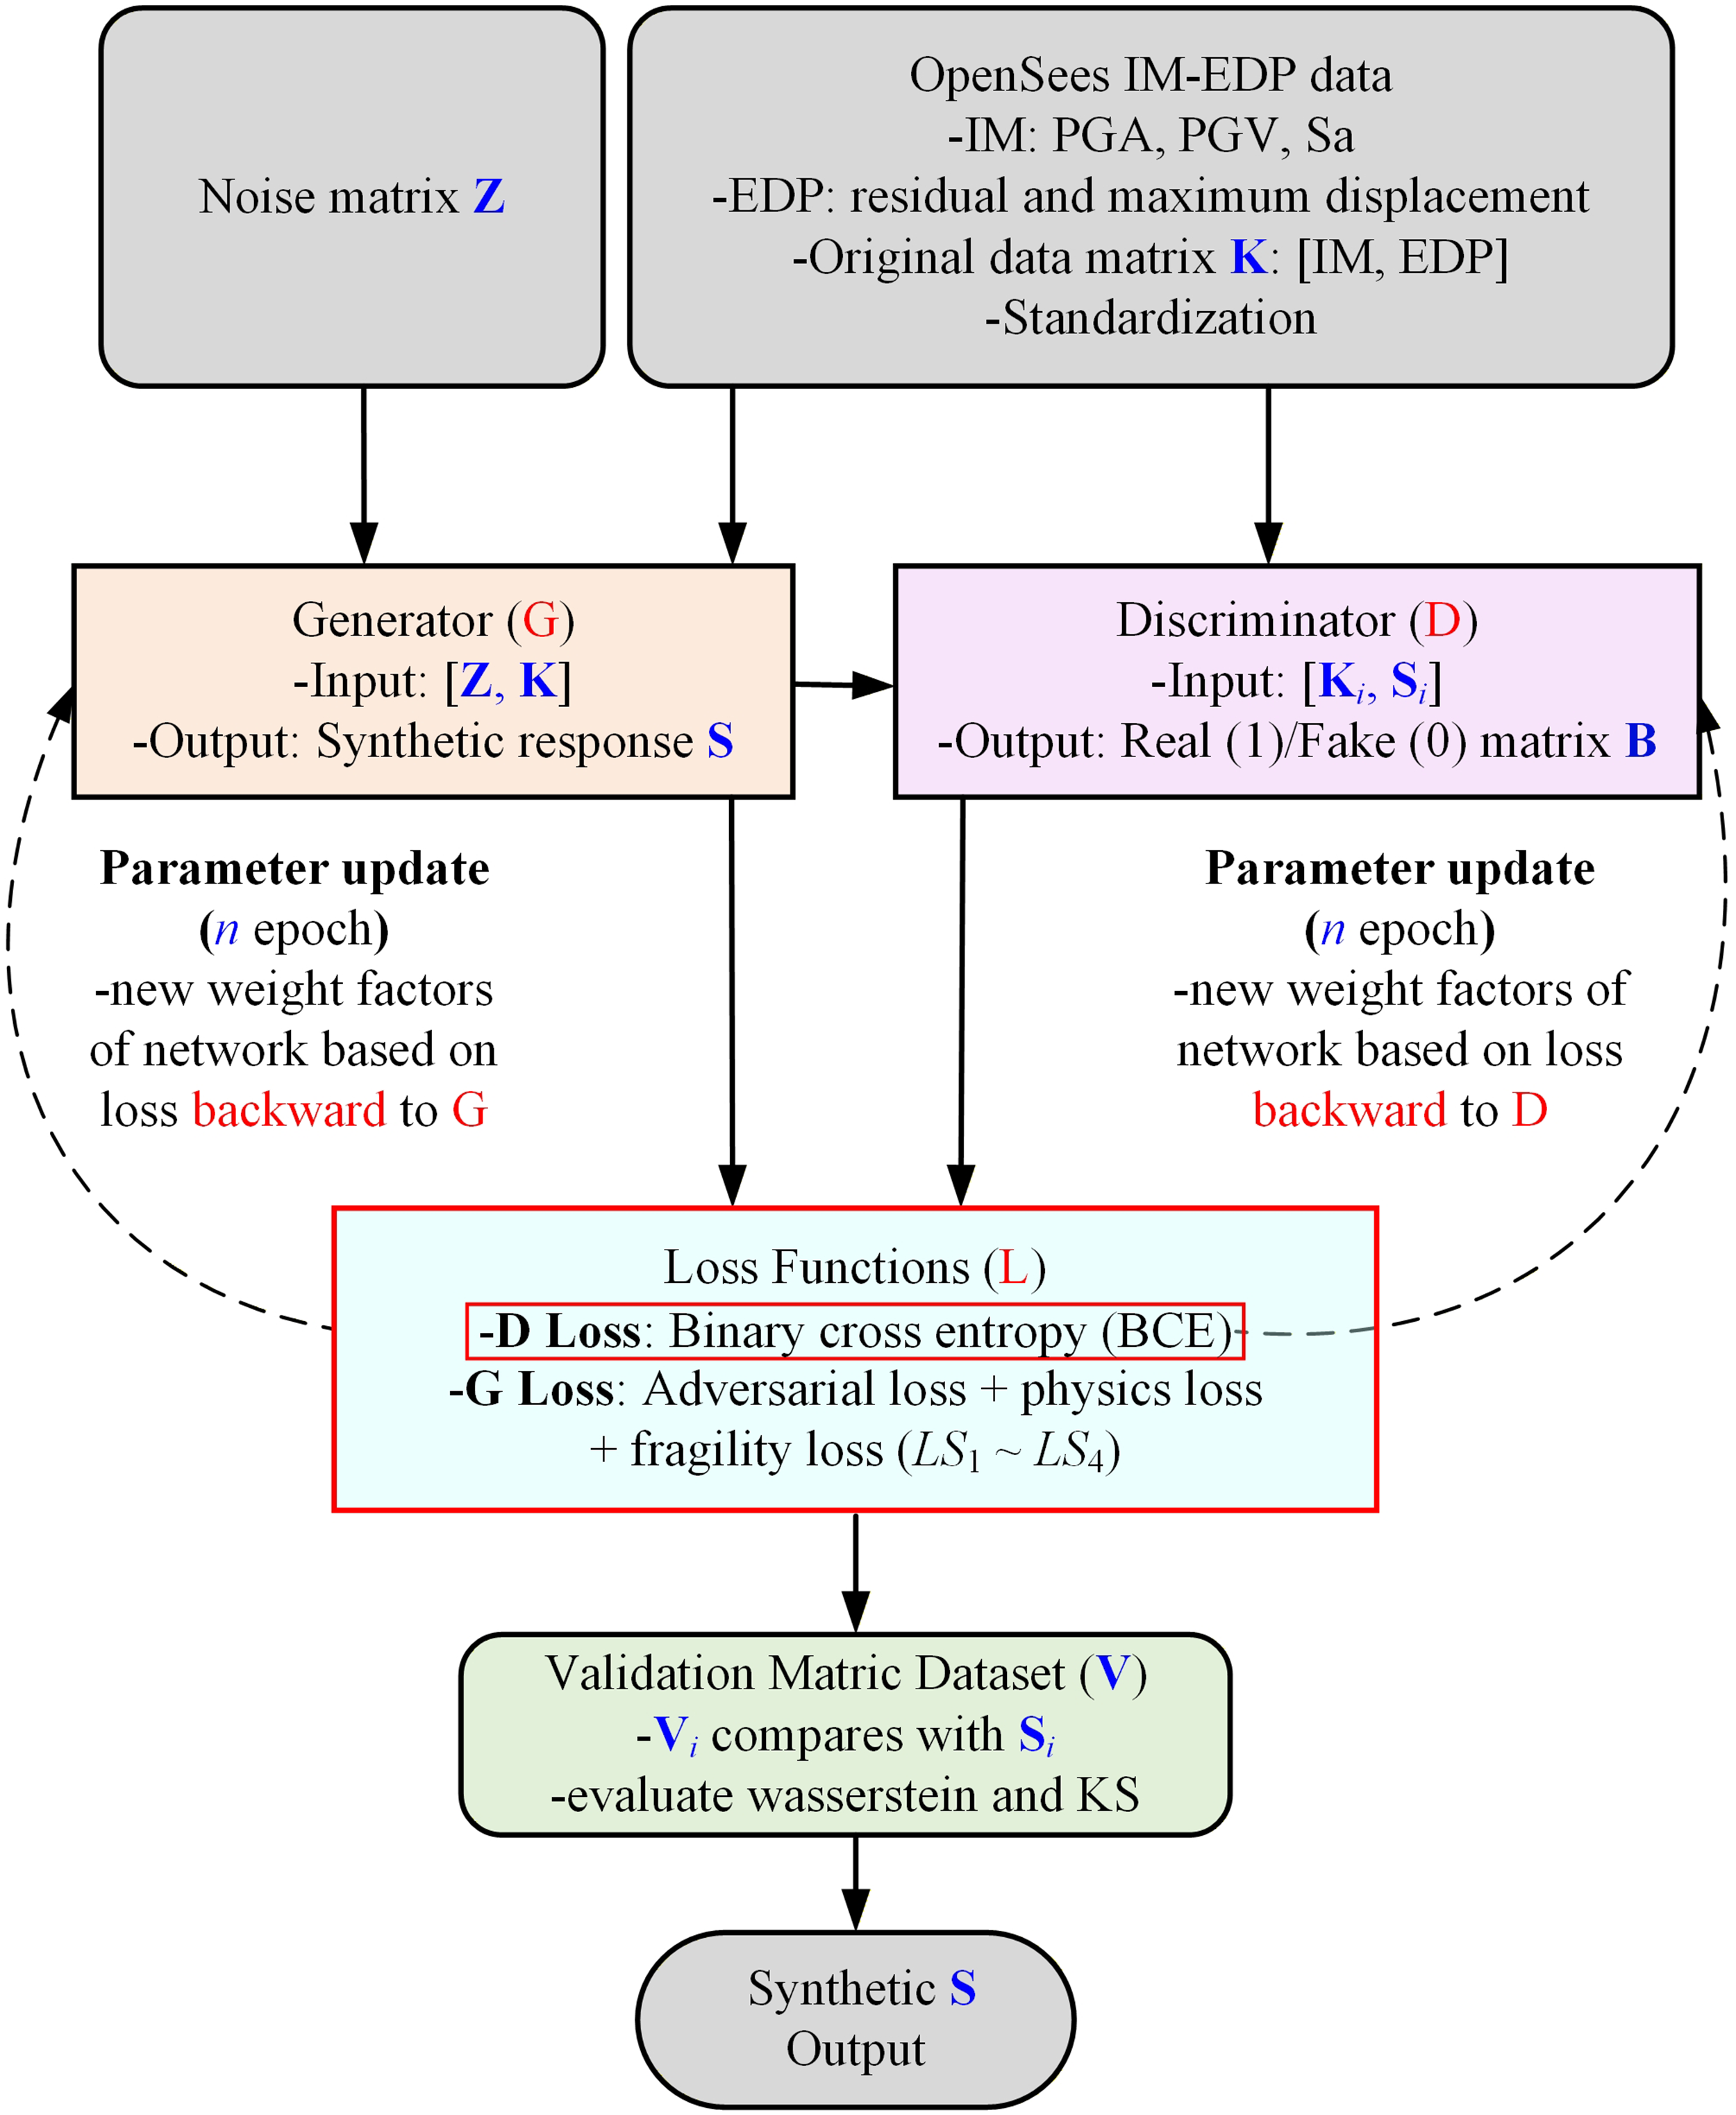
The flowchart of training with cGAN model.
Because minibatch estimates can be noisy for sparsely populated IM bins, stabilization is applied by maintaining a running-average estimator

The combined adversarial loss plus physics/fragility loss supervision therefore produces variance-reducing, engineering-consistent synthetic data suitable for robust calibration and validation. Note that the Wasserstein distance and KS statistics are used only for evaluation of marginal distributions and checkpoint selection. The cGAN is trained with the standard Binary Cross-Entropy (BCE)-based adversarial loss, rather than a Wasserstein GAN (WGAN) objective.
The above framework is then applied to a representative ordinary standard highway bridge to demonstrate practical implementation and to achieve the cGAN augmentation on calibration stability, fragility curves. Modeling details and numerical results are reported in the case study in “Case study of ordinary concrete highway bridge”. It should be noted that the proposed damage-index formulation, based on probabilistic equivalence to joint exceedance behavior, is general and can be applied to different structural systems and response measures. The calibrated quantities, including weighting coefficients and limit-state thresholds, are obtained from the underlying modeling dataset and therefore depend on the structural model, selected response measures, ground-motion ensemble, and site conditions considered in the analysis. Accordingly, the parameter values reported in the case study should be interpreted as representative of the specific configuration analyzed. For other bridge-column typologies or modeling assumptions, the same framework can be applied to obtain a corresponding parameter set for fragility analysis in risk assessment.
Case study of ordinary concrete highway bridge
Prototype bridge model
The prototype of a conventional two-span cast-in-place/post-tensioned (CIP/PT) box-girder highway bridge is presented in Figure 5, which is sited in downtown Los Angeles. Each span measures 45.7 m and the superstructure is supported at midspan by a single column bent. The bent column is circular (1.2 m diameter), contains 18 No.29 (US #9) longitudinal bars and No.25 (US #8) transverse hoops at 0.165 m spacing, and extends 9.1 m from the bent-cap centroid to the column base. Accounting for the tributary superstructure mass, the first natural period of the system is approximately 2.0 s. Foundation soils are characterized by a site average shear-wave velocity over the upper 30 m Vs30 of 270 m/s.
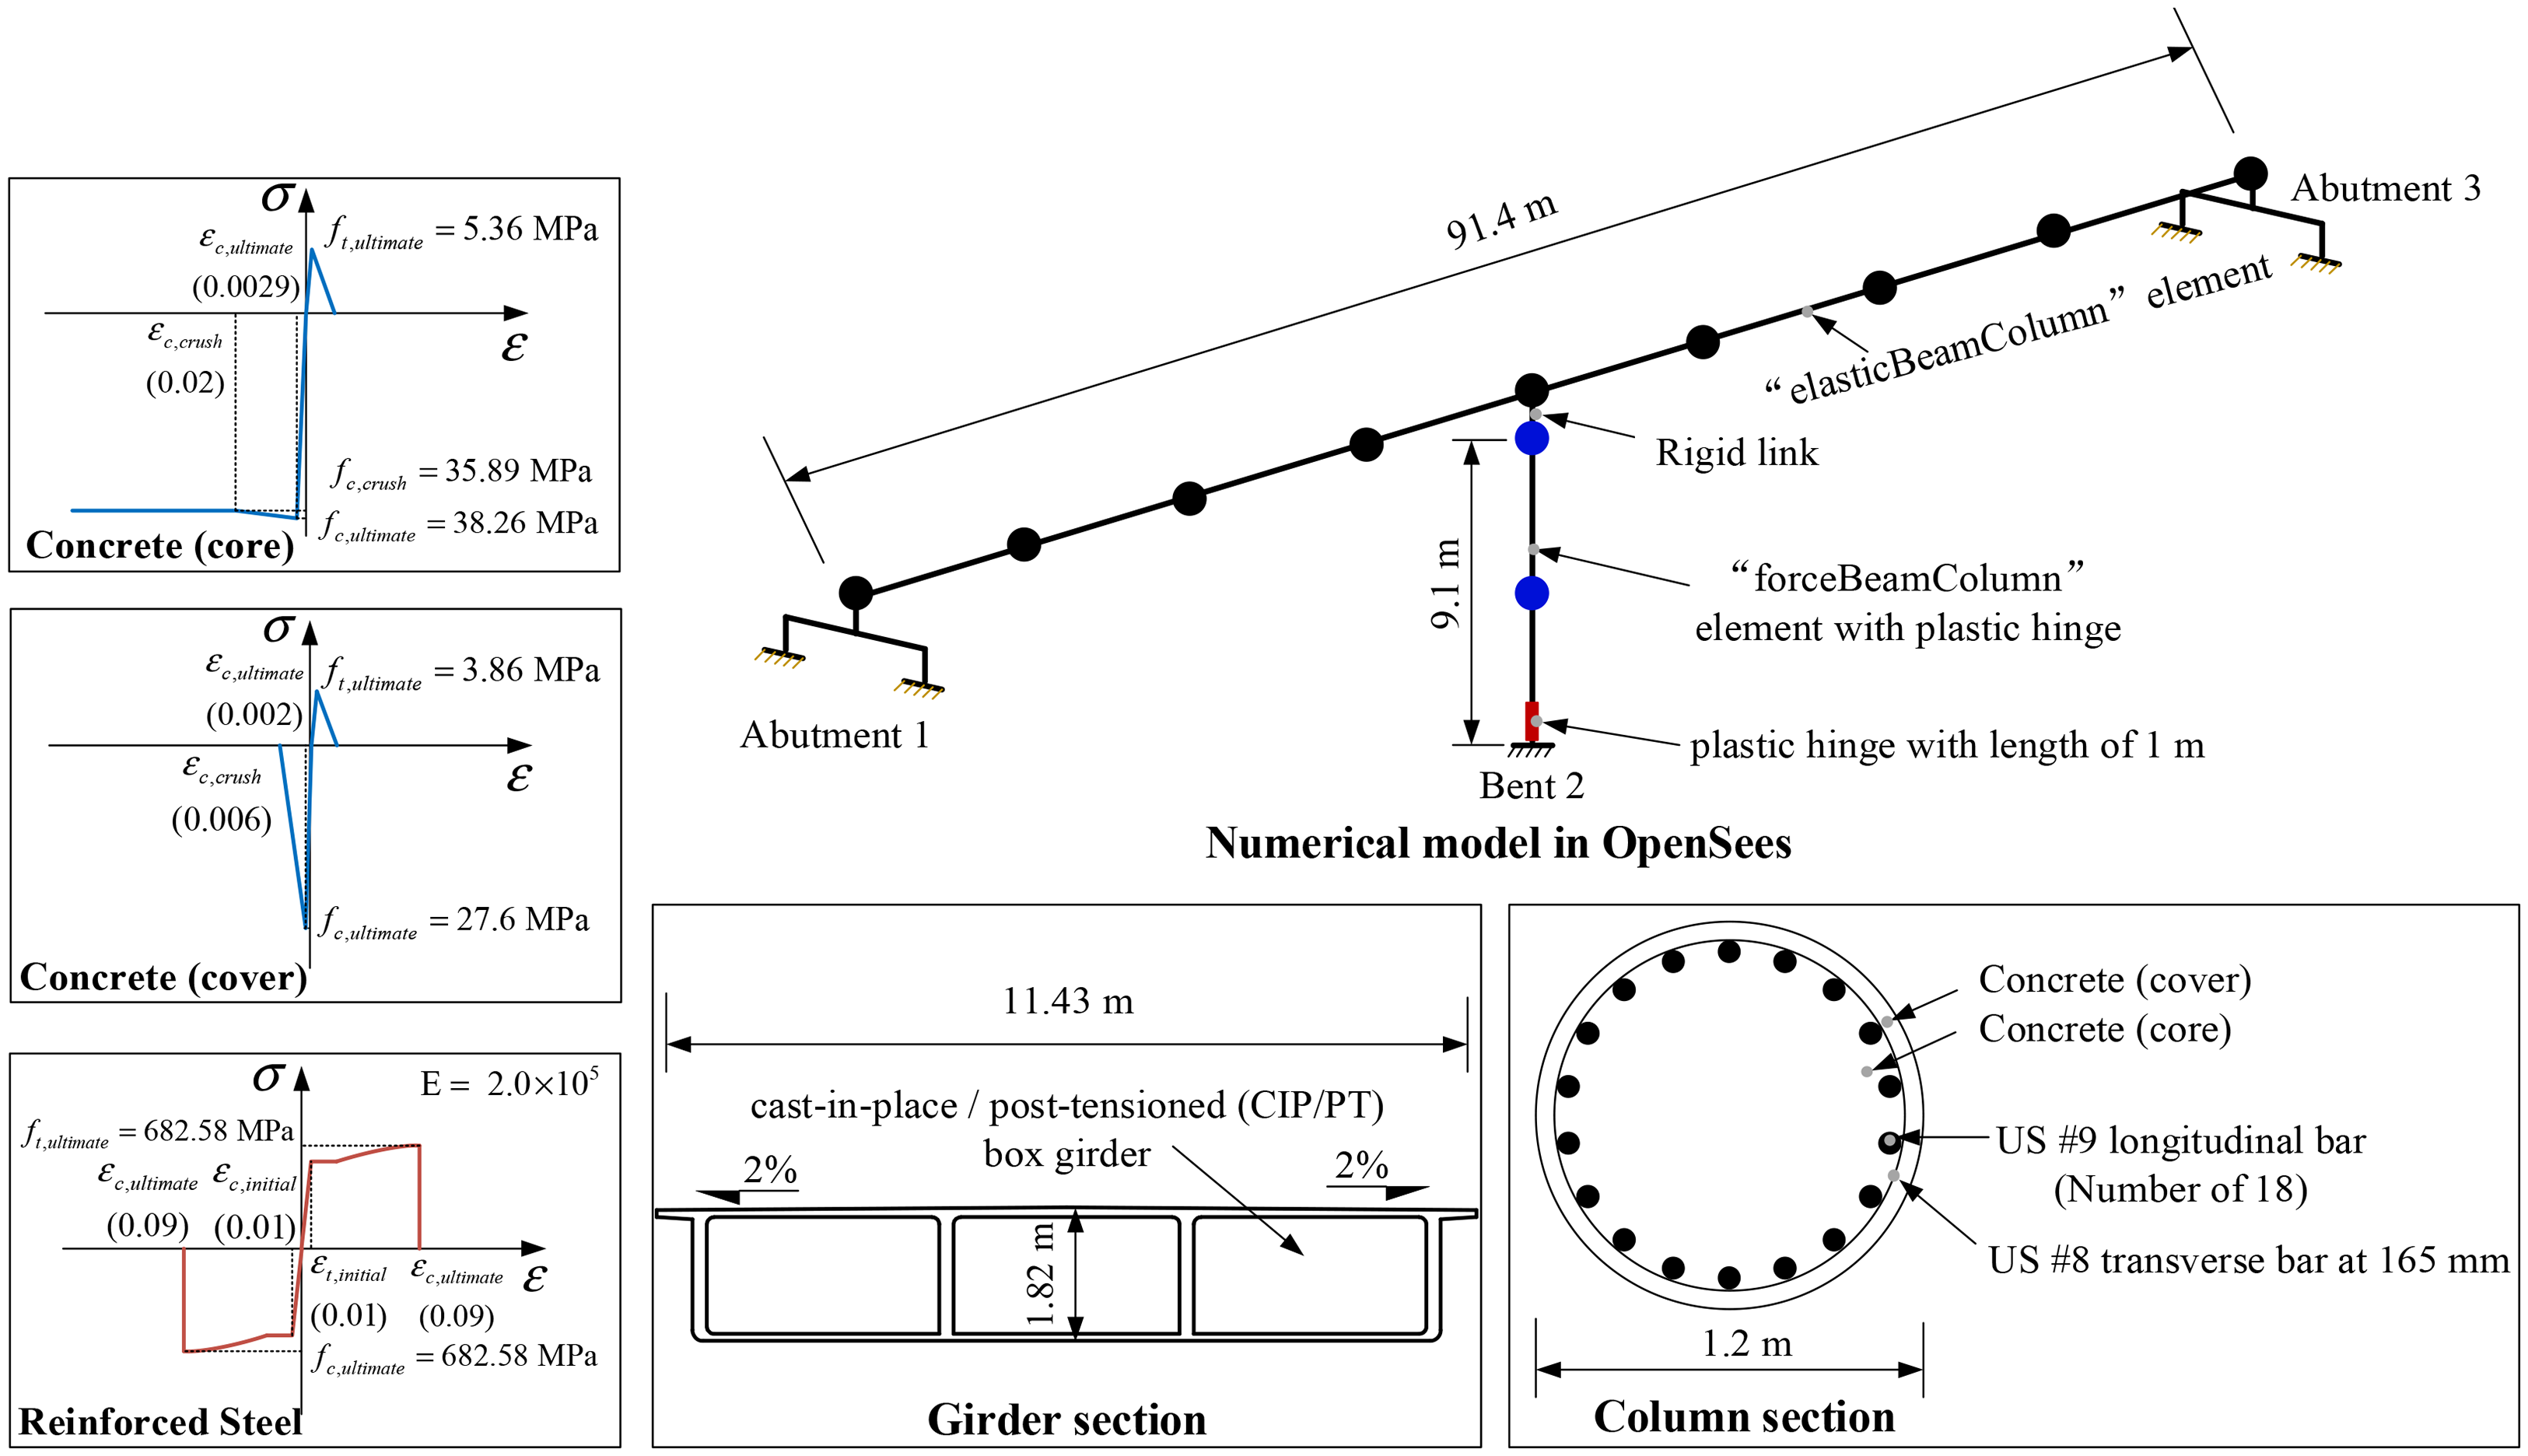
Illustration of the numerical box-girder highway bridge model for the case study.
The column was modeled in OpenSees using fiber elements to capture flexural inelasticity and energy dissipation. The section was discretized into confined and unconfined concrete fibers and longitudinal steel layers, with cyclic constitutive laws calibrated for large-strain RC behavior. Flexural yielding was concentrated in end regions modeled with “Force-Beam-Column” elements based on the iterative force-based formulation, which represents both distributed and concentrated plasticity. Numerical integration employed a modified two-point Gauss-Radau scheme, placing integration points at the element ends and at 8/3 of the hinge length inside the element, ensuring exact representation of linear curvature and consistent softening length (Scott, 2011). A plastic hinge length of 1.0 m, determined from the empirical expressions in (Caltrans, 2025), was assigned to the column ends. Rigid links enforced kinematic compatibility between top of the bent column and girder. Geometric nonlinearity (P-Δ effects) was included. Ancillary components such as shear keys and abutment backfill were represented by elastic elements connected to the girder and restrained by the ground, as illustrated in Figure 5. This simplified representation was adopted to capture their boundary restraint effects while isolating the dominant transverse column response and avoiding additional system-level uncertainties in demonstrating the proposed fragility-informed cGAN framework. Rayleigh damping was applied to represent modal energy dissipation consisting with RC bridge practice. Following the approach of Yoon et al. (2019), a monotonic pushover analysis of the fiber-section model yielded a yield displacement
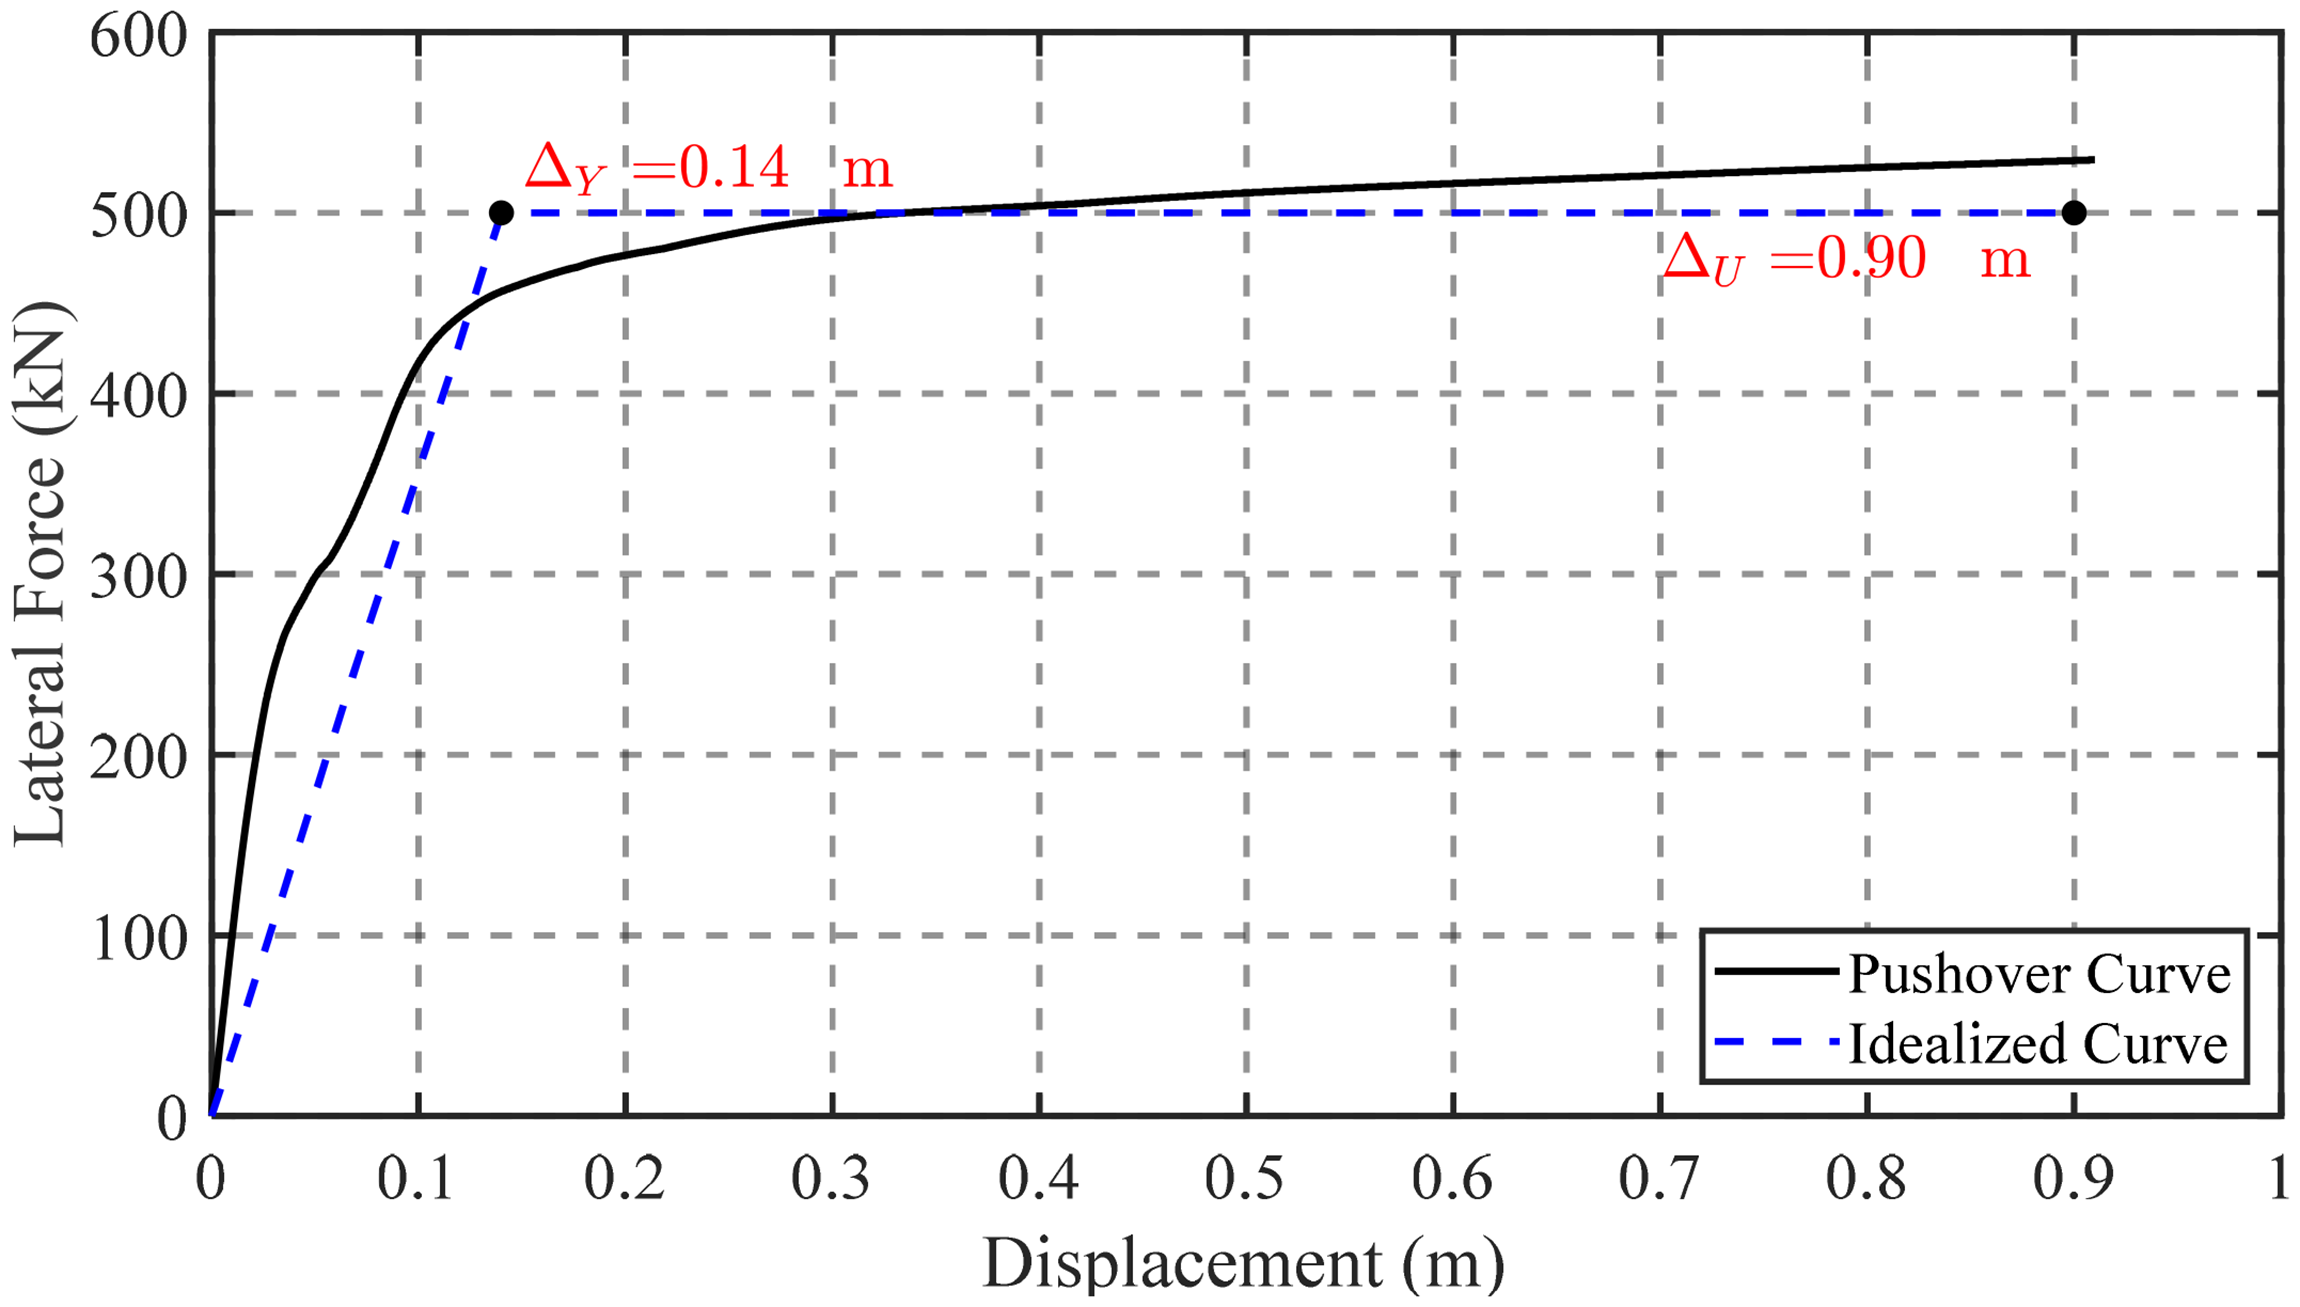
Force-displacement curve from pushover analysis.
Ground-motion dataset for training
Seismic inputs comprised both recorded pulse-like and nonpulse-like ground motions, alongside site-specific synthetic realizations. A total of 488 recorded pulse-like motions, each with two orthogonal horizontal components and identified by Shahi and Baker (2014) via an efficient MATLAB algorithm from the NGA-West2 database, were adopted. Besides these, 1000 synthetic ground motions were generated following the MATLAB procedure of Yamamoto and Baker (2013), based on the fault and site parameters summarized in Figure 7, ensuring broad coverage of intensity and pulse characteristics relevant to near-fault and long-period bridge response.
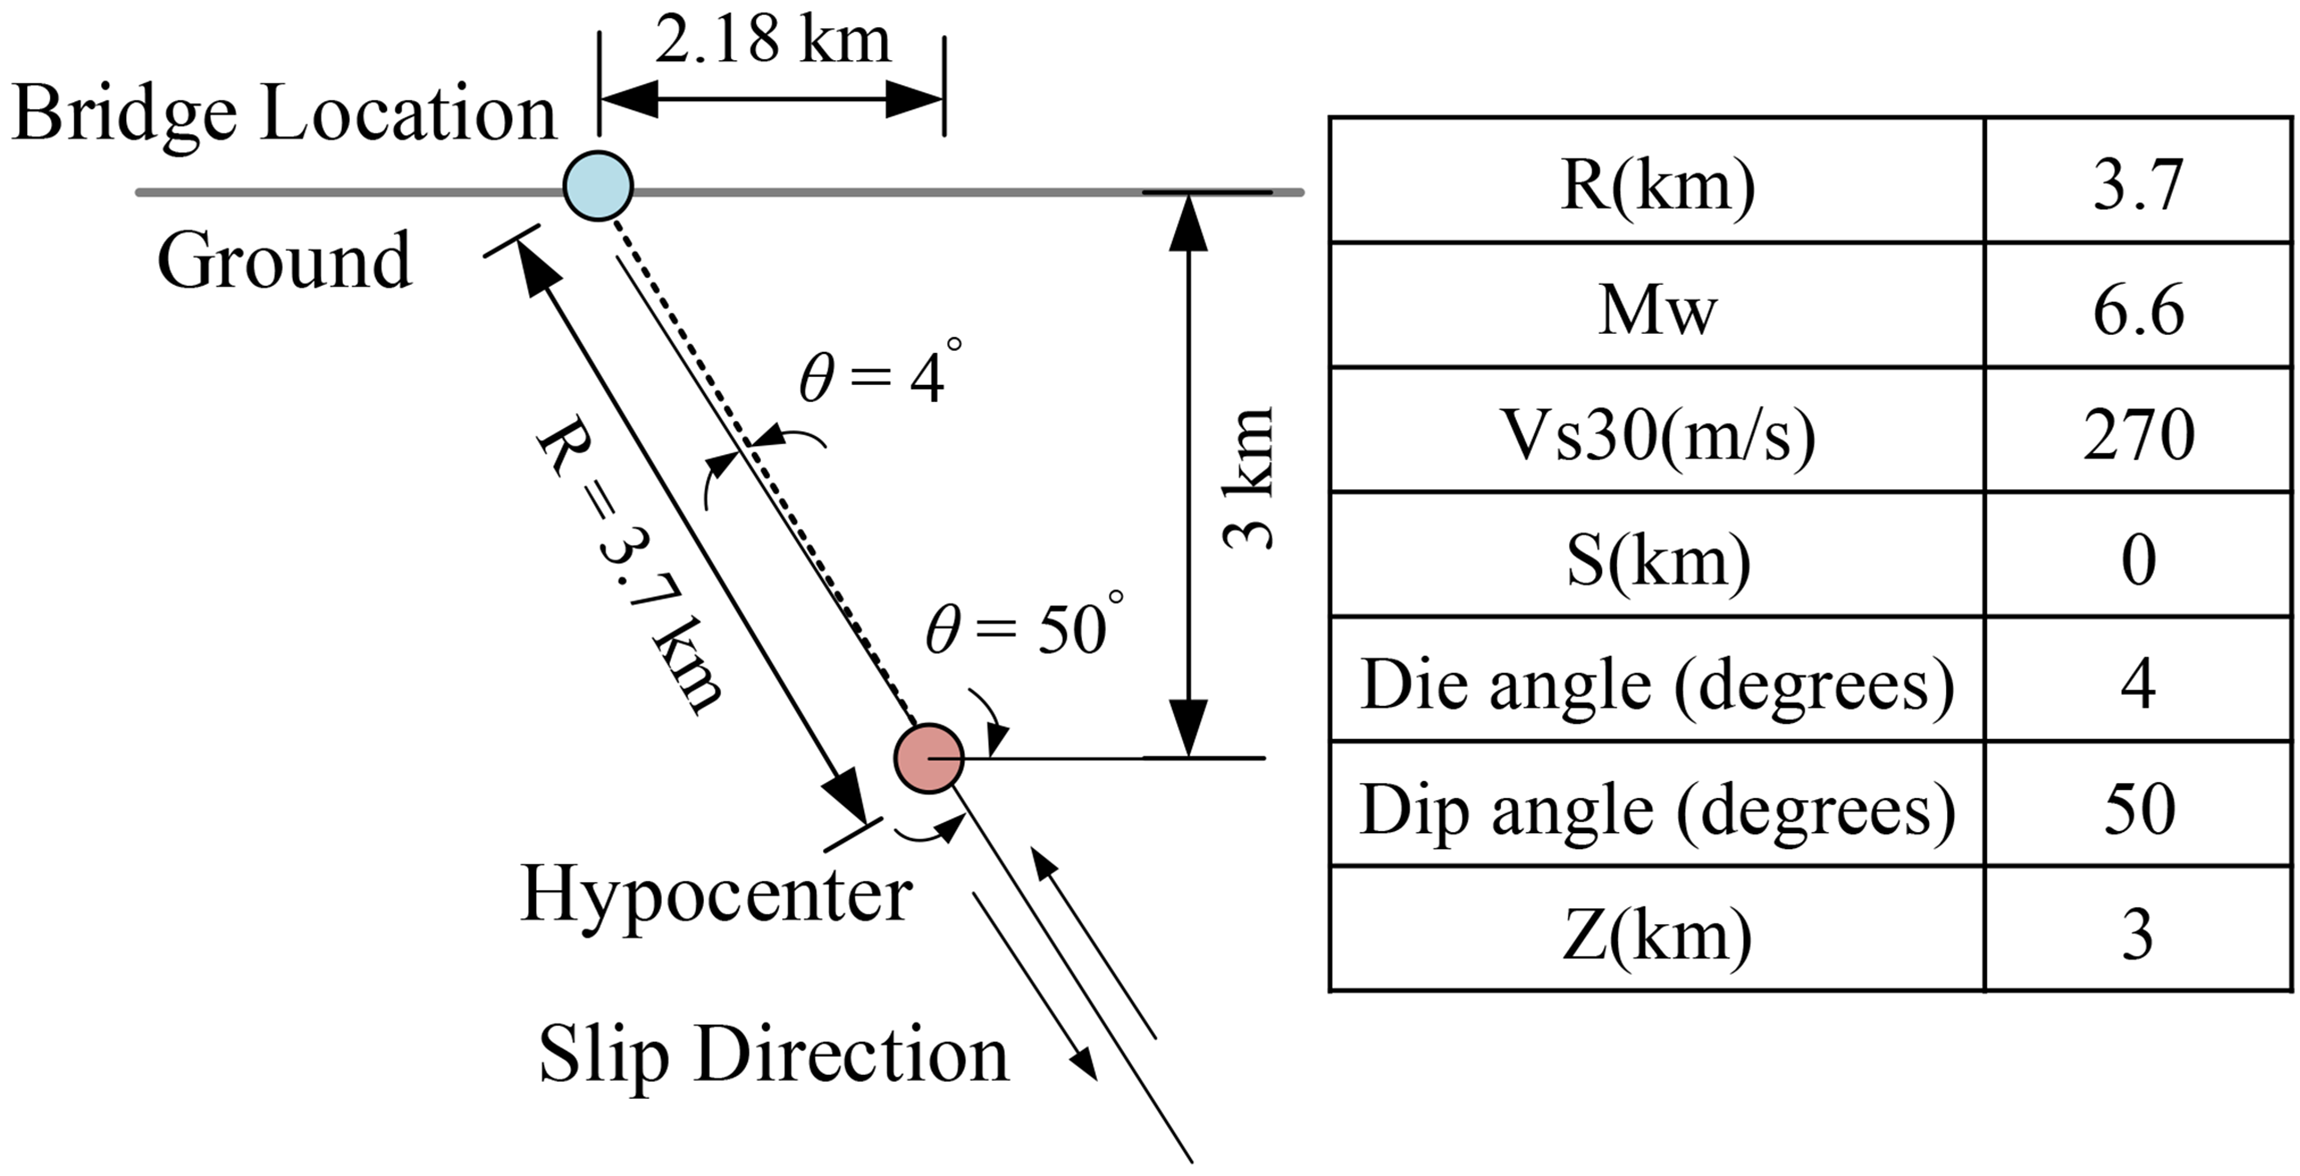
Information of the fault at the bridge site.
Additionally, a set of 100 recorded ground motions (two orthogonal horizontal components each) selected from the NGA database following Mackie and Stojadinovic (2005) is incorporated to provide an independent probabilistic reference. The dataset spans a wide range of shaking intensities (PGA from 0 to 0.80 g) and includes diverse seismic characteristics, such as variations in magnitude, source-to-site distance, fault mechanism, and near-fault pulse effects. Rather than being used directly in fragility construction, this dataset is employed during the adversarial training process, where the corresponding IM-EDP results obtained from OpenSees simulations serve as a reference distribution for the discriminator. This setup enables the cGAN to align the generated samples with an independently simulated probabilistic representation of structural response, particularly in sparsely sampled regions of the response space. As a result, the generated data support a more stable reconstruction of the joint IM-EDP distribution and associated fragility behavior, especially in the moderate-to-severe damage regime.
Although two orthogonal horizontal components are available for each recorded motion, the nonlinear time-history analyses were performed using unidirectional input applied in the transverse direction of the bridge, consistent with the focus on transverse column response. This simplification allows the dominant damage-related response to be isolated while avoiding additional system-level complexities associated with multi-directional excitation.
The peak ground velocity (PGV) was chosen as the primary intensity measure due to its strong correlation with combined peak and residual column displacements, while alternative IMs (e.g., PGA, spectral acceleration (Sa)) were assessed in following studies. Nonlinear time-history analyses of the ground-motion suite yielded maximum and residual transverse displacements at the column top, with post-processing removing nonphysical responses and imposing a numerical floor to stabilize log-space fragility fits. The resulting (IM, EDP) pairs, together with held-out validation subsets, form the empirical database for cGAN training, synthetic ensemble generation, and calibration of the proposed DJ and optimal θJ.
Results and discussion
The selection of an appropriate IM is an important aspect of fragility analysis, as it directly influences the characterization of seismic demand and the resulting fragility estimates. Previous studies have shown that different IM choices can lead to notable variations in fragility relationships, particularly in terms of dispersion and predictive capability, and that single scalar IMs may be insufficient to capture complex response features (Giannini et al., 2022).
In this study, three commonly used scalar IMs, namely PGA, PGV, and Sa, are examined using the dataset obtained from nonlinear time-history analyses (NTHAs) of the prototype bridge in Figure 8. Their relationships with maximum and residual displacement are evaluated through linear regression after normalizing the IMs to the range [0,1].
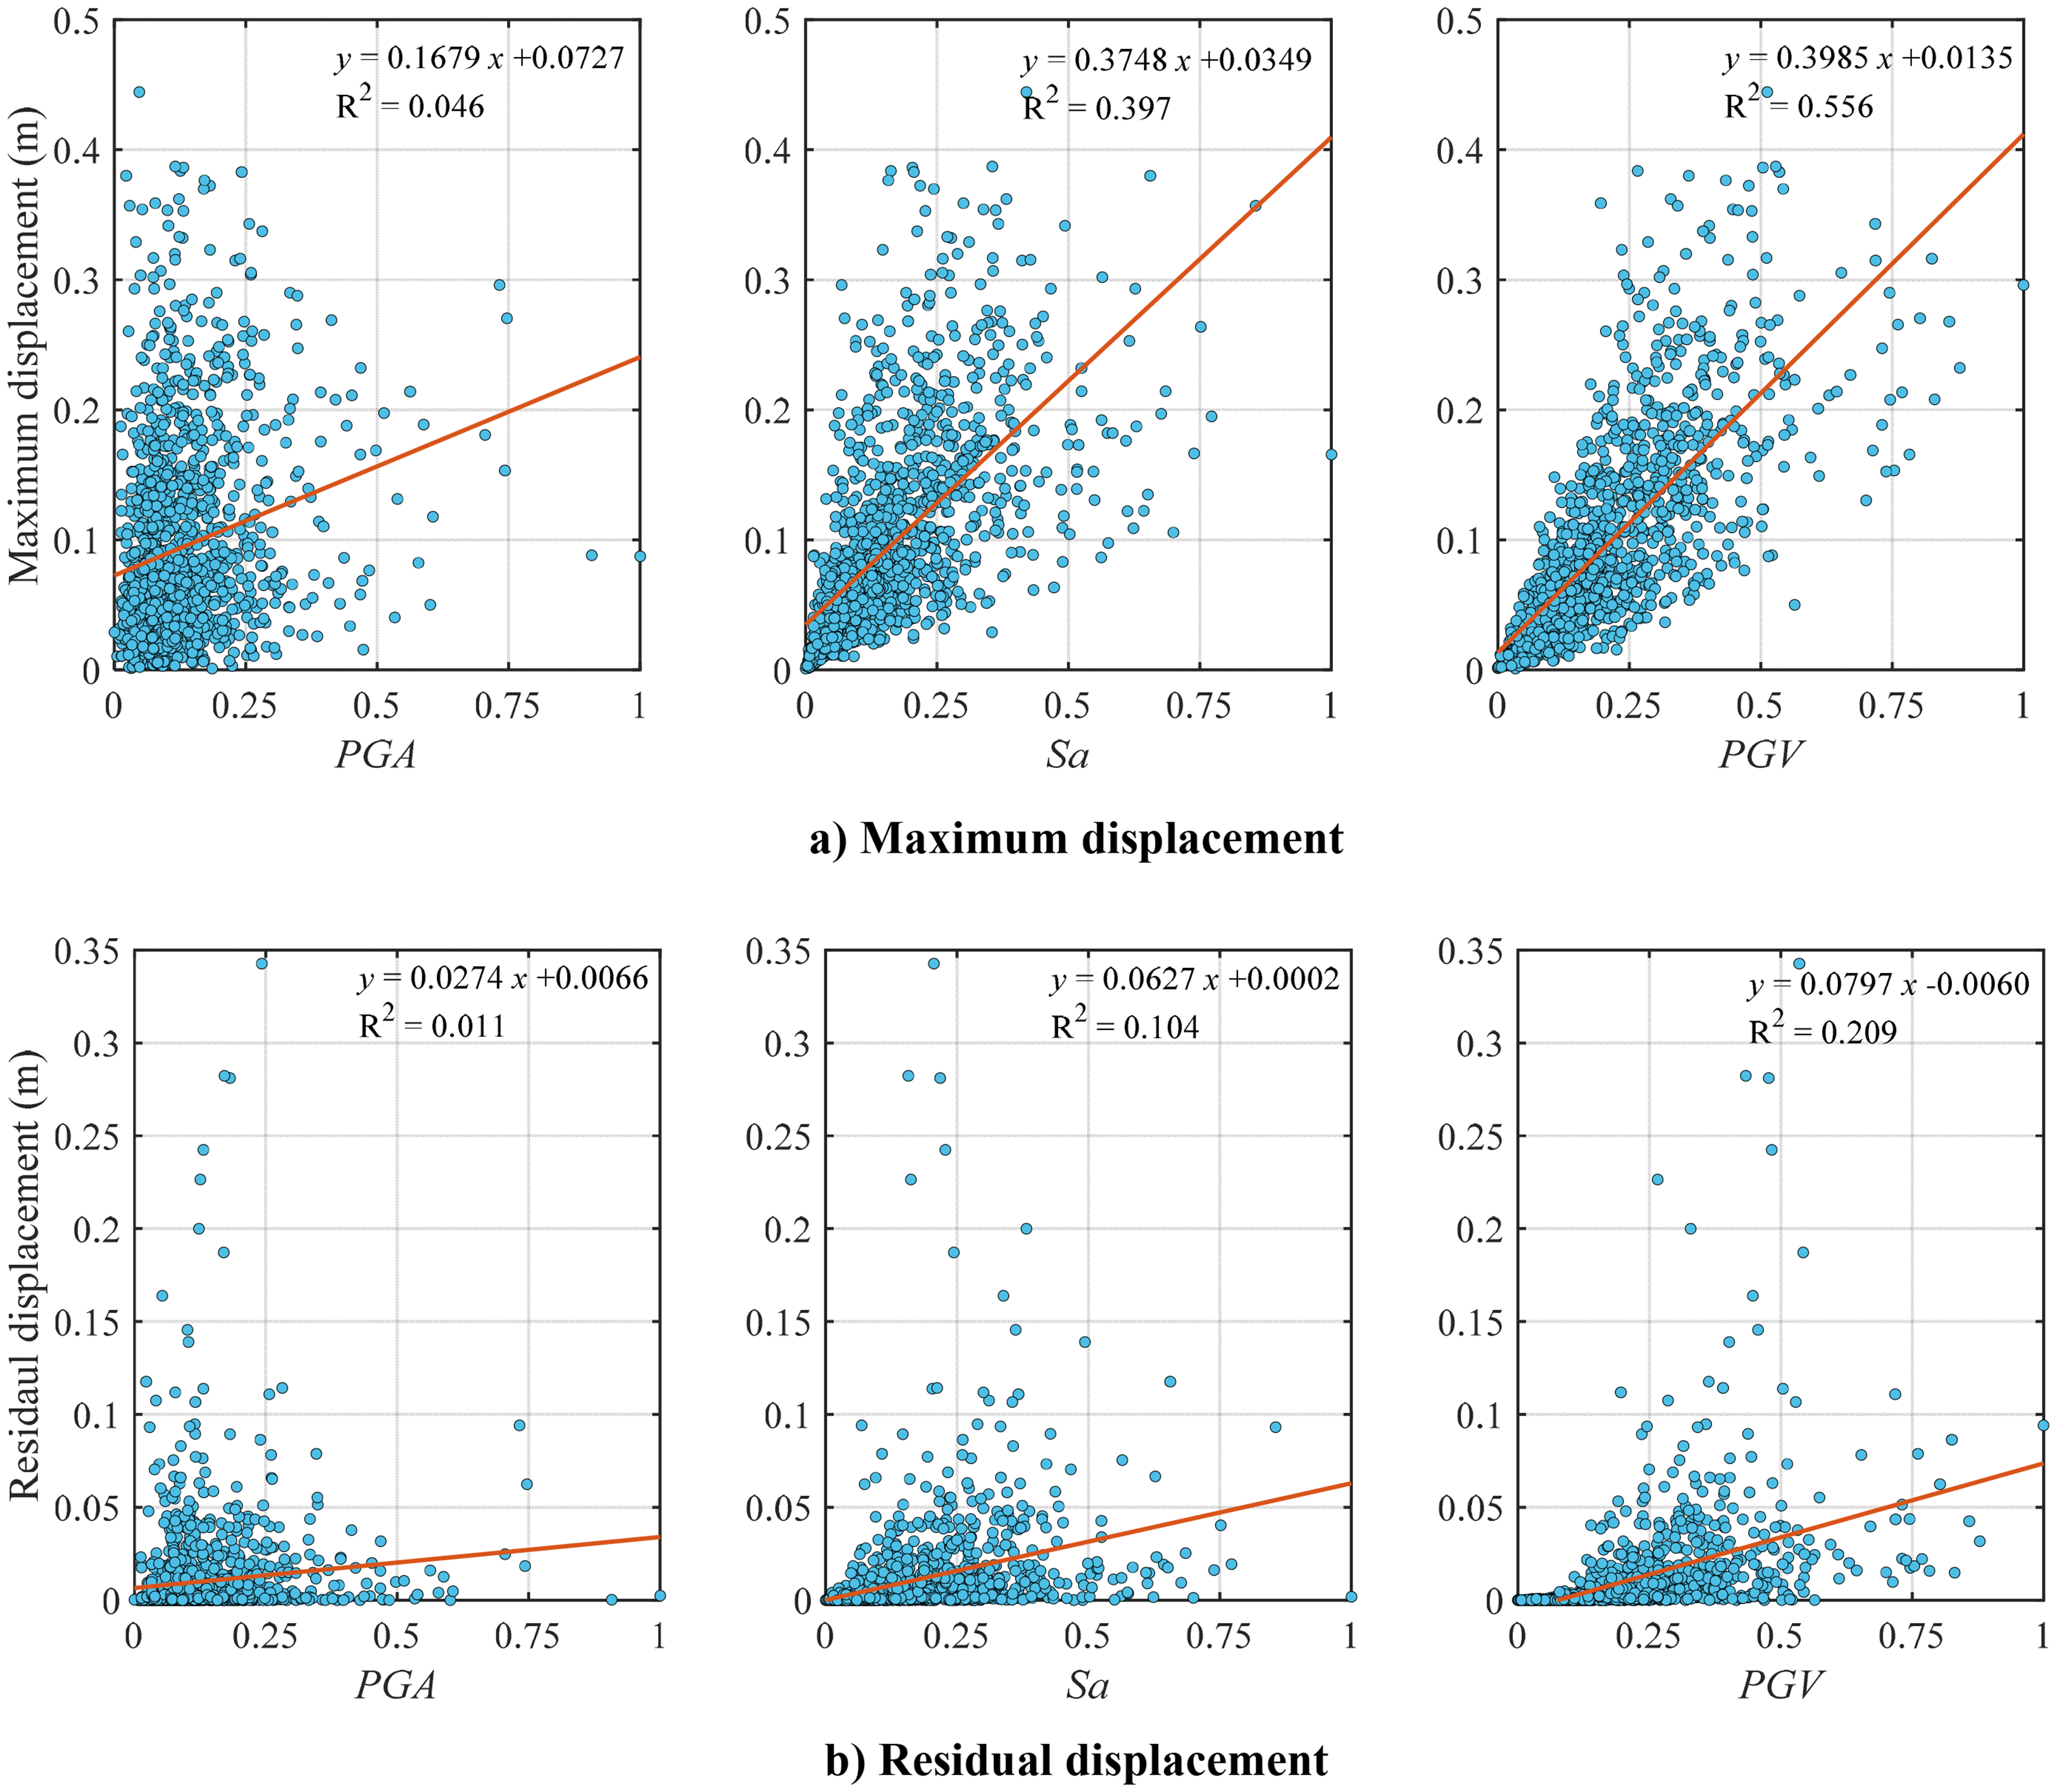
Correlation between IMs and maximum-residual displacement based on ground-motion dataset for training.
The results indicate that all three IMs exhibit limited predictive capability for residual displacement, as reflected by relatively low R2 values. This is consistent with the inherently dispersed nature of residual deformation, which depends on cumulative and path-dependent structural behavior and is therefore not well captured by a single scalar IM. Among the candidates considered, PGV shows comparatively stronger and more consistent correlation with both maximum and residual displacement, while PGA and Sa exhibit weaker associations for this benchmark case.
Accordingly, PGV is adopted as the primary IM in this study as a comparative and case-specific choice, rather than as a universally optimal predictor. Within the proposed framework, the IM serves primarily as a conditioning variable for representing the joint IM-EDP distribution, rather than as a deterministic predictor of structural response. In this context, PGV provides a suitable balance for conditioning the joint MD-RD response space and is therefore used for subsequent fragility calibration and cGAN training.
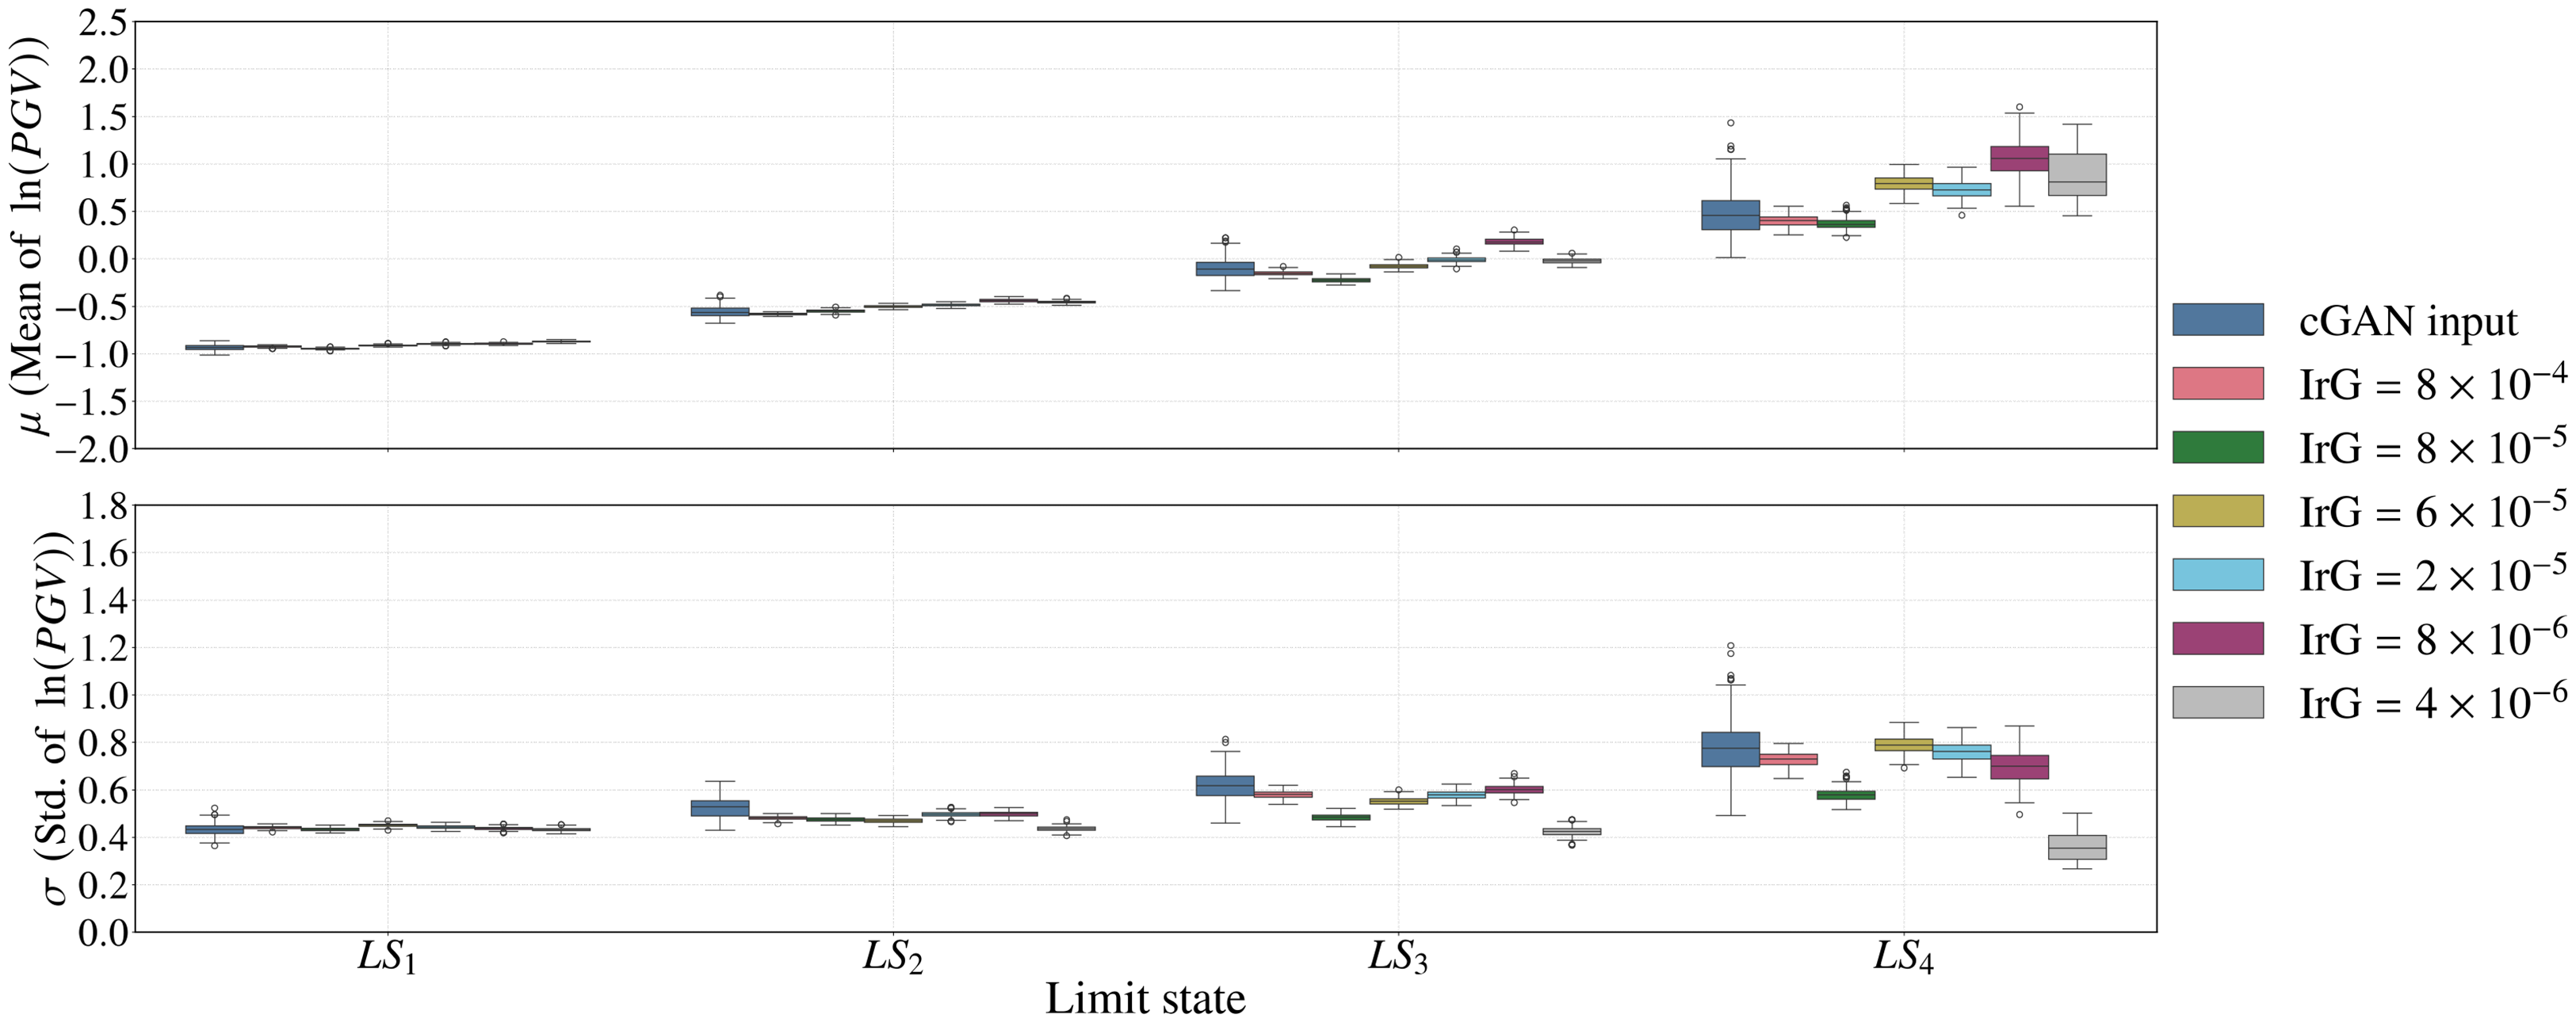
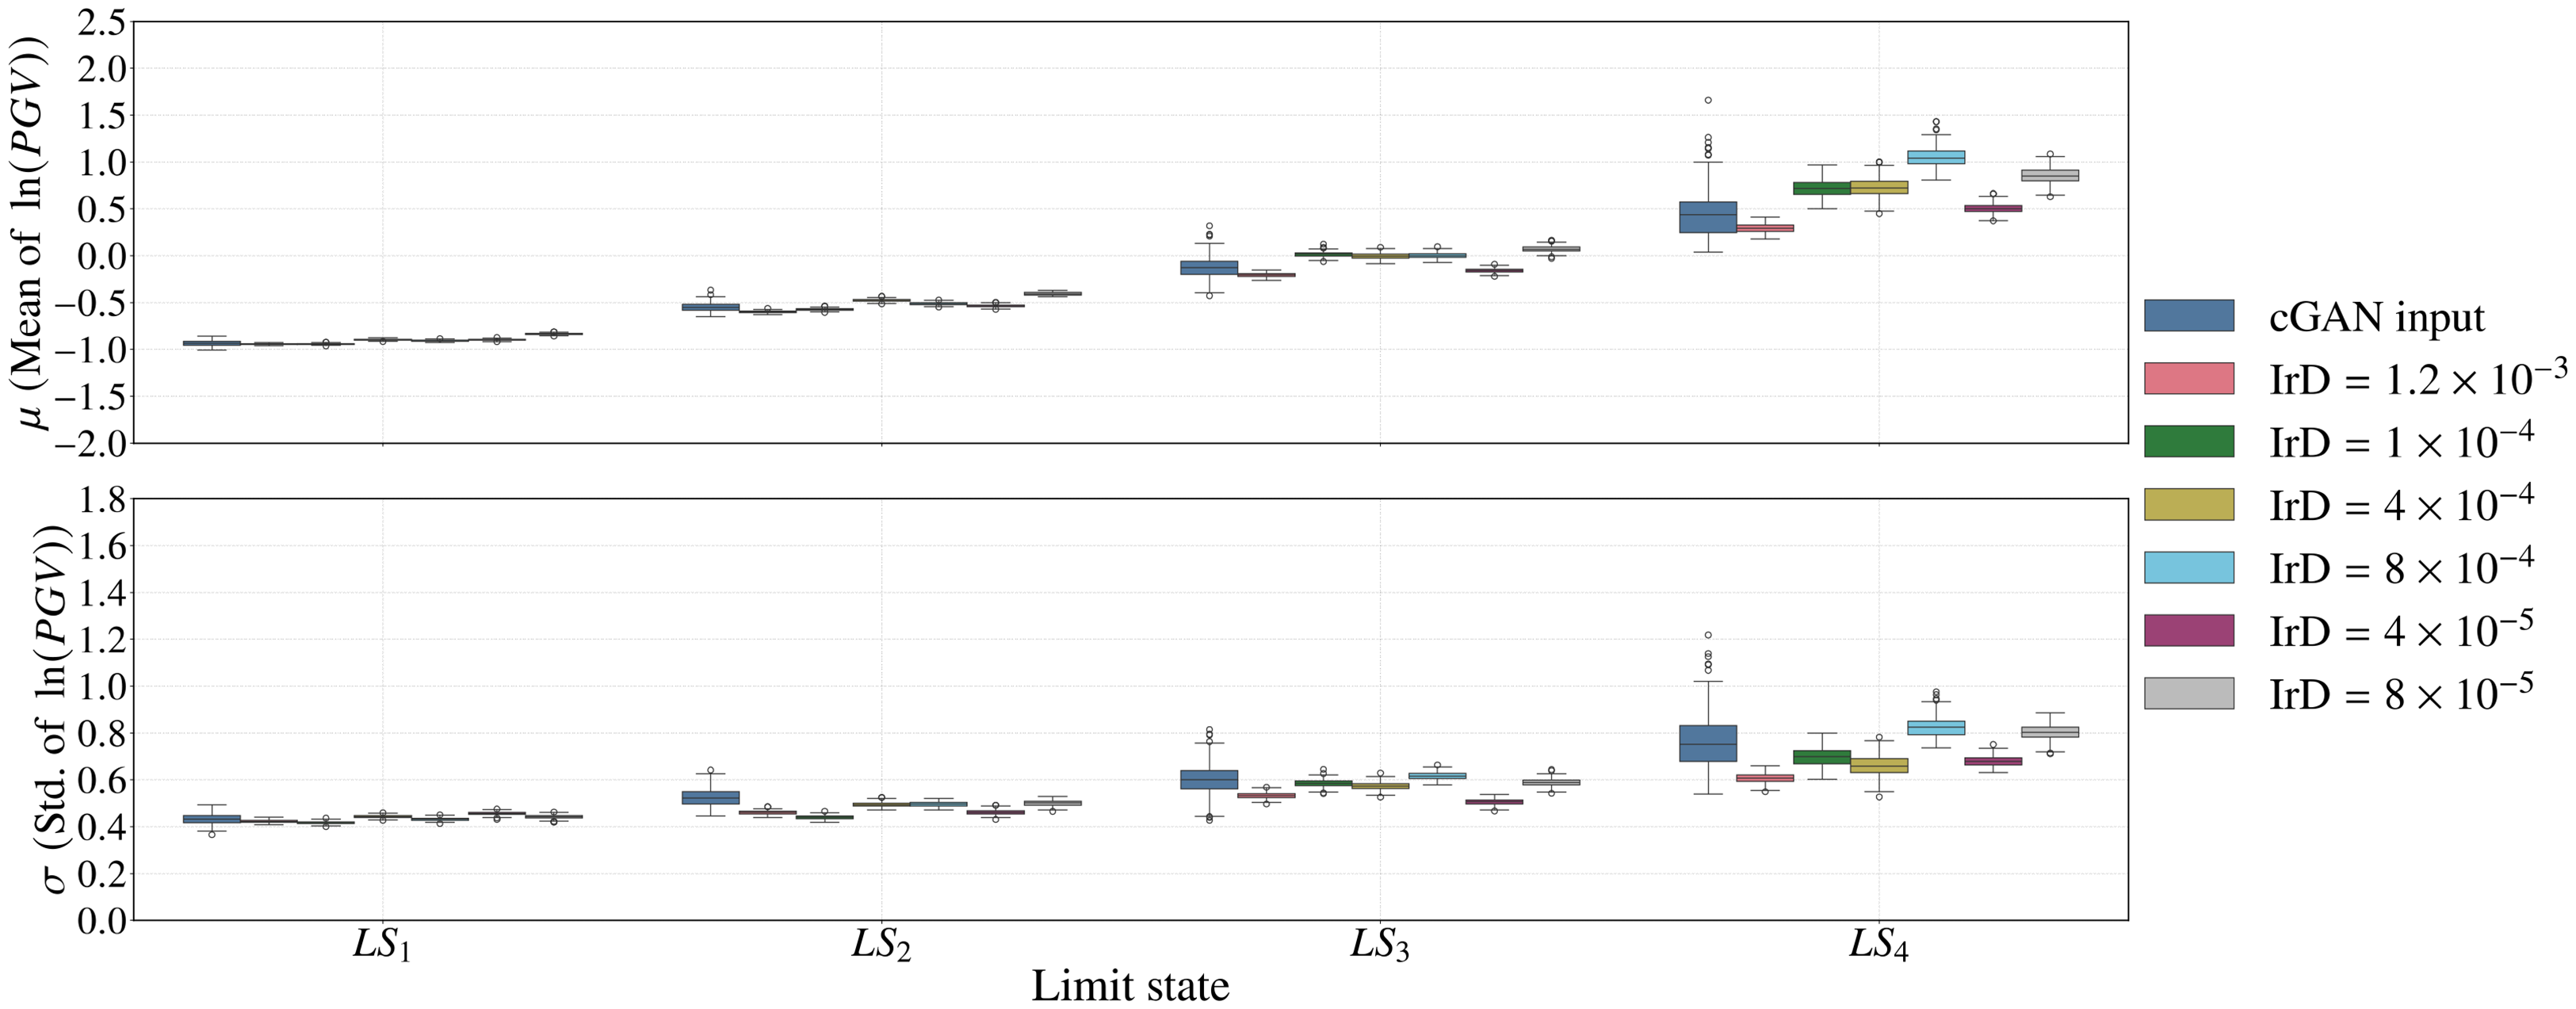
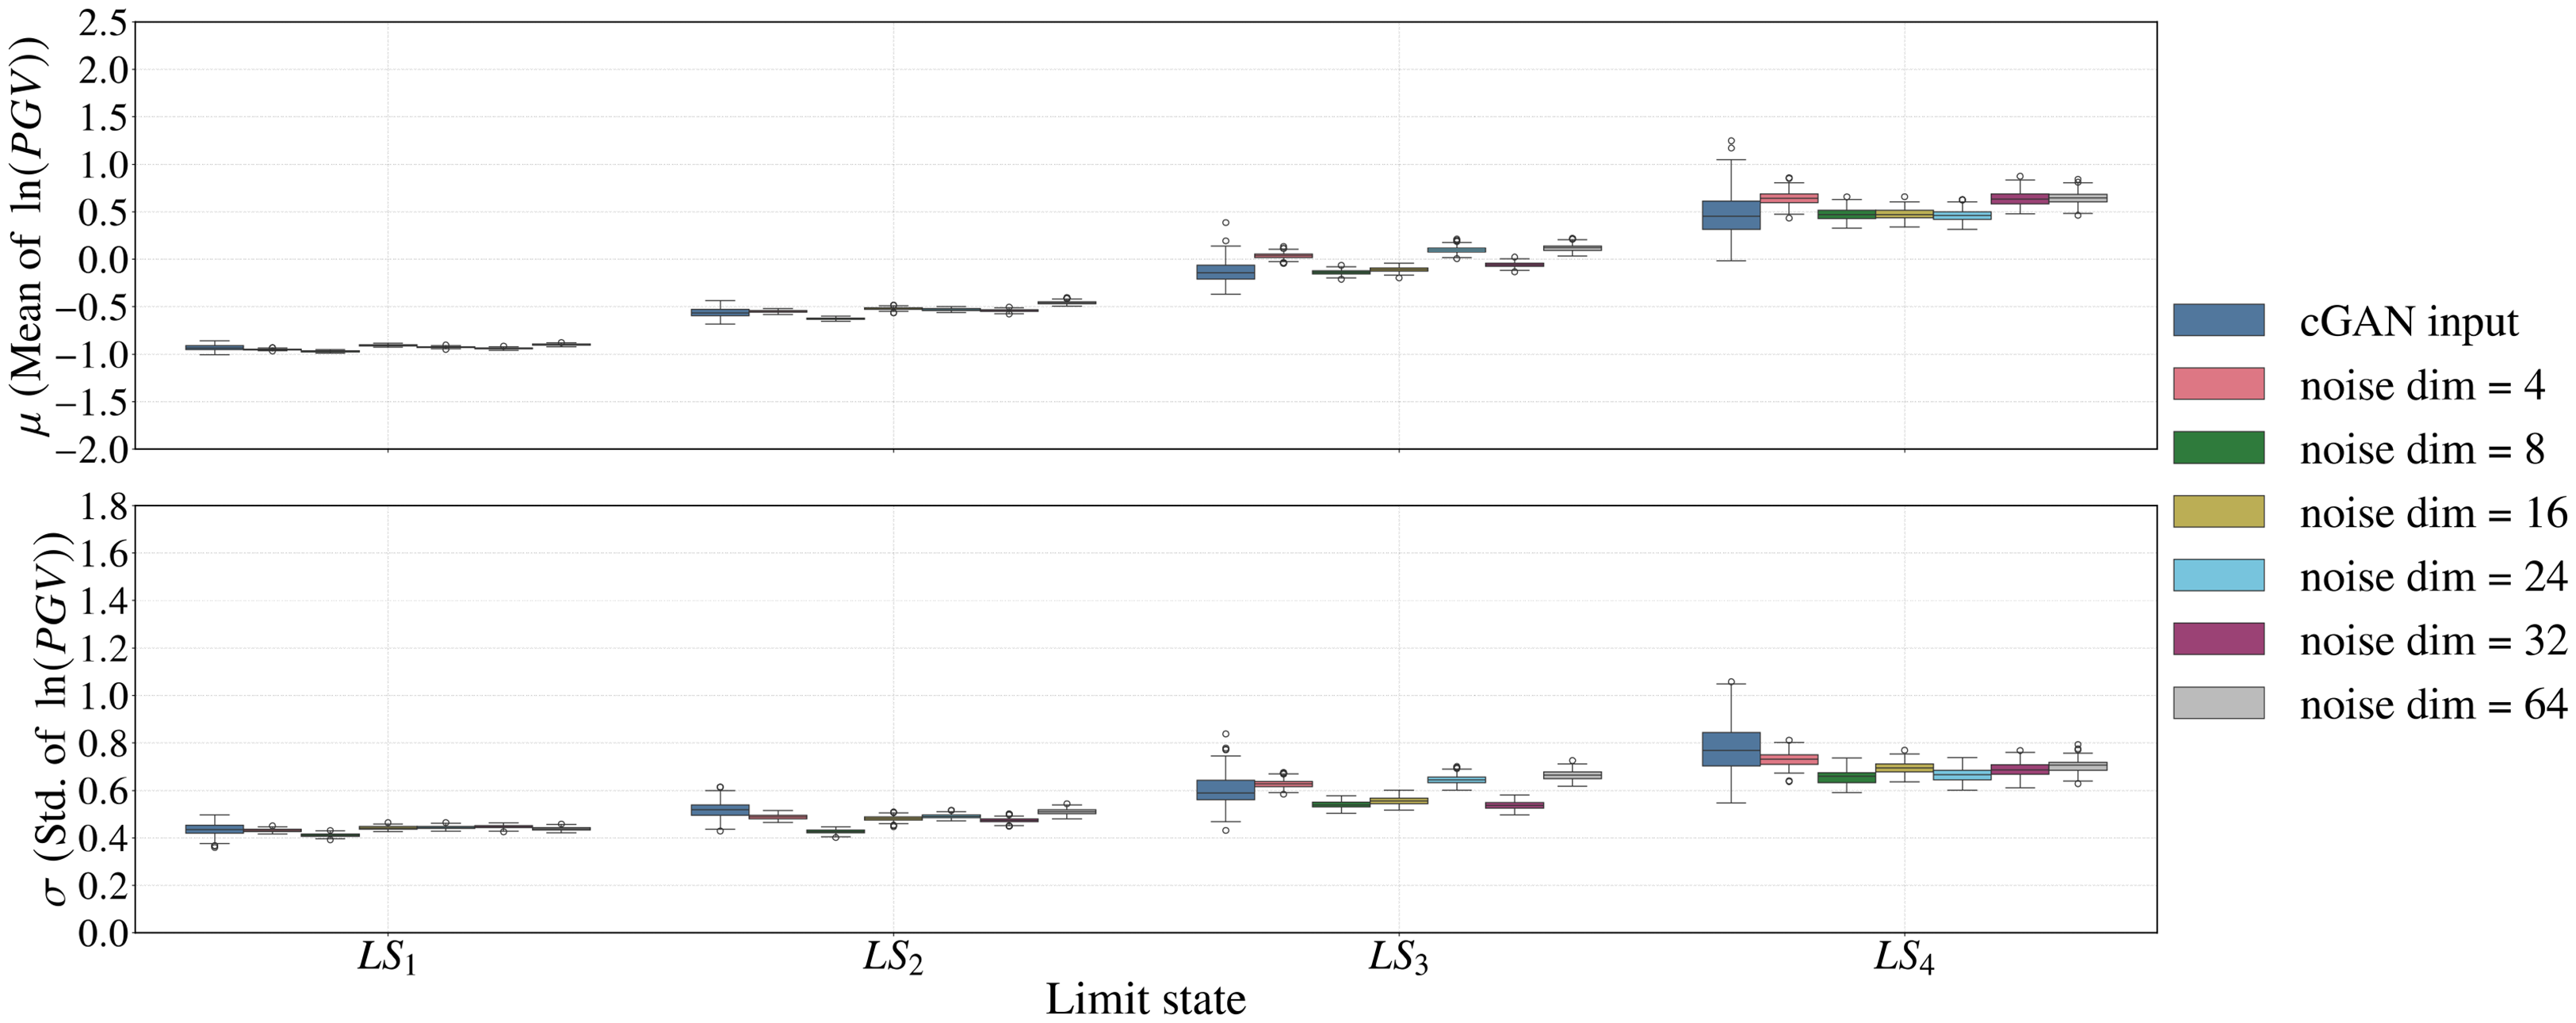
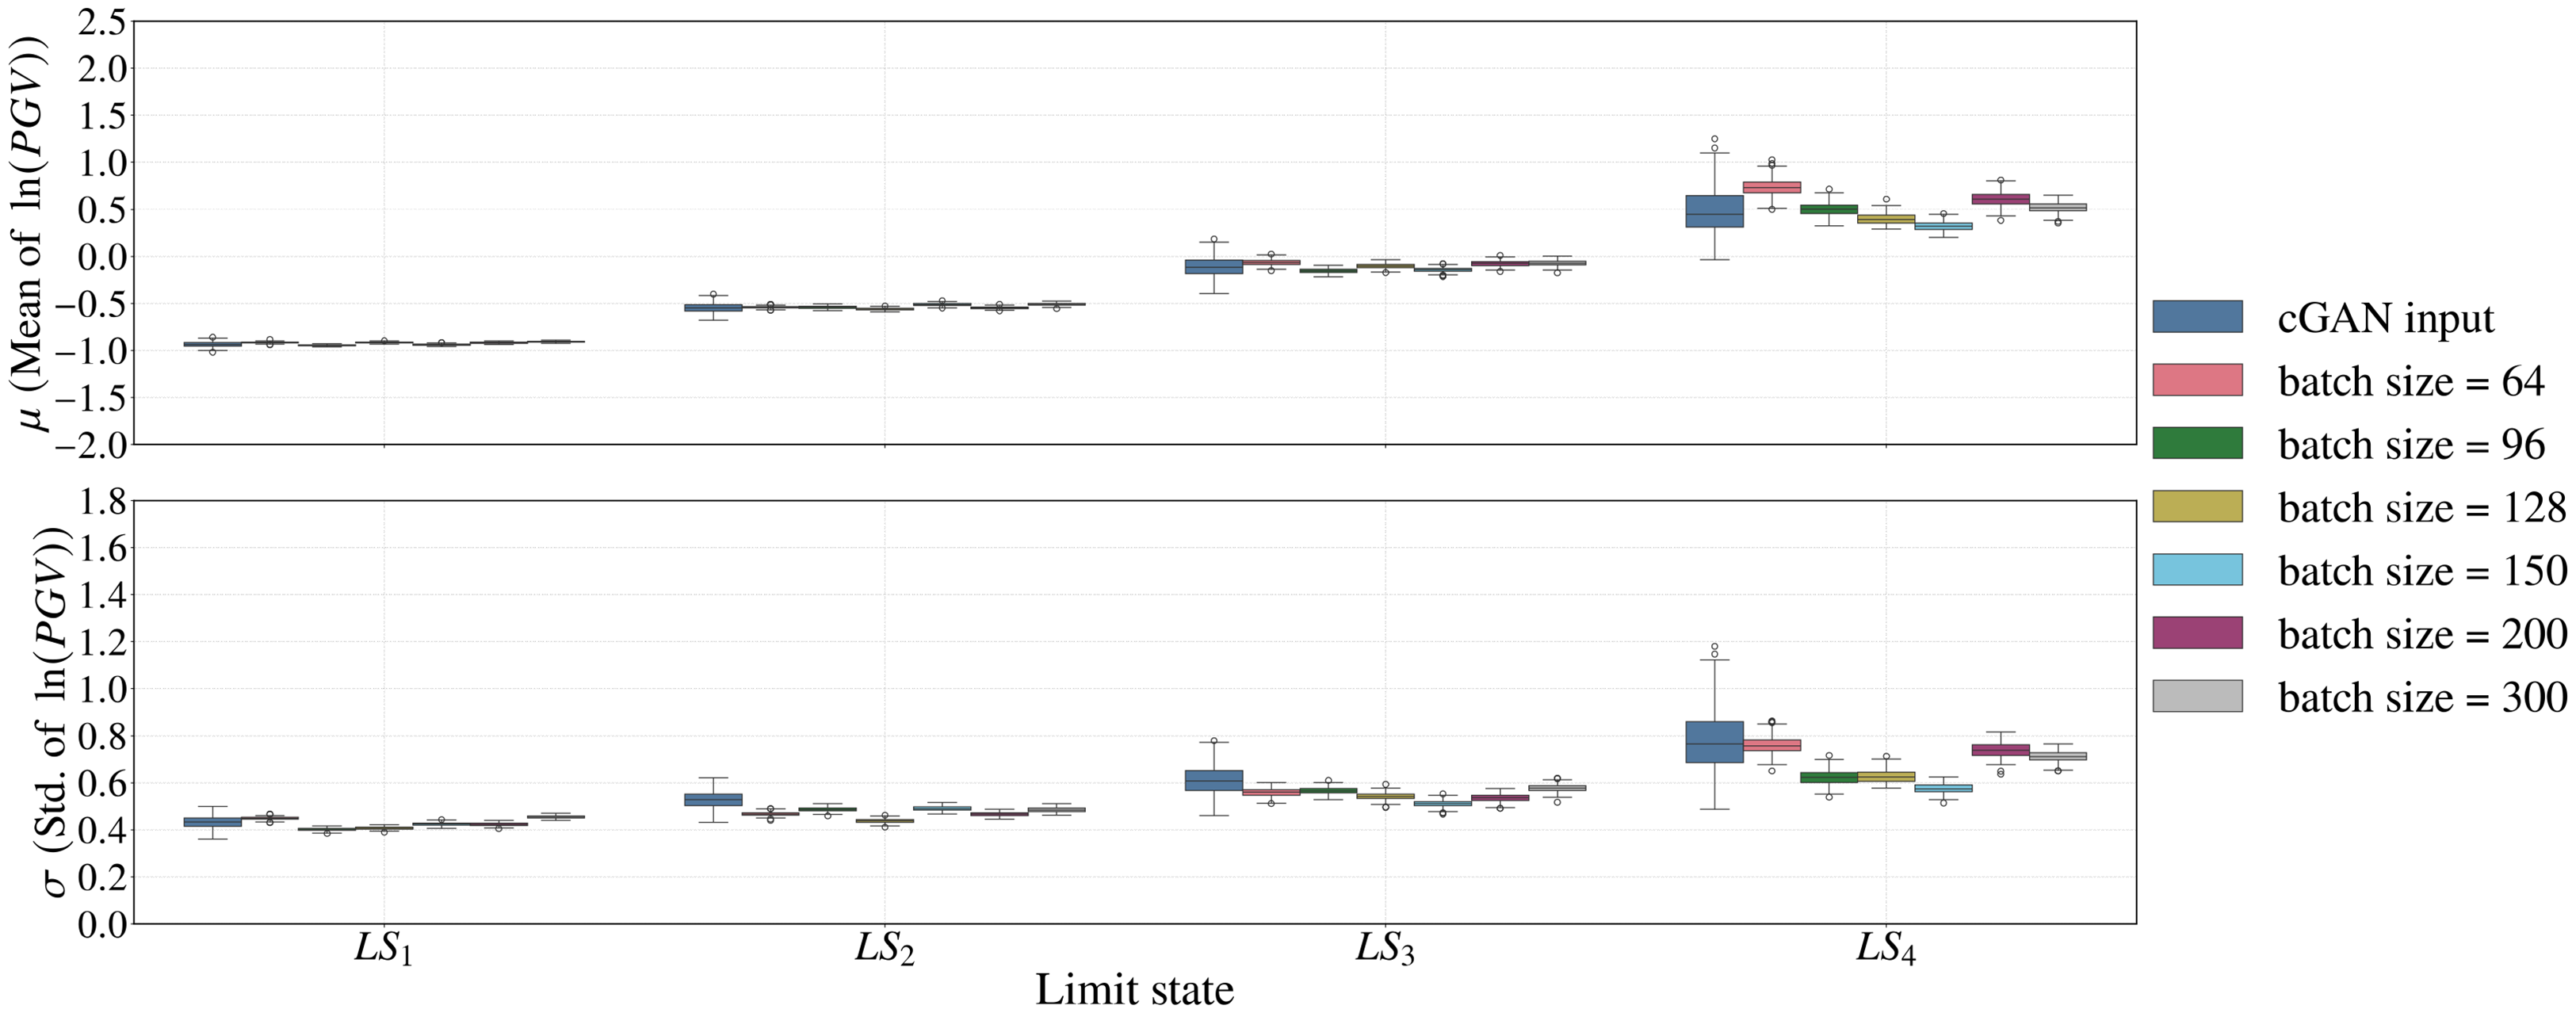
To ensure robust and stable model training, the sensitivity of the cGAN to four major hyperparameters (lrD, lrG, noise dimension, and batch size) is evaluated through a bootstrap resampling analysis (Reiff et al., 2016) of ln (PGV) when the correspond DJ exceeding the θ1 ∼ θ4. During bootstrap analysis, the robustness and stability of the training process are quantified based on the mean
Bootstrap analysis of the mean
Bootstrap analysis of the mean
Bootstrap analysis of the mean
Bootstrap analysis of the mean
As demonstrated in Figures 11 and 12, the
Using these parameters, the cGAN models are trained with a composite loss combining adversarial, physics, and fragility components. Figure 13 illustrates the smooth evolution of G and D losses, physical loss, and fragility loss as training progresses. Early fluctuations gradually diminish, and both physics and fragility penalties stabilize at low values, confirming that the generator has learned to produce physically consistent conditional responses.
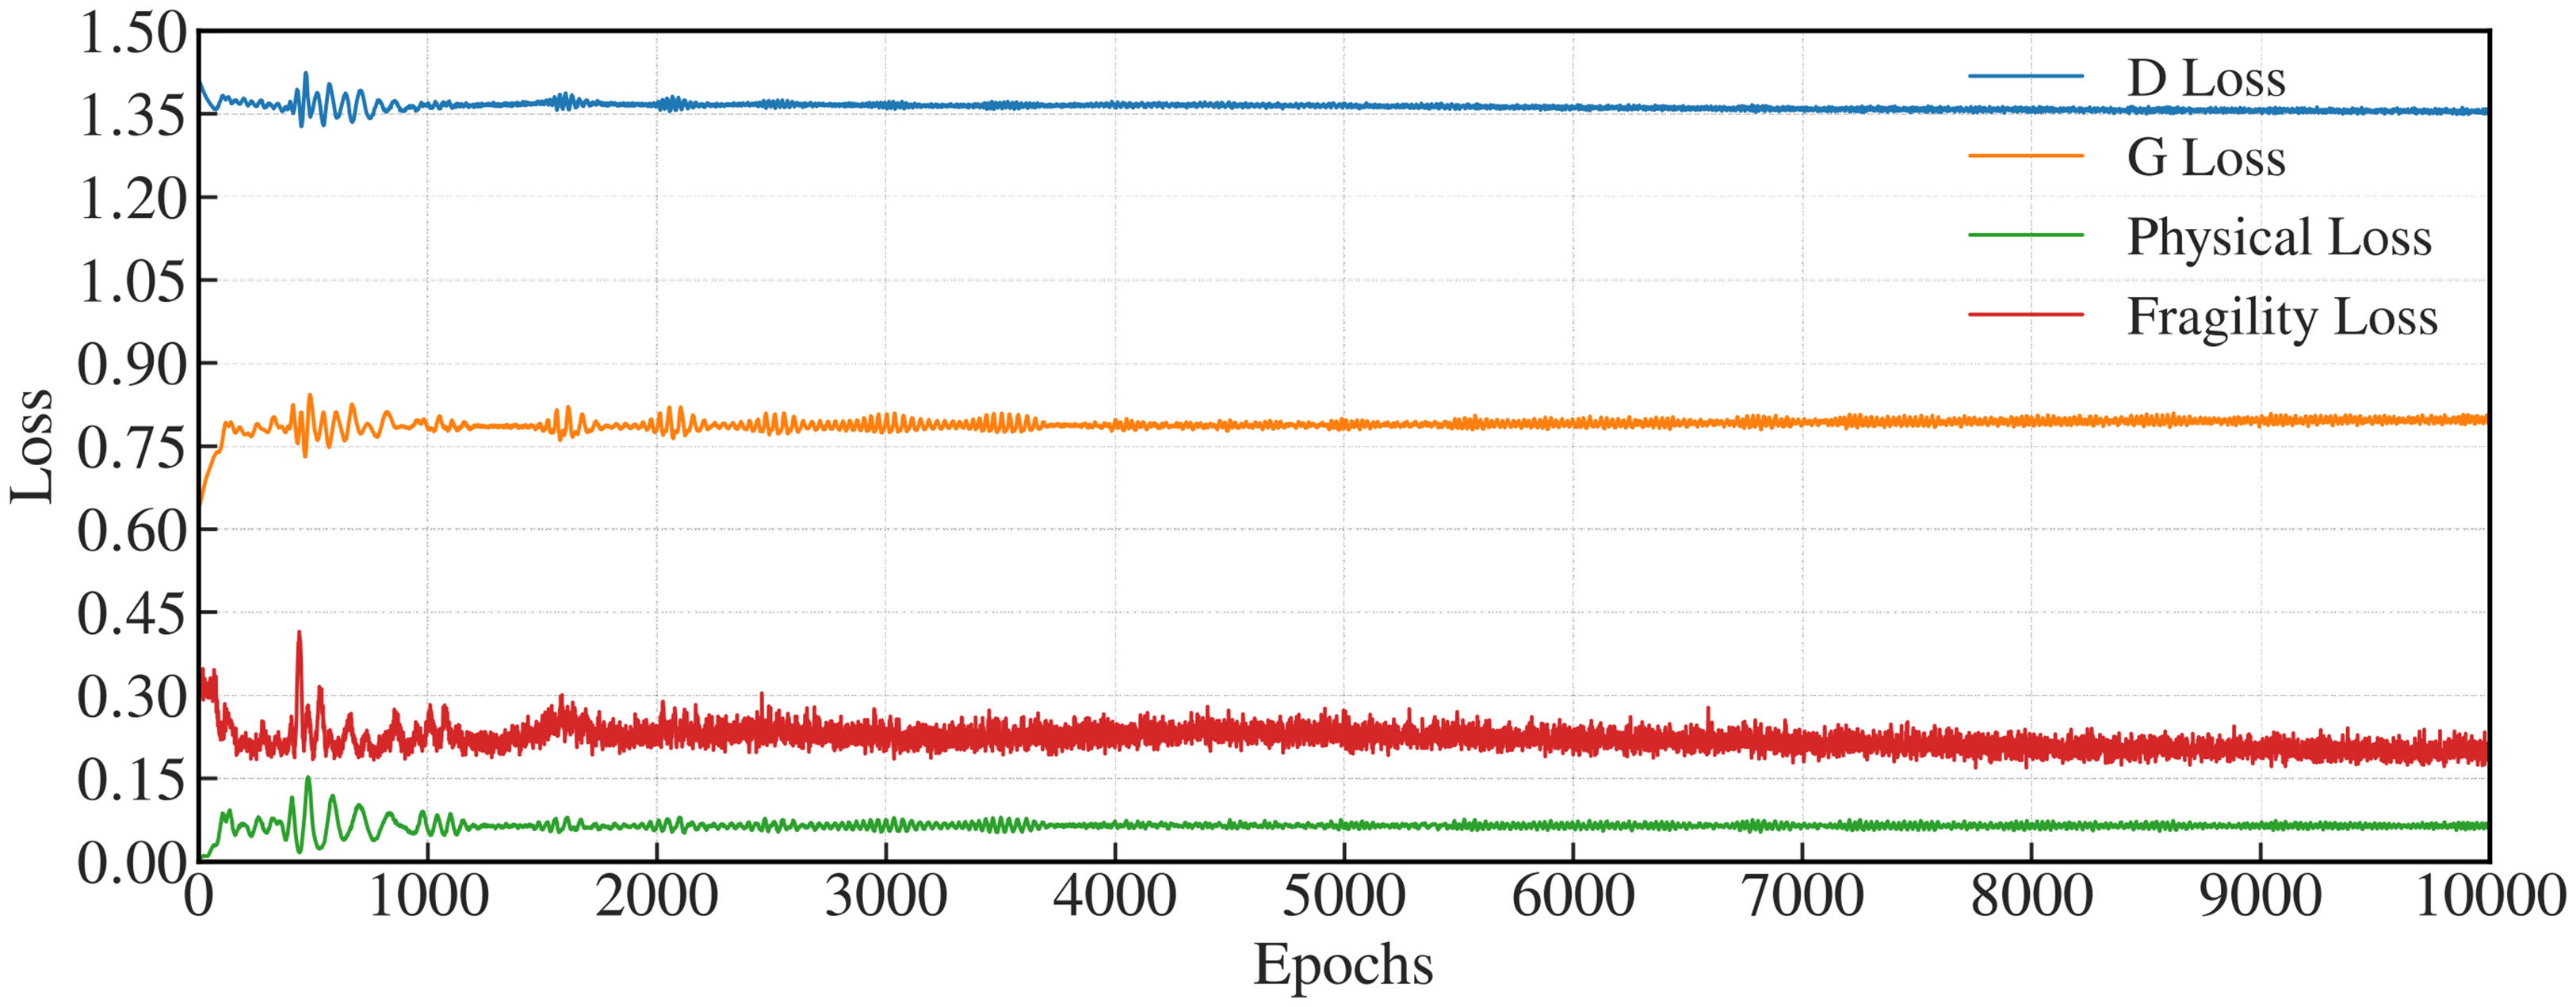
Evolution of generator and discriminator losses during cGAN training. The plot shows adversarial loss (G Loss), discriminator loss (D Loss), physical loss, and fragility loss versus training epochs.
Figures 14 and 15 indicate that at epochs 100 and 1000, the generated data underrepresent extreme responses, and the joint probability density distributions are incomplete. With training extended to epoch 10,000, extreme values are well captured, and the joint probability density distributions closely match the empirical distribution, confirming stable convergence and accurate reproduction of the relationship between IM and EDP.
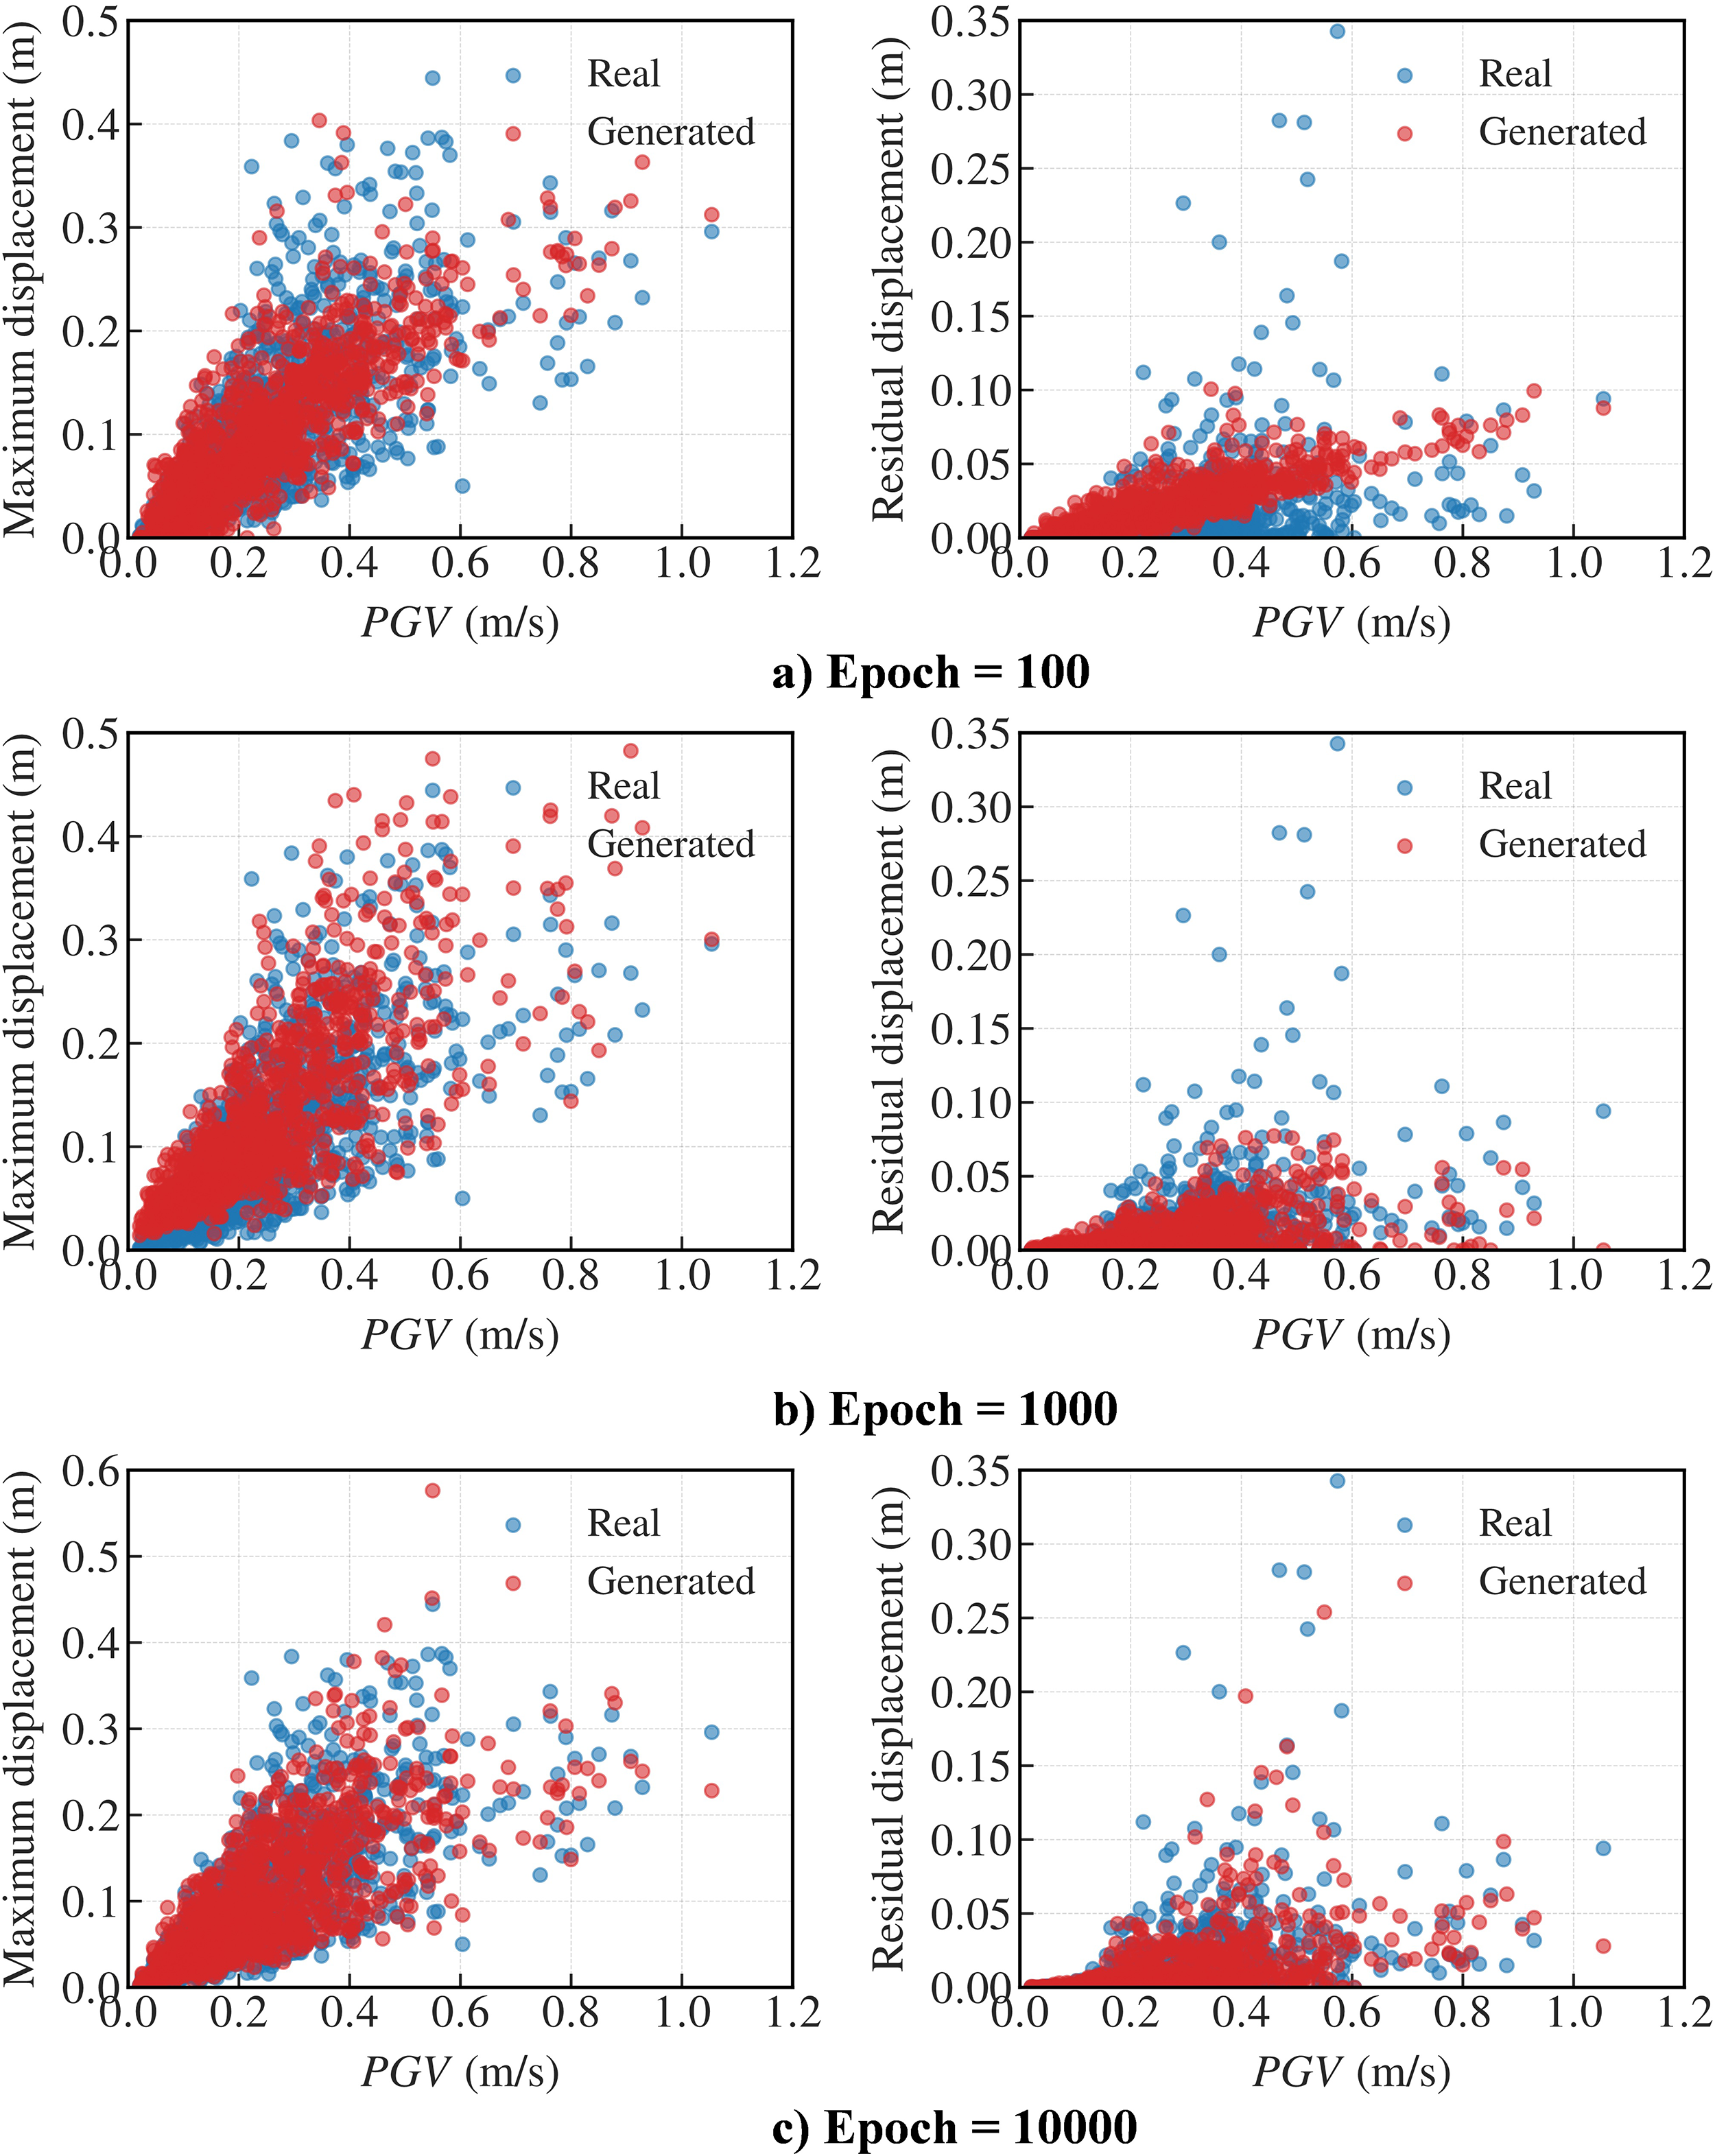
Scatter plots of generated versus real EDPs (left: maximum displacement; right: residual displacement) with respect to PGV. (a) Results at initial training epoch = 100; (b) results at final training epoch = 1000; and (c) results at final training epoch = 10,000.
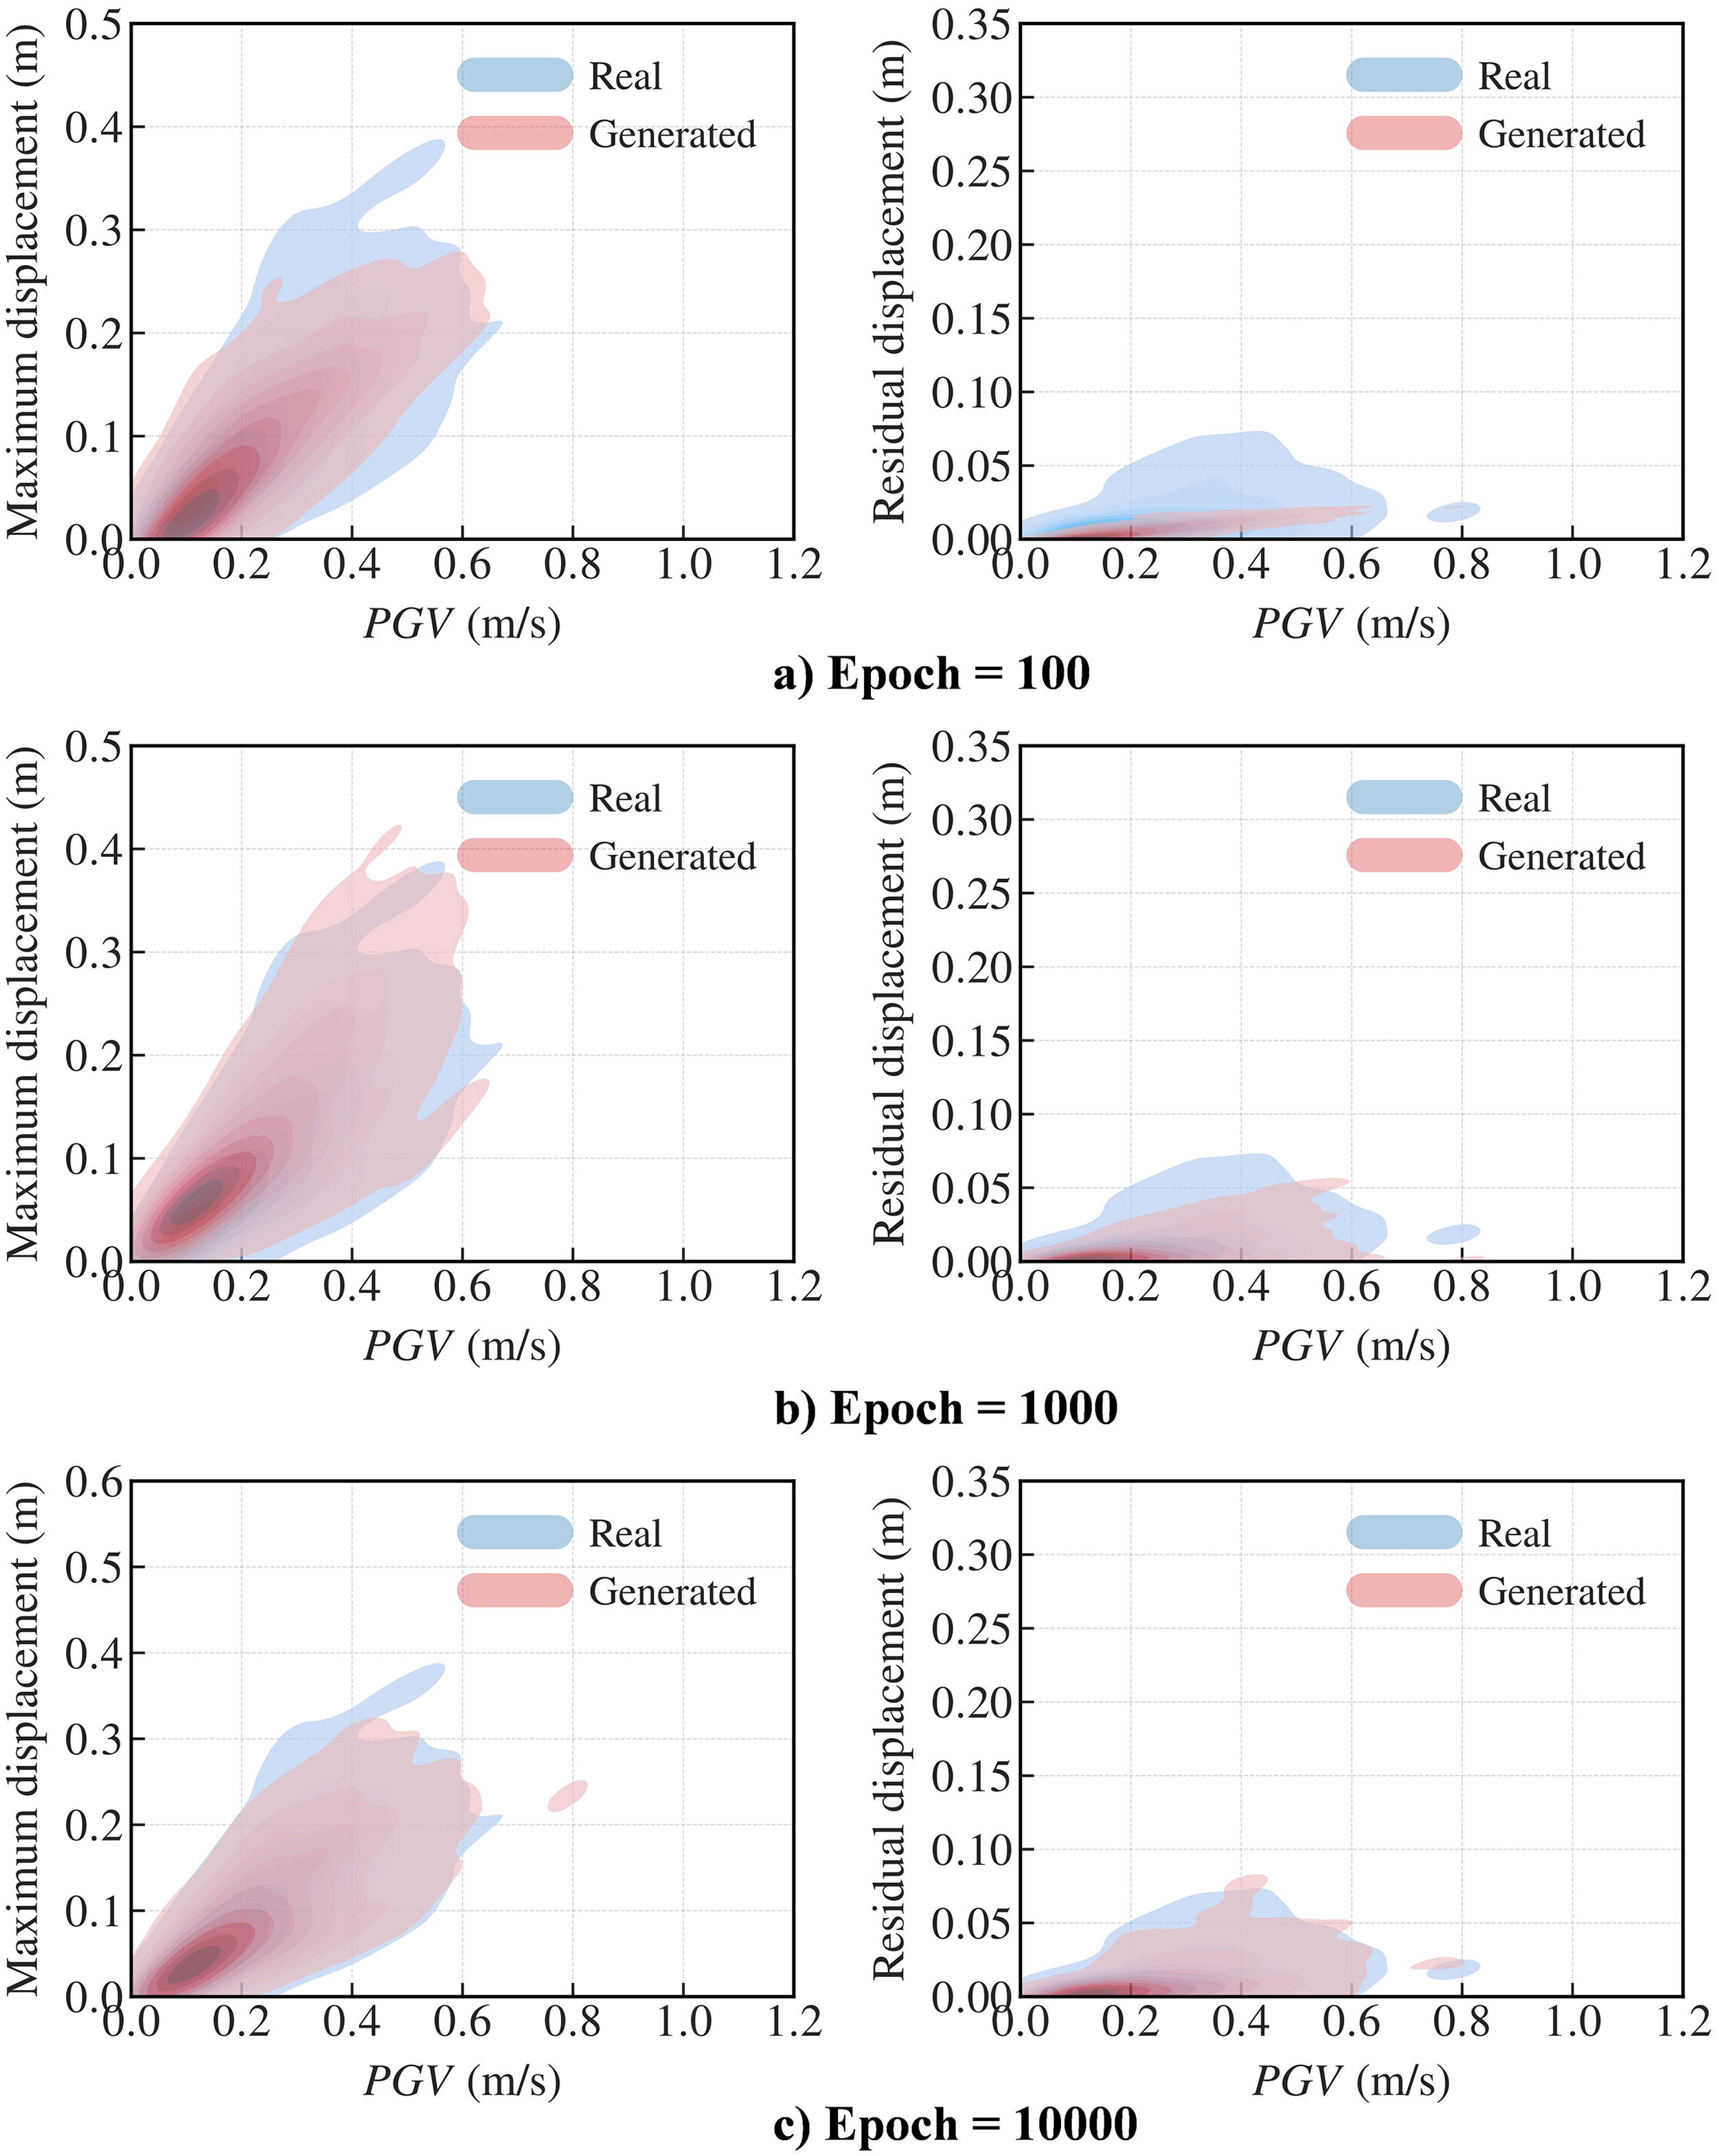
Joint probability density distributions of generated versus real EDPs (left: maximum displacement; right: residual displacement) with respect to PGV. (a) Results at initial training epoch = 100; (b) results at final training epoch = 1000; and (c): results at final training epoch = 10,000.
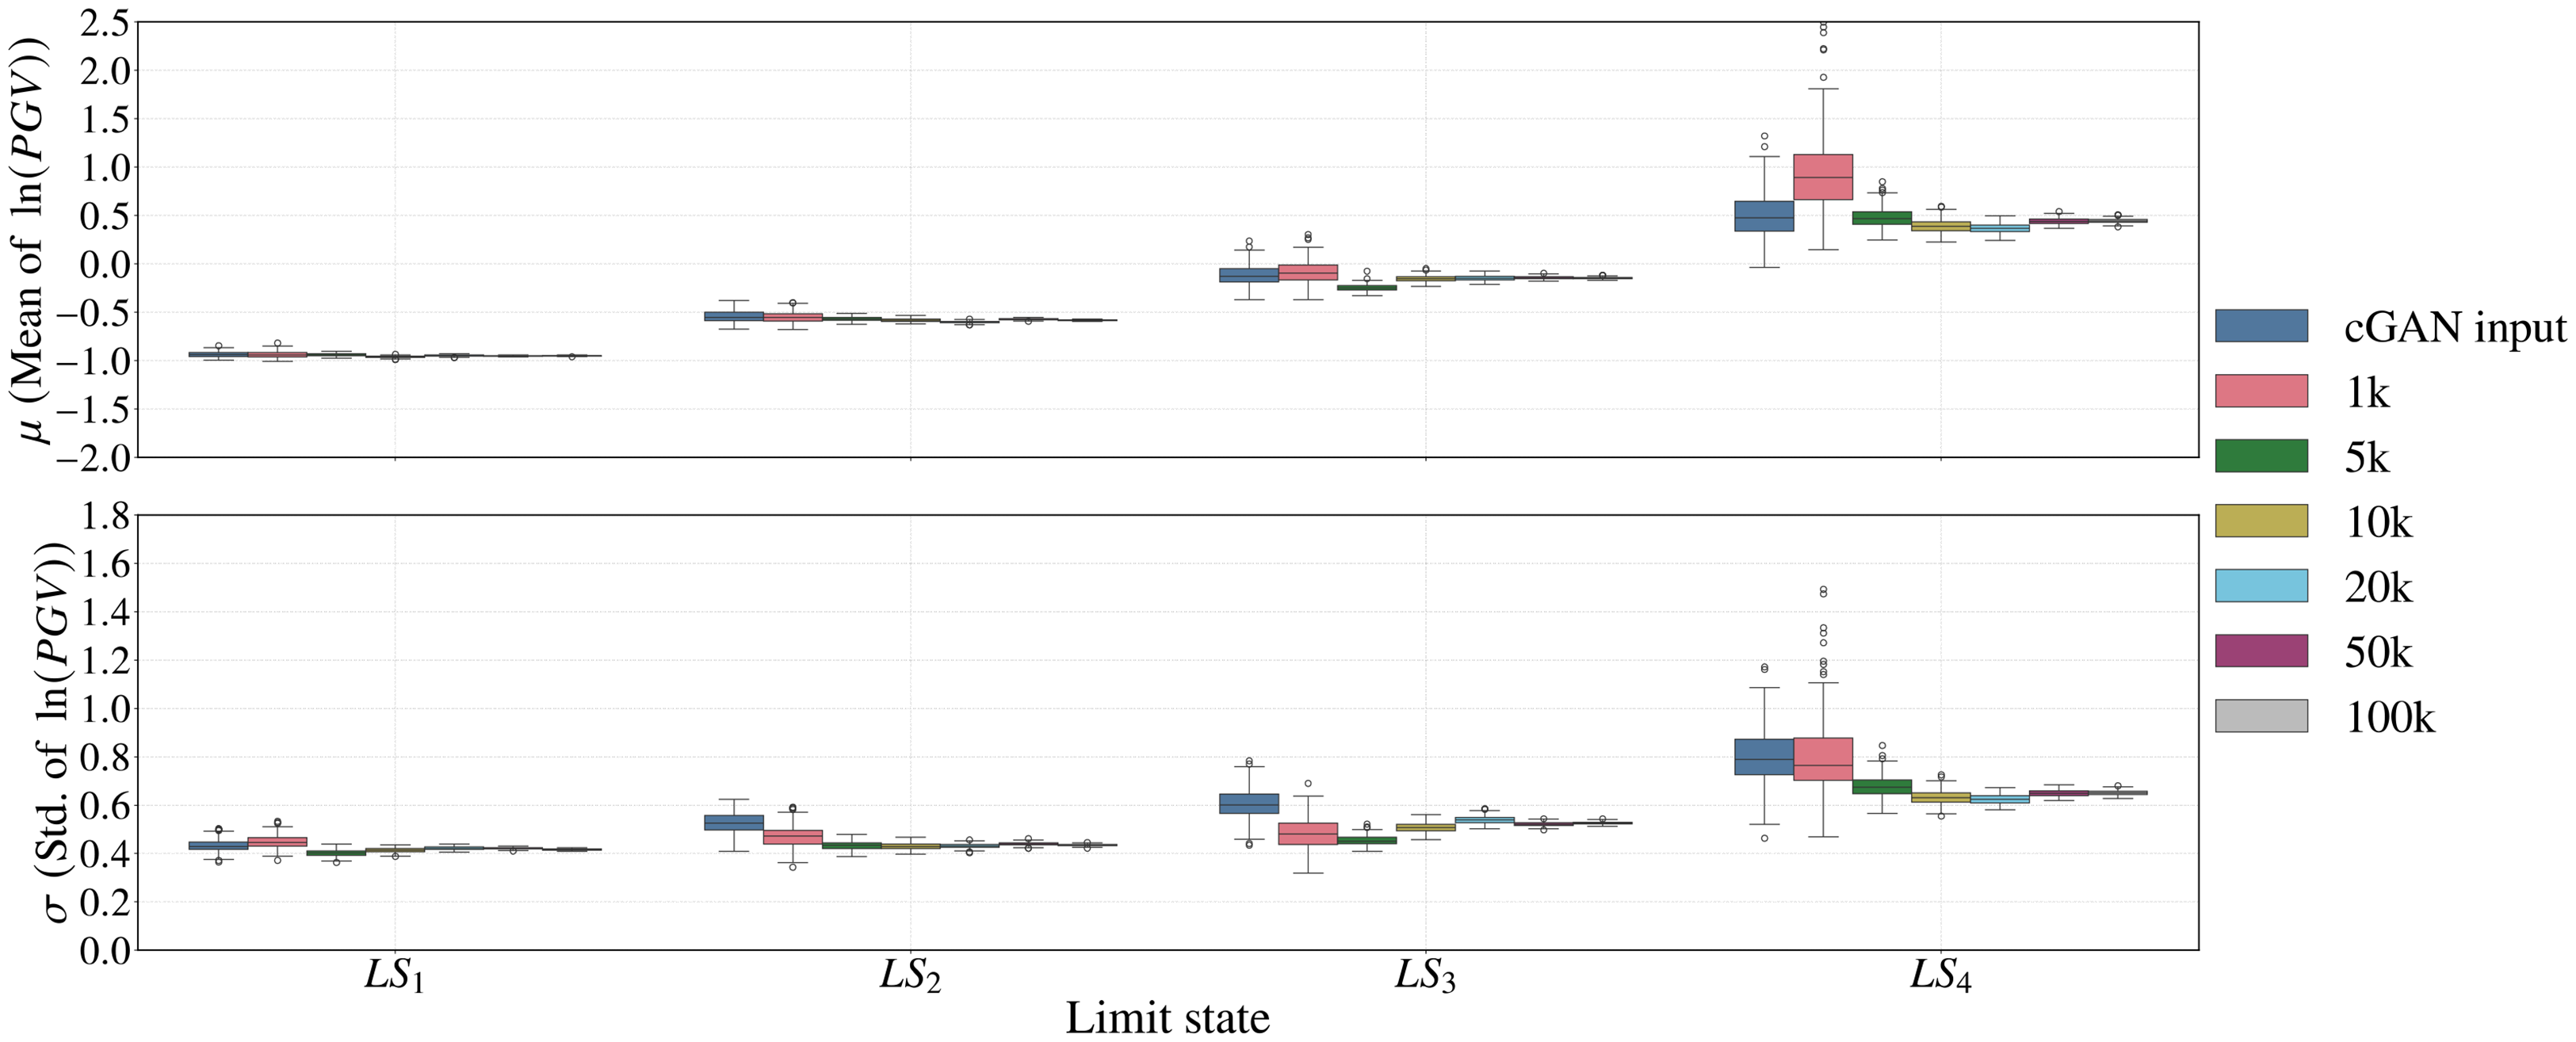
As shown in Figure 16, the bootstrap-derived
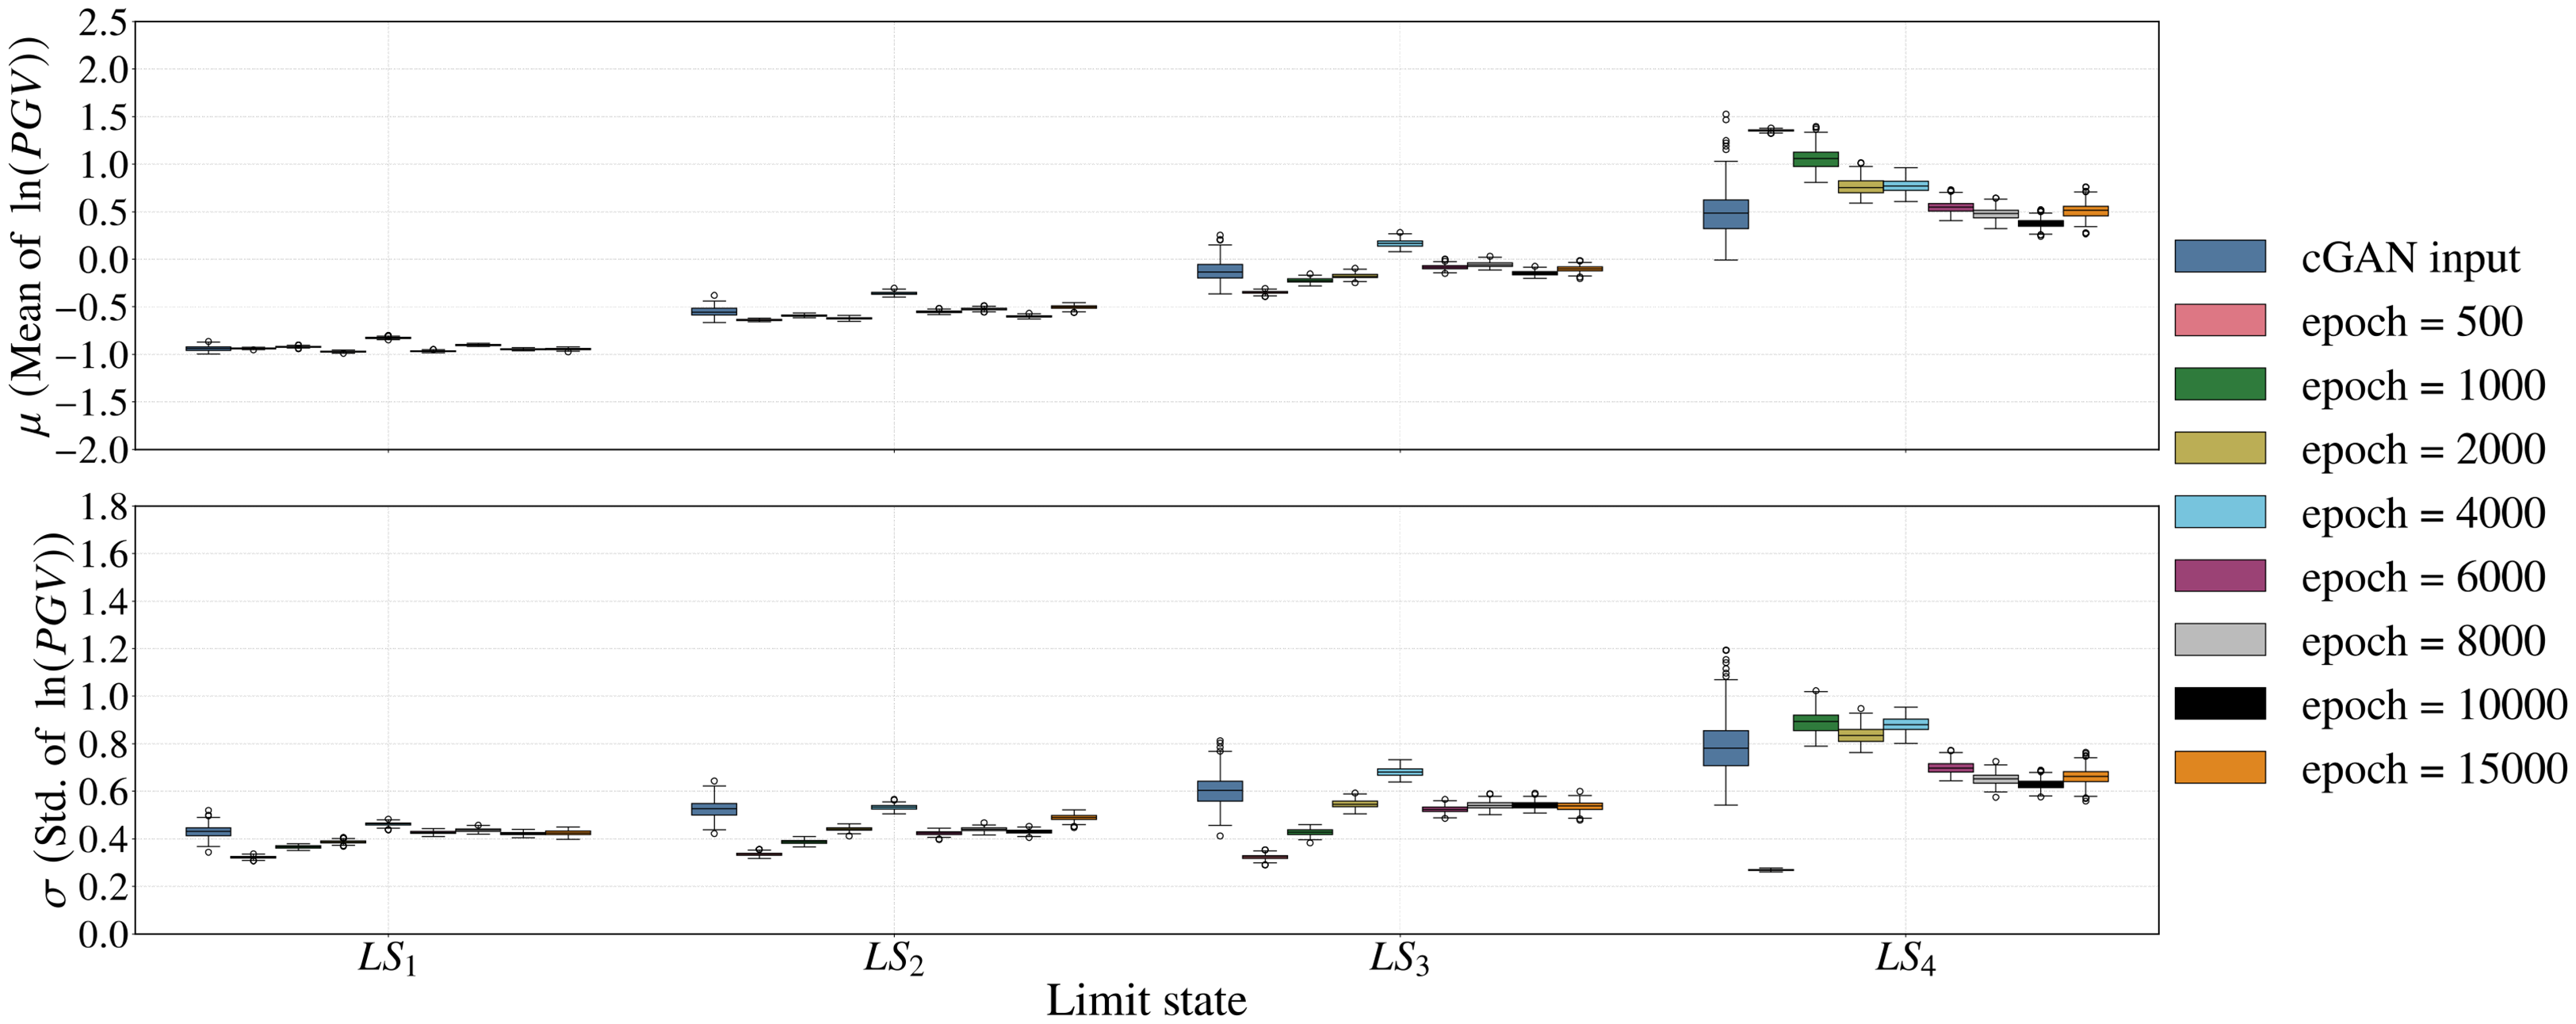
Bootstrap analysis of the mean
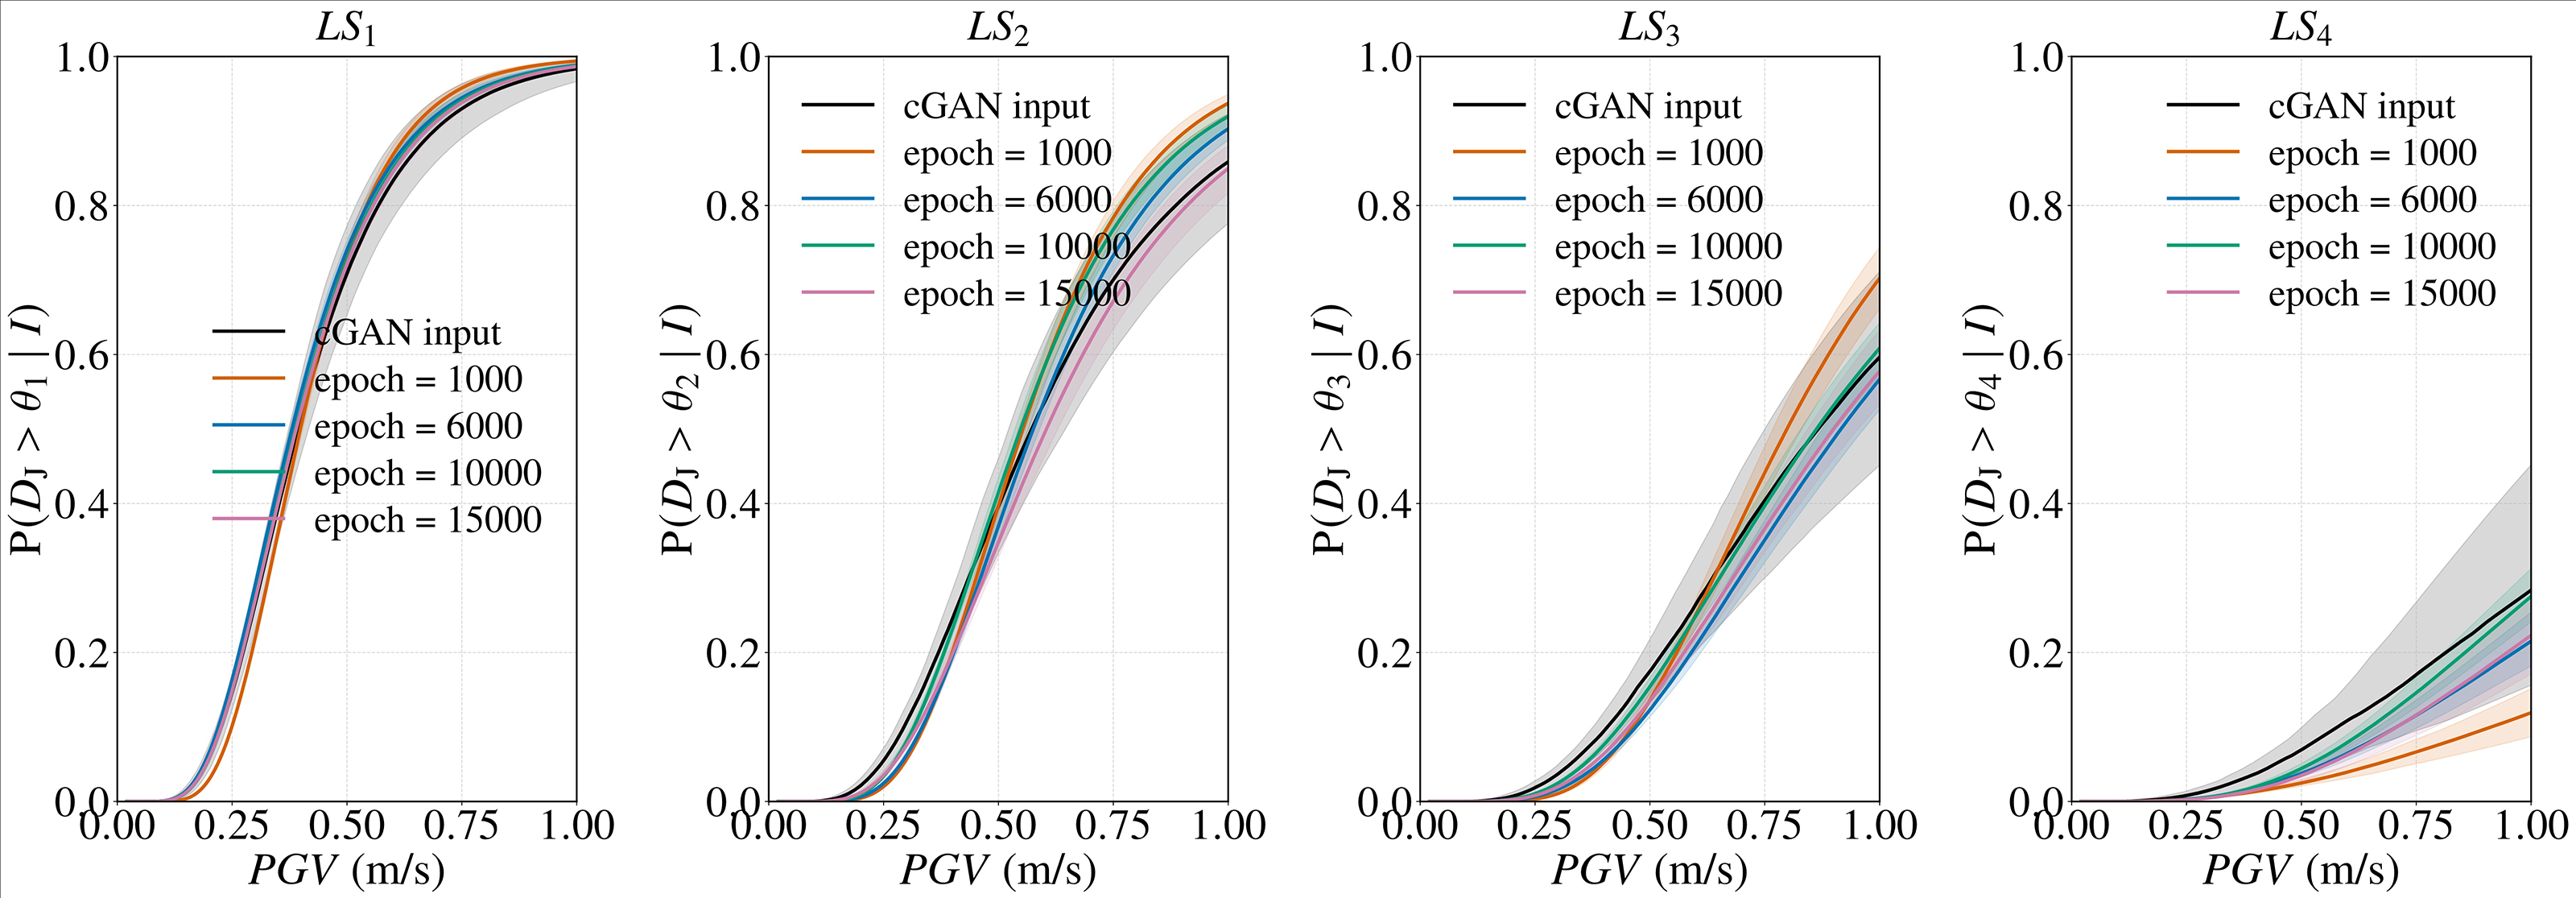
Fragility curves with 95% confidence intervals for different cGAN-generated epochs (LS1 ∼ LS4).
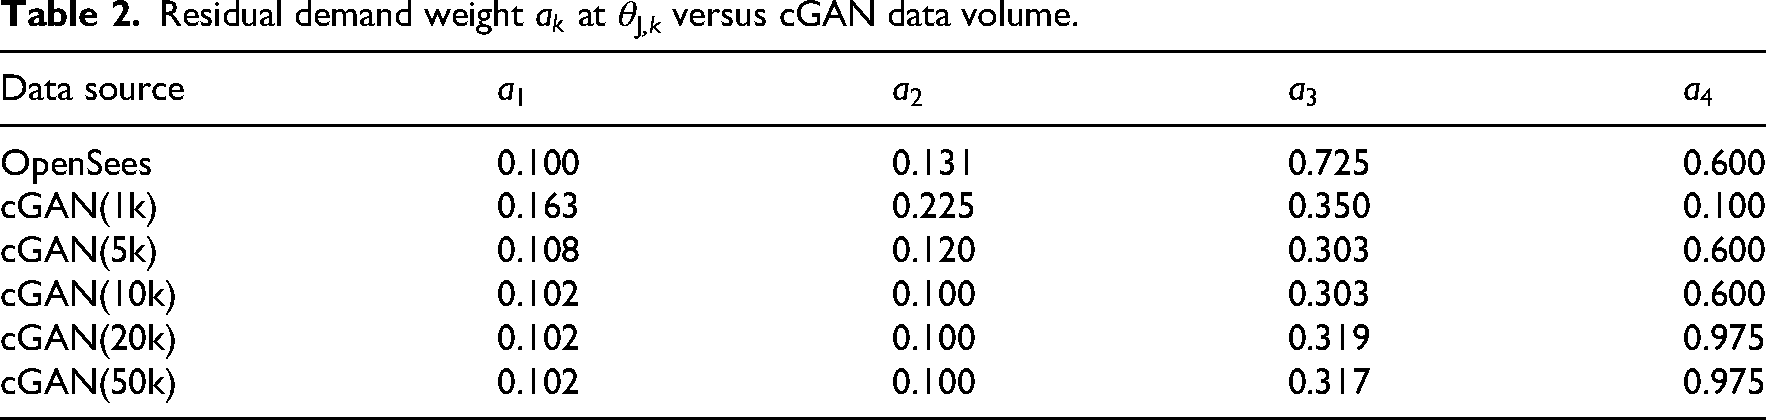
The evolution of the residual-demand weighting factor
Residual demand weight
Optimal θJ,k thresholds of DJ versus cGAN data volume.
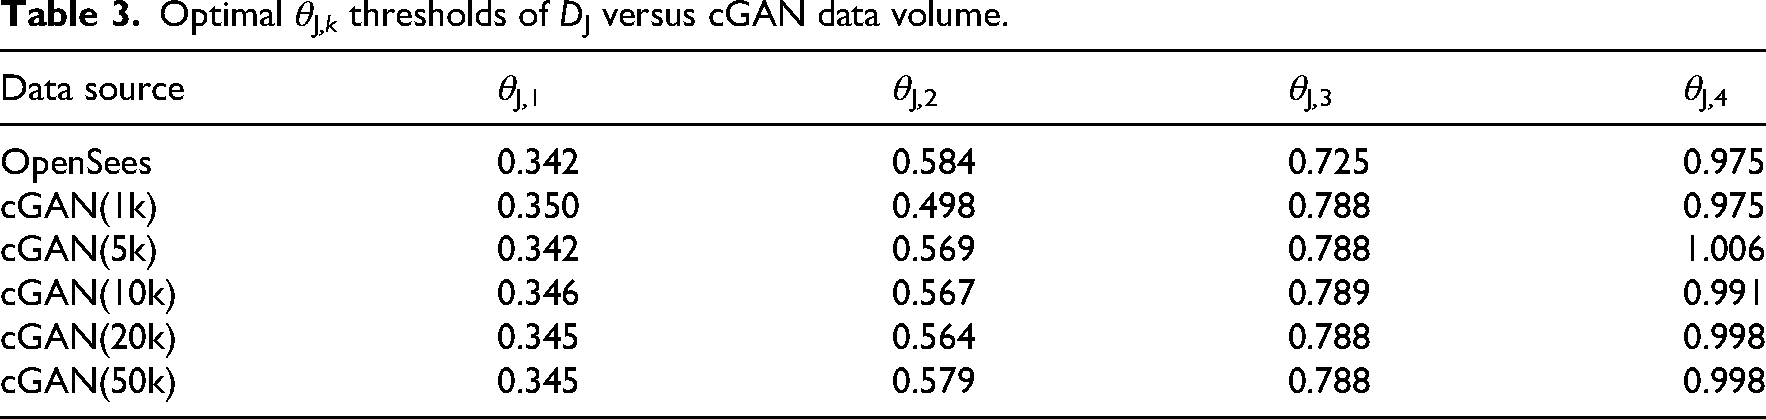
The influence of cGAN-generated sample volume on fragility estimation is shown in Figures 18 and 19. As the generated IM-EDP sample size increases from 1k to 50k, the fragility curves become close to the results from input data and their 95% confidence intervals shrink, indicating reduced statistical uncertainty and more stable estimates. Although the narrower confidence intervals observed with larger synthetic datasets are primarily a result of increased sample size, this does not undermine the value of the cGAN-based data expansion. The key advantage lies in the model's ability to reproduce the underlying joint distribution of seismic IM-EDP relationships, thereby enabling more statistically stable and physically consistent fragility estimation under data-scarce conditions. Figures 18 and 19 show that with a small generated sample (1k), fragility curves deviate substantially from the input-data-based results. Increasing the sample size to 50k leads to convergence of
Bootstrap analysis of the mean
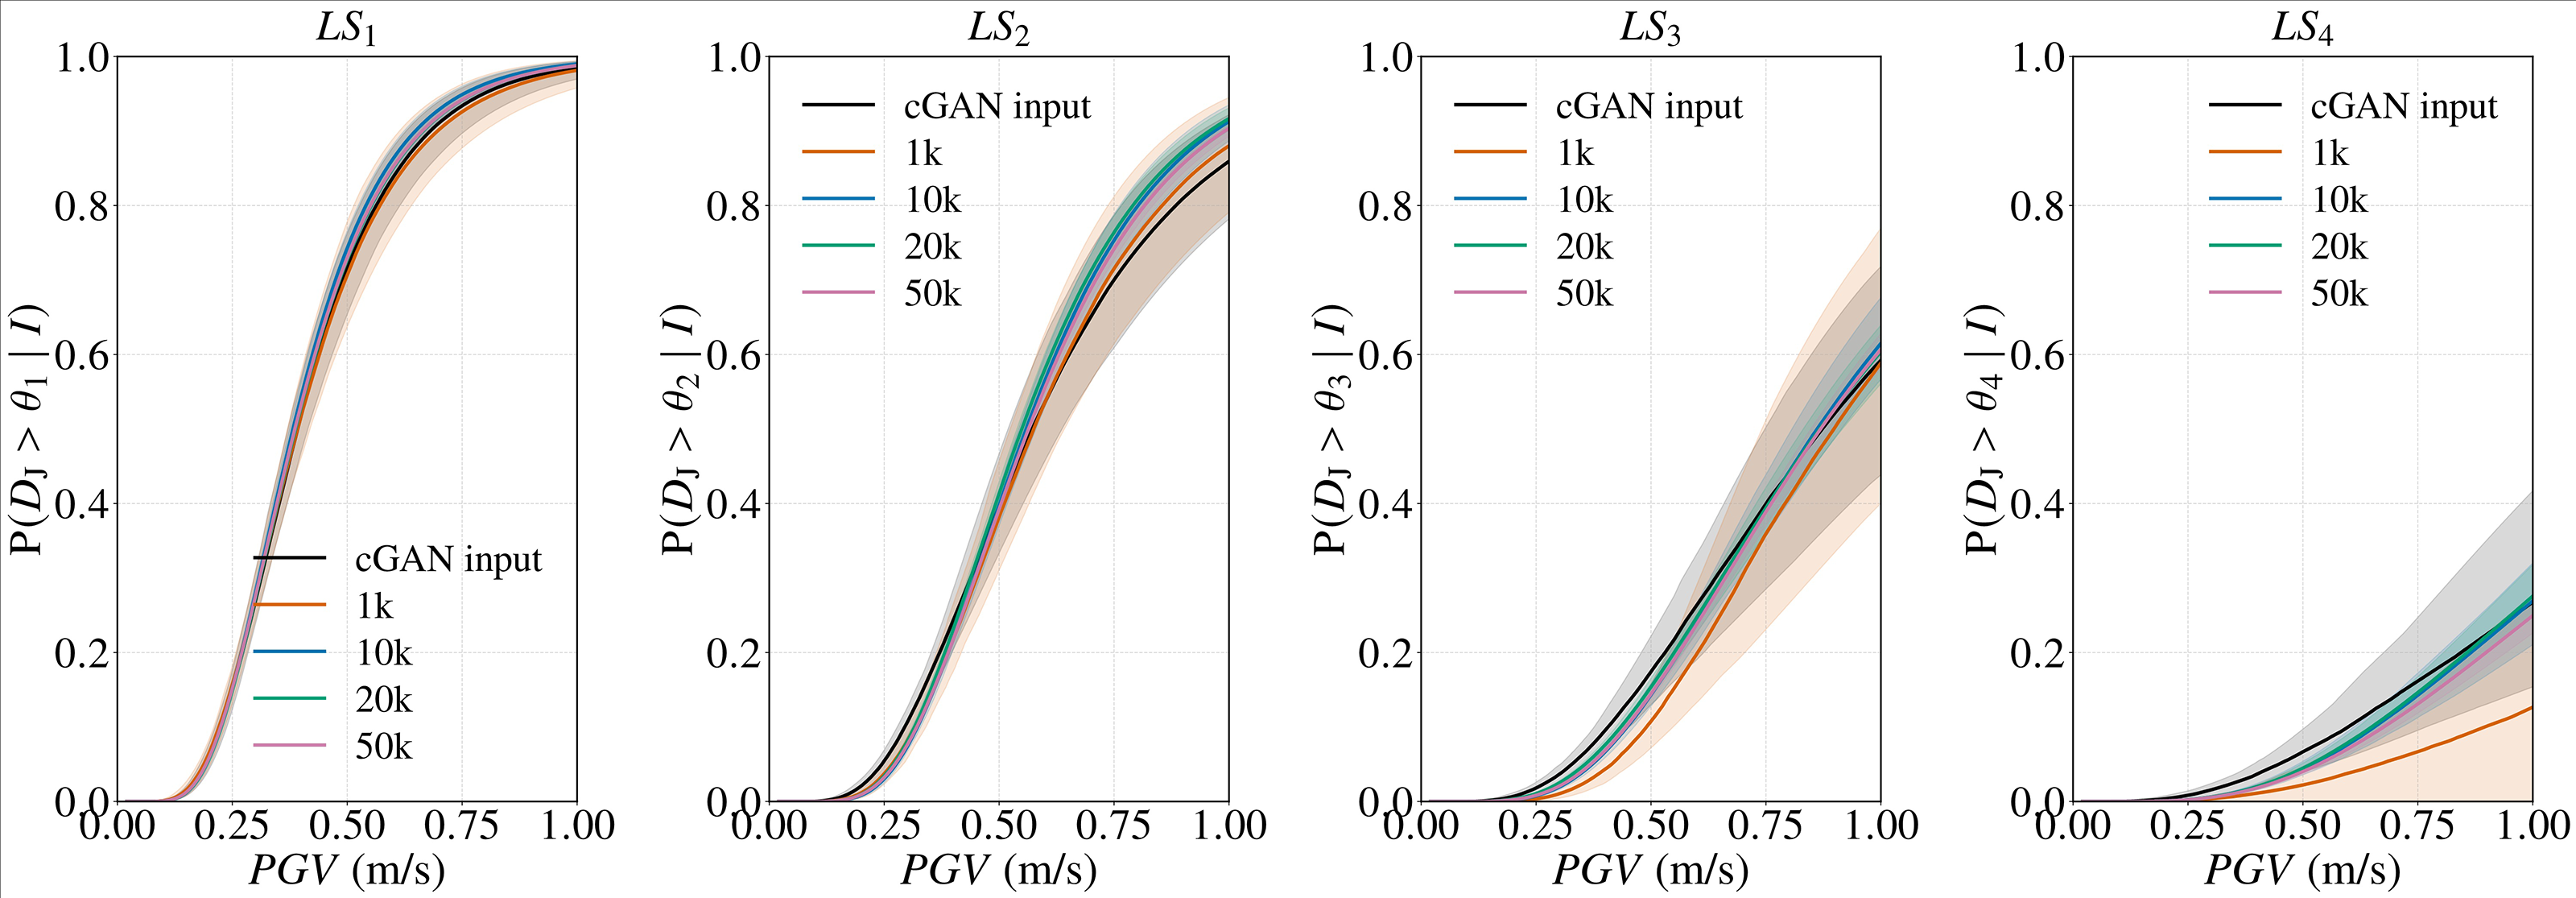
Fragility curves with 95% confidence intervals for different cGAN-generated data volumes (LS1 ∼ LS4).
Figure 20 compares the fragility curves derived from the OpenSees simulation dataset with those obtained from the cGAN-generated dataset. For LS1 ∼ LS3, the median exceedance probabilities are in close agreement, indicating that the cGAN preserves the central fragility behavior implied by the simulation data.
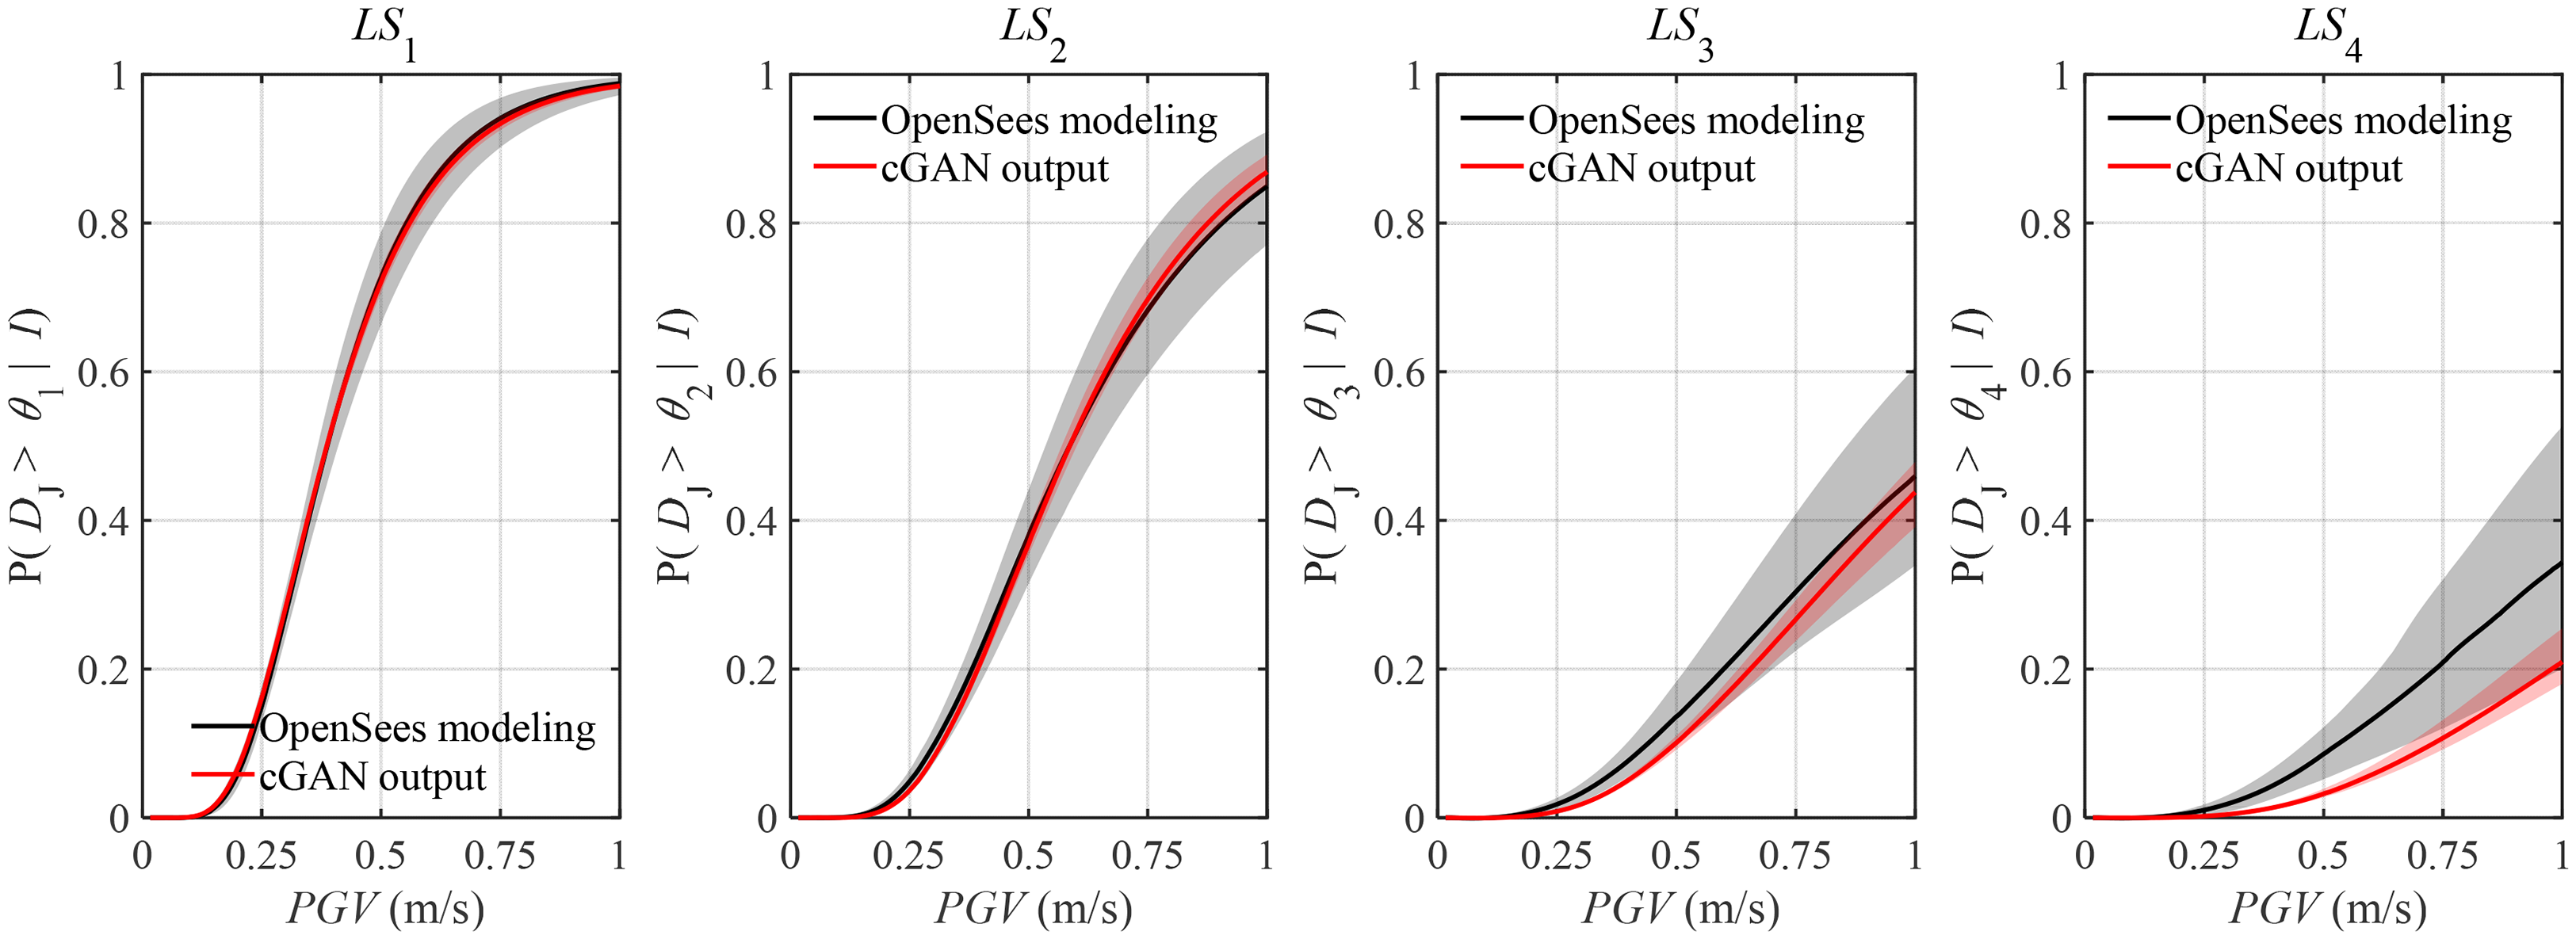
Fragility curves with 95% confidence intervals based on the proposed DJ for LS1 ∼ LS4: comparison between OpenSees modeling and cGAN training. (with lrG =
In the highest damage state (LS4), the cGAN-based fragility curve is observed to be lower than that obtained from the OpenSees dataset. This difference reflects the nature of the underlying estimates. The OpenSees-based fragility curve is derived from a finite set of simulations and, in the severe-damage range, is governed by a limited number of extreme-response samples, making the tail estimate sensitive to sampling variability.
In contrast, the cGAN is trained to reproduce the joint IM-EDP distribution under fragility constraints. During training, the discriminator evaluates the generated samples against an independent set of IM-EDP probabilistic results obtained from ground-motion-based simulations, which serve as a statistical reference for distributional consistency. This reference is not used in constructing the OpenSees fragility curves in Figure 20, but is incorporated through the adversarial training process.
The resulting LS4 behavior therefore reflects a distribution-level reconstruction of the sparse tail informed by both the original simulation data and the independent statistical reference, rather than direct inheritance of fluctuations associated with limited samples. From an engineering perspective, this leads to a more stable characterization of extreme-damage probabilities for fragility-based assessment and decision-making. The role of the cGAN is therefore not to match simulation results pointwise, but to provide a more robust representation of exceedance behavior under limited-data conditions.
Figure 21 further compares DJ-based fragility curves with those obtained from the conventional “OR” and “AND” rules applied separately to MD and RD. The DJ curves consistently fall between the two extremes, reducing the over-conservatism of the “OR” rule and the under-conservatism of the “AND” rule. The weighted-sum formulation successfully integrates peak and residual damage effects, resulting in a single, physically interpretable index that is statistically reliable for seismic damage assessment.
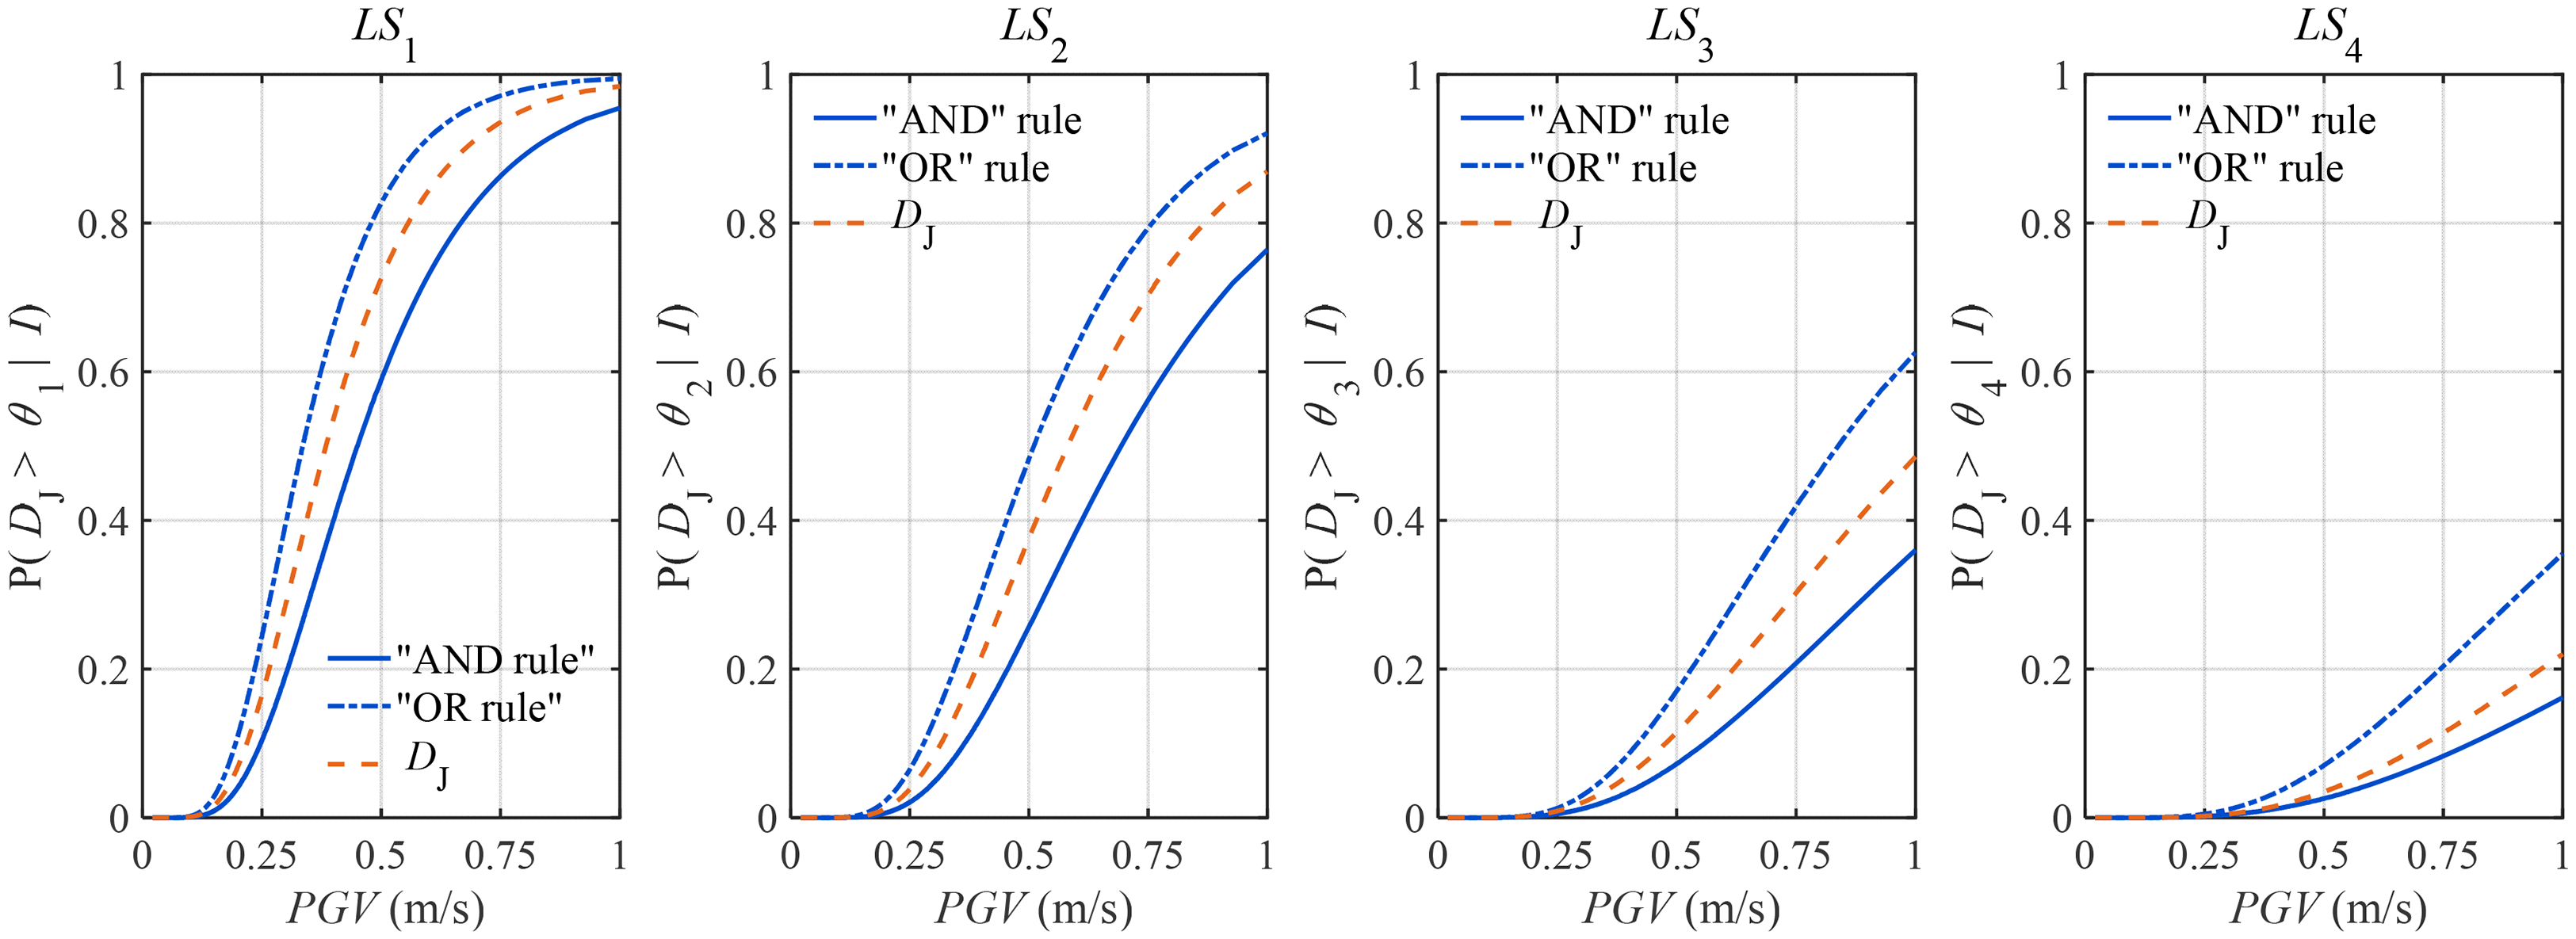
Comparing fragility curves based on the proposed DJ with exceedance probabilities calculated by “OR” and “and” rules for LS1 ∼ LS4.
Conclusions
This study develops a unified damage index DJ assisted with a fragility-informed cGAN model for seismic damage assessment of reinforced-concrete columns of bridges. The proposed DJ simultaneously captures both peak damage and post-earthquake responses by MD-based and RD-based damage indexes into a single metric. To address data scarcity and improve fragility reliability, a cGAN model incorporating a fragility-loss penalty is introduced for statistic-consistent data augmentation. The major conclusions are drawn as follows:
A probabilistic formulation is established to unify MD-based and RD-based damage index through a weighted joint exceedance rule that balances peak damage and postearthquake functionality considerations. A fragility-equivalent DJ with the probabilistic formulation is then achieved via a MATLAB-based optimization procedure, which determines the residual-demand weights A fragility-informed cGAN is developed to augment IM-EDP data under limited-data conditions within a probabilistically constrained framework. The model integrates adversarial, physics-based, and fragility-consistency loss terms, enabling the generated samples to preserve exceedance behavior across limit states. Compared with fragility estimation based solely on a finite set of OpenSees simulations, this formulation reconstructs the joint IM-EDP behavior at the distribution level, reducing sensitivity to individual extreme-response observations and providing a more stable basis for fragility estimation, particularly in the sparsely sampled severe-damage regime. Sensitivity analysis reveals that the generator learning rate (lrG) predominantly governs training stability, whereas discriminator rate, noise dimension, and batch size have minor effects. With the optimized lrG = The inclusion of the independent IM-EDP dataset obtained from simulations under recorded ground motions introduces an external probabilistic reference into the training process, enabling distribution-level constraint beyond the original simulation data. This design mitigates the closed-loop nature of single-dataset training and supports a more stable reconstruction of exceedance behavior, particularly in sparsely sampled high-damage regimes. The cGAN-based augmentation improves the conditioning of fragility estimation by increasing the effective sample size in underrepresented regions of the response space. With 10k or more generated samples, a reduction in dispersion of ln (PGV) and a narrowing of fragility confidence intervals are observed, particularly for higher damage states (LS3 ∼ LS4). These effects reflect a more stable representation of exceedance behavior at the distribution level, supporting more reliable fragility-based decision-making under limited-data conditions, where estimates from sparse simulation samples may be highly variable. As the volume of augmented data increases, the residual-demand weights The proposed framework provides a general approach for constructing a unified damage index based on probabilistic equivalence to joint response behavior. The calibrated parameters, including weighting factors and limit-state thresholds, depend on the structural model, response measures, and ground-motion dataset, and should be re-identified for other bridge-column configurations. Extending the framework to a wider range of structural systems and hazard conditions remains an important direction for future work.
Footnotes
CRediT authorship contribution statement
JL: writing—original draft, validation, software, methodology, formal analysis, and data curation. JF: writing—review and editing, validation, and resources. LS: writing—review and editing, supervision, project administration, methodology, funding acquisition, and conceptualization.
Funding
The authors disclosed receipt of the following financial support for the research, authorship, and/or publication of this article: This work was supported by the Engineering Partners International, LLC, (Grant Number PC13803).
Declaration of conflicting interests
The authors declared no potential conflicts of interest with respect to the research, authorship, and/or publication of this article.
Data availability statement
All data generated or used during the study are available from the corresponding author by reasonable request.