






Abstract
Given the challenging conditions of high-alpine and high-altitude metal mining, complex factors affecting rock mass quality, and the intricate mechanisms of slope instability, this study focuses on the tuff from the high-alpine and high-altitude region of China. The deformation, strength, and failure characteristics of the tuff specimen were investigated through uniaxial compression tests, stress–seepage coupling triaxial compression tests under low-temperature curing conditions and nuclear magnetic resonance analysis. A damage constitutive model for the tuff specimen considering curing temperature was established. Results show that low temperatures significantly promote the development and interconnection of pores and fissures within the tuff specimen. Low-temperature and stress–seepage coupling increase the number of pores and fissures and drive their growth toward larger sizes. The tuff specimen undergoes compaction, elastic deformation, plastic yielding, and failure under triaxial compression. As temperature decreases, failure transitions from simple shear to combined shear-tensile failure, with extended compaction and shortened plastic yielding phases, leading to enhanced brittleness. A low temperature–load coupling damage variable was introduced based on nuclear magnetic resonance porosity and the Weibull distribution function, effectively modeling the stress–strain relationship and strength characteristics of the tuff specimen under low-temperature and stress–seepage coupling, with a good fit between experimental and theoretical.
Keywords
Introduction
Natural rock masses contain inherent joints, pores, and cracks. These structural defects, influenced by water seepage, can degrade the mechanical properties of the rock (Ping et al., 2024; Xu et al., 2024). Within actual engineering scenarios, the deterioration mechanisms of saturated rock masses are governed by complex interactions among the stress, seepage, and temperature fields. Investigating these moisture-induced effects, Li et al. (2023) utilized Split Hopkinson Pressure Bar experiments to compare dry and saturated sandstone specimens. Their findings demonstrated that water saturation significantly exacerbates strength degradation, particularly as rock porosity increases. Furthermore, by integrating specific water saturation levels into their sample preparation protocols, Jia et al. (2015), alongside Xiong et al. (2023), executed both uniaxial and dynamic tensile tests. Their collective work systematically delineates how varying moisture contents dictate the deformational behavior of rocks. Tan et al. (2022) conducted water–hydro coupling experiments on saturated sandstone, showing that the peak deviatoric stress, corresponding axial strain, and deformation modulus of fully saturated sandstone decrease with increasing pore water pressure and increase with confining pressure. The Poisson's ratio and failure angle increase with increasing pore water pressure. Ma et al. (2023) performed mechanical experiments on sandstone with varying dry-wet cycling counts, elucidating the damage evolution pattern of sandstone at different stress loading stages.
The impact of low-temperature and stress–seepage coupling on rock slopes is primarily manifested in the damage and deterioration of rock masses in cold regions due to frost heave effects from fissure water. Li et al. (2024a, 2024b) used a numerical model to simulate the entire process of landslide initiation in a slope with randomly distributed initial cracks under freeze-thaw cycles, revealing that the essence of displacement evolution in cold-region landslides is the generation of new fissures induced by frost heave pressure.
Thermo-Hydro-mechanical (THM) coupling interactions (Liu et al., 2024): To evaluate the engineering implications of such environments, Hong et al. (2021) adapted the GSI value for rock masses in high-altitude cold regions, utilizing a modified Hoek–Brown criterion to characterize the deterioration of open-pit slopes under freeze-thaw cycles. At the micro-structural level, advanced imaging has been crucial for quantifying this damage. Based on CT scan experiments, Feng et al. (2023a, 2023b) established functional correlations linking the frequency of thermal cycling to specific microscopic parameters, namely the pore particle frost heave coefficient and thaw settlement coefficient. Similarly, utilizing CT scanning alongside 3D visualization, Li et al. (2022) revealed that the expansion of freezing pore water initiates and propagates micro-defects, a degradation process significantly amplified in water-saturated granite. To mathematically capture these complex degradation behaviors, extensive research has been directed toward constitutive modeling. Notably, by integrating macroscopic damage variables with the strain equivalence hypothesis and Weibull distribution principles, Li et al. (2024a, 2024b) formulated a robust damage constitutive model specific to sandstone subjected to freeze-thaw weathering. Yang and Jiang (2022) conducted triaxial compression tests on sandstone under the coupled effects of stress and seepage fields. Based on the experimental results, a sandstone damage constitutive model considering seepage effects was developed, revealing the permeability evolution mechanism of freeze-thaw sandstone. Based on experimental results, Yu et al. (2022) introduced statistical damage theory to establish a stress–seepage coupled damage constitutive model for shale. Yun et al. (2024a; 2024b) conducted triaxial compression tests on sandstone and granite with freeze-thaw fractures and established corresponding damage and constitutive models. To systematically evaluate the mechanical deterioration properties of sandstone subjected to the coupled effects of chemical corrosion and freeze-thaw cycles, Liang et al. (2024) conducted comprehensive analyses across macroscopic and microscopic scales. Drawing upon statistical damage theory, they subsequently formulated a specialized damage constitutive model to mathematically capture these degradation behaviors. Based on the ratio of dissipated energy and the principle of minimum energy dissipation, Feng et al. (2024) developed a triaxial compression damage constitutive model for rocks subjected to freeze-thaw cycles. Shi et al. (2024) formulated a rock damage creep constitutive model integrating the coupled effects of freeze-thaw cycles and mechanical loading.
In summary, while previous studies have extensively investigated the mechanical properties of rocks under hydromechanical (HM) coupling or temperature variations independently, research on their synergistic effects remains limited. Substantial initial microstructural damage is inherently induced within rock masses in high-altitude and frigid engineering contexts, primarily driven by severe low-temperature exposure either preceding or concurrent with excavation activities. Subsequently, these damaged rock masses are subjected to the coupled effects of high in-situ stress and groundwater seepage. However, the sequential degradation mechanism—from initial low-temperature damage to subsequent stress–seepage coupled failure—is poorly understood. Furthermore, existing damage constitutive models often treat thermal and HM damage as simple superpositions, struggling to reasonably capture the progressive deterioration of porous rocks under such complex stress paths.
To address these limitations, this study focuses on tuff, a typical porous volcanic rock widely distributed in the Tibetan Plateau, which exhibits high sensitivity to extreme temperatures and seepage pressures due to its inherent micro-defect structure. Nuclear magnetic resonance (NMR) testing is first utilized to quantify the initial microstructural variations induced by a 48-h extreme low-temperature treatment. Subsequently, triaxial compression tests are conducted under varying confining and seepage pressures to elucidate how this initial low-temperature damage amplifies the subsequent macroscopic mechanical degradation. Based on the experimental observations and the Weibull distribution function, a modified damage constitutive model is proposed. Distinct from conventional empirical models, this model attempts to nest the initial low-temperature damage variable within the evolutionary process of stress–seepage coupled damage.
Ultimately, this work provides two main marginal contributions: From a theoretical perspective, it offers a more realistic analytical framework to characterize the progressive mechanical behavior of porous rocks transitioning from initial thermal degradation to subsequent HM failure. From an applied engineering perspective, the derived mechanical parameters and their evolutionary laws significantly expand the available geomechanical datasets for extreme plateau contexts. Consequently, these findings serve as crucial benchmarks for assessing long-term structural stability and designing effective seepage control measures in deep underground projects within high-alpine regions.
Experimental method
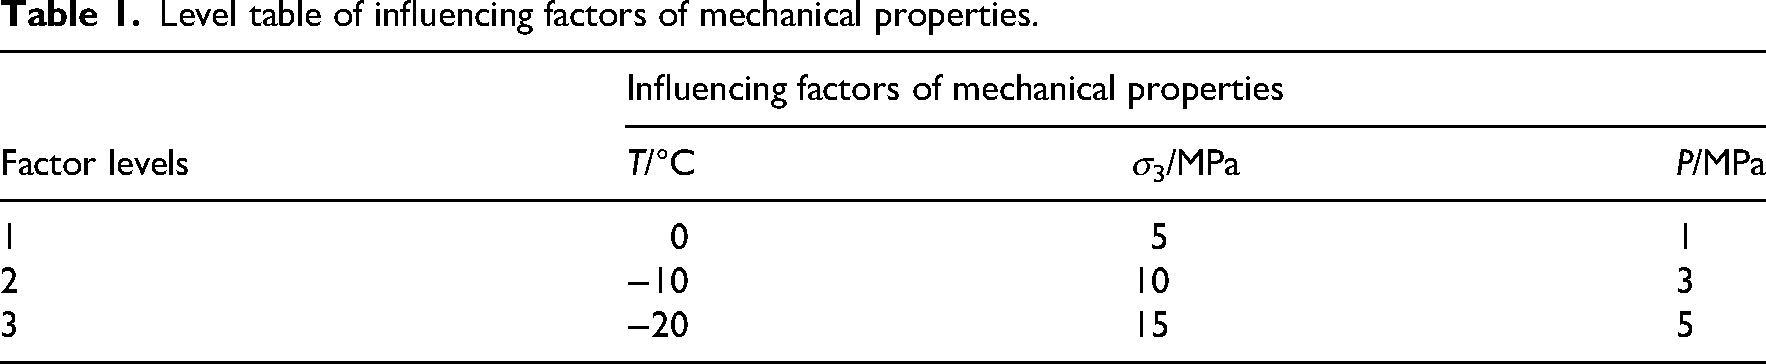
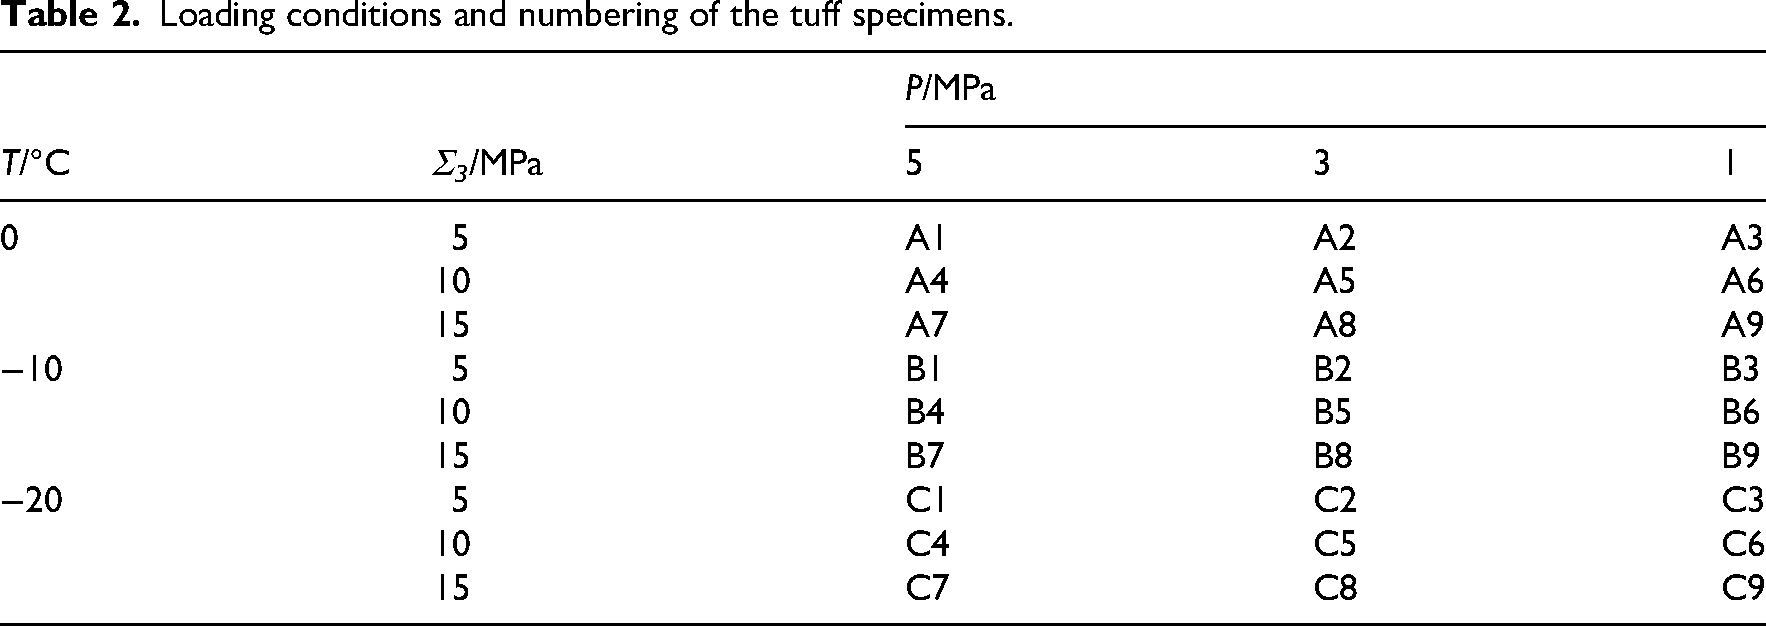
To accurately replicate the in-situ conditions of the mining area—characterized by a minimum slope temperature of −20 °C, a peak stress of 14.87 MPa, and a maximum seepage pressure of 5 MPa—specific testing parameters were established. Consequently, the experimental matrix incorporated temperature (T) gradients of 0 °C, −10 °C, and −20 °C; confining pressures (σ3) of 5, 10, and 15 MPa; and seepage pressures (P) of 1, 3, and 5 MPa. A comprehensive breakdown of these defined factor levels, alongside the corresponding specimen numbers and loading protocols, is detailed in Tables 1 and 2.
Level table of influencing factors of mechanical properties.
Loading conditions and numbering of the tuff specimens.
The tuff specimens were collected from the slope excavation area of the Julong copper mine in Xizang, China. The rock mass in this area exhibits good integrity, with no evident faults, dense joint zones, or groundwater immersion. The mineralogical composition of the tuff was determined using X-ray diffraction analysis, and the results are presented in Figure 1. The specimens are primarily composed of K-feldspar (45%–55%) and calcite (25%–35%), with minor constituents including sodium nitrate (5%–10%). In addition, trace amounts of arsenate minerals are present, with a total content not exceeding 5%. Among these, potassium feldspar and calcite act as the dominant framework minerals, governing the fundamental strength and hardness characteristics of the tuff. Macroscopic observation and stereomicroscopic analysis indicate that the tuff specimens exhibit a grayish-white to light gray coloration, with a massive structure and dense texture. The mineral grains are relatively uniformly distributed, with particle sizes predominantly ranging from 0.05 to 0.2 mm, indicating a fine-grained structure. No obvious macroscopic fractures are observed on the specimen surfaces.
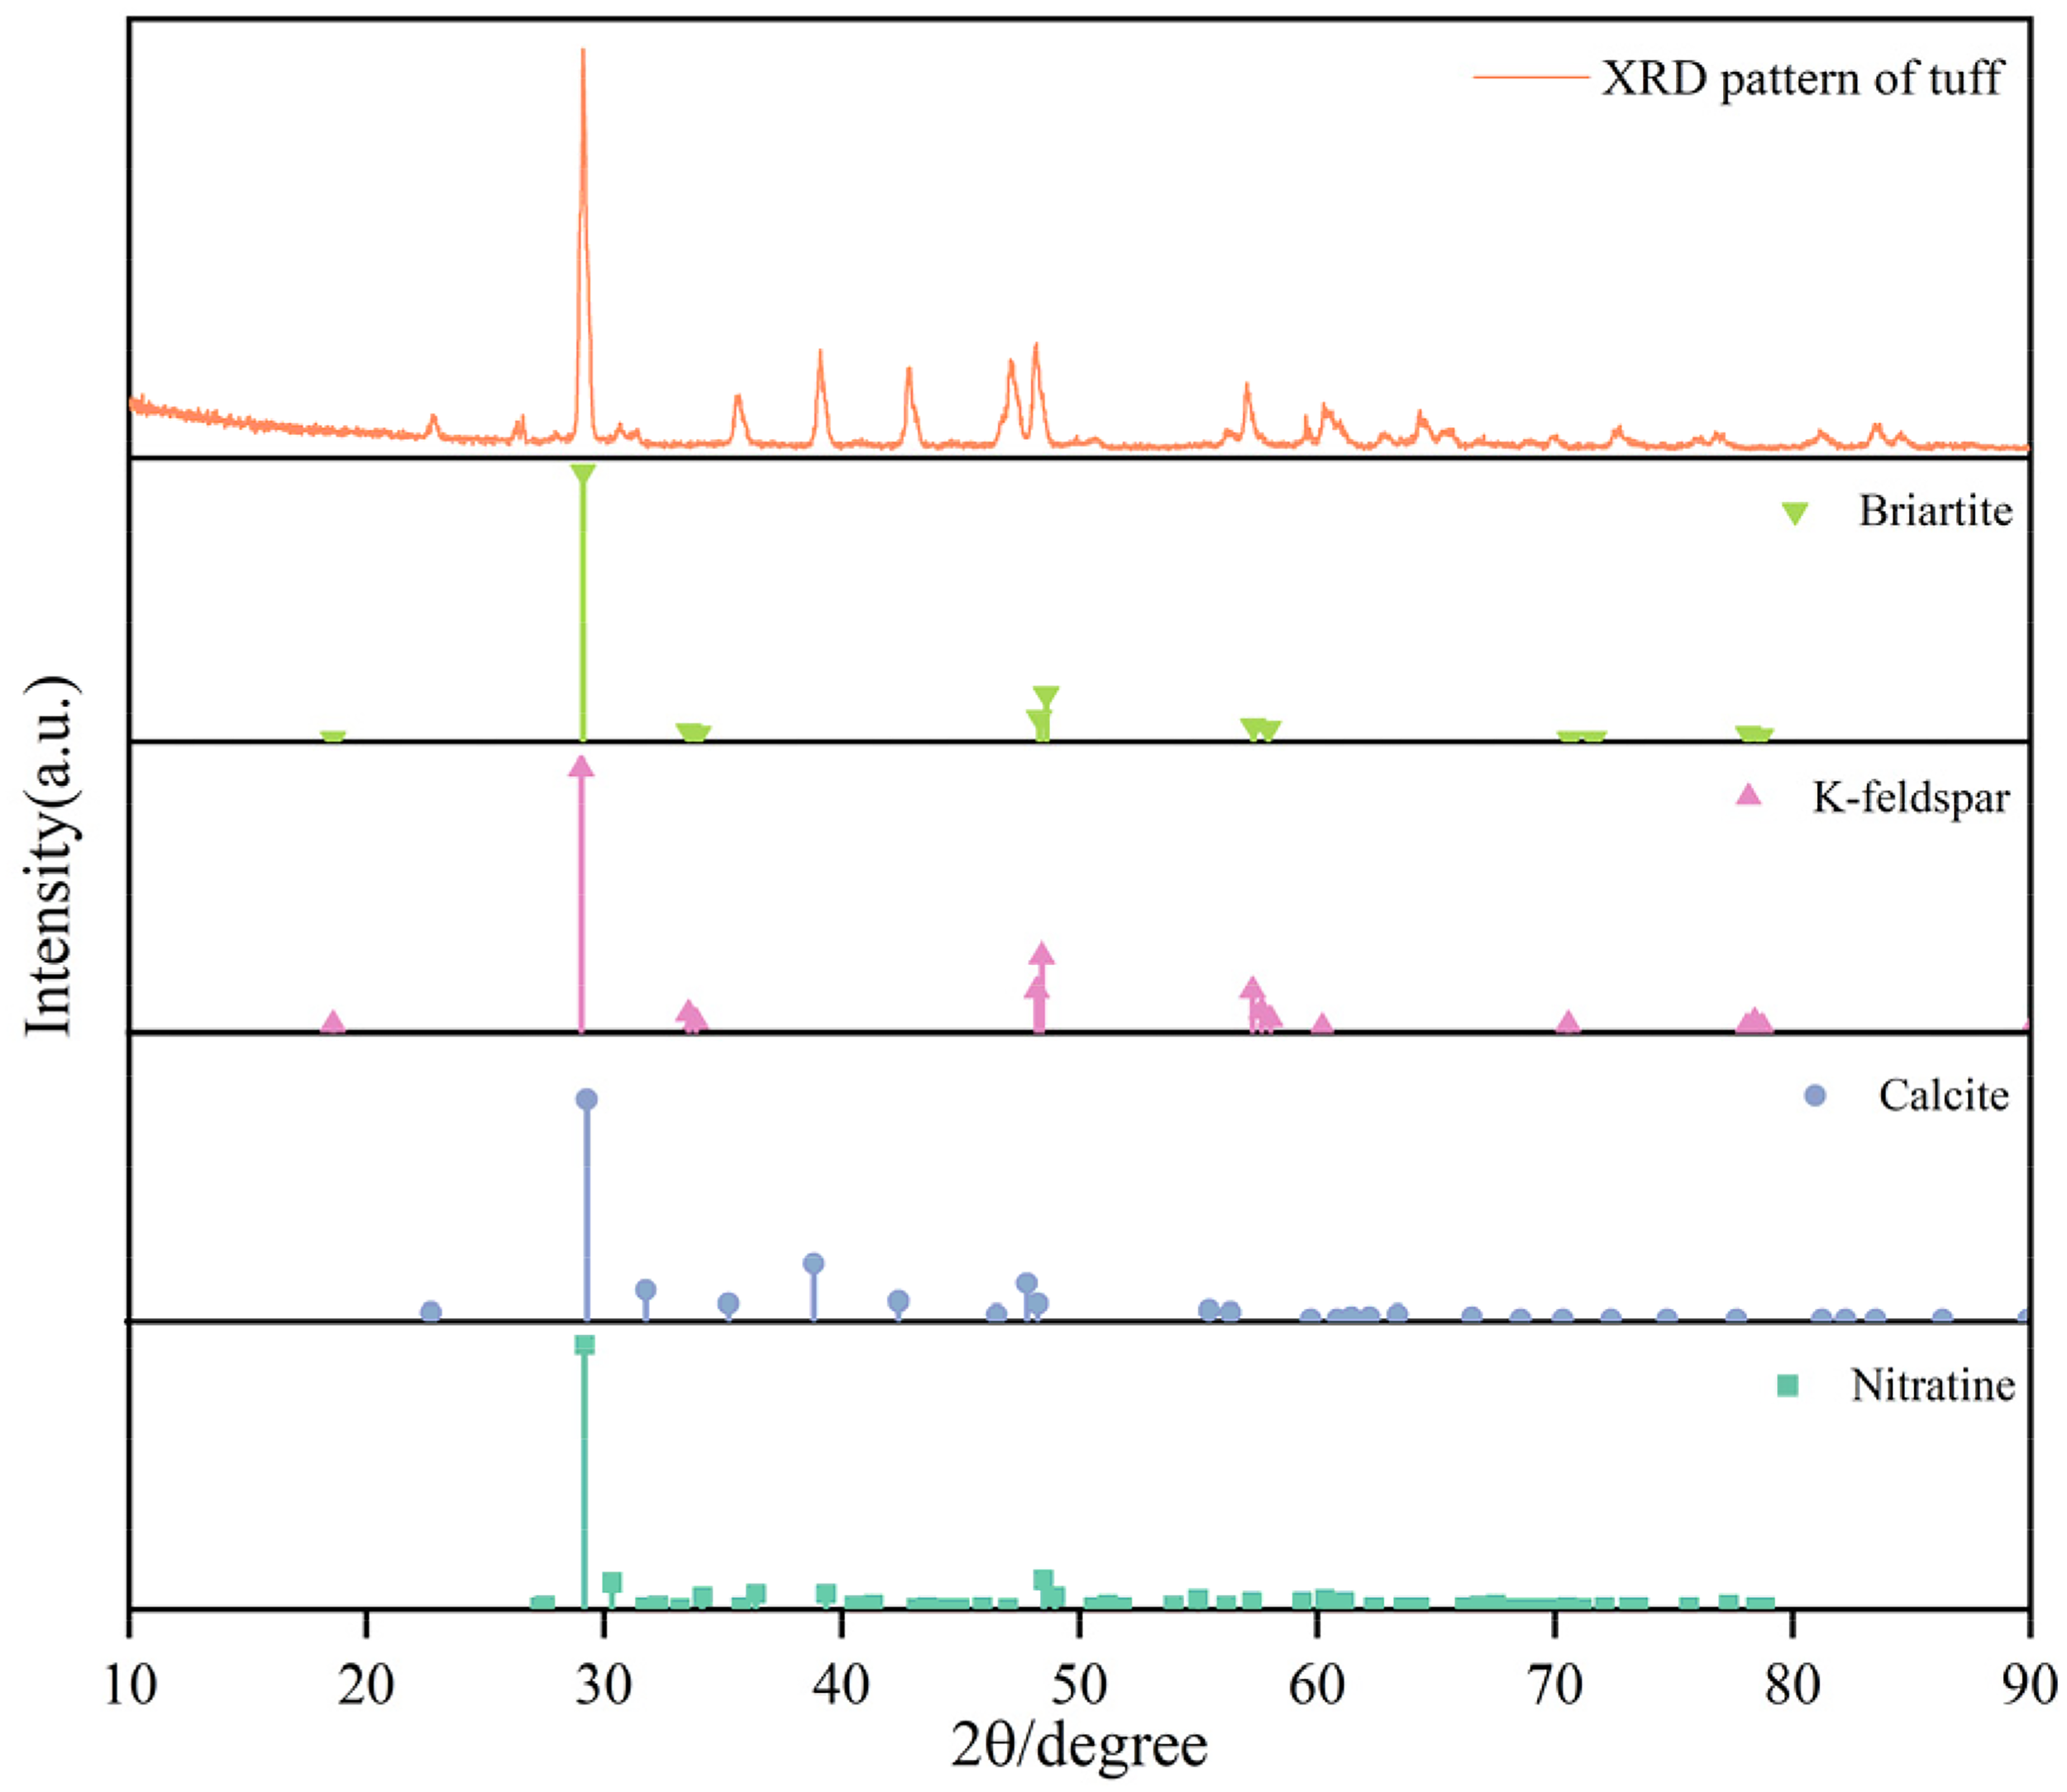
Mineral composition of tuff.
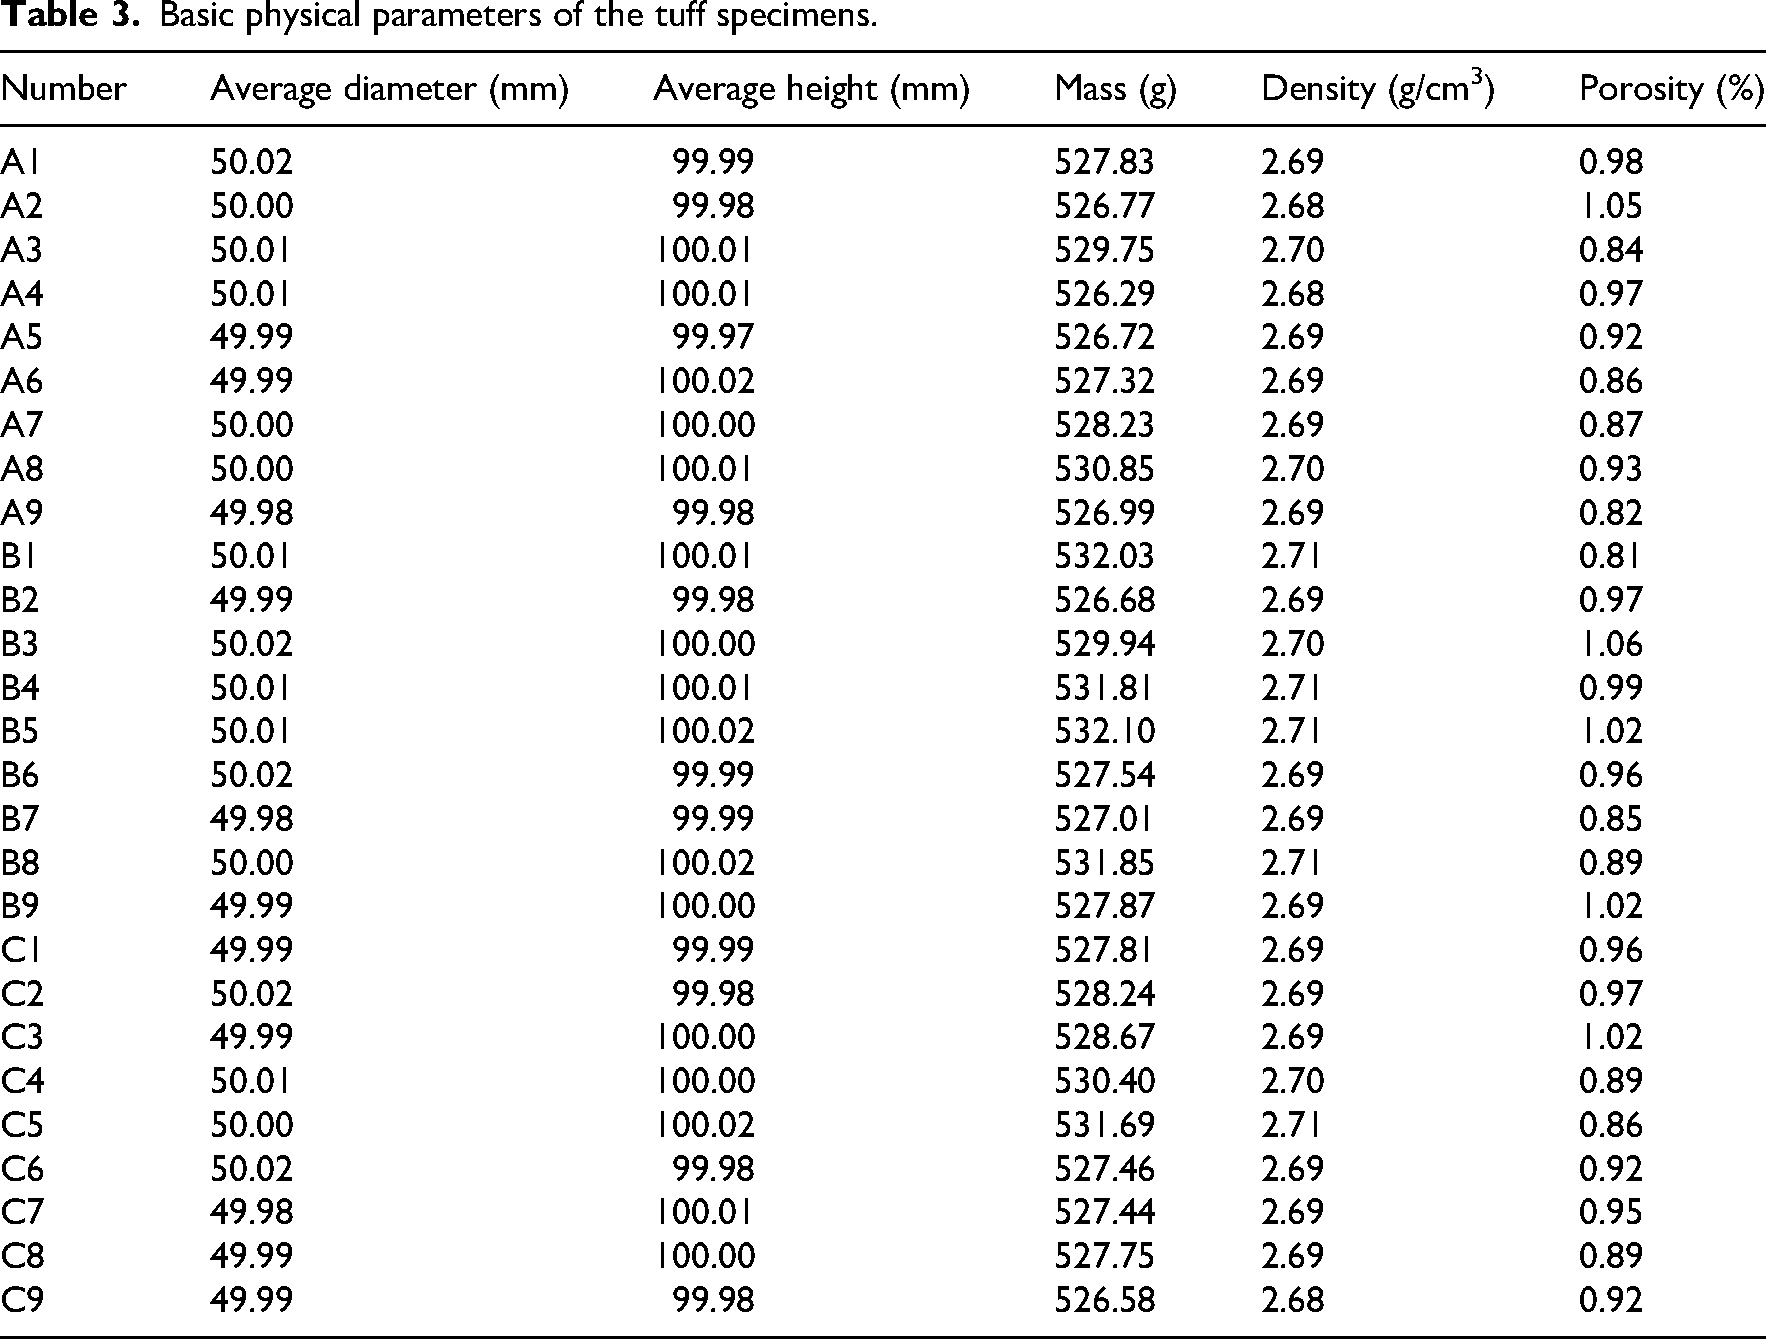
The tuff was processed into standard cylindrical specimens measuring 50 × 100 mm, ensuring that these specimens adhere to the required height-to-diameter ratio of 2.0–2.5. Next, the tuff specimens without surface defects, joints, and fissures were selected, ensuring that they met the specified dimensional criteria. Each specimen was assigned a unique identification number for documentation purposes. Finally, the physical properties of the processed cylindrical specimens were measured and recorded to facilitate further analysis. The results are presented in Table 3.
Basic physical parameters of the tuff specimens.
To guarantee complete water saturation, the tuff specimens underwent a rigorous vacuum treatment, consisting of 6 h of negative-pressure evacuation succeeded by a 24-h continuous submersion phase. The fully saturated specimens are shown in Figure 2. Before the test, the surface of the saturated specimens was wiped clean to remove any surface contaminants. The saturated specimens were then placed in a metal box within a low-temperature storage chamber. To achieve internal thermal equilibrium, the specimens were conditioned in an environmental chamber at strictly regulated temperatures of 0 °C, −10 °C, and −20 °C for duration of 48 h.
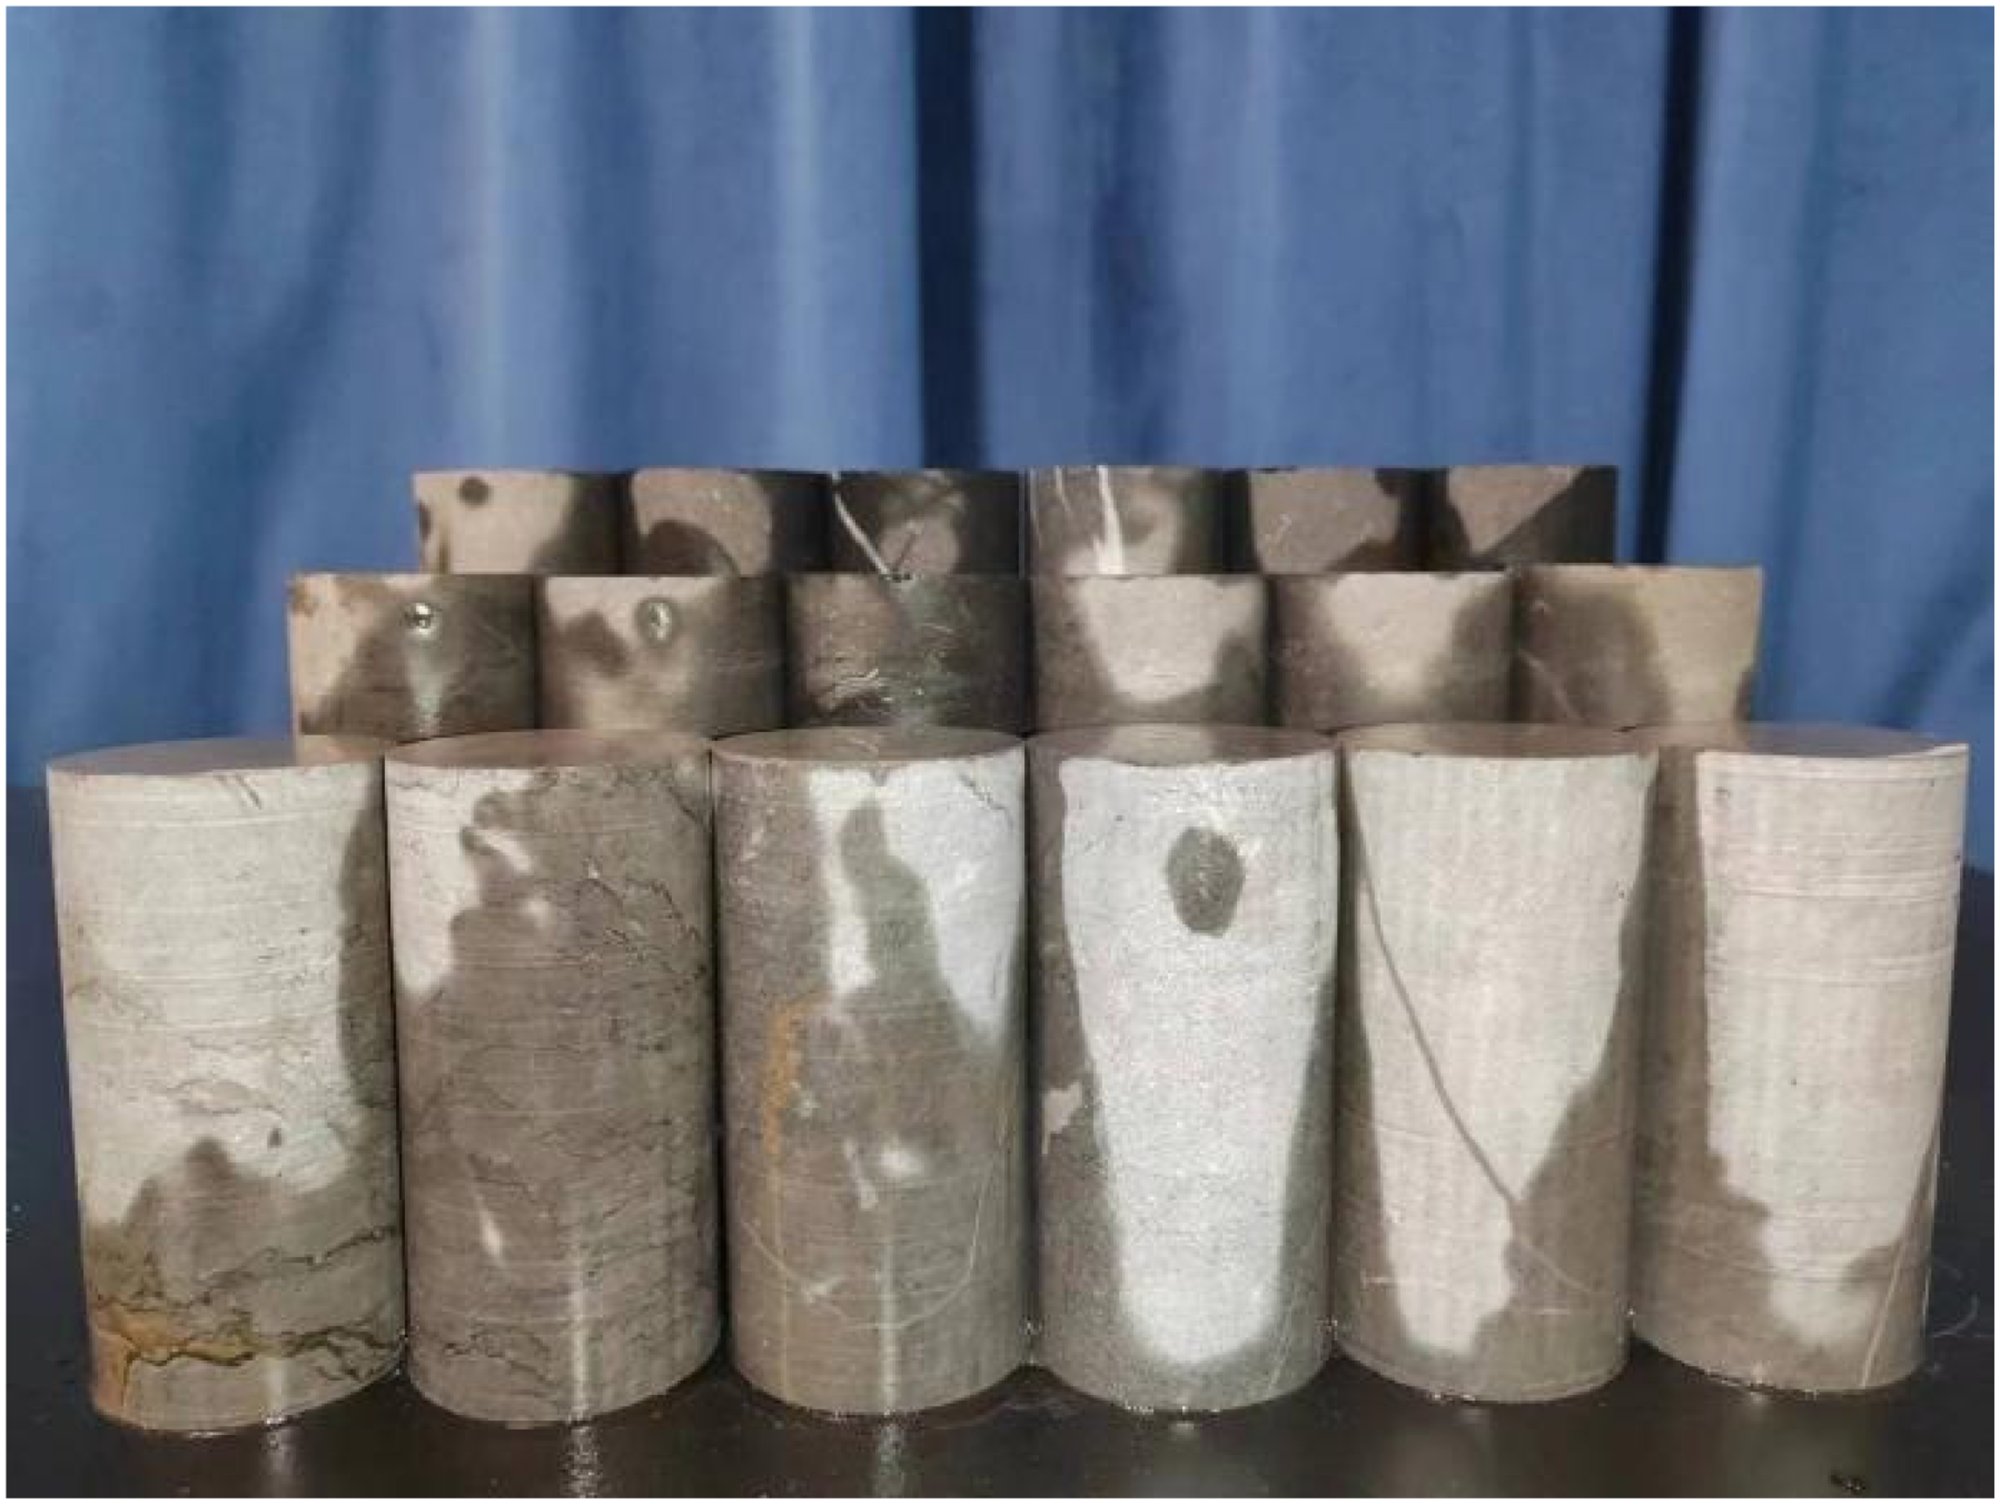
Saturated tuff specimens.
After the low-temperature curing was completed, NMR tests were first conducted on the specimens, and then uniaxial and triaxial compression tests were carried out. A NMR test was carried out on the saturated tuff specimens using the MesoMR23-060H-I NMR imaging analyzer from Suzhou Newman Analytical Instrument Corporation (Figure 3). The key test parameters of the NMR experiment are shown in Table 4. The specimens were placed in the specimen placement unit, and the scanning parameters were set using the operation unit. To elucidate the influence of low-temperature curing on the internal pore structure, the initial porosity of the tuff specimens was quantified both prior to and following the thermal treatment.
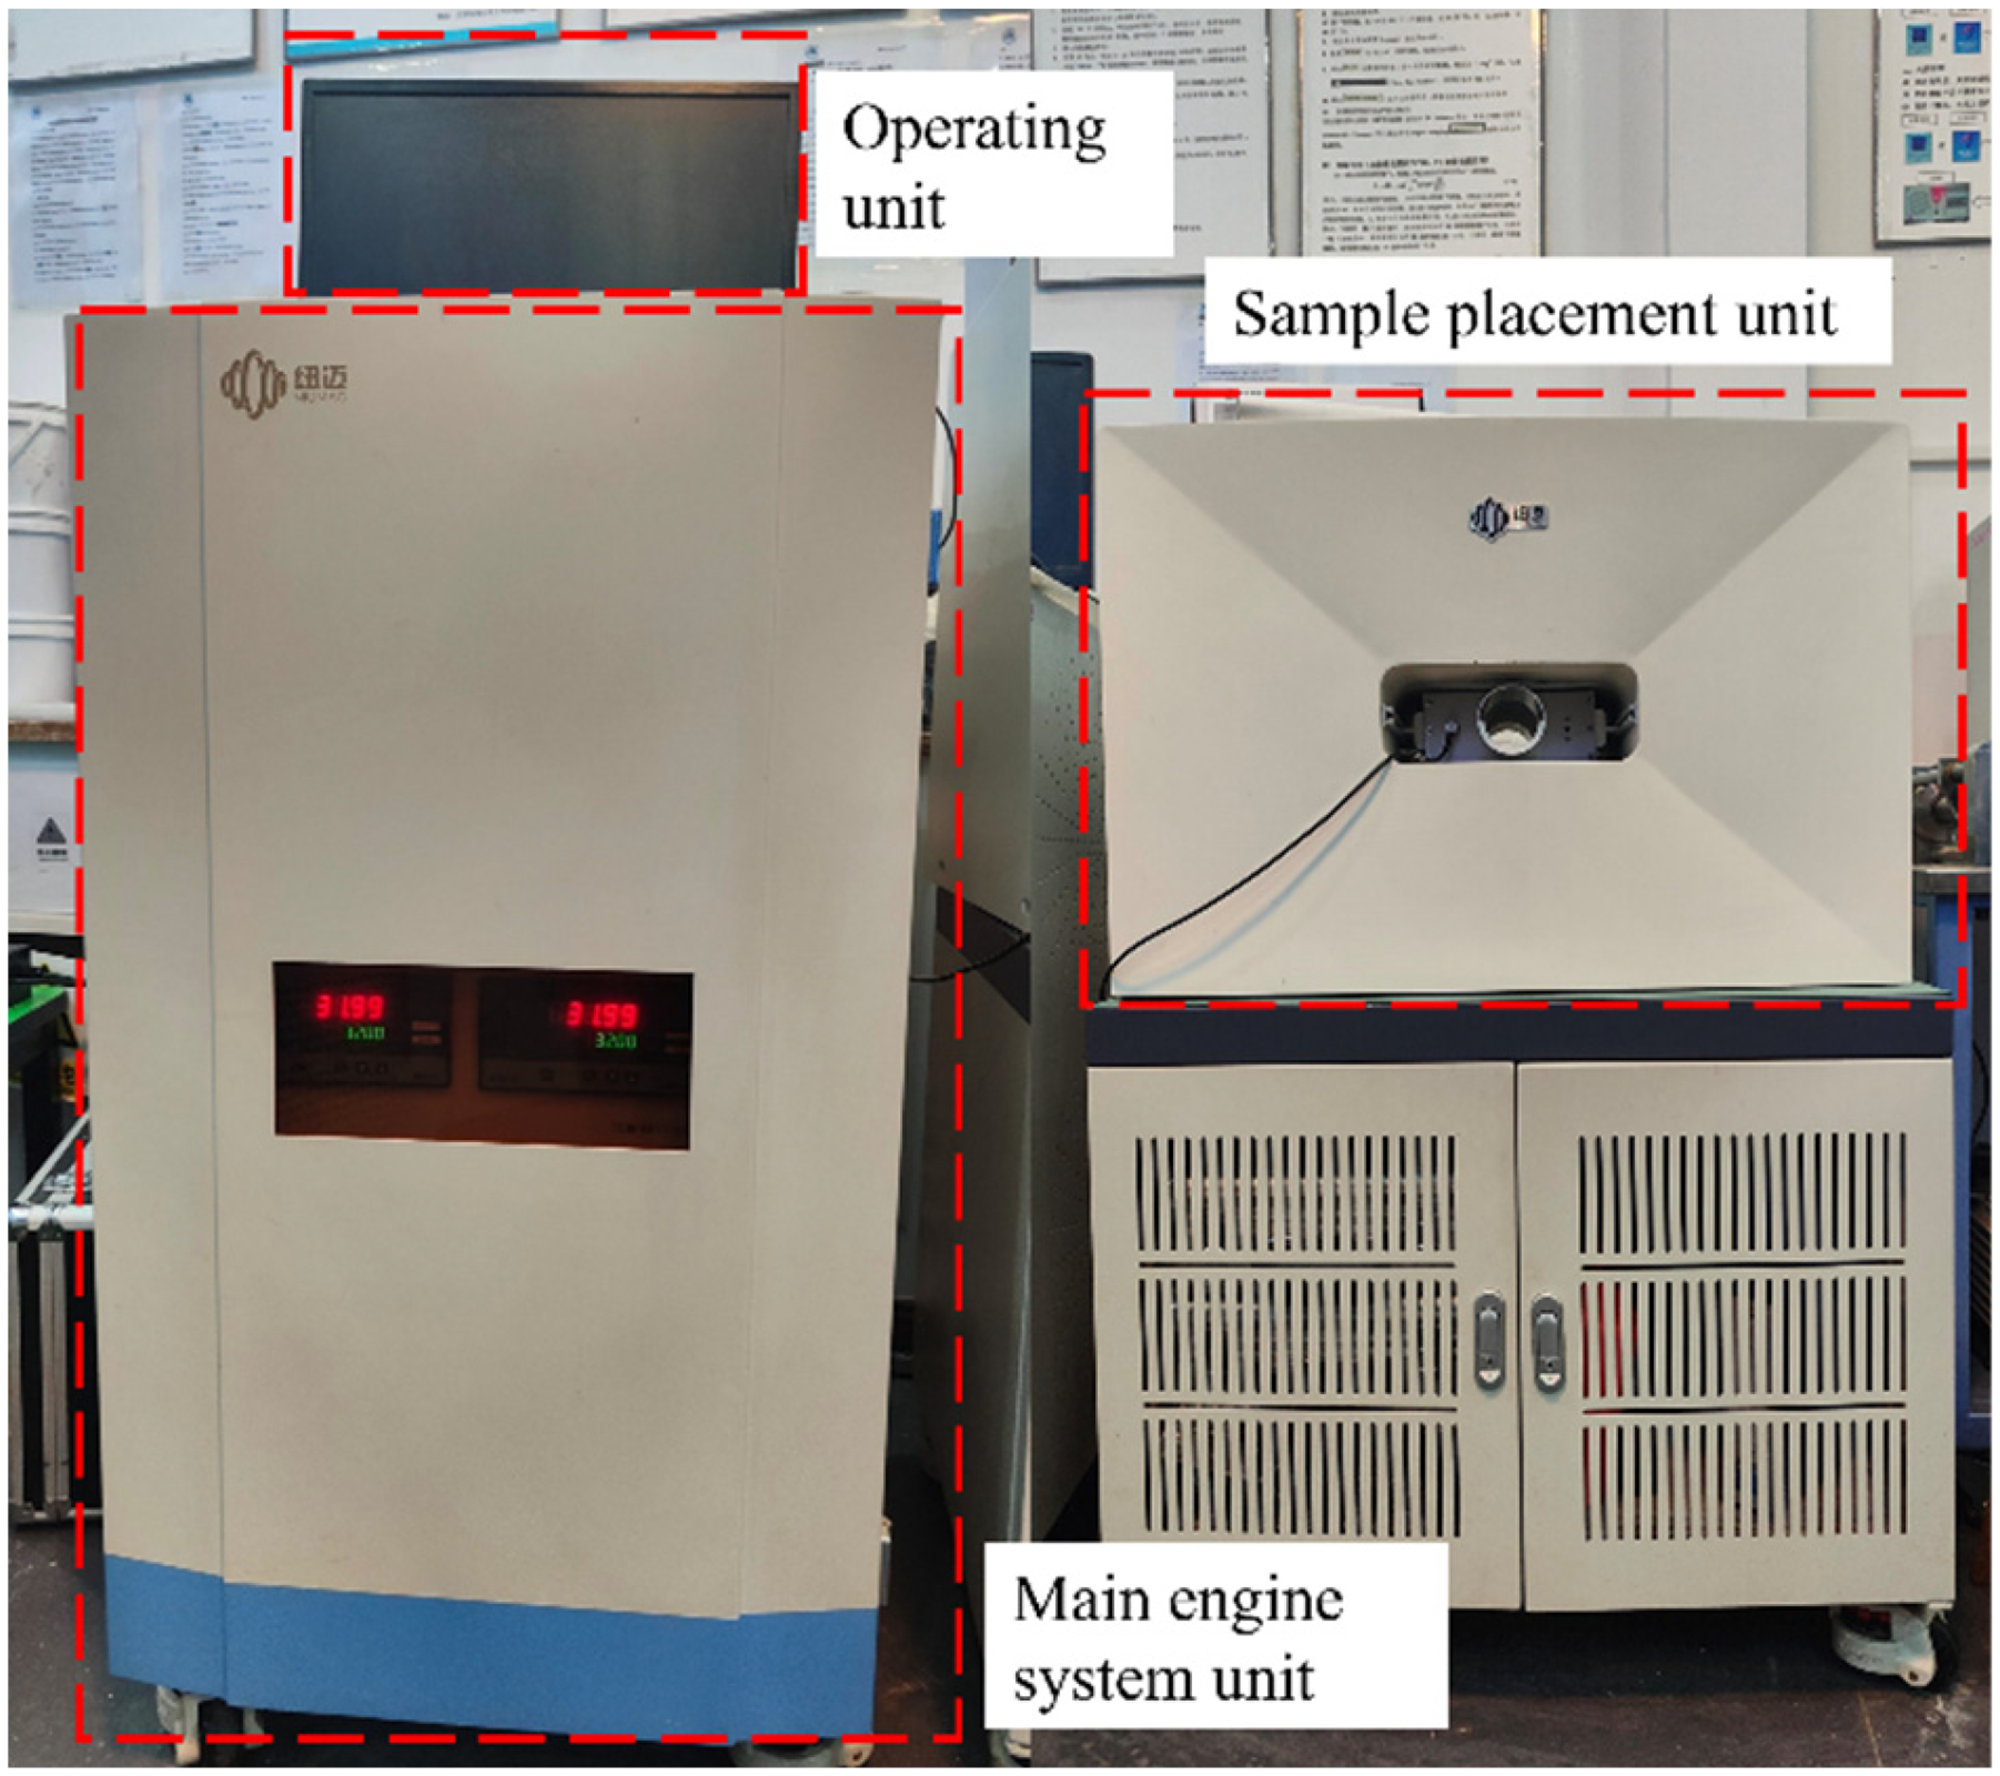
Nuclear magnetic resonance (NMR) equipment.
The key test parameters of the NMR experiment.

As illustrated in Figure 4, the mechanical evaluations were performed utilizing the ROCK600-50VHT triaxial testing apparatus. To strictly preserve their preset low-temperature state following the NMR analyses, the rock specimens were expeditiously relocated from the cooling chamber to the loading frame, where both uniaxial and triaxial compression tests were executed without delay. The tests were conducted in a laboratory environment with a stable ambient temperature of approximately 20 °C. In the experimental preparation phase, three tuff specimens were selected under different experimental temperature conditions for uniaxial loading tests, with a loading rate of 300 N/s until the specimens fractured and lost their load-bearing capacity.
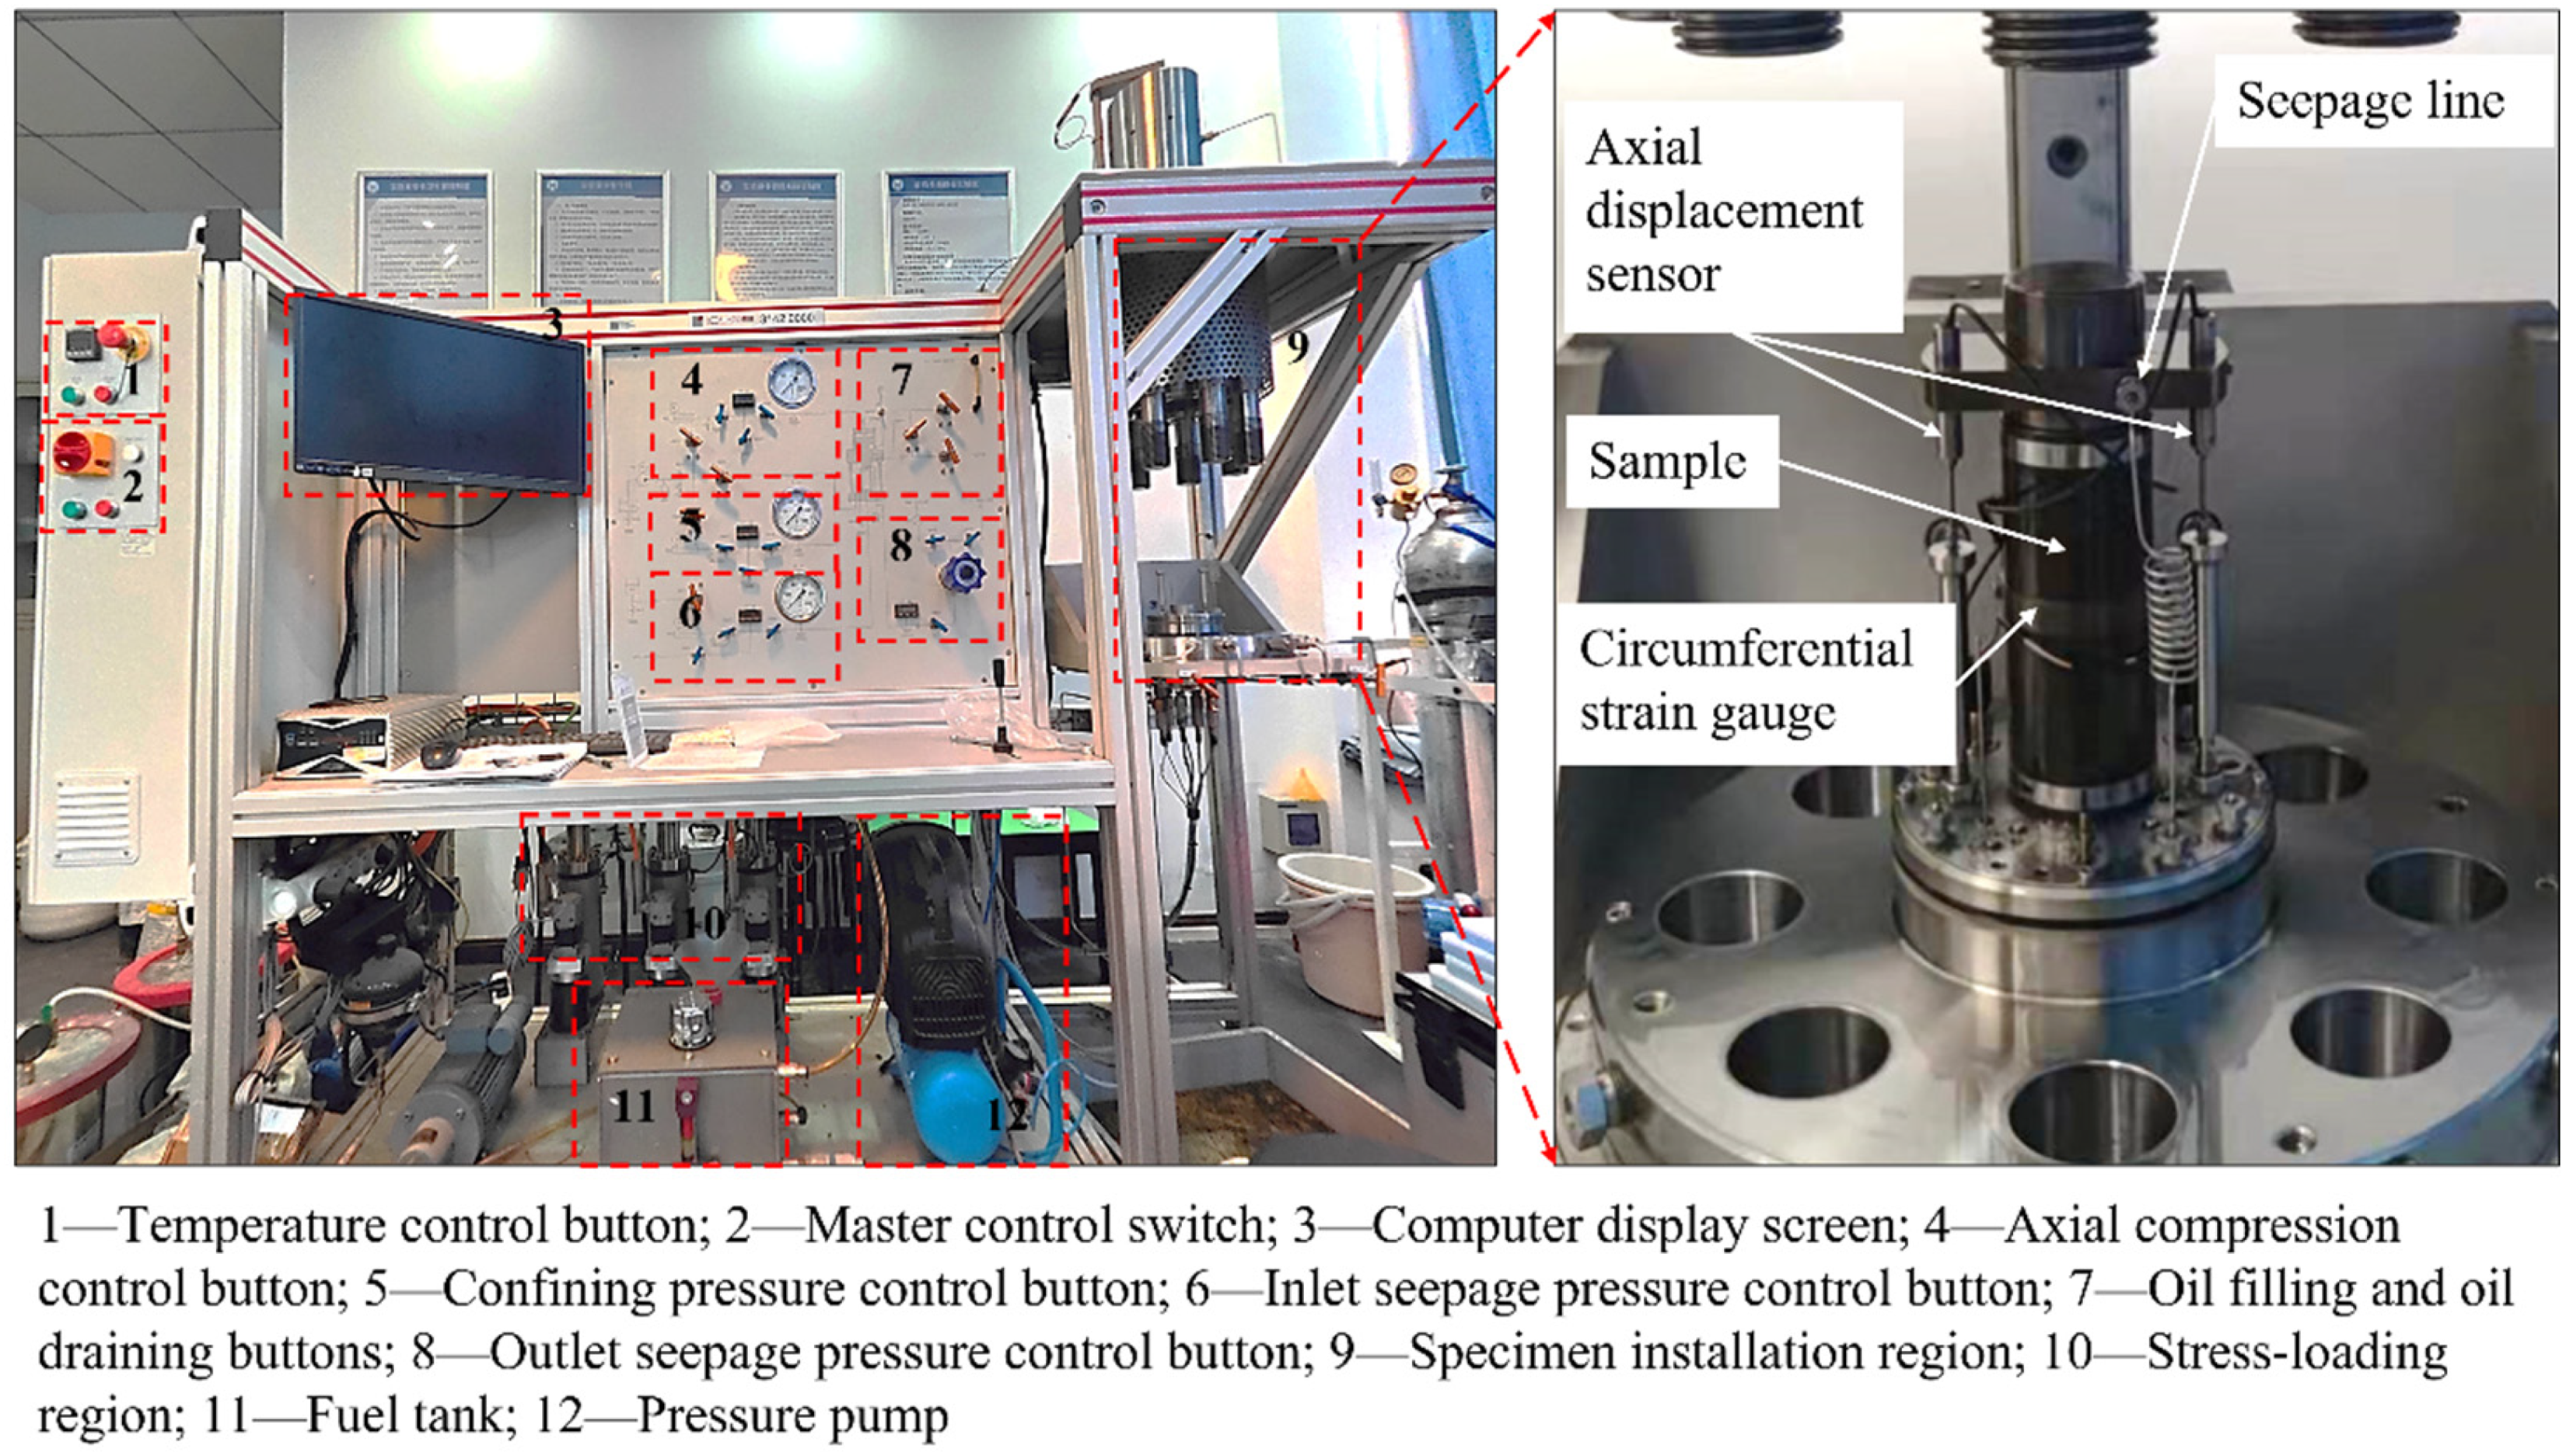
ROCK600-50VHT type multifield coupled triaxial testing system.
The triaxial testing protocol commenced with the sequential application of confining and seepage pressures, governed by stress-controlled rates of 0.1 MPa/s (60 bar/min) and 0.025 MPa/s (15 bar/min), respectively. To initiate unidirectional seepage under the prescribed pressure gradient, the upper outlet valve was vented to atmospheric conditions. Once these hydraulic and radial boundary conditions stabilized at their target thresholds, the rock specimen was driven to macroscopic failure via axial compression, which was executed under displacement control at a constant rate of 0.002 mm/s.
Analysis of low-temperature tuff NMR results
The tuff specimens were subjected to vacuum saturation treatment. The fully saturated specimens were then divided into three groups for NMR testing. The initial damage of the tuff specimens and the damage after low-temperature curing were recorded. The pore throat distribution and T2 spectra of the specimens before and after low-temperature curing are shown in Figure 5.
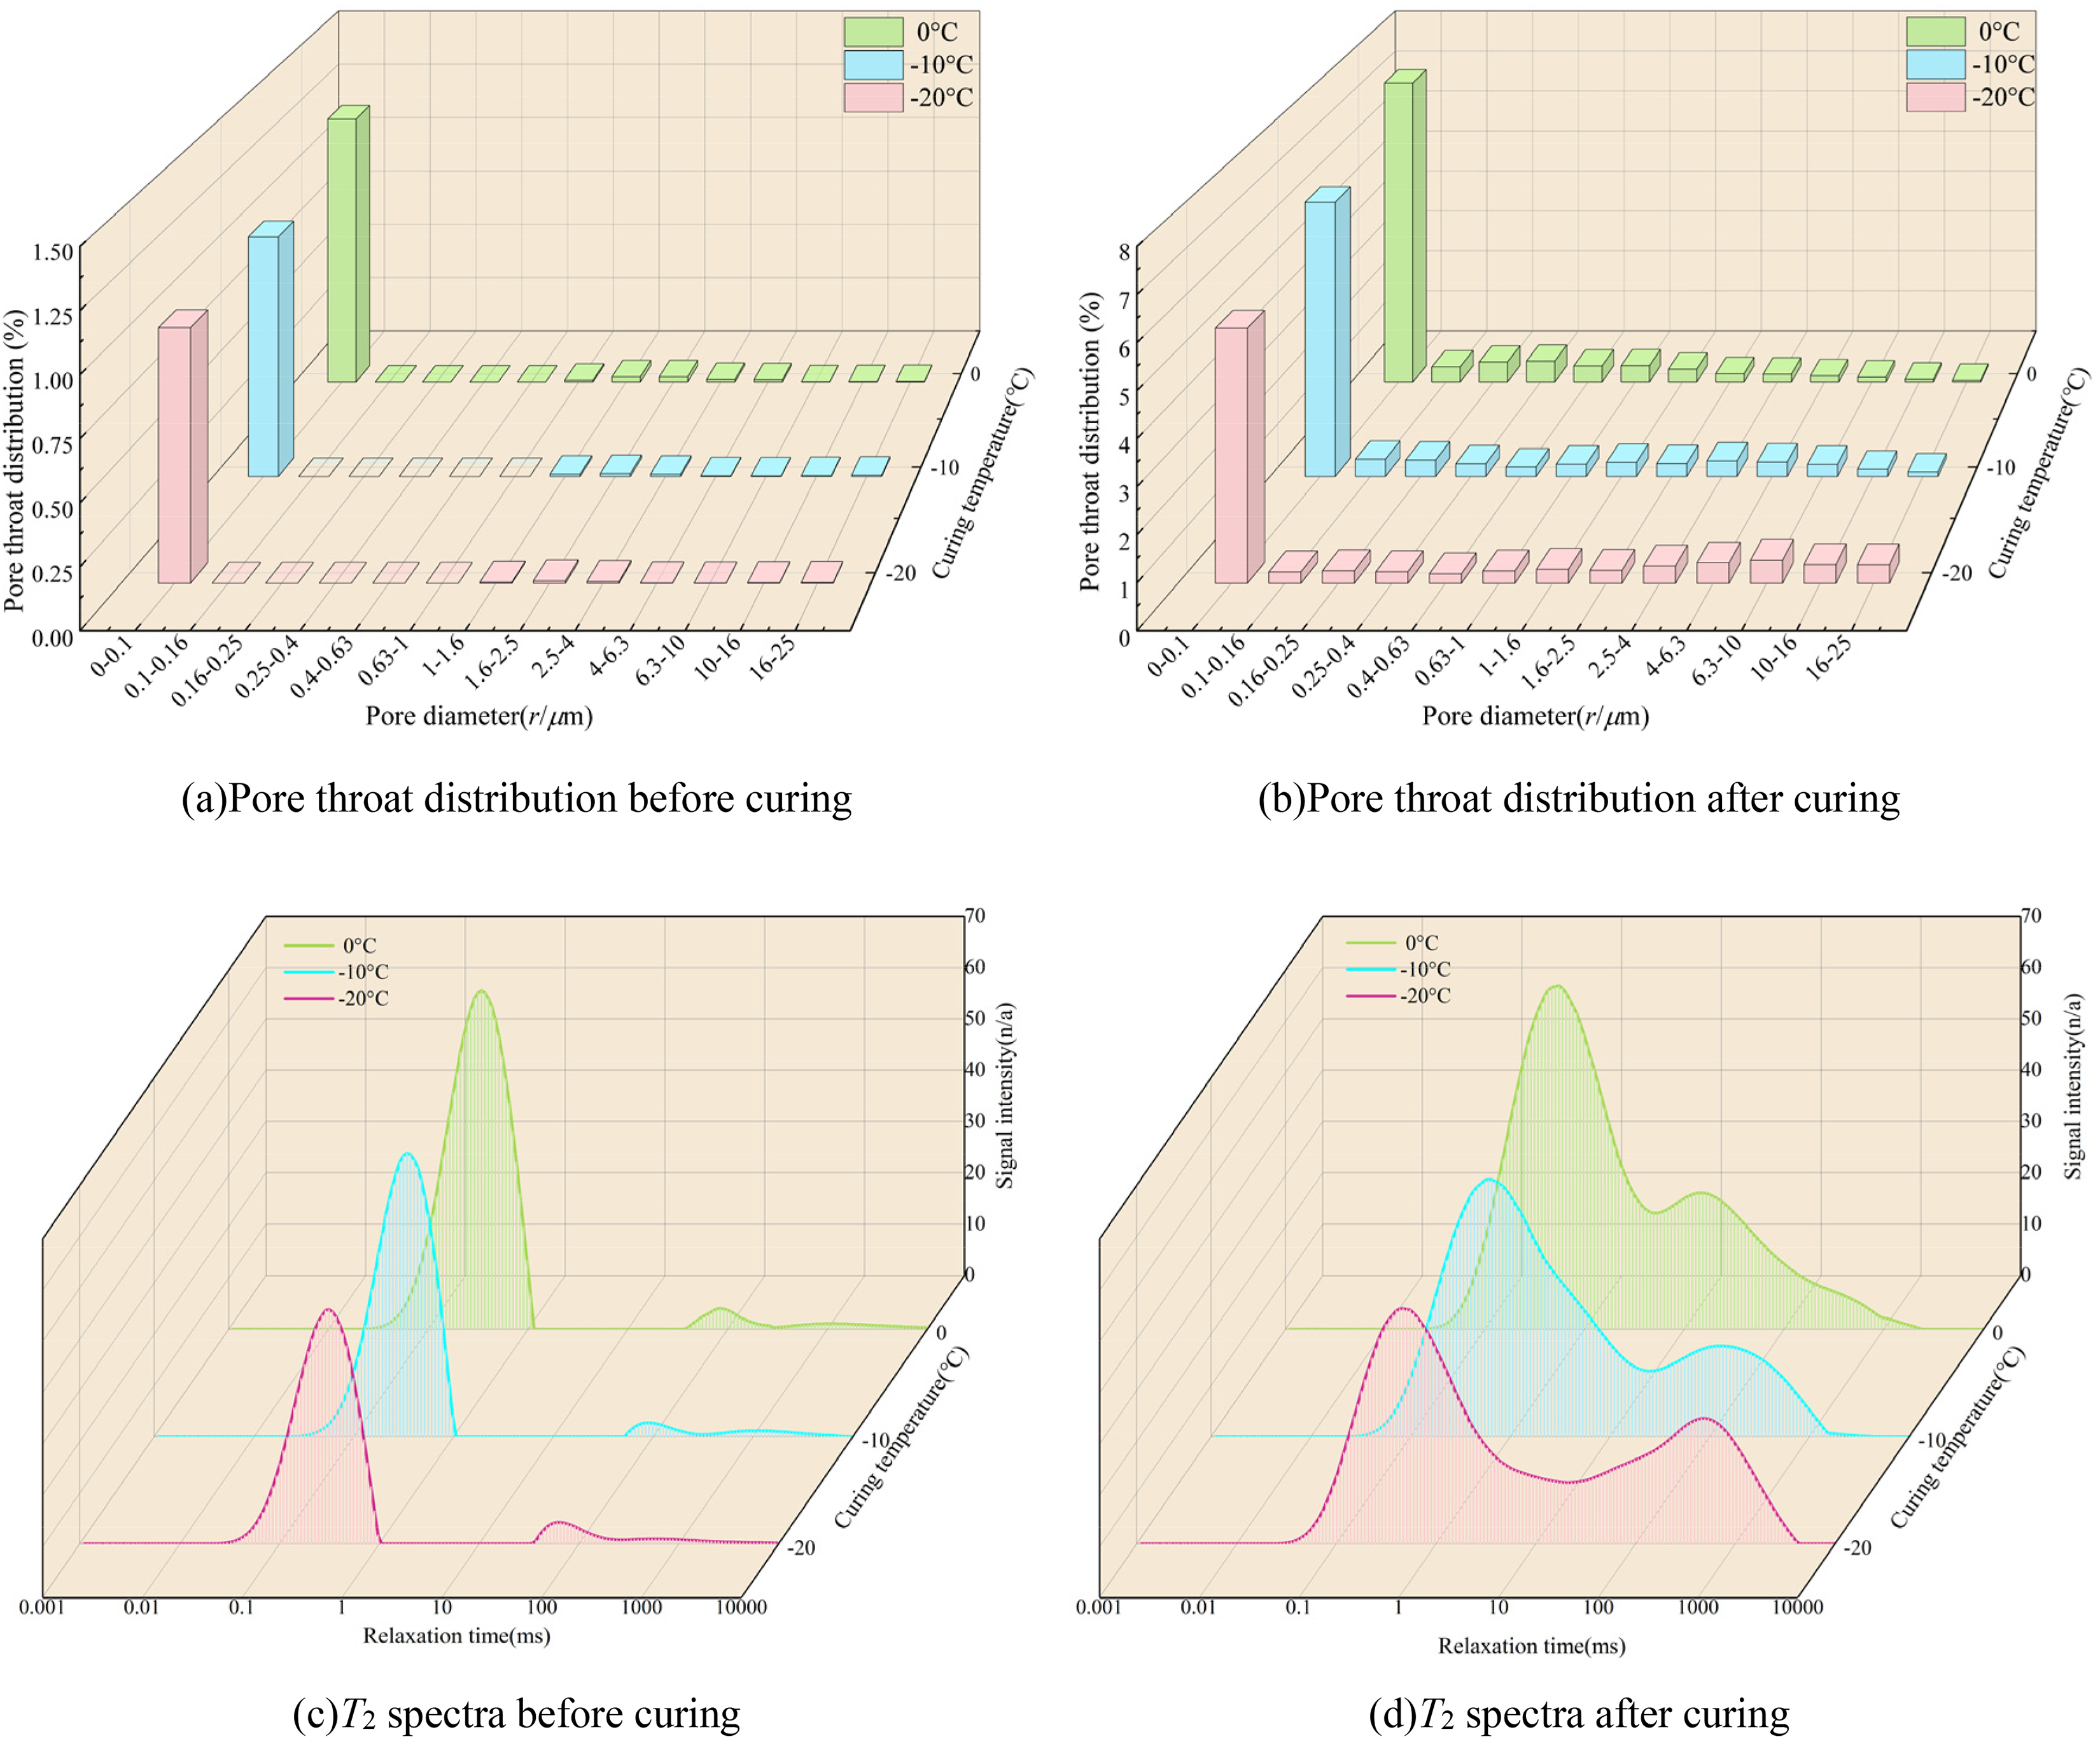
Pore throat distribution and T2 spectra of specimens before and after curing. (a) Pore throat distribution before curing. (b) Pore throat distribution after curing. (c) T2 spectra before curing. (d) T2 spectra after curing.
As shown in Figure 5, there is a significant difference in the internal pore structure of the tuff specimens before and after low-temperature curing. After low-temperature curing, the proportion of large pores in the specimens increased compared to their initial state. Under 0 °C conditions, the porosity of the specimens increased from 1.378% to 10.479%; under −10 °C conditions, the porosity increased from 1.073% to 9.674%; and under −20 °C conditions, the porosity increased from 1.051% to 9.396%. Universally, the internal pore networks of all specimens exhibited significant expansion following low-temperature conditioning.
This microstructural deterioration is fundamentally governed by the volumetric expansion during the water-to-ice phase transition. As corroborated by Lian et al. (2024), the resulting frost heave forces actively facilitate the propagation and coalescence of existing microscopic voids and fractures, ultimately culminating in a higher proliferation of macropores. Additionally, the lower the curing temperature, the more pronounced this change becomes.
Under fully saturated conditions, the transverse relaxation time (T2) of pore fluids in porous rocks is predominantly controlled by the surface relaxation mechanism. Therefore, T2 exhibits a linear relationship with the specific surface area of the pores, which can be expressed as:
Considering the complexity of the pore structure in tuff, the pore geometry can be equivalently simplified into an idealized geometric model, in which the specific surface area (S/V) can be expressed as the ratio of a shape factor (Fs) to the pore radius (r). Accordingly, the pore radius (r) is strictly proportional to T2, which can be written as:
By integrating the preceding theoretical relationships with established pore classification standards in rock mechanics, this study formulates a tailored T2 spectrum-based pore size categorization framework specifically for tuff. The internal pore space is divided into four categories:
Micropores: Pore radius r < 0.1 μm, corresponding to T2 < 3 ms. These pores are mainly associated with bound water, where fluid mobility is severely restricted.
Mesopores: A 0.1 μm < r < 0.63 μm, corresponding to 3 ms < T2 < 19 ms. This type of pore serves as a transitional bridge between microscale bound spaces and macroscale connected flow pathways, with the internal fluid predominantly existing in the form of capillary water.
Macropores: A 0.63 μm < r < 4 μm, corresponding to 19ms < T2 < 121 ms. These pores exhibit relatively good connectivity and serve as the primary storage space for free water.
Microfractures: A 4 μm < r < 25 μm, corresponding to T2 > 121 ms. An increase in signal within this range generally indicates structural damage and interfacial instability induced by external factors such as thermal stress, leading to crack propagation and connectivity.
Damage to tuff caused by low temperatures primarily manifests as the formation, development, and connectivity of microcracks and pores within the rock. Statistical analysis of the NMR test results before and after low-temperature curing shows the relationship between ambient temperature and the average porosity of the tuff specimens, as depicted in Figure 6. The figure shows that with decreasing curing temperatures, there are significant differences in the internal pore structure of the specimens before and after low-temperature curing, with an increase in the proportion of large pores after low-temperature curing compared to the initial state.
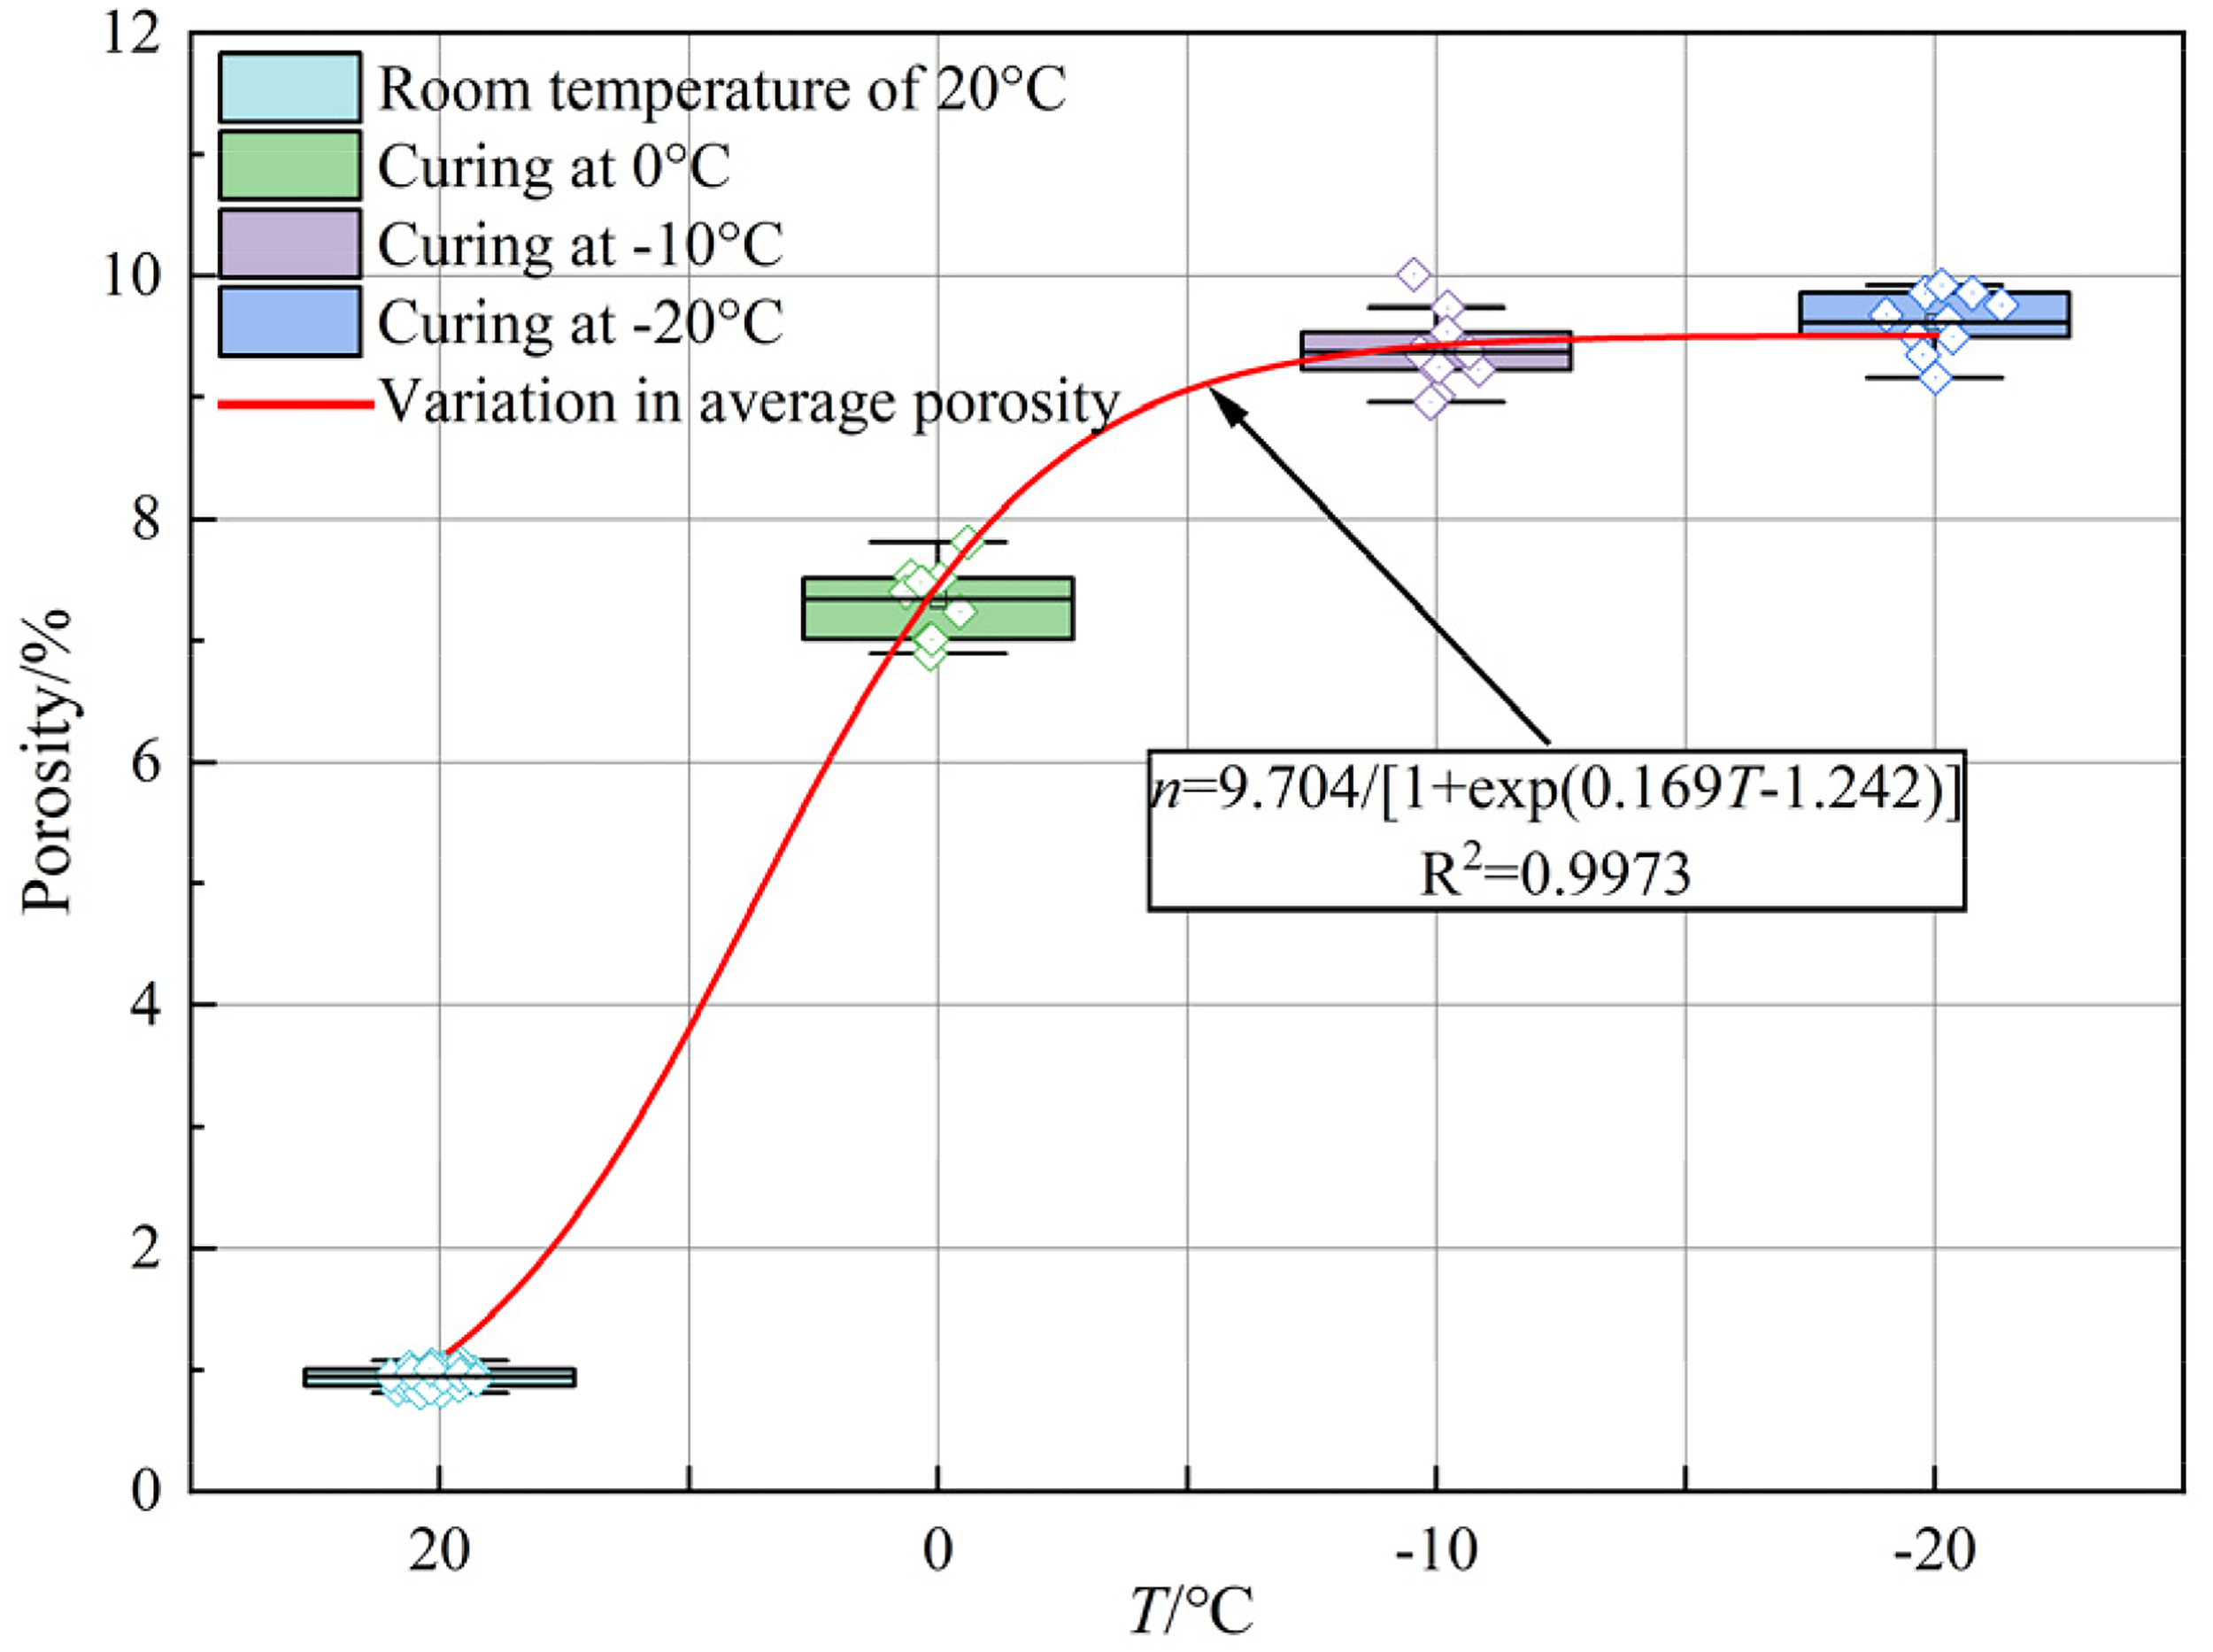
The variation of average porosity of specimens with curing temperature.
The statistical fitting of the porosity data confirms that low-temperature curing consistently elevates the specimens’ porosity relative to their initial states. Furthermore, as the experimental temperature decreases, this increasing trend gradually slows down, with the average porosity stabilizing around −20 °C. By comparing Figure 6 and Figure 7, it can be observed that although the average porosity shows no significant increase under −20 °C conditions compared to −10 °C curing, the proportion of pores with diameters between 4 and 25 μm increases notably. This indicates that the temperature range of 0 °C to −10 °C is the primary stage for the formation of pores and cracks in the specimens, which is caused by the volume expansion generated by the water-ice phase transition. In contrast, from −10 °C to −20 °C, the pore structure in the specimen does not significantly increase; instead, this phase is marked by the interconnection of the existing pore and crack structures. Fundamentally, within subzero environments, the cryogenic expansion forces generated by the pore-water phase change significantly accelerate the propagation and coalescence of internal fissures and void networks throughout the specimen. This not only increases the number of pores and cracks but also leads to their growth toward larger pore diameters.
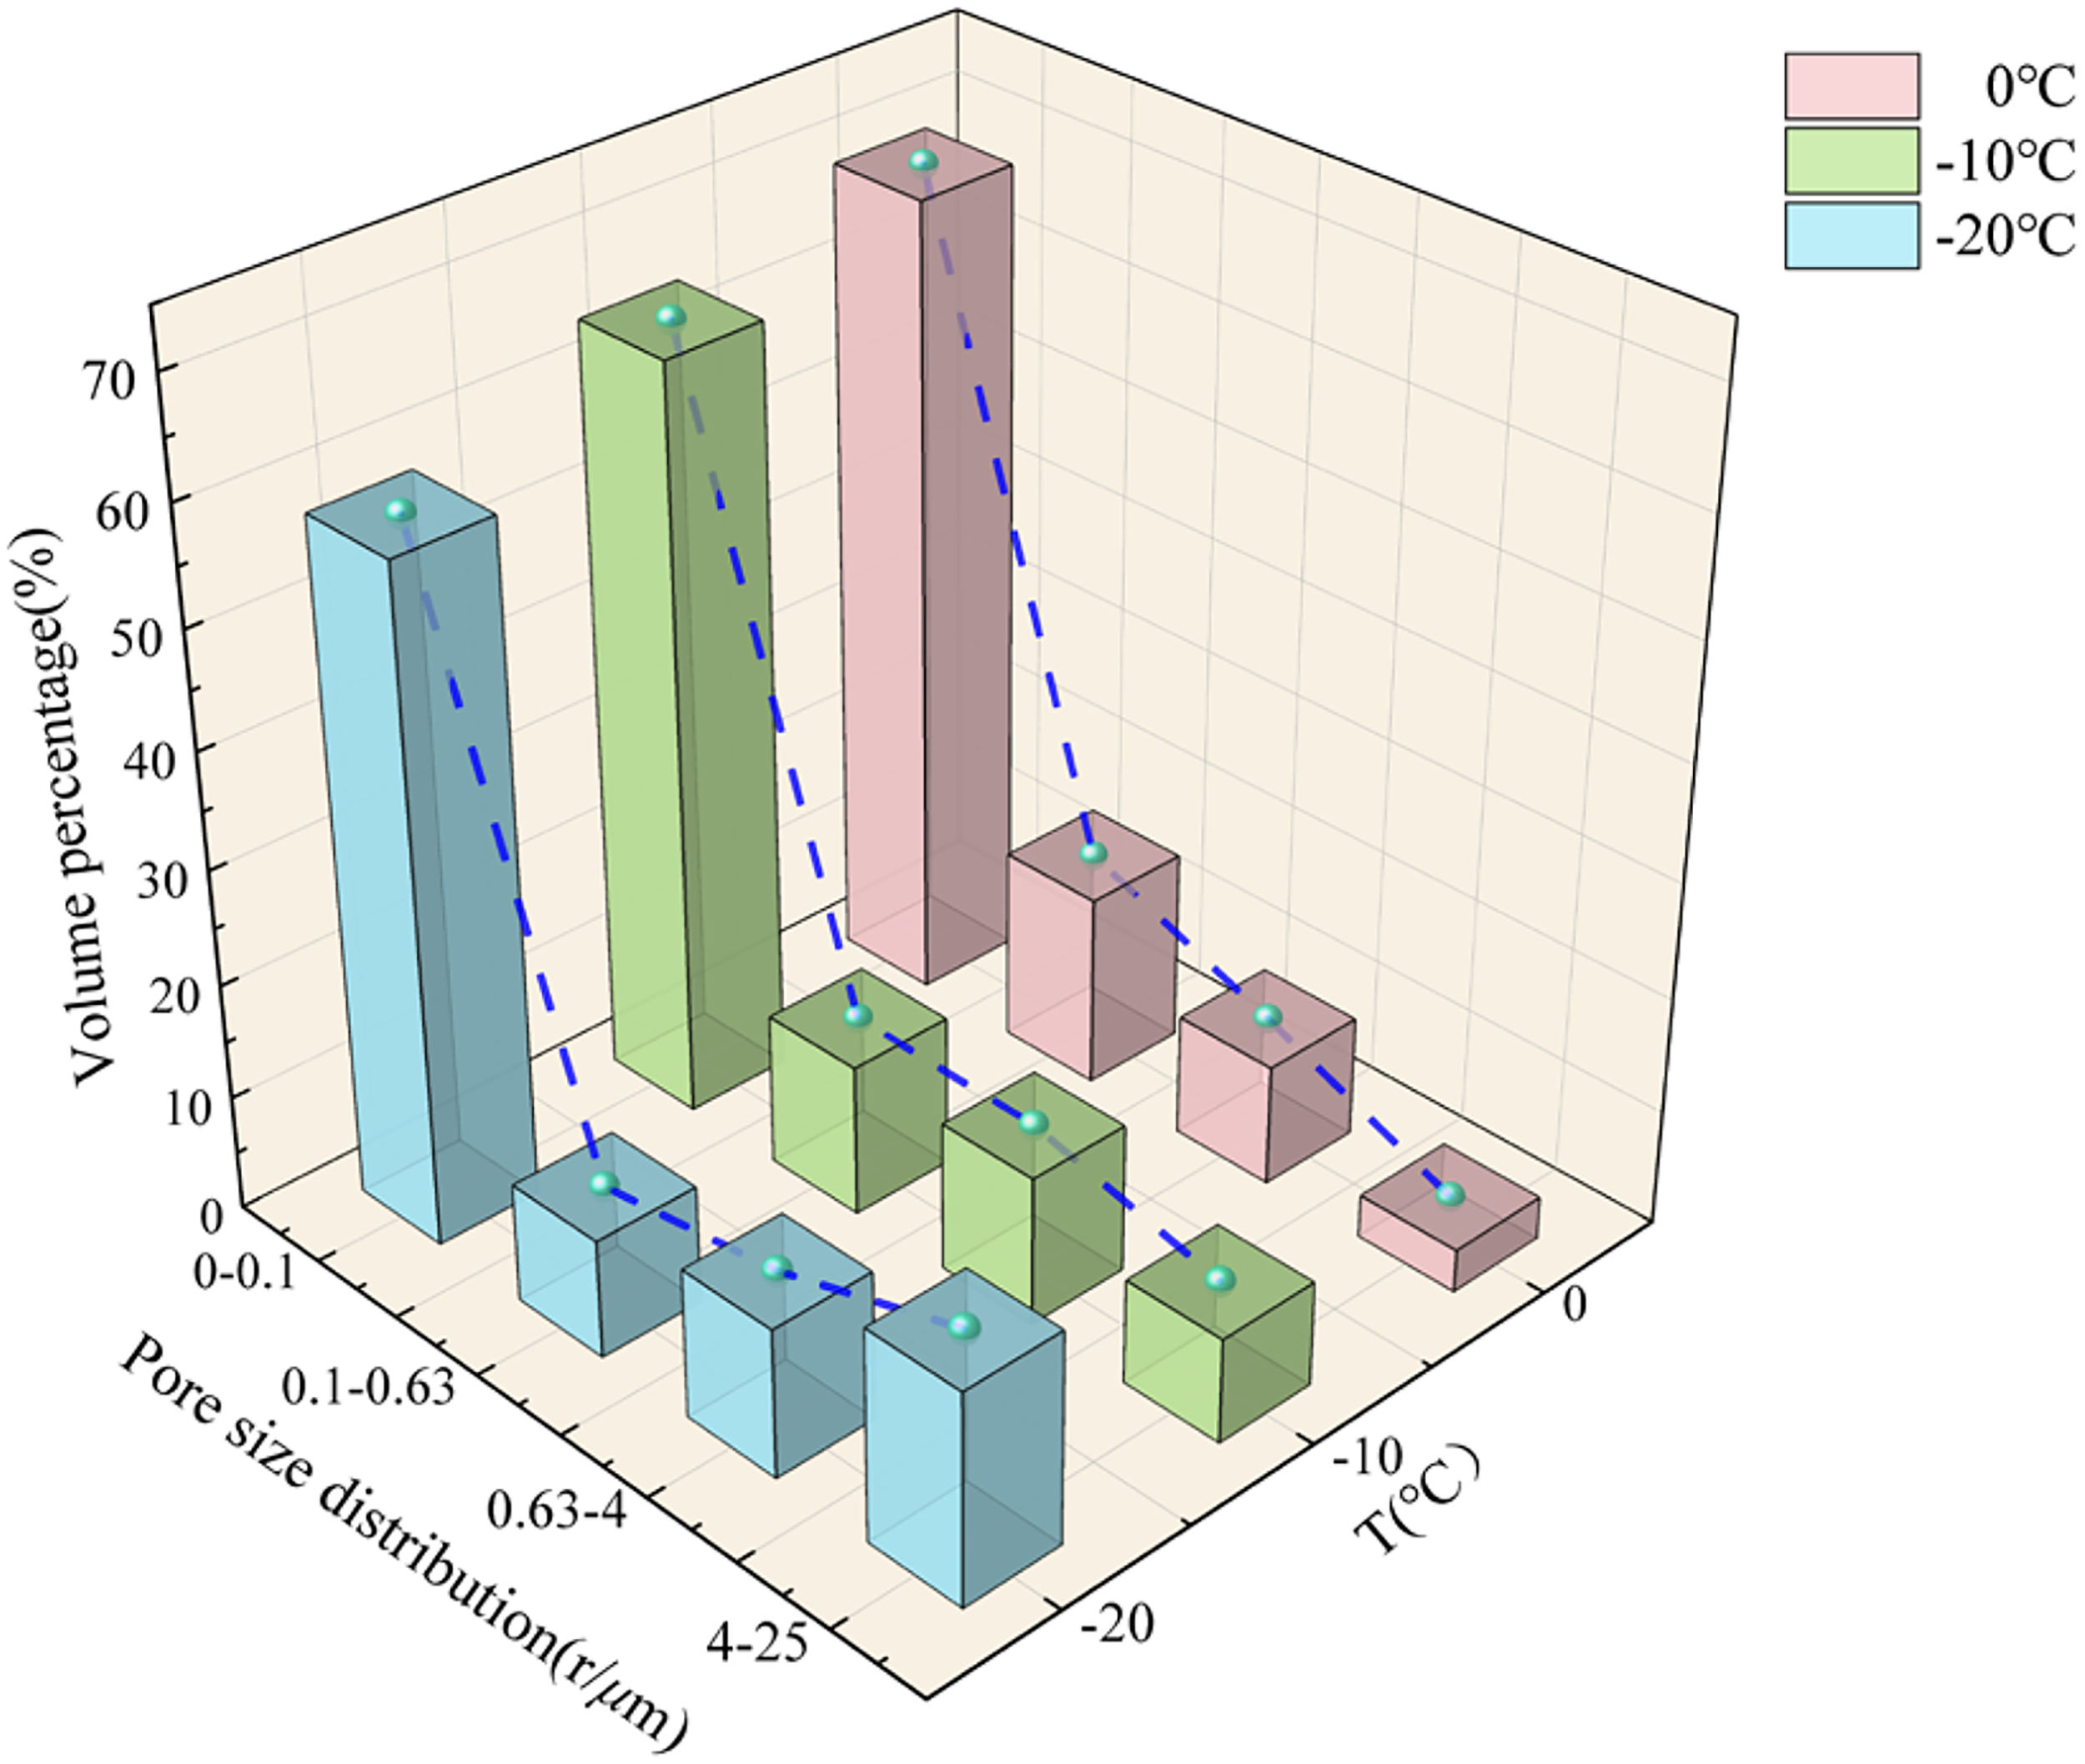
Evolution trends of pore size of the tuff specimens.
Analysis of fracture characteristics of low-temperature tuff
Prior to the execution of both uniaxial compression and triaxial loading tests, the designated tuff specimens underwent rigorous preparatory phases, specifically vacuum saturation and low-temperature conditioning. Before the start of the experiments, the machine's operating condition was checked and stabilized. A uniform axial load was then applied until the specimen was completely destroyed. Figure 8 shows the failure patterns of tuff specimens under different temperature, confining pressure, and seepage pressure conditions.

Fracture morphology of specimen under triaxial compression.
By extracting the cracks delineated by the red dashed lines in the images along with their inclination angles, Table 5 was compiled. The number of fractures and their respective angles were estimated based on the primary cracks and prominent branches. Furthermore, the macroscopic failure modes were primarily categorized into three types: shear failure, tensile splitting failure, and complex conjugate failure.
Fracture characteristics of the specimens.
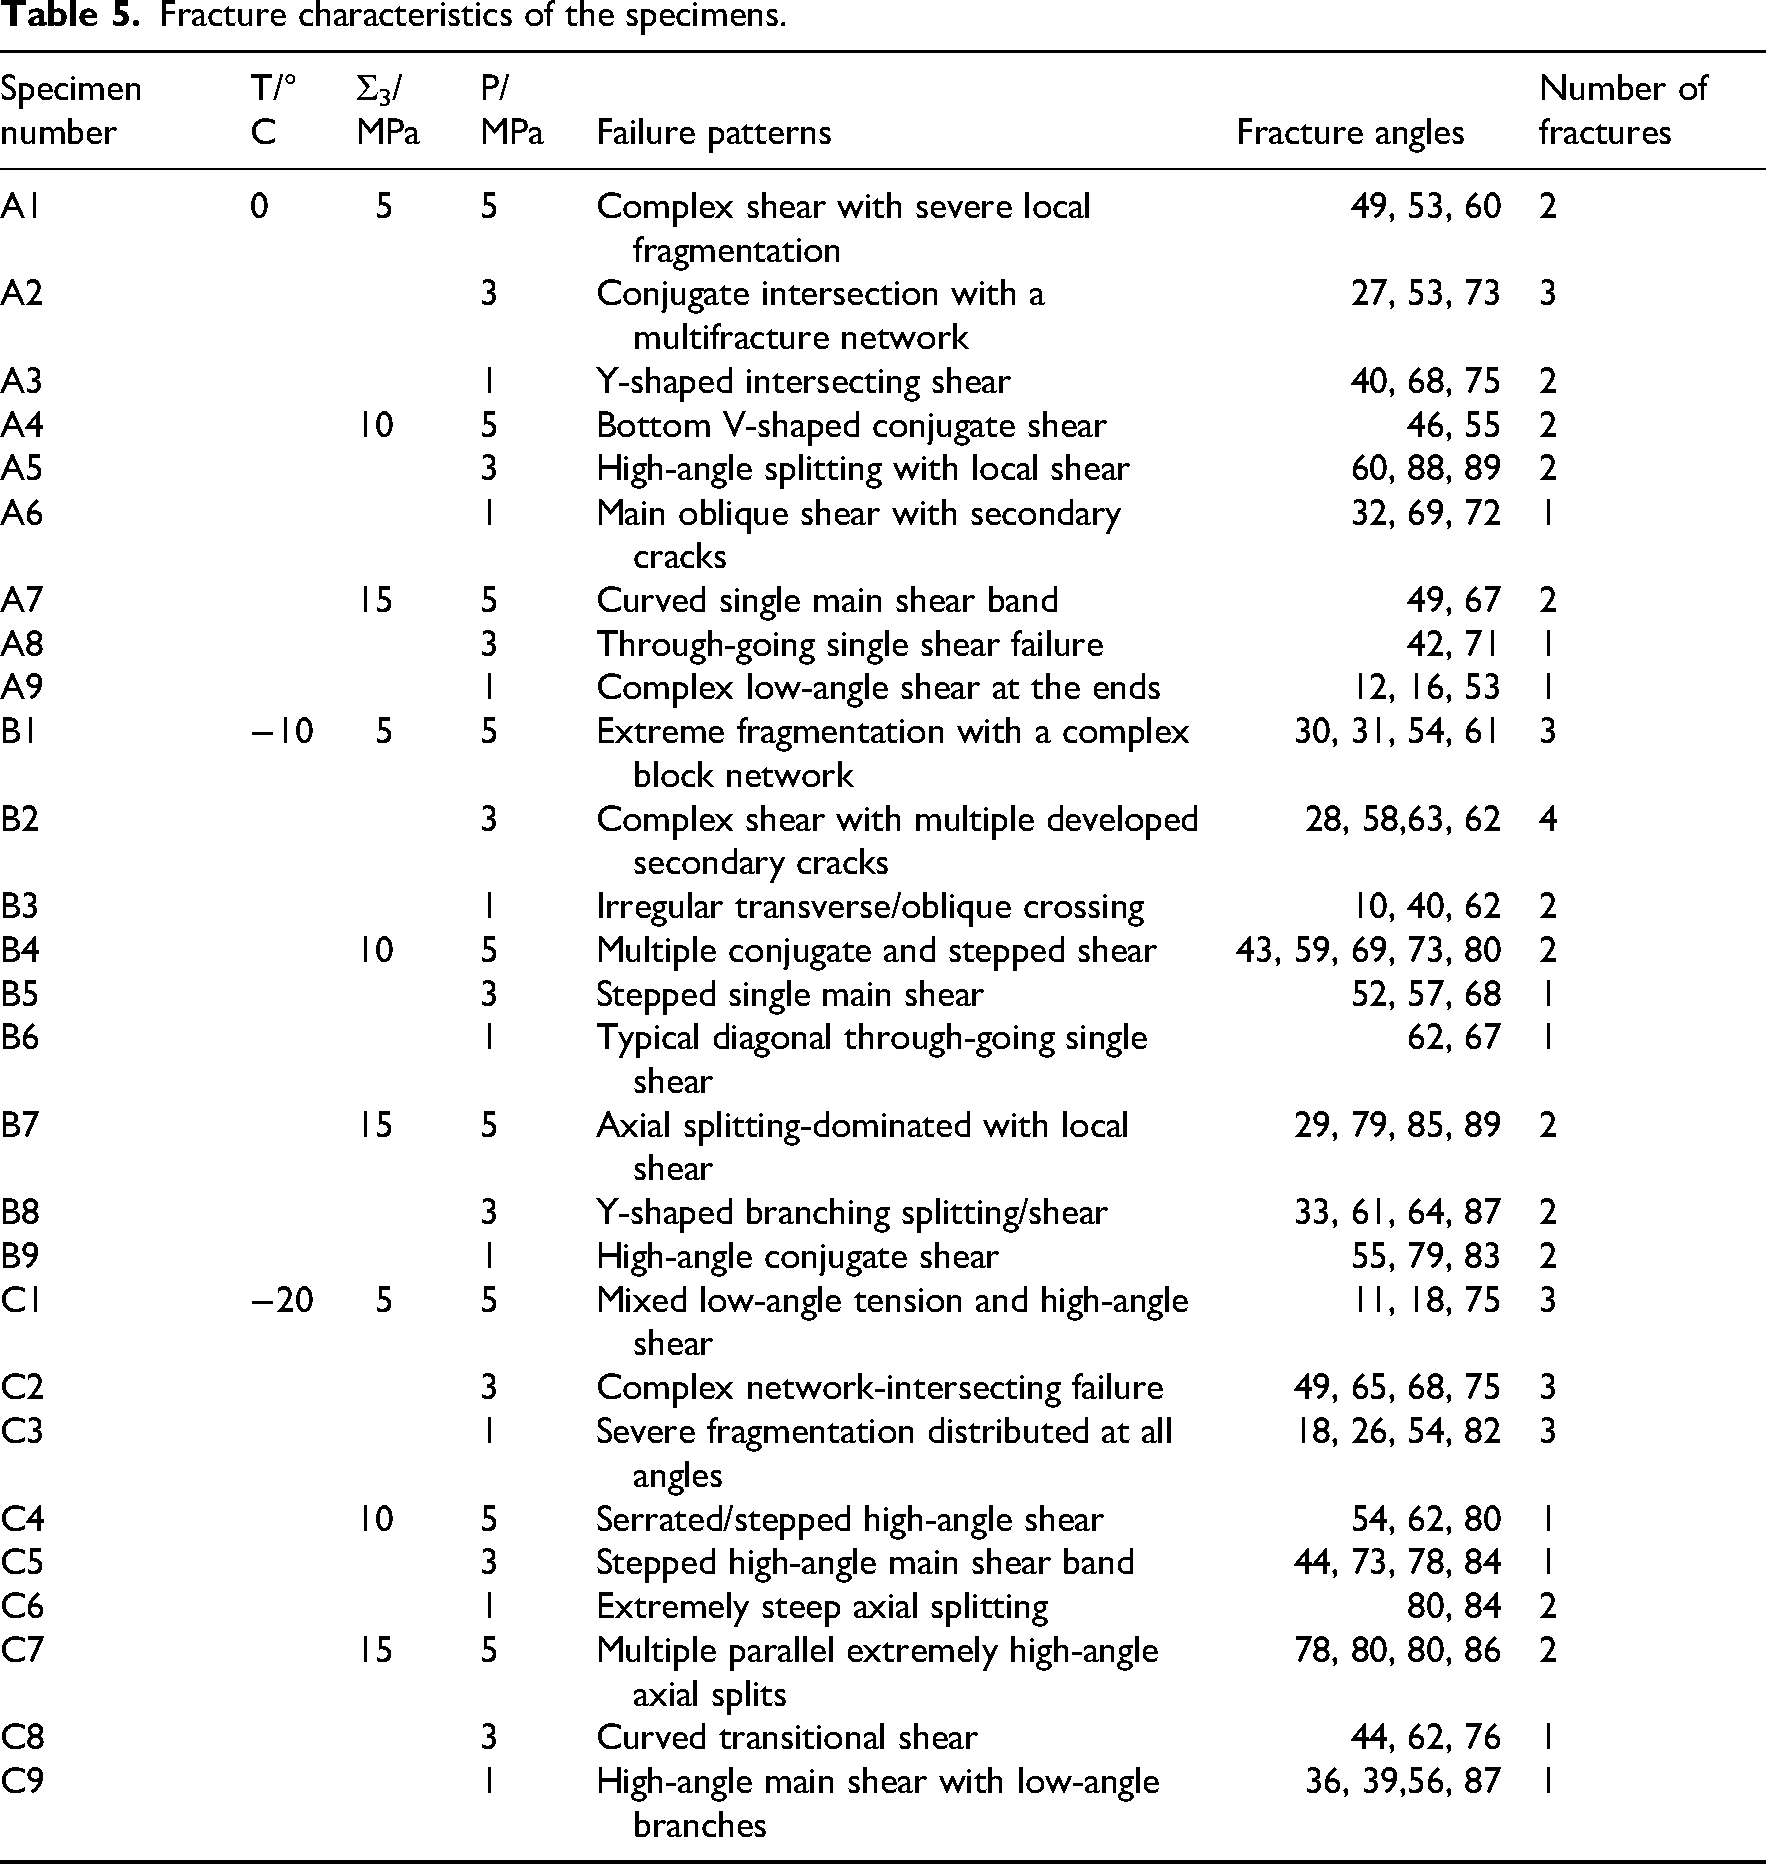
Based on the aforementioned chart data, it is evident that in deep rock mass mechanics or complex geological environment simulations, multifield coupling fundamentally dictates the strength attenuation and fracture mechanisms of tuff.
As the temperature decreases from 0 °C to −20 °C, the failure mode of the tuff undergoes a significant transition from shear failure to brittle splitting failure. Under the same high confining pressure, the main crack angle evolves from a typical Coulomb–Mohr shear angle (40°–70°) to an extremely high dip angle parallel to the maximum principal stress direction (e.g., above 80°). This is primarily attributed to the frost heave force generated by pore water freezing, which induces microscopic initial damage. Concurrently, the significant stiffness disparity between the ice and the rock matrix enhances the macroscopic brittleness of the rock, driving a drastic transition of deformation between continuous and discontinuous states. This makes the specimen highly susceptible to instantaneous high-energy release and axial splitting.
The increase in confining pressure (from 5 to 15 MPa) significantly suppresses the lateral dilatancy deformation of the rock, prompting the fracture path to converge from a complex multibranch network into a single through-going main shear band. Under low confining pressure conditions, the specimens often develop numerous secondary cracks with scattered angles; conversely, high confining pressure effectively enhances the internal frictional effect of the rock, substantially restricting the initiation and propagation of tensile cracks. This transition of the failure mechanism toward sliding along with a macroscopic shear plane essentially reflects the strengthening effect of high hydrostatic pressure on the rock's yield surface, rendering the characteristics of the dominant crack band more prominent.
Furthermore, the increase in pore water pressure (from 1 to 5 MPa) aggravates the degree of rock failure, resulting in a highly fragmented and complex networked fracture morphology. According to the effective stress principle (σ' = σ − P), the high permeating water pressure directly offsets a portion of the confining constraint, significantly reducing the effective normal stress on the rock skeleton. During this process, a strong “water wedging effect” is generated at the crack tips, driving the microcracks to overcome the fracture toughness and propagate continuously. This induces a multitude of low-dip-angle tensile or tensile-shear cracks, ultimately causing the rock to macroscopically exhibit severe fragmentation and complex conjugate intersecting characteristics.
In summary, the fracture characteristics of tuff are the definitive result of ice-water-mechanical, or THM coupling effects. Low temperatures and low confining pressures promote fracture complexity and brittle splitting; high confining pressure forces the failure to concentrate into a single main shear band, whereas high permeating pressure, by reducing the effective stress, profoundly enriches the initiation paths of secondary cracks.
Mechanical properties of tuff under low-temperature conditions
Uniaxial compressive mechanical properties
In low-temperature conditions, the strength and deformation characteristics of rocks are affected. The representative stress–strain profiles and the corresponding strength evolutions of the tuff specimens, evaluated at 0 °C, −10 °C, and −20 °C, are graphically summarized in Figure 9.
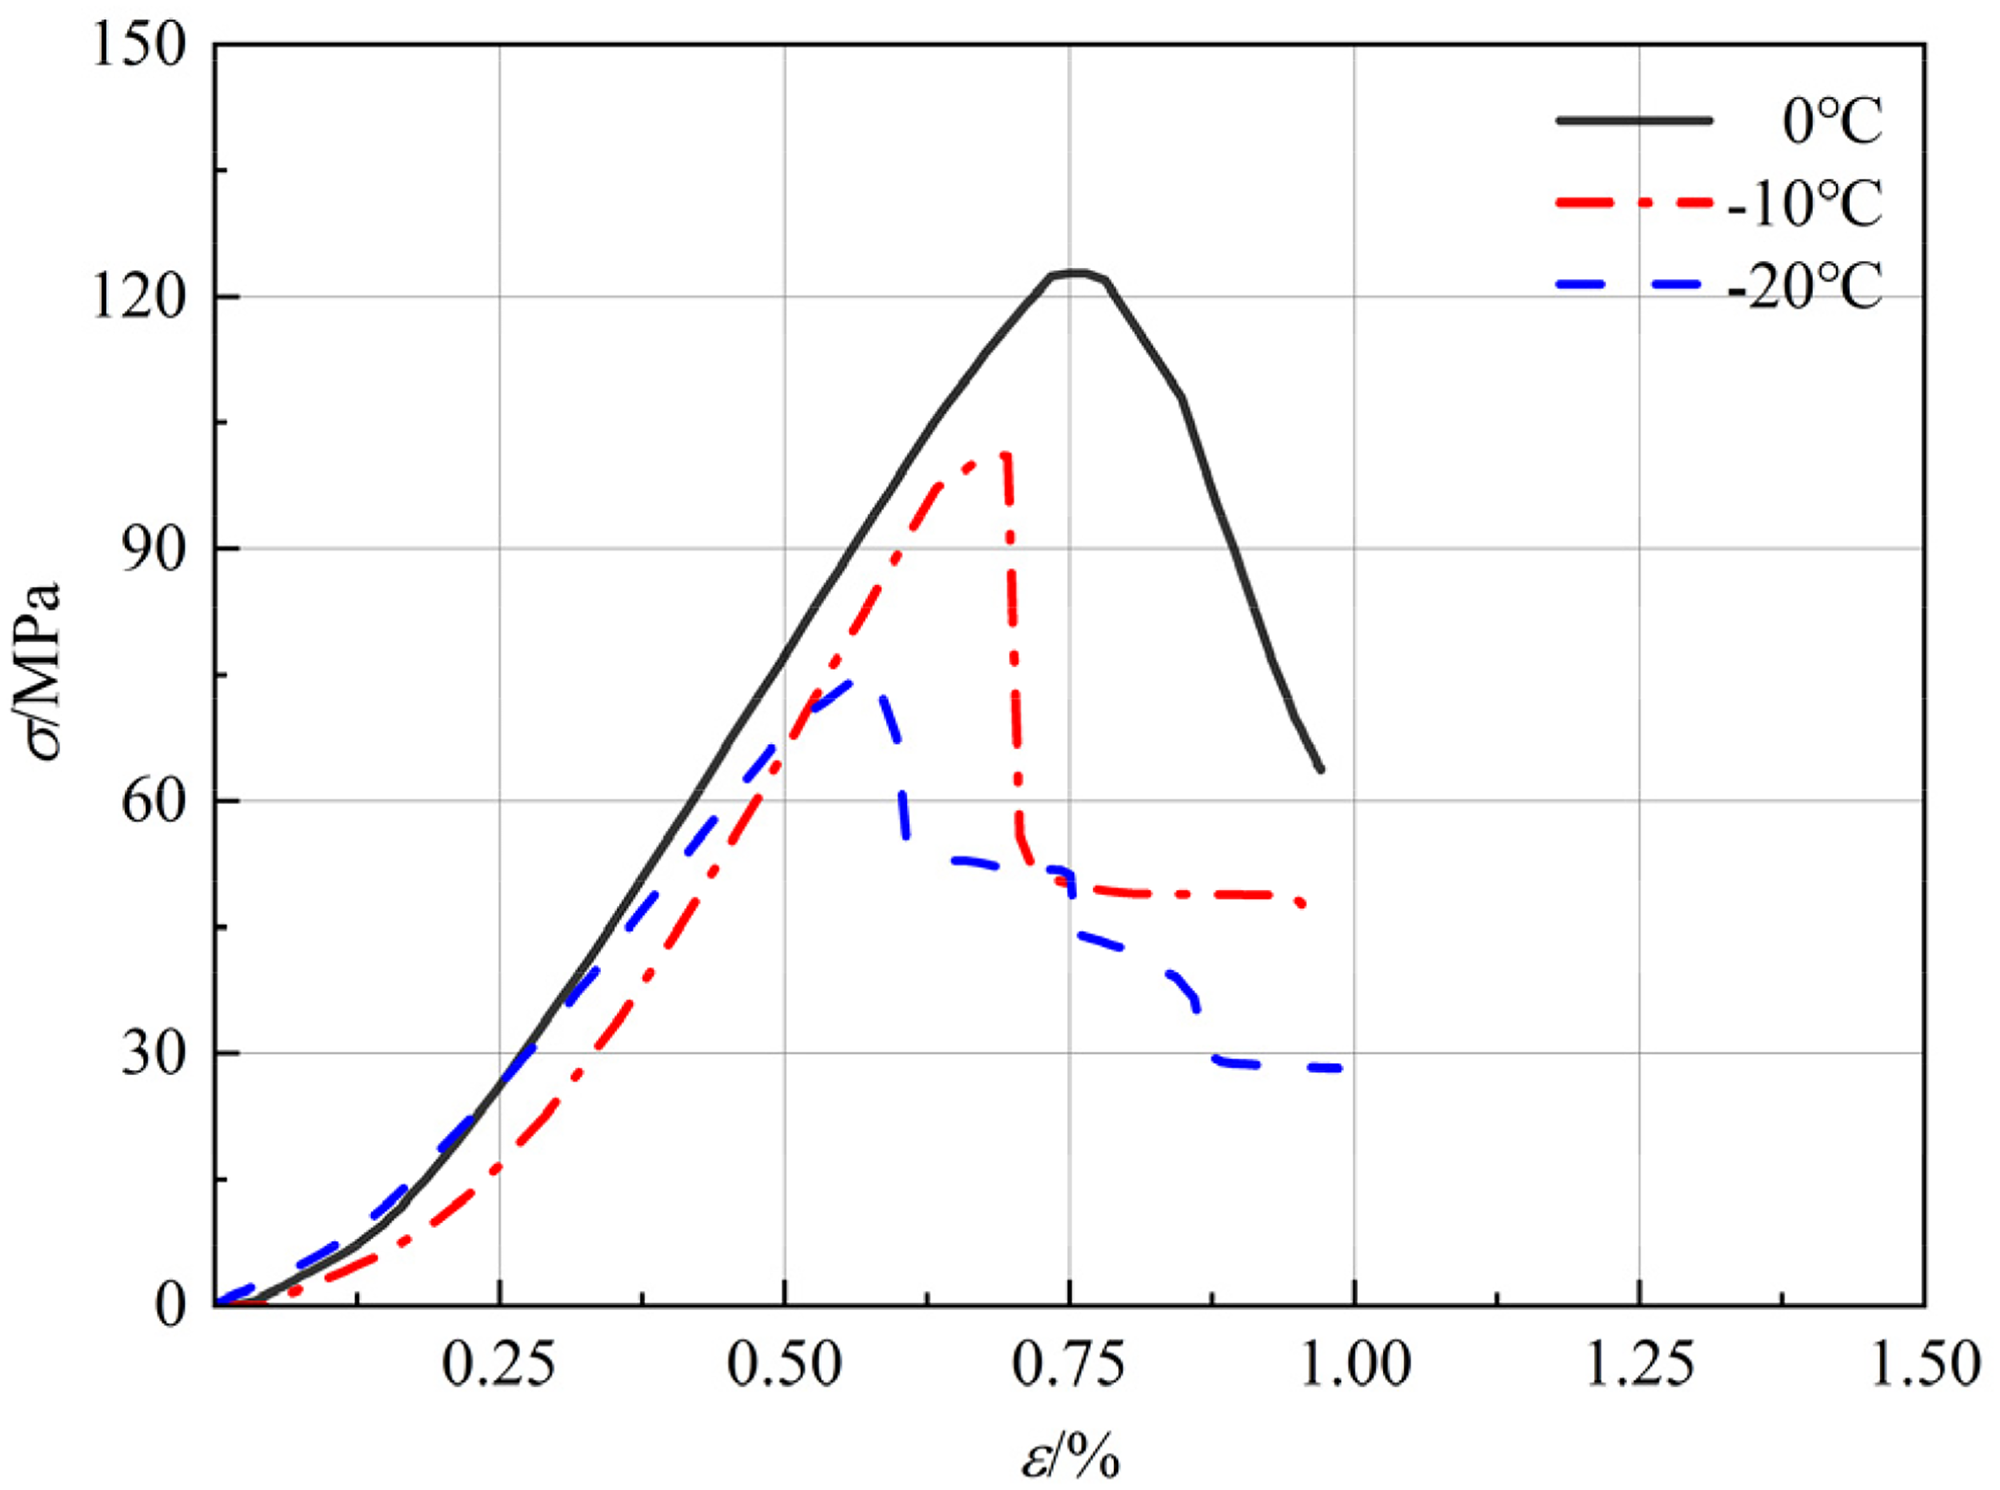
Uniaxial compression stress–strain curve of the tuff specimens.
From the changes observed in the curves in Figure 9, it can be seen that the uniaxial compressive strength of water-saturated specimen’s decreases as the temperature drops, and the strain corresponding to the peak stress also decreases with lower temperatures. At 0 °C, the stress–strain curve of the specimen exhibits more pronounced plastic-elastic behavior, with a relatively long compaction phase. As the temperature decreases, this compaction phase significantly shortens. Furthermore, a temperature drop from 0 °C to −20 °C induces a profound 38.9% degradation in the compressive strength of water-saturated specimens, underscoring the critical thermal sensitivity of the saturated rock mass.
Under fully saturated conditions, exposing the tuff specimens to subzero environments triggers the in-situ crystallization of interstitial pore water. Because the intrinsic strength of the resulting ice (typically 3.9–8.0 MPa) is vastly inferior to the rock matrix, the macroscopic compressive capacity of the specimen is inherently compromised. Concurrently, this water-to-ice phase transition induces severe volumetric expansion within the existing void and fissure networks. This internal frost heave effect directly elevates the overall porosity, further deteriorating the rock's structural integrity. Ultimately, given the pronounced hydrophilic nature of the tuff, its mechanical degradation is critically governed by these coupled thermohydrological dynamics.
By taking the tangent modulus from the uniaxial compression test curves of the specimen at different temperatures, the elastic modulus of the specimen at various temperatures can be obtained, as shown in Figure 10. As illustrated, the elastic modulus of the specimen at different temperatures was fitted using a second-degree polynomial. The fitting results are as follows:
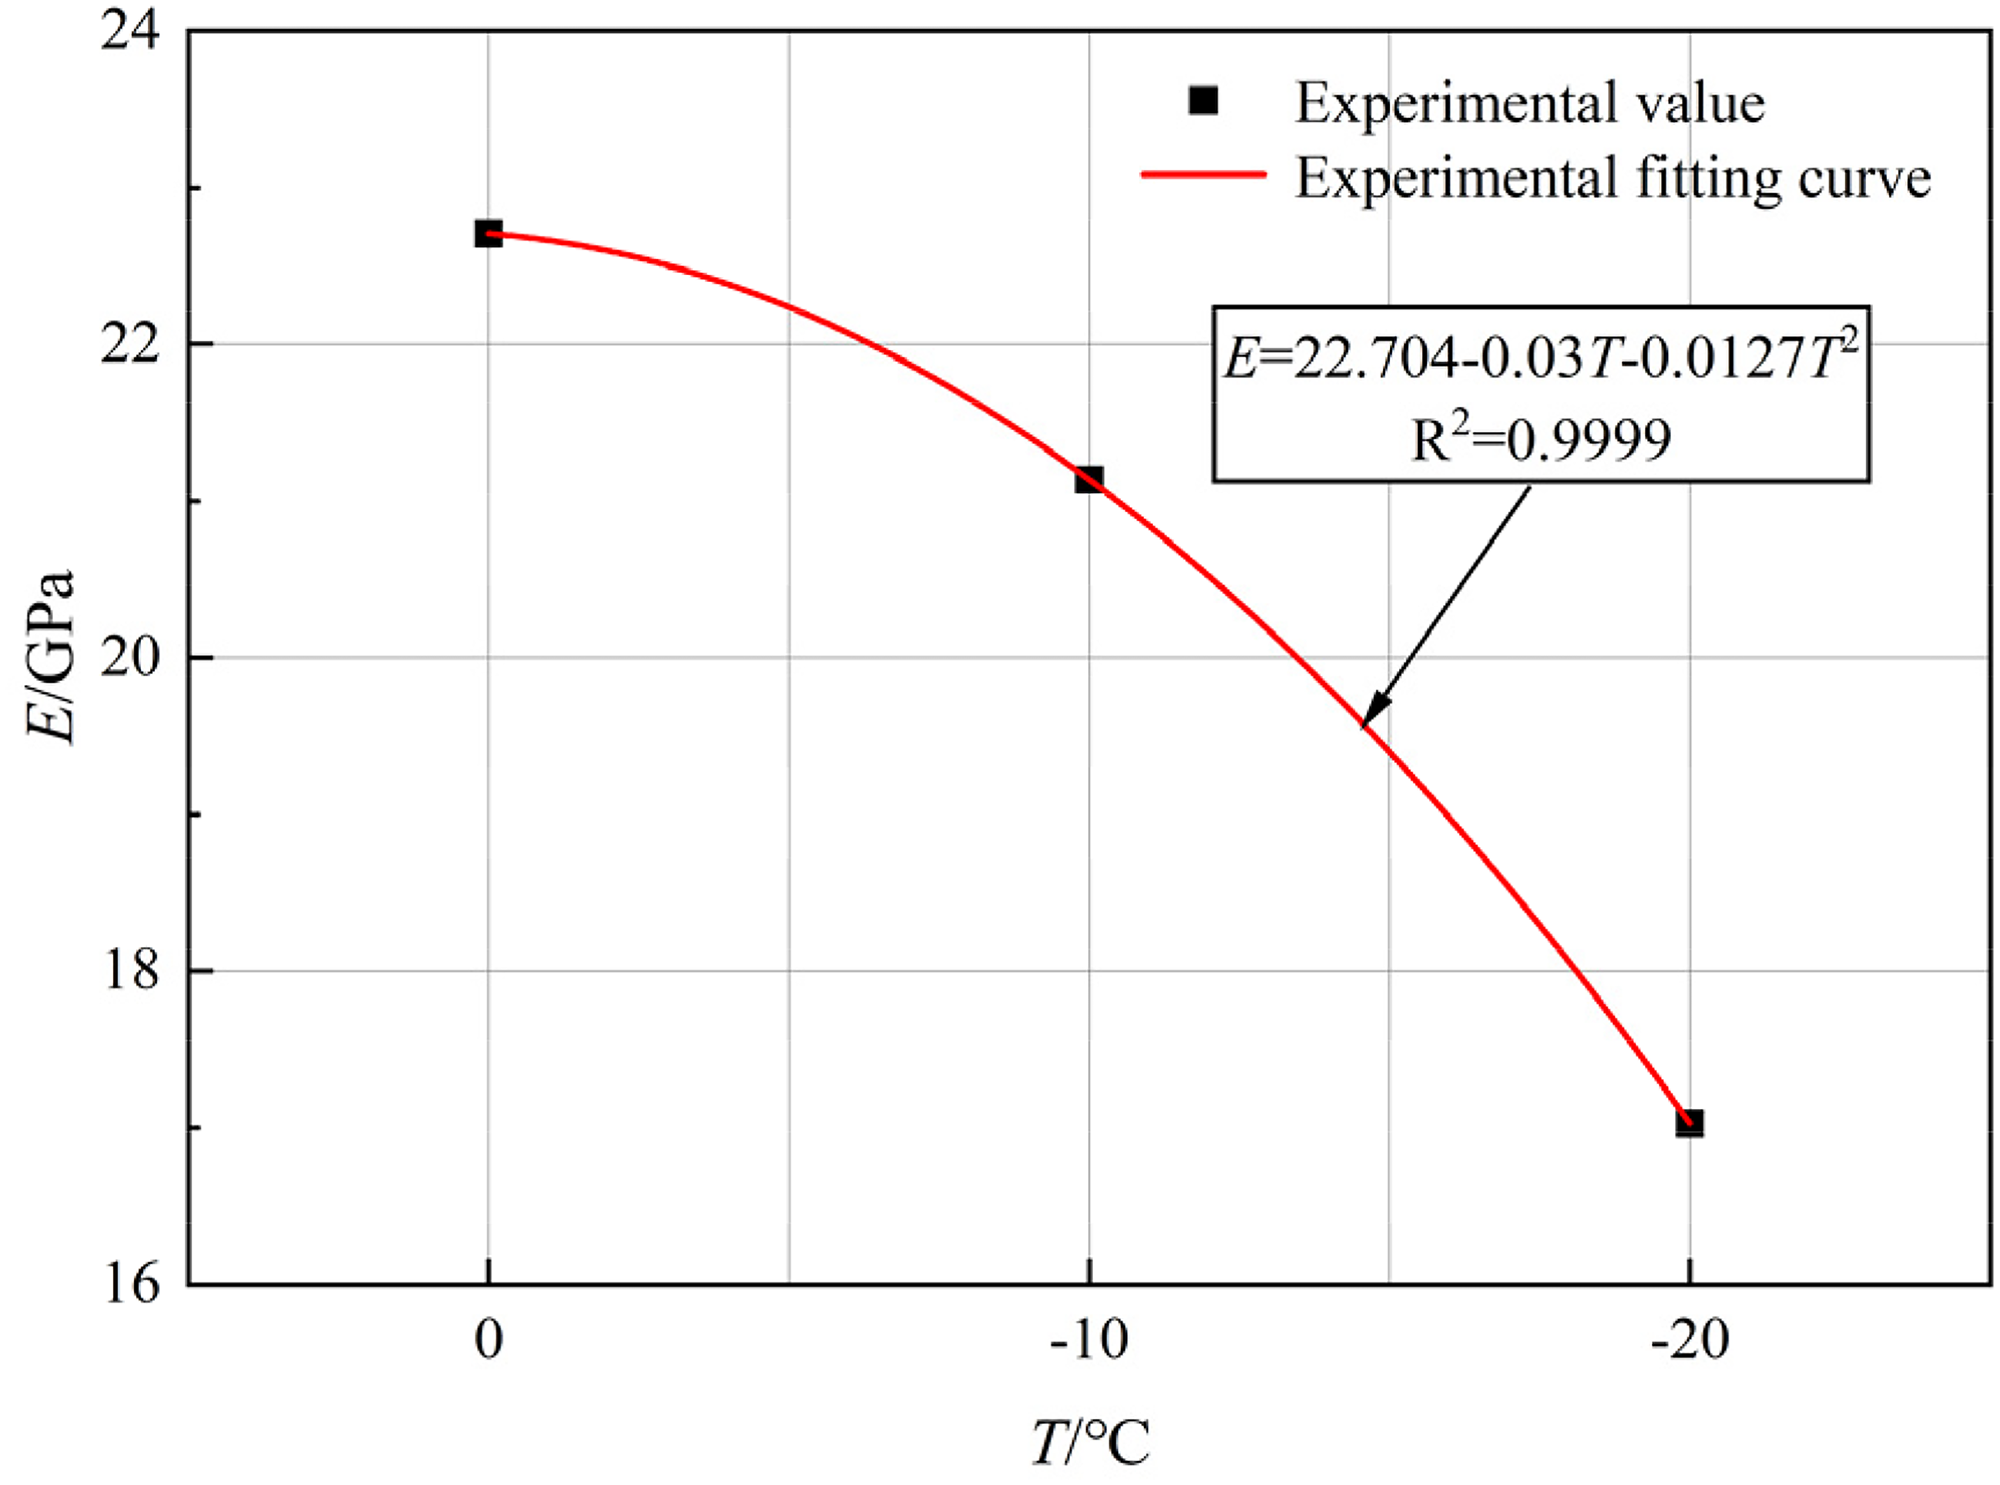
The variation of elastic modulus of specimens with temperature.
In equation (3), E represents the elastic modulus of the specimen, and T represents the test temperature.
Triaxial compressive mechanical properties
The stress–strain curves of the tuff specimens are shown in Figure 11. From the shape of the stress–strain curves, it can be observed that during the triaxial compression test, the tuff specimen undergoes four deformation stages: compaction, elastic, plastic yield, and failure.
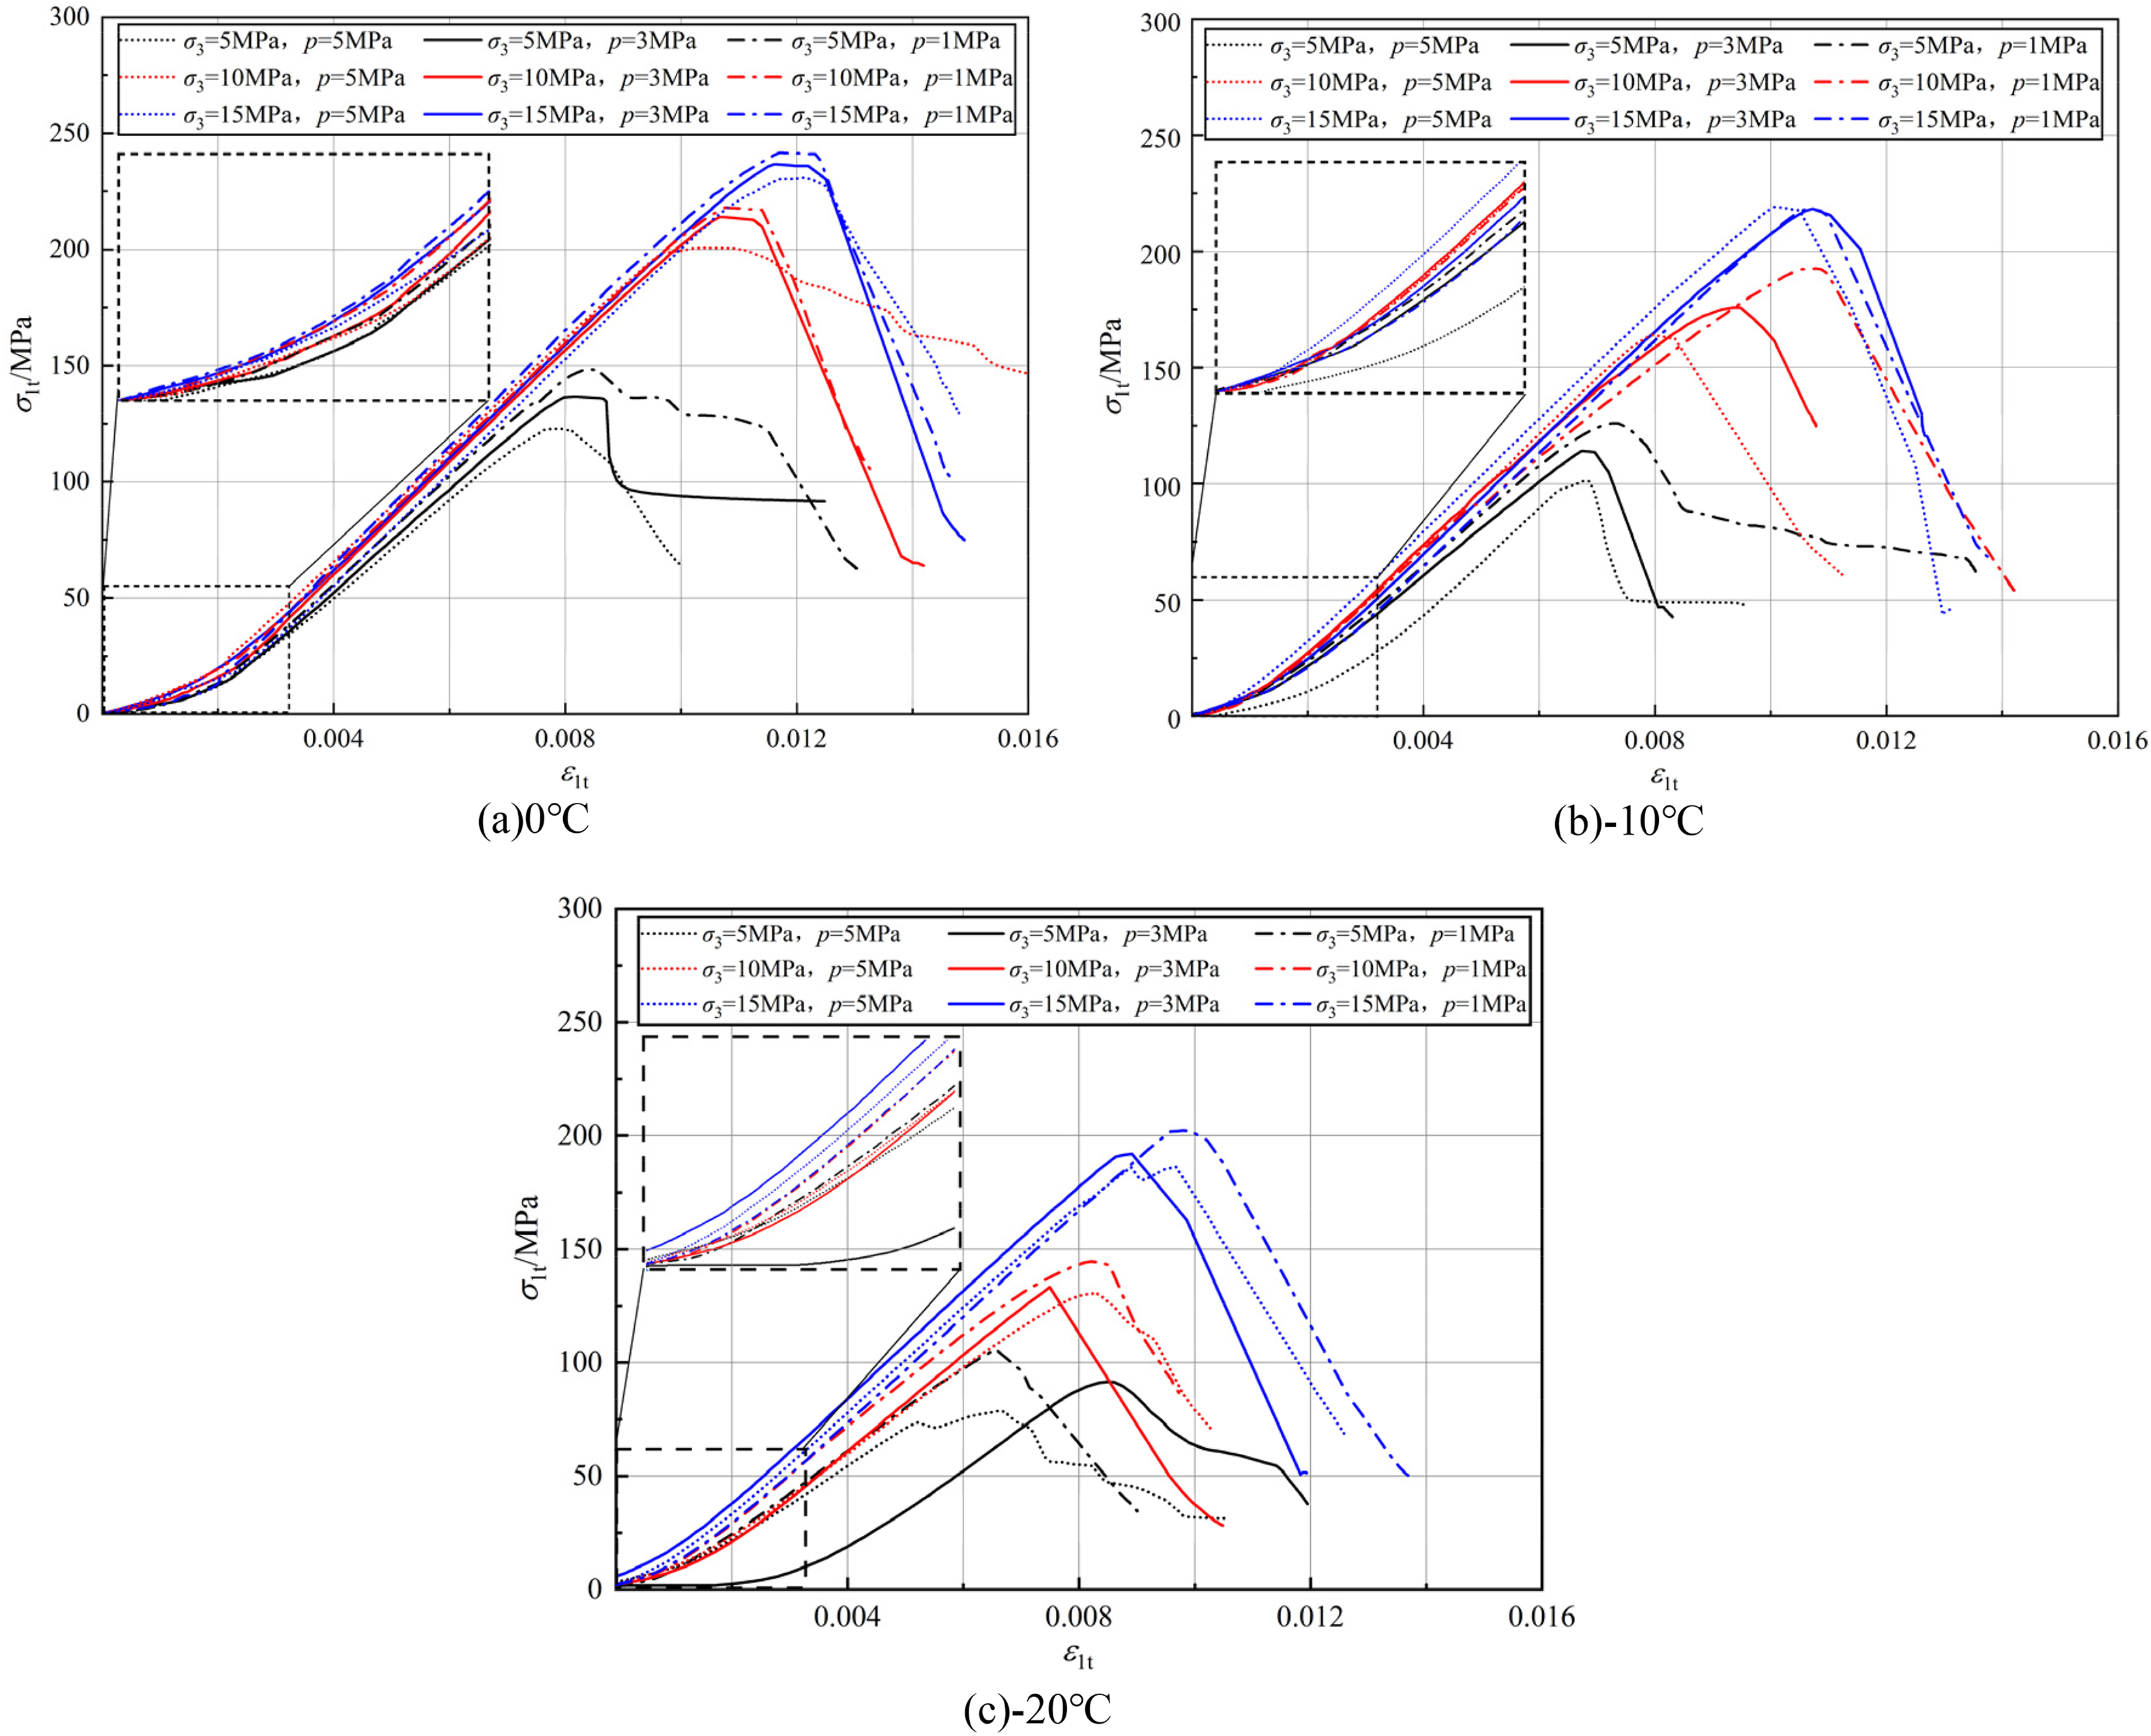
Stress–strain curves of the tuff specimens. (a) 0 °C, (b) −10 °C, (c) −20 °C.
The figure indicates that during the elastic stage, the slope of strength increase in specimen becomes steeper as the confining pressure increases. A noticeable prolongation of the initial compaction stage is observed within the stress–strain profiles as the experimental temperature declines. This expansion of the compaction region becomes particularly evident at the −20 °C threshold, reflecting the increased initial structural voids induced by lower temperatures. Additionally, as the test temperature decreases, the plastic yield stage of the specimen gradually shortens until it almost disappears, the stress drop in the post-peak residual stage accelerates, and the rock failure becomes more severe, displaying more pronounced brittleness.
The curves also reveal that at a constant temperature, the peak stress at failure increases progressively with higher confining pressure, while it slightly decreases with increasing pore pressure. The transition toward a more ductile failure mode and enhanced plastic deformation capacity is evidenced by the upward shift in peak strain as confining pressure rises. Notably, the peak strain response appears to be independent of pore pressure fluctuations, suggesting a lack of sensitivity to hydraulic boundary conditions in this regard. When the confining pressure is constant, the peak strain of the specimen decreases as the test temperature decreases.
The evolutionary trends of peak stress in response to varying temperature gradients, confining pressures, and pore pressures are comprehensively delineated in Figure 12.
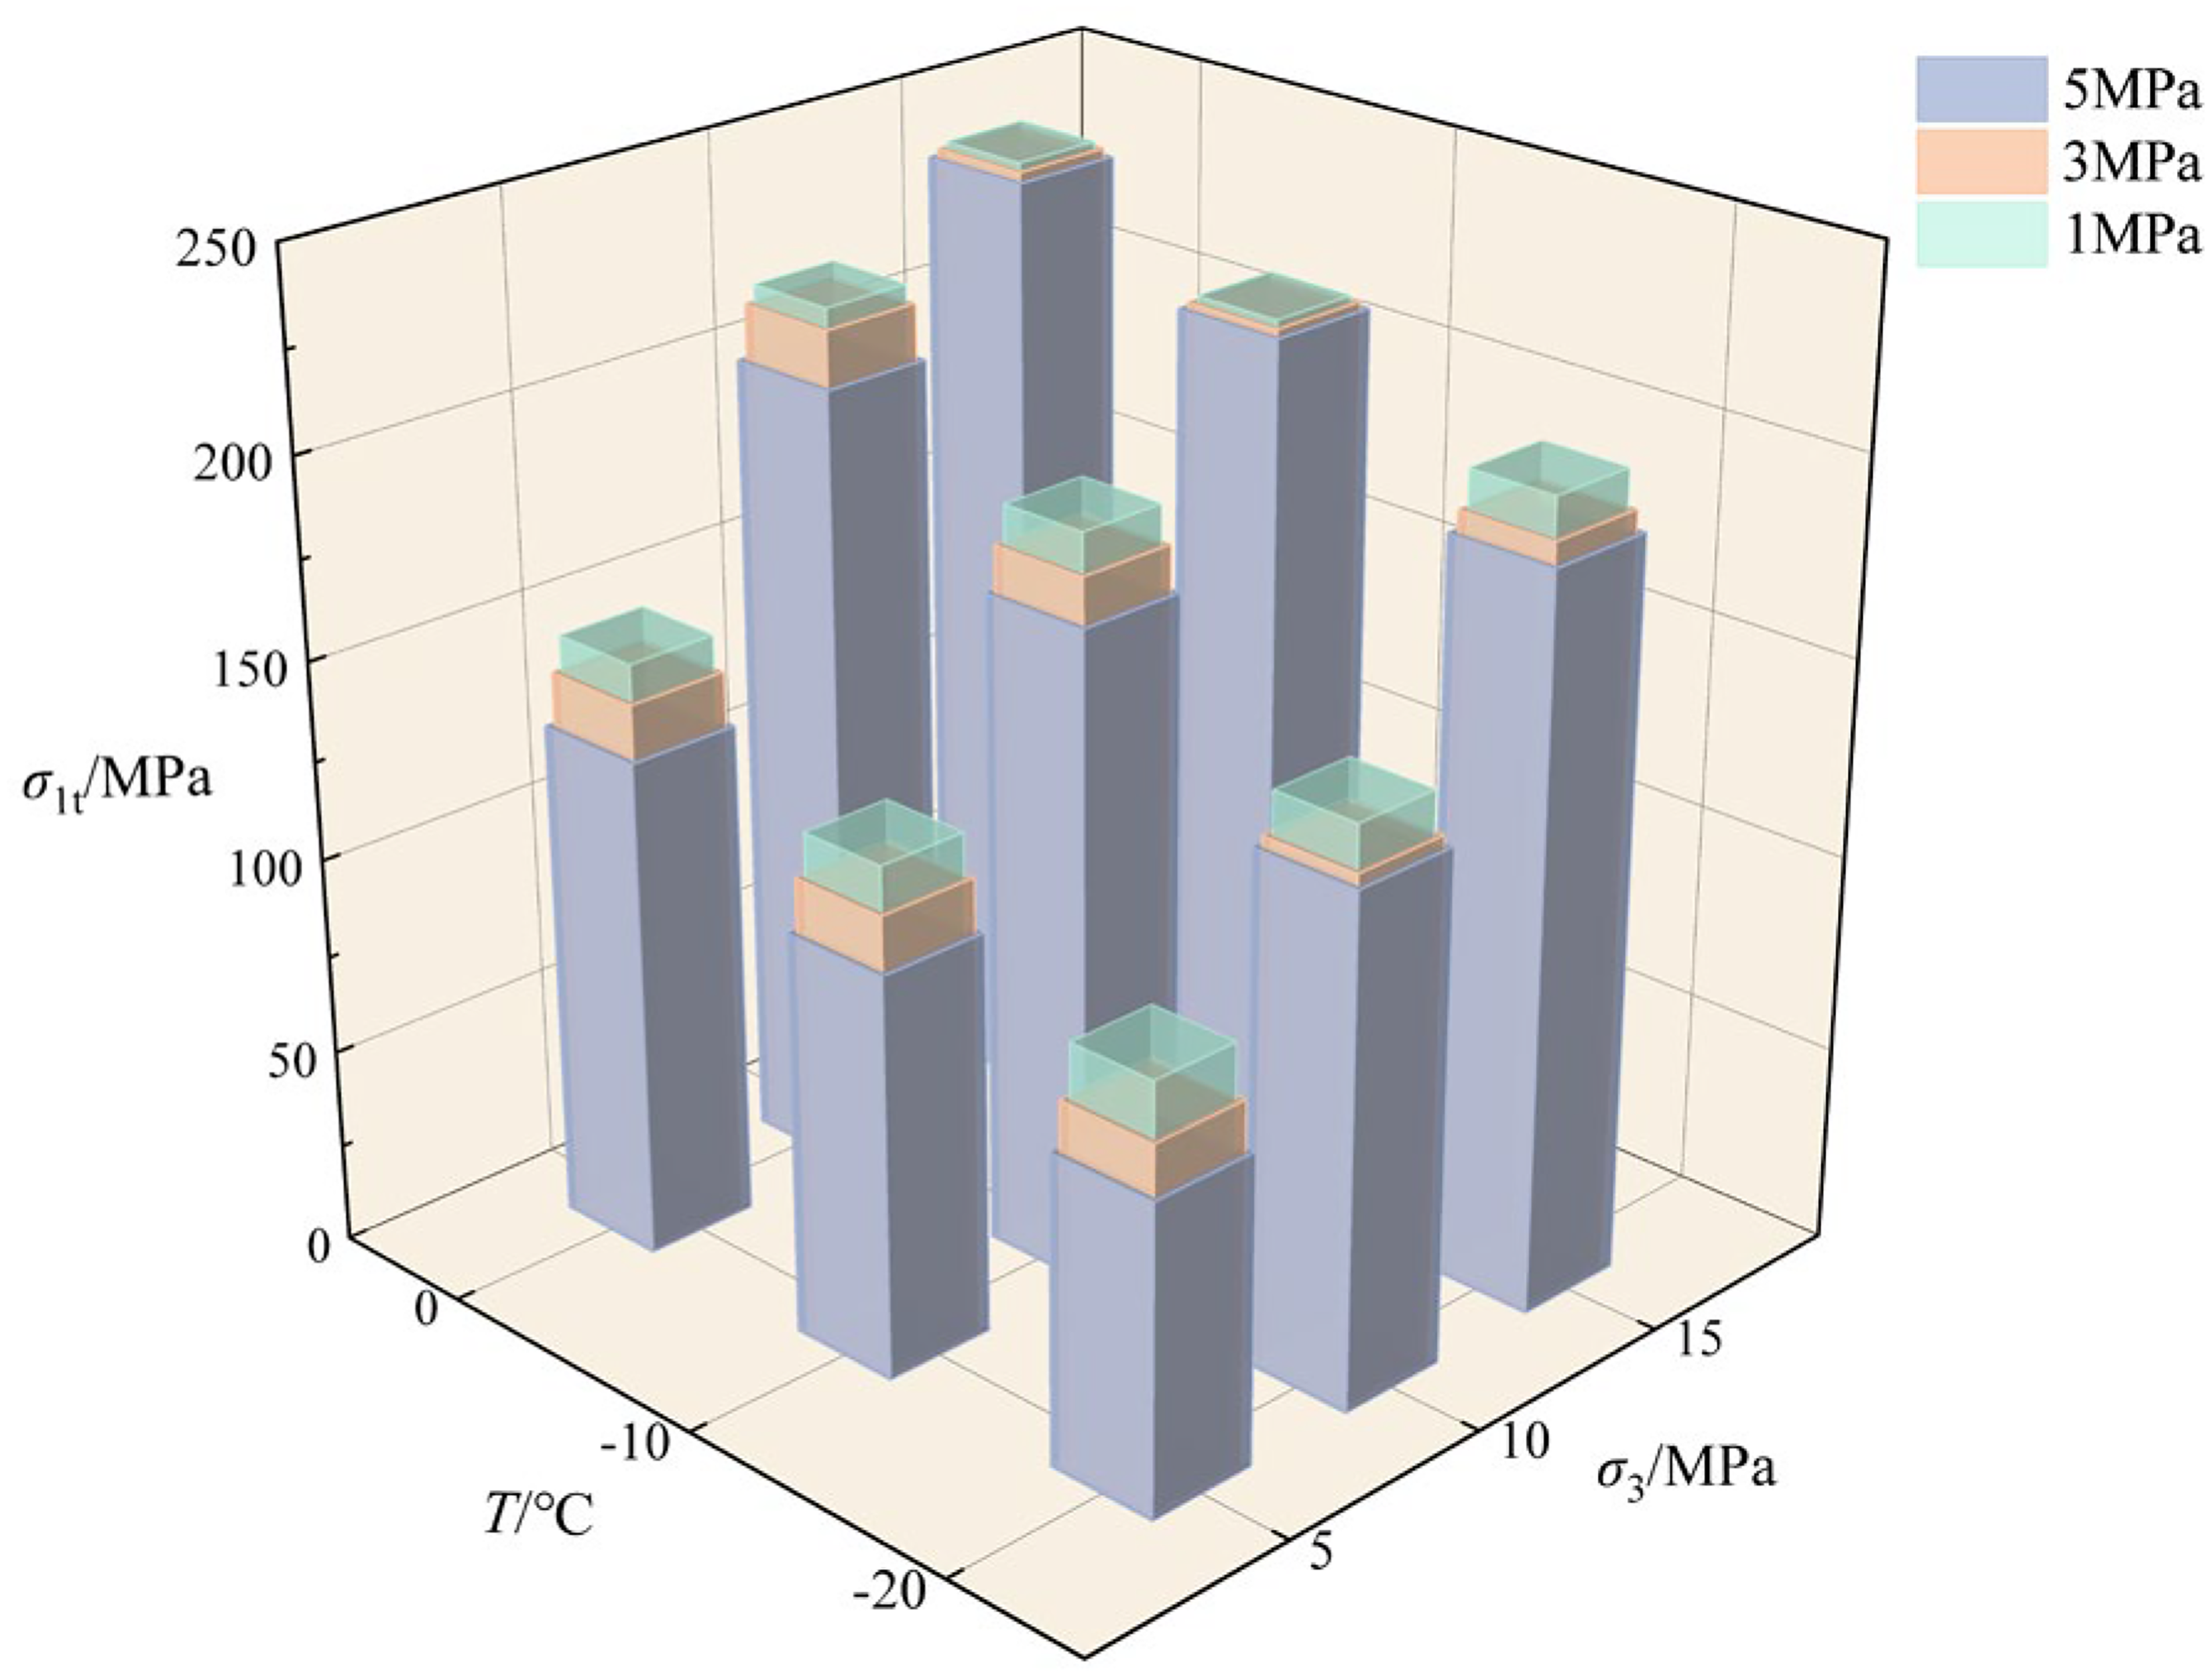
The relationship between specimen strength and temperature, confining pressure, and seepage pressure.
At a constant confining pressure of 15 MPa, the specimens exhibit a clear thermal degradation trend, where peak strength is negatively correlated with declining temperatures. Notably, this mechanical response appears to be predominantly governed by thermal conditions rather than pore pressure, which exerts a negligible effect (Figure 12). However, when the confining pressure is reduced to 10 and 5 MPa, the strength of the specimen becomes increasingly affected by pore pressure.
The interactive influence of confining pressure, pore pressure, and temperature on tuff strength is delineated in Figure 13. Across all thermal conditions, the peak strength consistently reaches its maximum under the 15 MPa confining pressure/1 MPa pore pressure regime, while the minimum is observed at 5 and 5 MPa, respectively. The gradients within the coordinate projections reveal that the rock's load-bearing capacity is predominantly governed by radial confinement, which exerts a significantly more profound impact than hydraulic pore pressure. Notably, at high confinement (15 MPa), the peak stress remains relatively stable despite variations in pore pressure. This suggests that elevated confining pressure induces a robust compaction effect that effectively suppresses the deleterious impact of internal fluid pressure. Consequently, the hierarchy of factors influencing tuff strength is identified as: confining pressure > temperature > pore pressure.
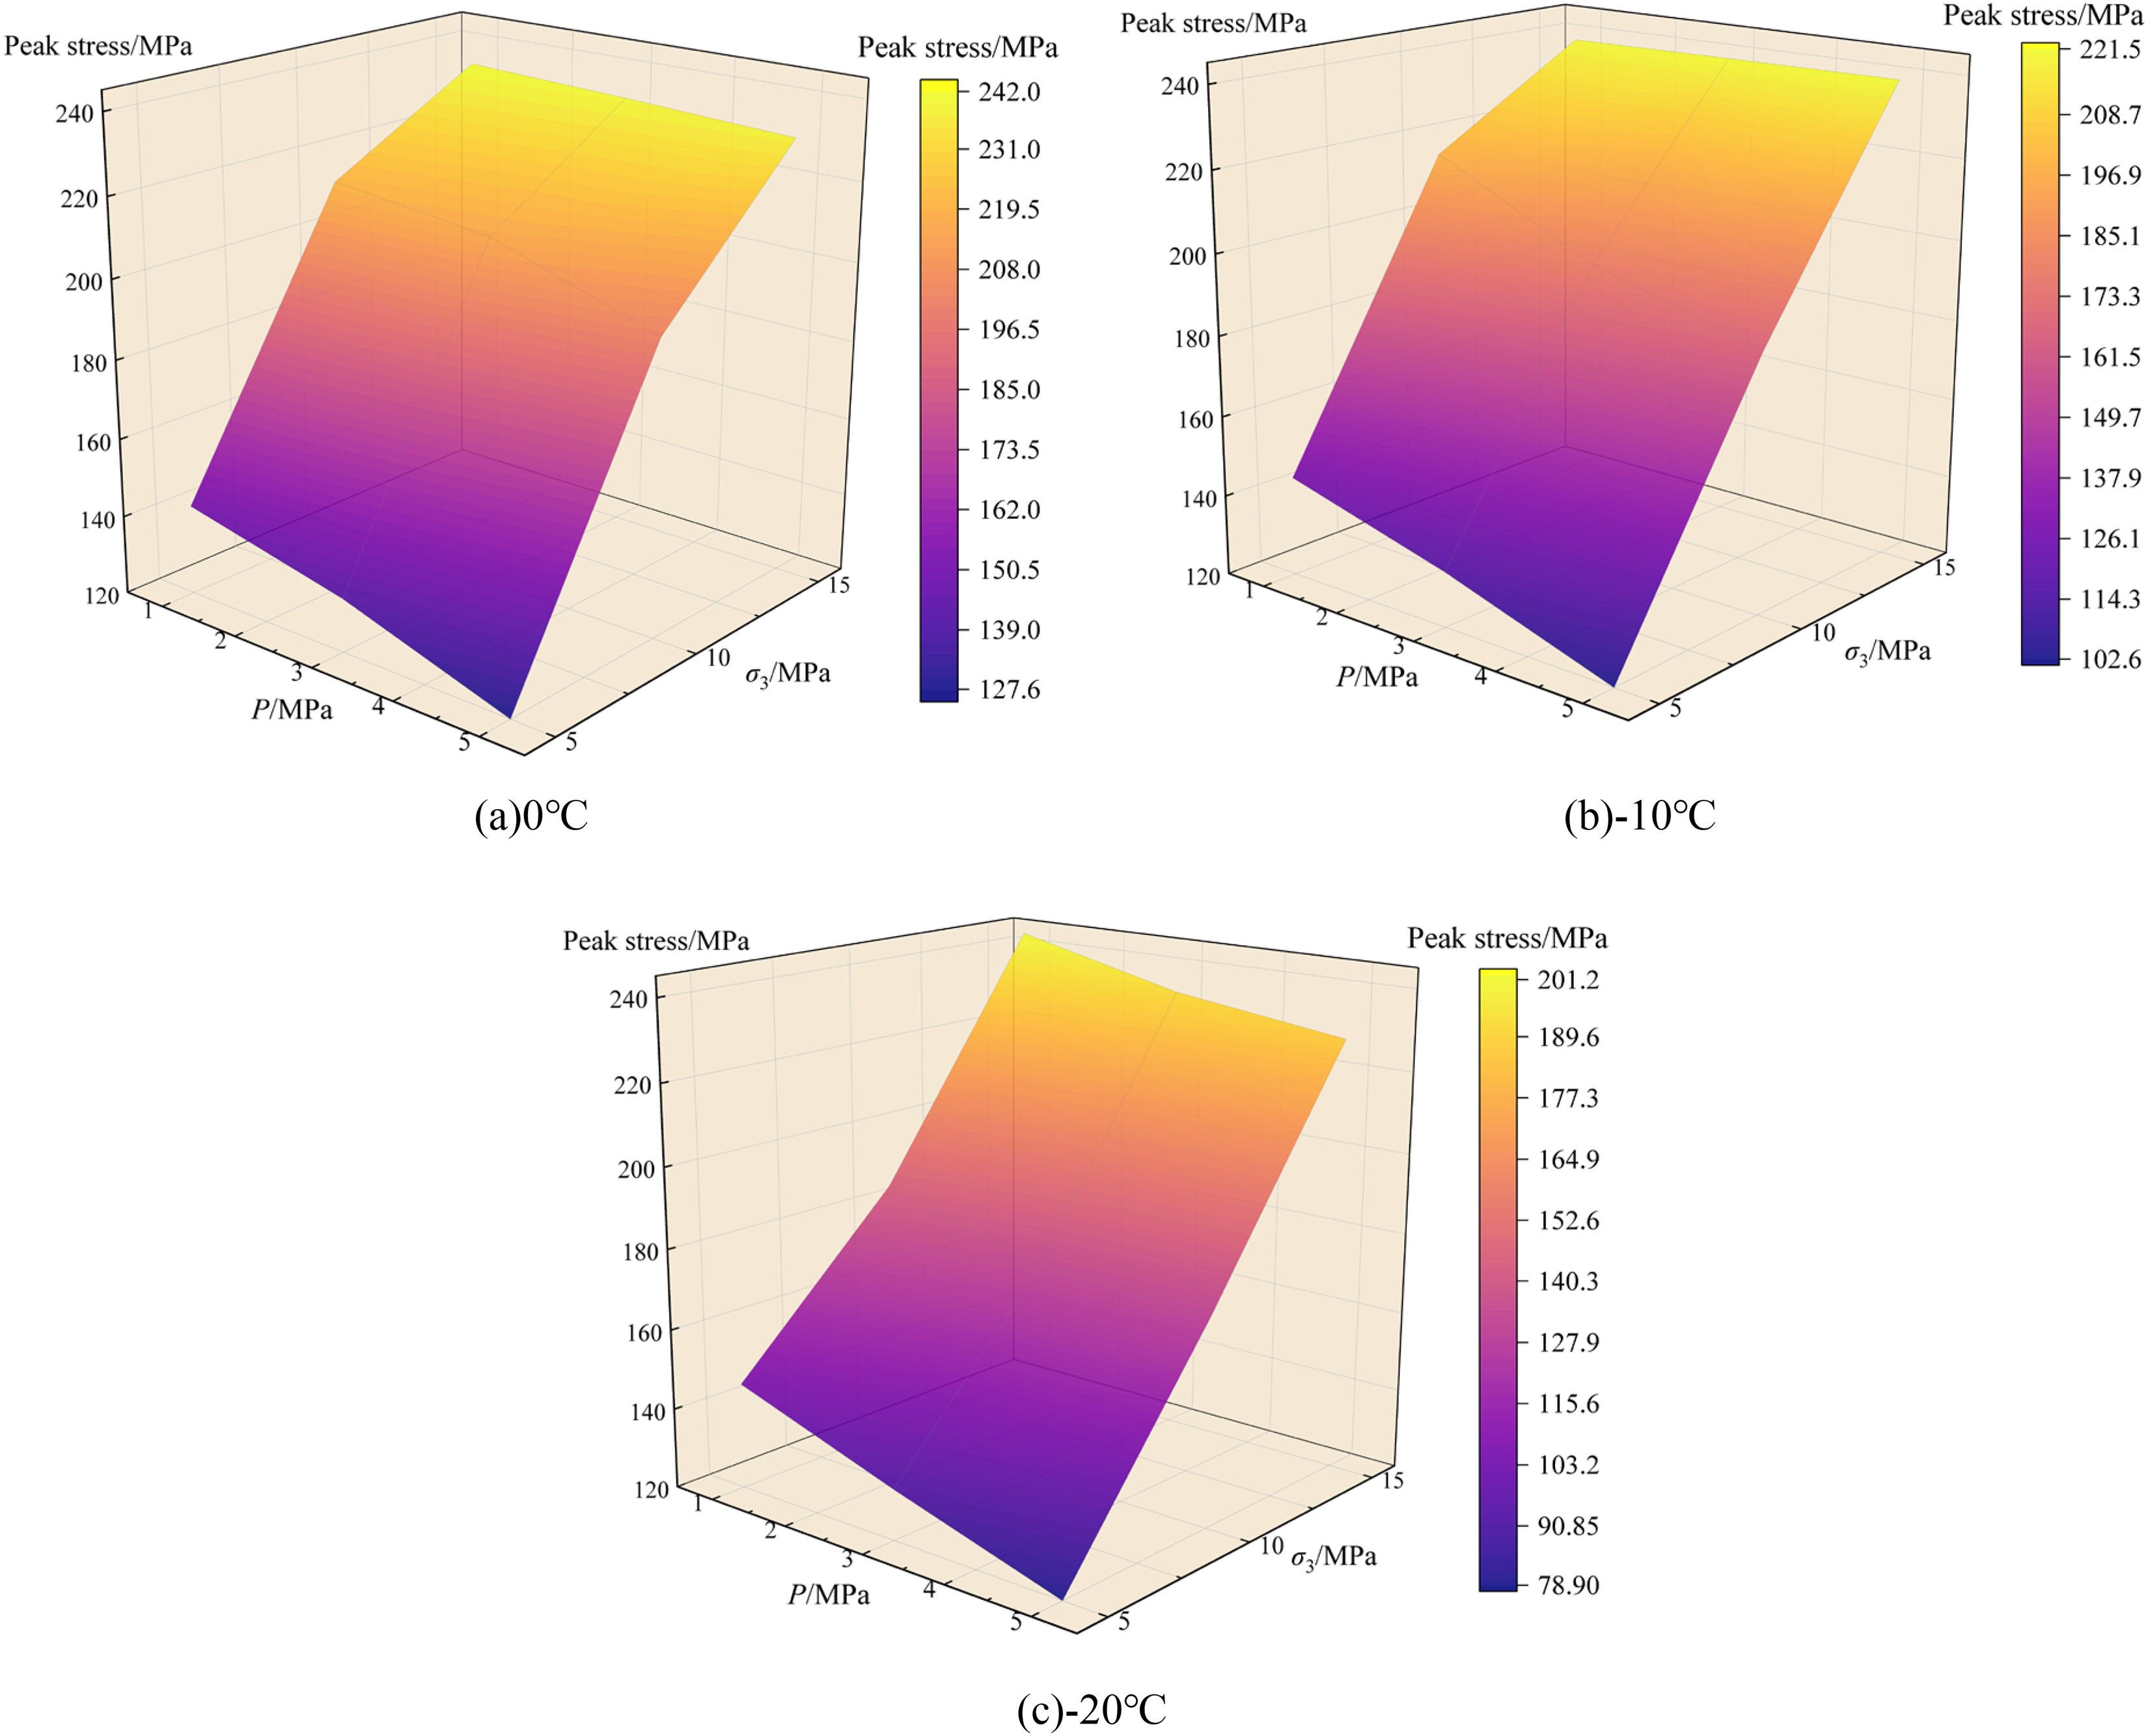
The variation law of tuff specimen strength with confining pressure and seepage pressure. (a) 0 °C, (b) −10 °C, (c) −20 °C.
In summary, low-temperature curing leads to the deterioration of the rock mechanics parameters of the specimen. As the curing temperature decreases, the peak stress of the specimen shows a decreasing trend, and the peak strain also decreases, indicating that under low-temperature conditions, even with relatively small stress, the tuff specimen can experience significant deformation or even sudden failure. When water-saturated specimens are subjected to low-temperature curing, the freeze-thaw effects caused by water-ice phase transitions generate substantial tensile and compressive stresses within the rock's internal framework, leading to structural damage. Different loading conditions further induce various forms of rock failure.
Based on the peak strength data of triaxial compression specimens under different curing temperatures, confining pressures, and seepage pressures, a multifactor fitted relationship for peak strength was obtained:
Equation (4) quantitatively describes the combined effects of temperature, confining pressure, and seepage pressure on the peak strength of tuff and demonstrates a satisfactory fitting performance. The results indicate that both temperature and confining pressure have a positive correlation with peak strength; as these two factors increase, the peak strength of the tuff increases significantly. Moreover, confining pressure exerts a more pronounced influence on peak strength compared with temperature. Conversely, elevated seepage pressure significantly attenuates the peak strength, underscoring the deleterious impact of hydraulic gradients on the rock's overall mechanical stability.
Figure 14 presents the three-dimensional response surfaces of residual strength and brittleness index under temperature–stress–seepage coupling conditions. To further understand the rock's behavior, the interplay between confining pressure and temperature, and their subsequent impact on the specimens’ mechanical properties, was systematically scrutinized across various pore water pressure regimes.
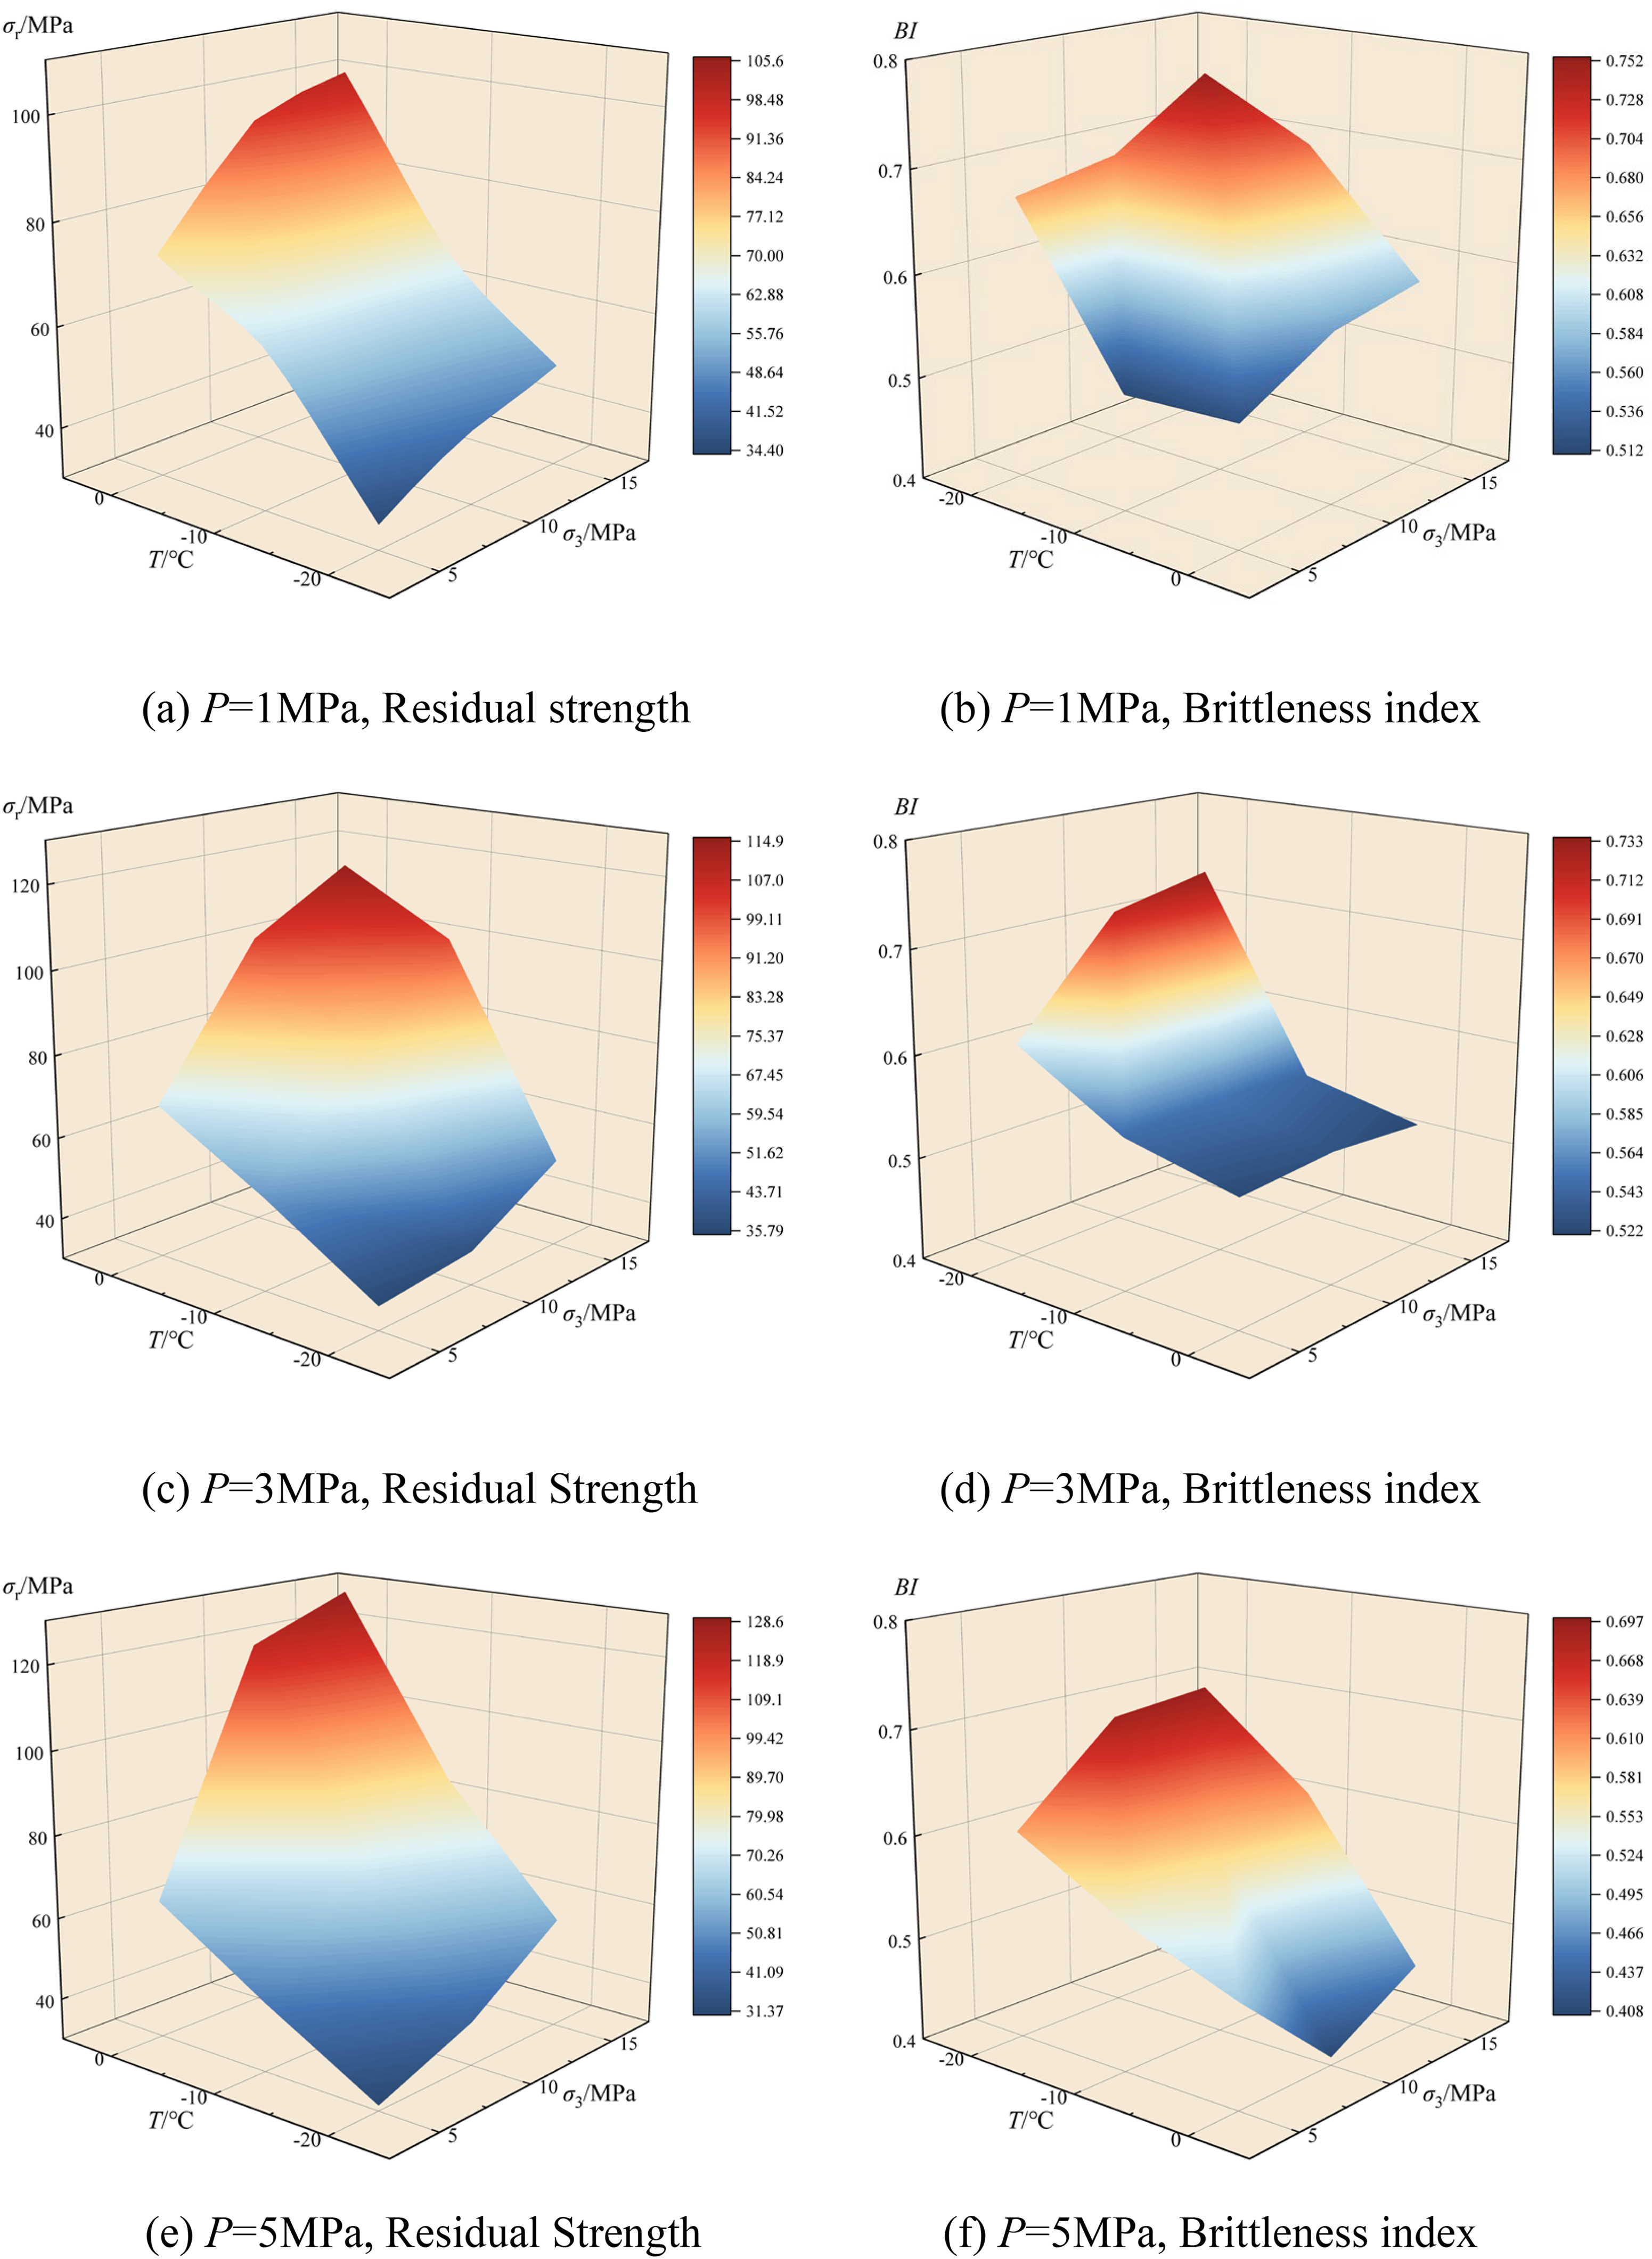
3D surface plot of residual strength and brittleness index. (a) P = 1 MPa, residual strength, (b) P = 1 MPa, brittleness index, (c) P = 3 MPa, residual strength, (d) P = 3 MPa, brittleness index, (e) P = 5 MPa, residual strength, (f) P = 5 MPa, brittleness index.
Figure 14(a), (c), and (e) illustrates the evolution characteristics of residual strength under multifactor coupling. Progressive cooling from 0 °C to −20 °C triggers a marked escalation in residual strength, suggesting that subzero temperatures effectively reinforce the internal structural stability of the fractured rock matrix. Meanwhile, increasing confining pressure continuously promotes the growth of residual strength. Across all pore water pressure levels, the peak residual strength consistently occurs under the combined conditions of low temperature and high confining pressure, demonstrating a robust and consistent pattern.
Figure 14(b), (d), and (f) presents the spatial distribution characteristics of the brittleness index. The results indicate that decreasing temperature significantly increases the brittleness index, suggesting that specimens are more prone to brittle failure under low-temperature conditions. In contrast, the brittleness index decreases markedly with increasing confining pressure, indicating that higher confining pressure effectively suppresses brittle failure and facilitates a transition in material behavior from brittle to ductile. Overall, the most pronounced brittle behavior is concentrated under conditions of low temperature and low confining pressure.
A systematic comparison of results across 1, 3, and 5 MPa pore pressure gradients demonstrates how hydraulic conditions fundamentally modulate the material's mechanical response. The observed decline in the peak brittleness index with rising pore water pressure suggests that elevated hydraulic heads attenuate the inherent brittleness, thereby mitigating the risk of catastrophic rupture. Concurrently, the escalation of maximum residual strength alongside pore pressure implies that under the synergistic influence of subzero temperatures and high radial confinement, internal fluid pressure may bolster post-peak load-bearing capacity by optimizing fracture closure mechanisms or the mechanical resistance of interstitial ice.
Seepage mechanical properties
In the stress–seepage coupled tests, the permeability of tuff was determined using the steady-state flow method in conjunction with Darcy's law (equation (5)). This experimental framework is specifically tailored for quantifying the hydraulic attributes of tight tuff matrices, enabling the precise derivation of permeability coefficients under equilibrated flow conditions:
In this equation, μ denotes the dynamic viscosity of the seepage fluid (Pa·s); L is the specimen height (m); Q represents the cumulative seepage volume over the time interval Δt (m3); A is the cross-sectional area of the specimen (m2); ΔP is the hydraulic pressure difference (Pa), defined as the difference between the inlet pressure P1 at the top of the specimen and the outlet pressure P2 at the bottom; and Δt is the seepage duration (s).
Figure 15 presents the full evolution curves of permeability versus axial strain for tuff specimens under 27 different working conditions, involving various combinations of temperature, confining pressure, and hydraulic pressure. Fundamentally, the evolutionary trajectory of permeability during the triaxial deformation process demonstrates a robust stage-dependency, intimately coupled with the rock's instantaneous stress–strain state. During the incipient loading regime, permeability profiles typically exhibit a plateau or a marginal downward trend. This response is primarily dictated by the stress-driven closure and consolidation of preexisting microfissures and pores, which effectively constricts the effective hydraulic conduits within the rock matrix. As axial strain continues to increase, the rock enters the stage of plastic yielding and eventually reaches macroscopic failure. During this stage, particularly at the terminal portions of certain curves (Figure 15(b), (f), and (h)), the permeability often exhibits a pronounced surge or intense fluctuations. Such a response reflects the accelerated nucleation, extension, and merger of microdefects. This process culminates in the development of macroscopic seepage pathways, fundamentally restructuring the rock's hydraulic architecture and enhancing its connectivity.
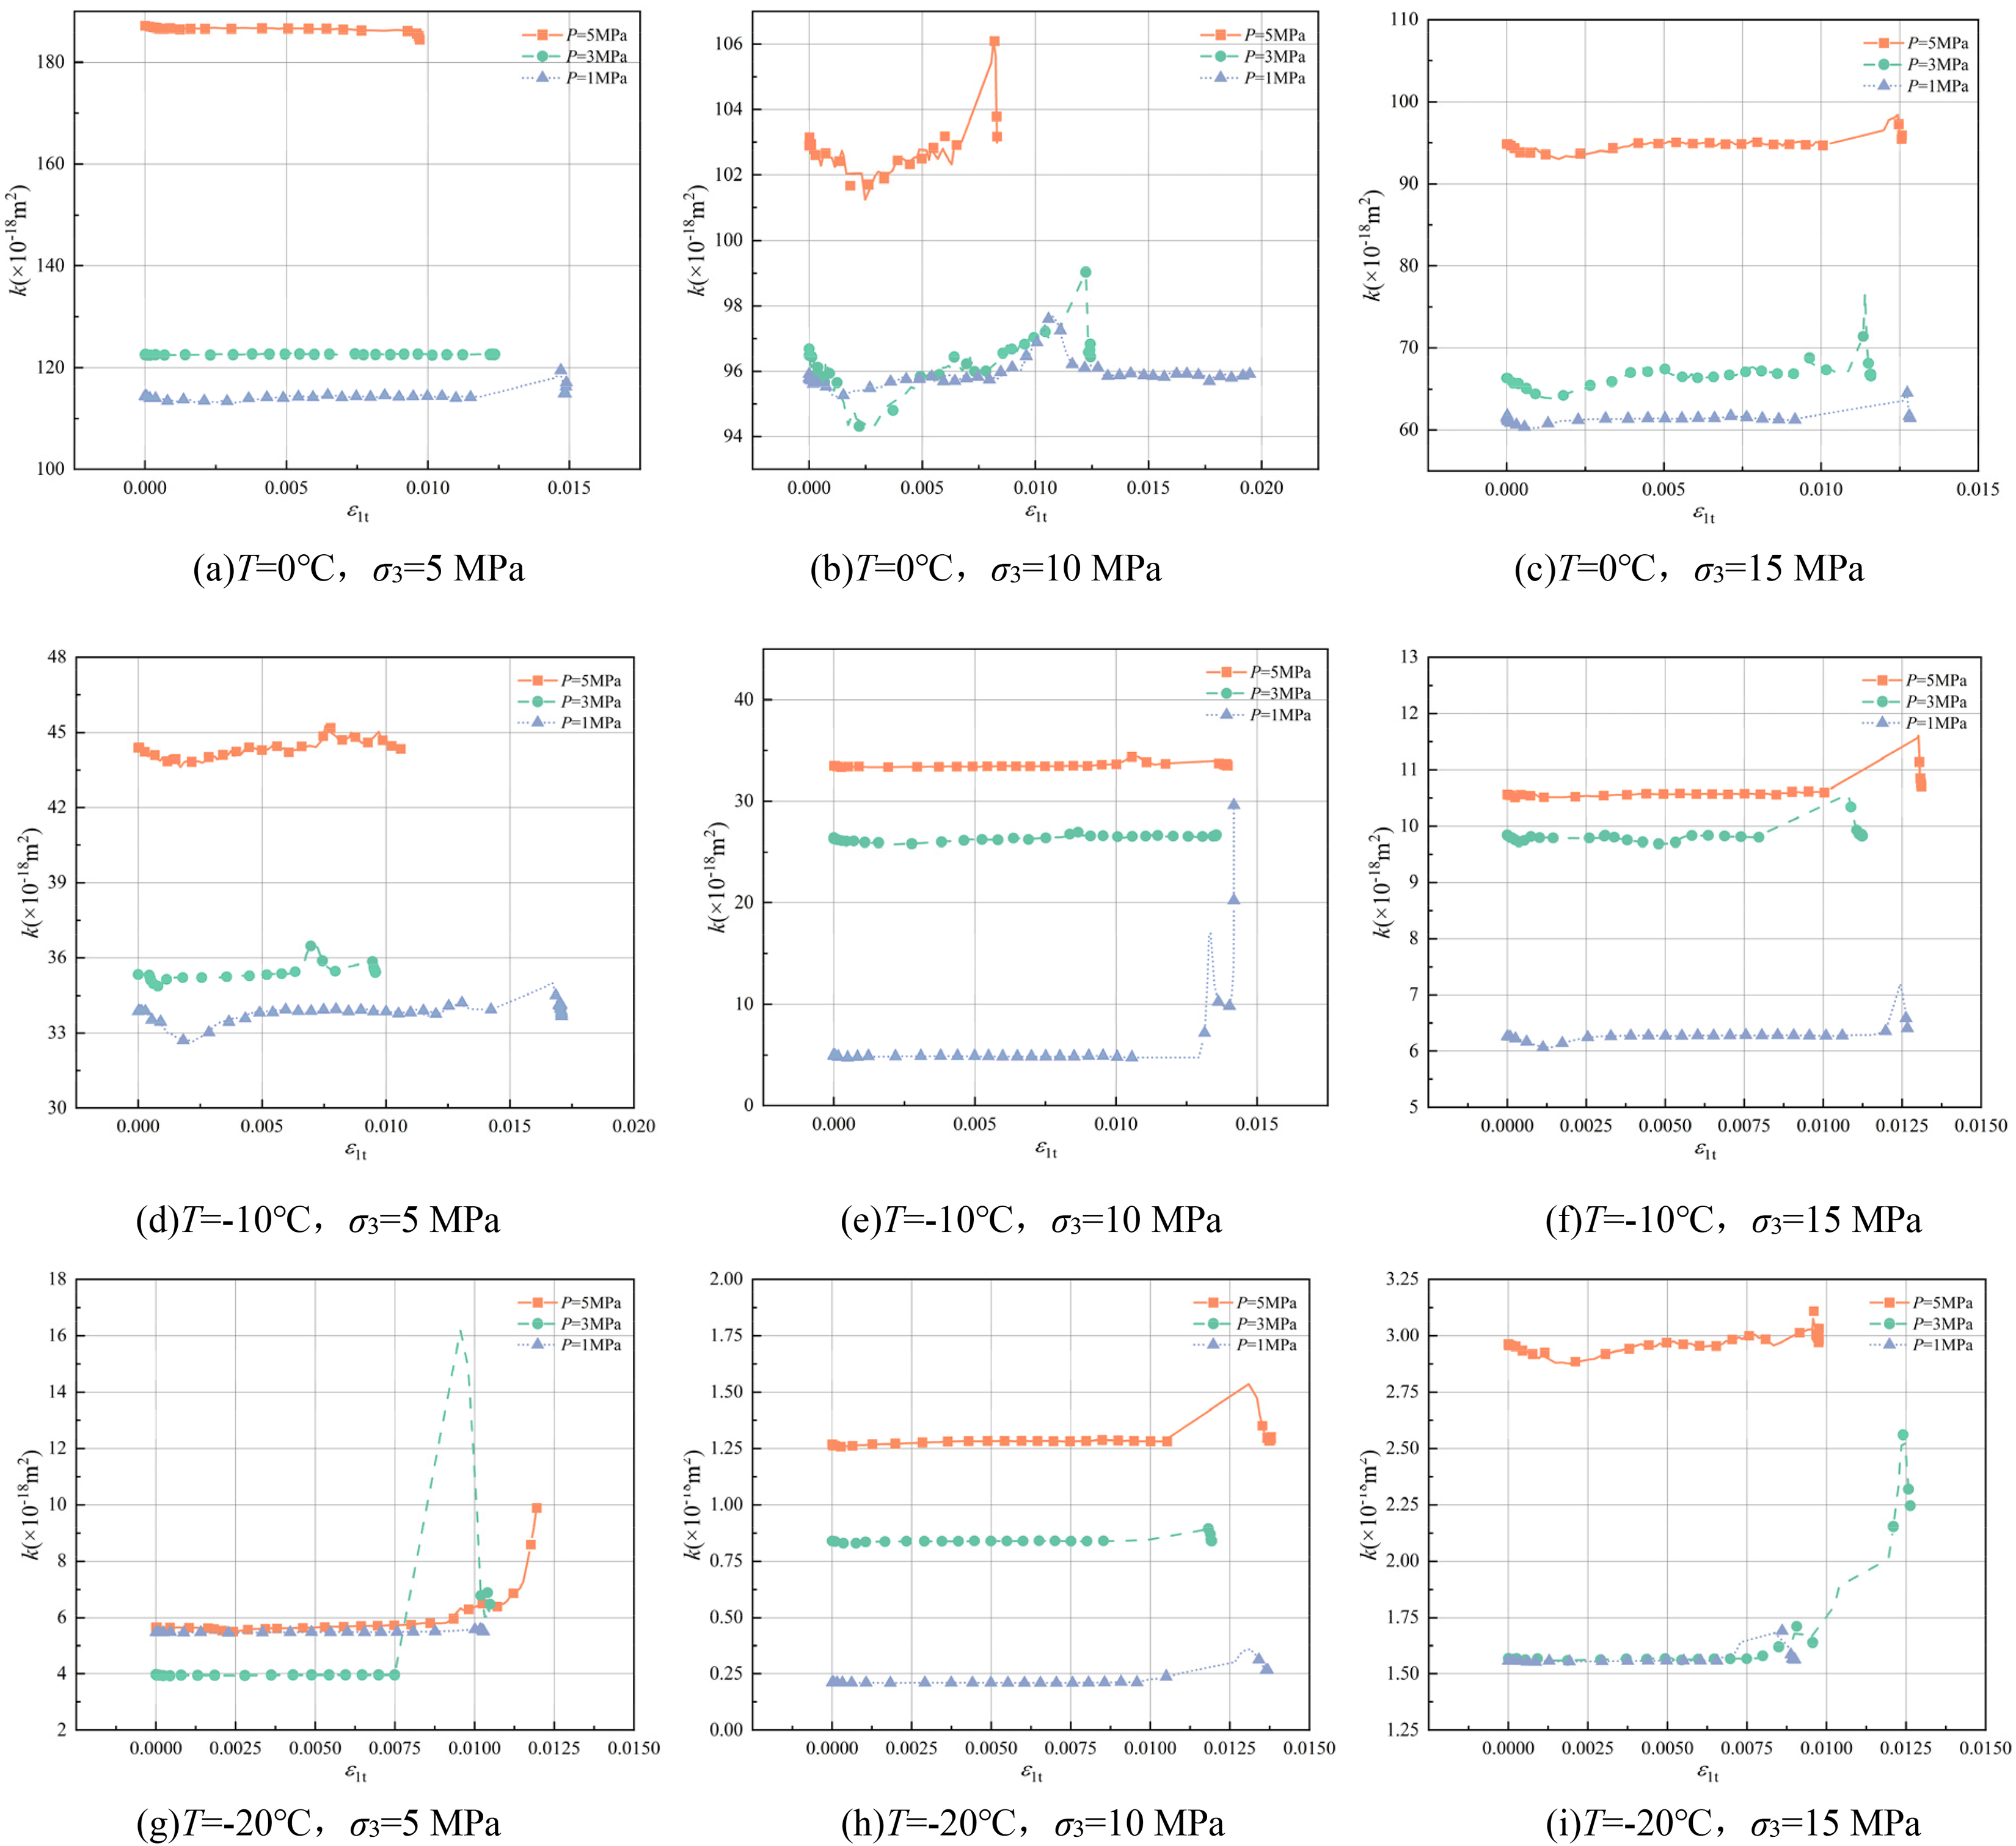
Permeability evolution curves during the whole loading process. (a) T = 0 °C, σ3 = 5 MPa, (b) T = 0 °C, σ3 = 10 MPa (c) T = 0 °C, σ3 = 15 MPa, (d)T = −10 °C, σ3 = 5 MPa, (e)T = −10 °C, σ3 = 10 MPa, (f) T = −10 °C, σ3 = 15 MPa, (g)T = −20 °C, σ3 = 5 MPa, (h) T = −20 °C, σ3 = 10 MPa, (i) T = −20 °C, σ3 = 15 MPa.
Figure 16 delineates the average permeability profiles of tuff specimens under the complex interplay of thermal conditioning, radial confinement, and hydraulic pressure, providing a clear overview of their distribution behavior.
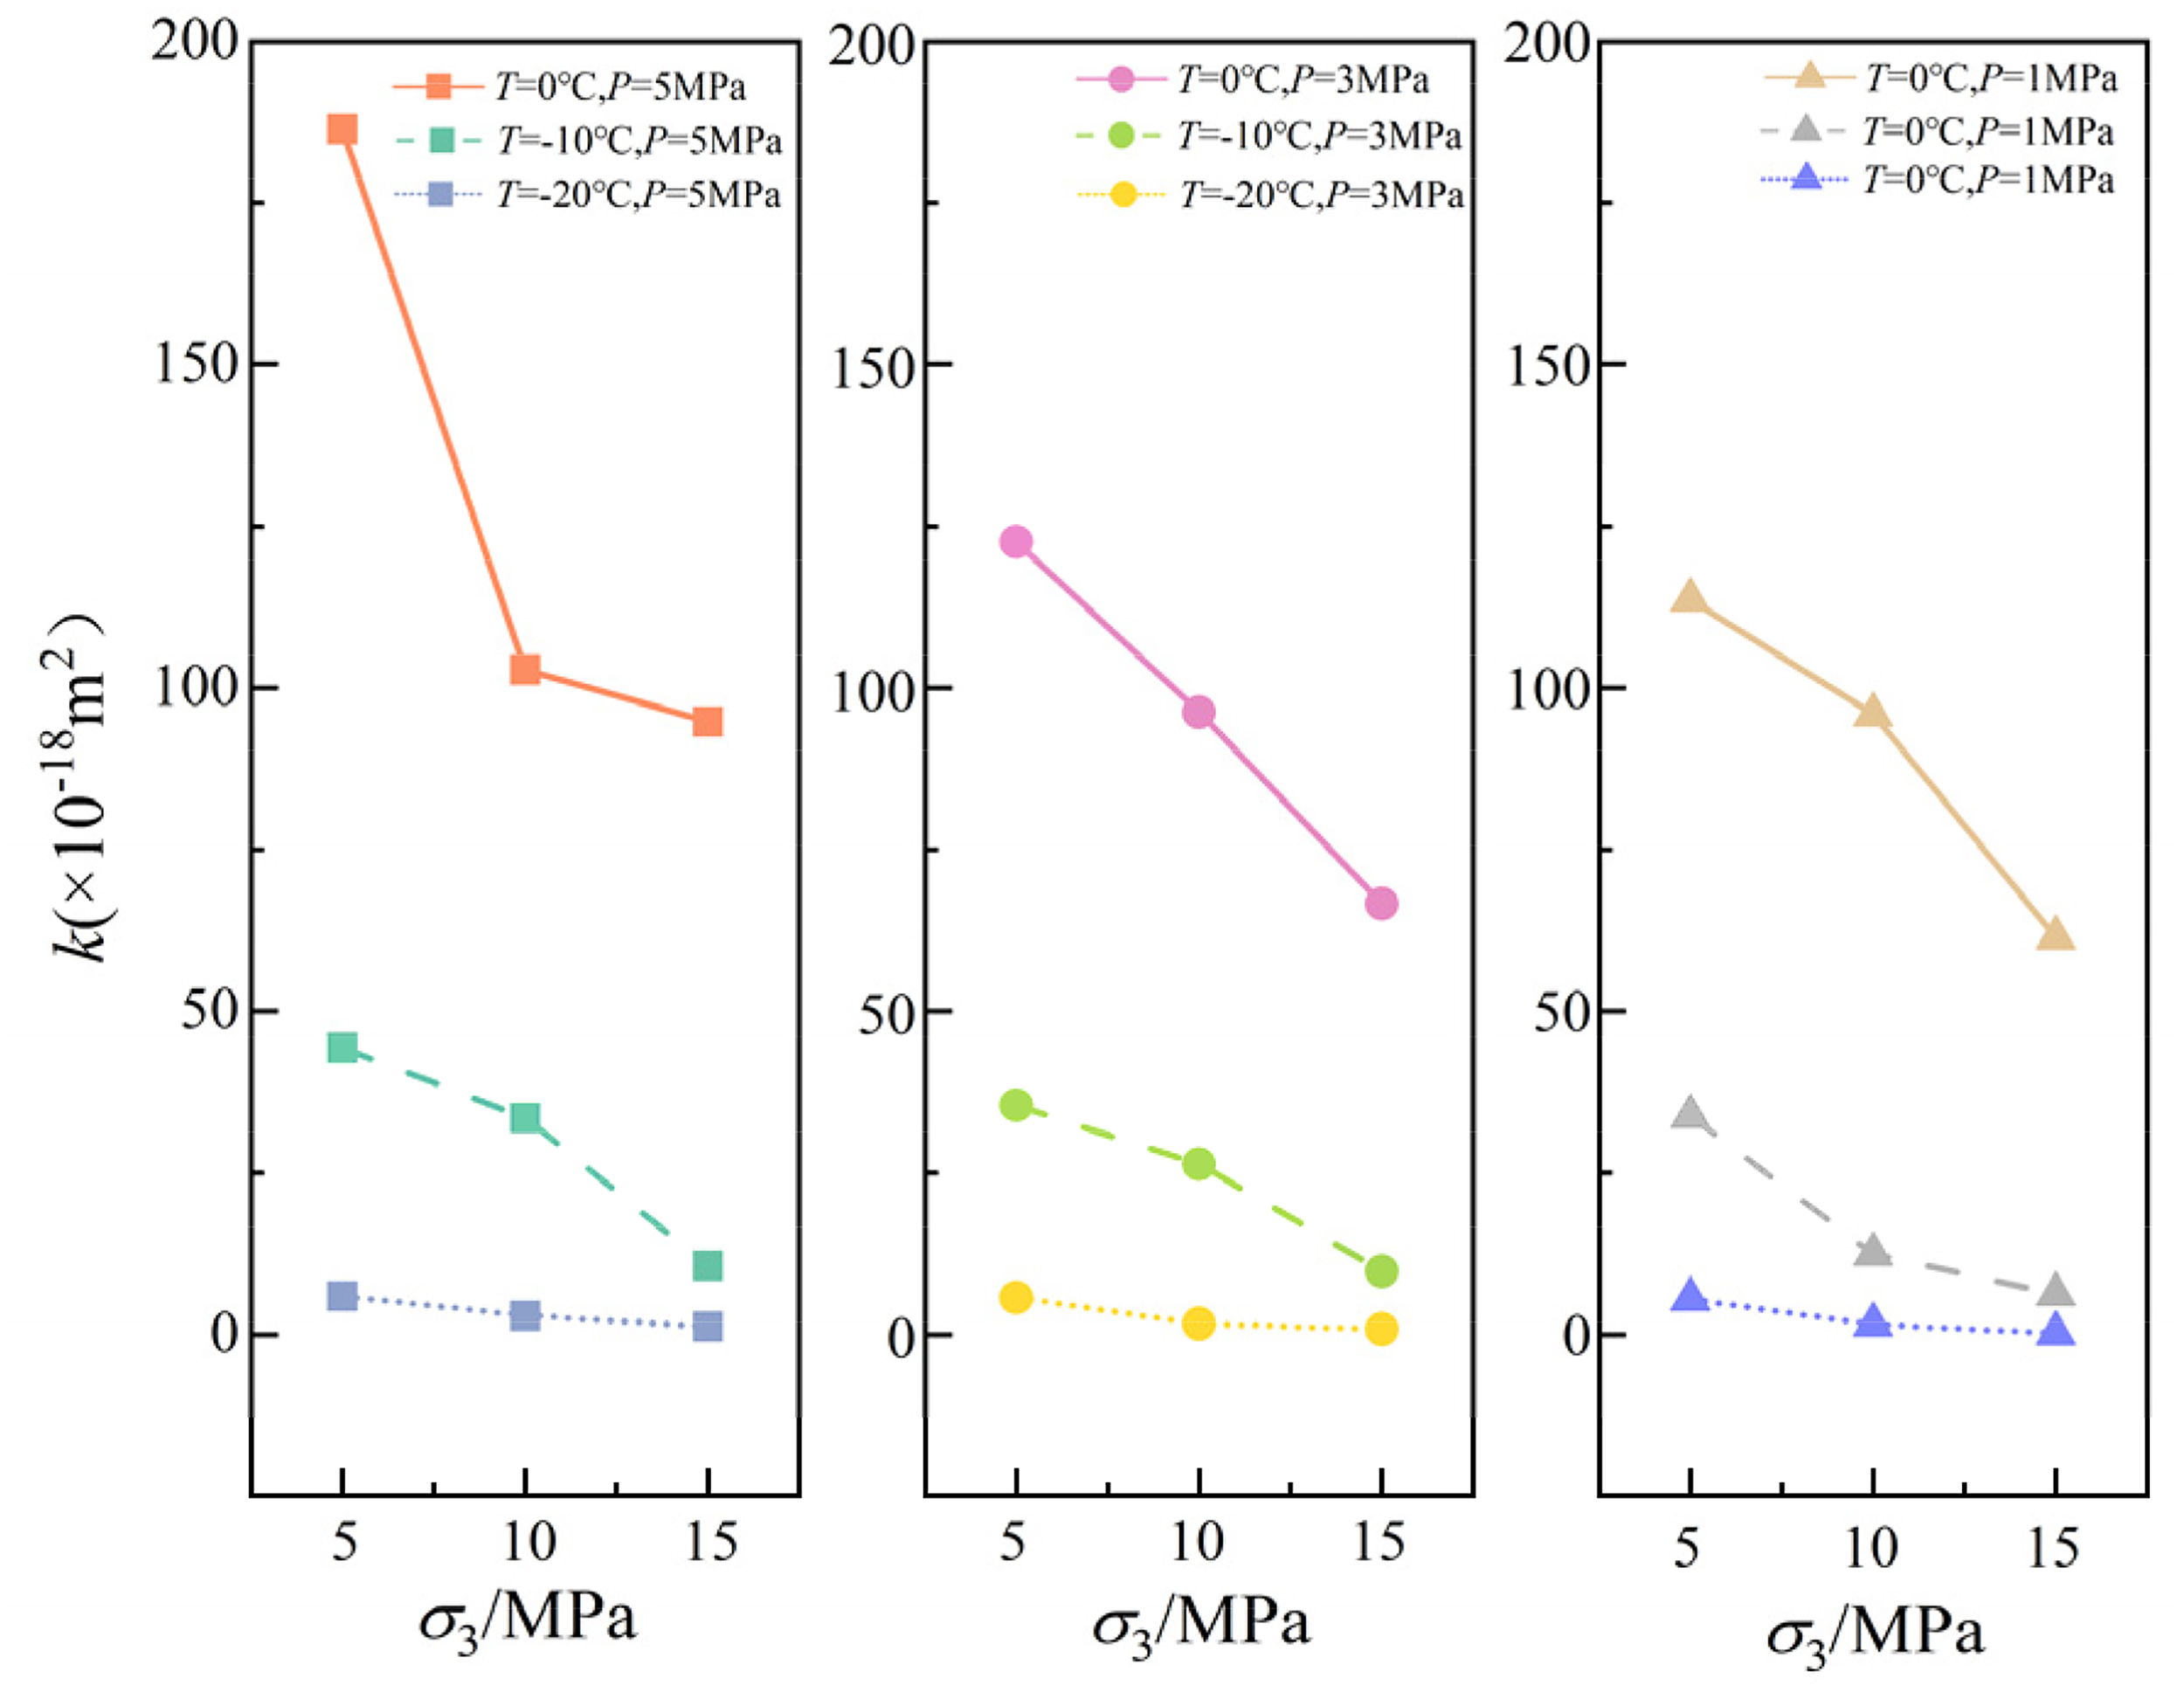
Relationship between average permeability of the specimen and temperature, confining pressure, and seepage pressure.
Among the three subplots in Figure 16, temperature exerts the most significant influence on permeability, exhibiting a pronounced positive correlation. Progressive cooling from 0 °C to −20 °C triggers a drastic attenuation in mean permeability across all confinement levels. This logarithmic reduction is fundamentally governed by the cryogenic phase transition of interstitial water. Upon reaching subzero thresholds, the pore water within the matrix and microfissures undergoes an in-situ phase change, resulting in significant volumetric expansion. The resultant ice crystals act as physical barriers that effectively occlude the original hydraulic conduits, thereby severely curtailing the rock's overall seepage capacity.
Along with each curve corresponding to constant temperature and seepage pressure, the average permeability exhibits a monotonic decreasing trend with increasing confining pressure. This indicates a clear negative correlation between confining pressure and permeability. From a micromechanical perspective, the increase in confining pressure enhances the lateral confinement and compressive effect on the rock skeleton, forcing the internal microcracks and pores to undergo mechanical closure. Consequently, the physical constriction of the effective hydraulic conduits curtails the available flow area, thereby amplifying the impedance to fluid migration within the rock matrix.
A horizontal comparison of the three subplots under different seepage pressure levels in Figure 16 reveals that, under identical temperature and confining pressure conditions, the average permeability increases slightly with increasing seepage pressure, indicating a positive correlation. On the one hand, elevated seepage pressure intensifies the hydraulic potential of the pore fluid, thereby amplifying the motive force required for migration through the rock's intricate interstitial architecture. On the other hand, pressurized fluid entering the rock fractures induces a weak hydraulic fracturing effect, which partially counteracts the crack closure caused by confining pressure, thereby leading to a slight increase in permeability.
Based on the data presented in Figure 16, a multifactor empirical relationship (equation (6)) was established to quantify the combined effects of temperature, confining pressure, and seepage pressure on the average permeability of the specimens, thereby evaluating the relative influence of each factor:
The fitted multifactor relationship (equation (6)) indicates that temperature and seepage pressure are positively correlated with the permeability of the specimens, whereas confining pressure exhibits a negative correlation. A sensitivity hierarchy reveals that thermal fluctuations dominate the evolution of permeability, while seepage pressure plays a secondary role. In contrast, the influence of radial confinement is found to be the most marginal among the investigated parameters.
Constitutive damage model for tuff under low-temperature and load conditions
Establishment of damage constitutive model
To establish a quantitative metric for the structural degradation of tuff under cryogenic exposure, this study incorporates a porosity-derived initial damage variable, following the framework of Xiao et al. (2023). This parameter effectively encapsulates the extent of preexisting damage induced by low-temperature conditioning. Notably, the validity of this porosity-based characterization is contingent upon the assumption of macroscopic homogeneity, rendering it a collective indicator of the rock's overall initial state. The initial damage variable is expressed as:
In equation (7), D0 represents the initial damage variable of tuff specimen; ϕT is the porosity of tuff specimen after 48 h of curing at different temperatures; ϕ0 is the porosity of tuff specimen at room temperature (20 °C).
Figure 17 shows the initial damage variable D0 of tuff specimen at different temperatures under low-temperature curing. As the curing temperature decreases, D0 exhibits a trend of rapid increase followed by stabilization.
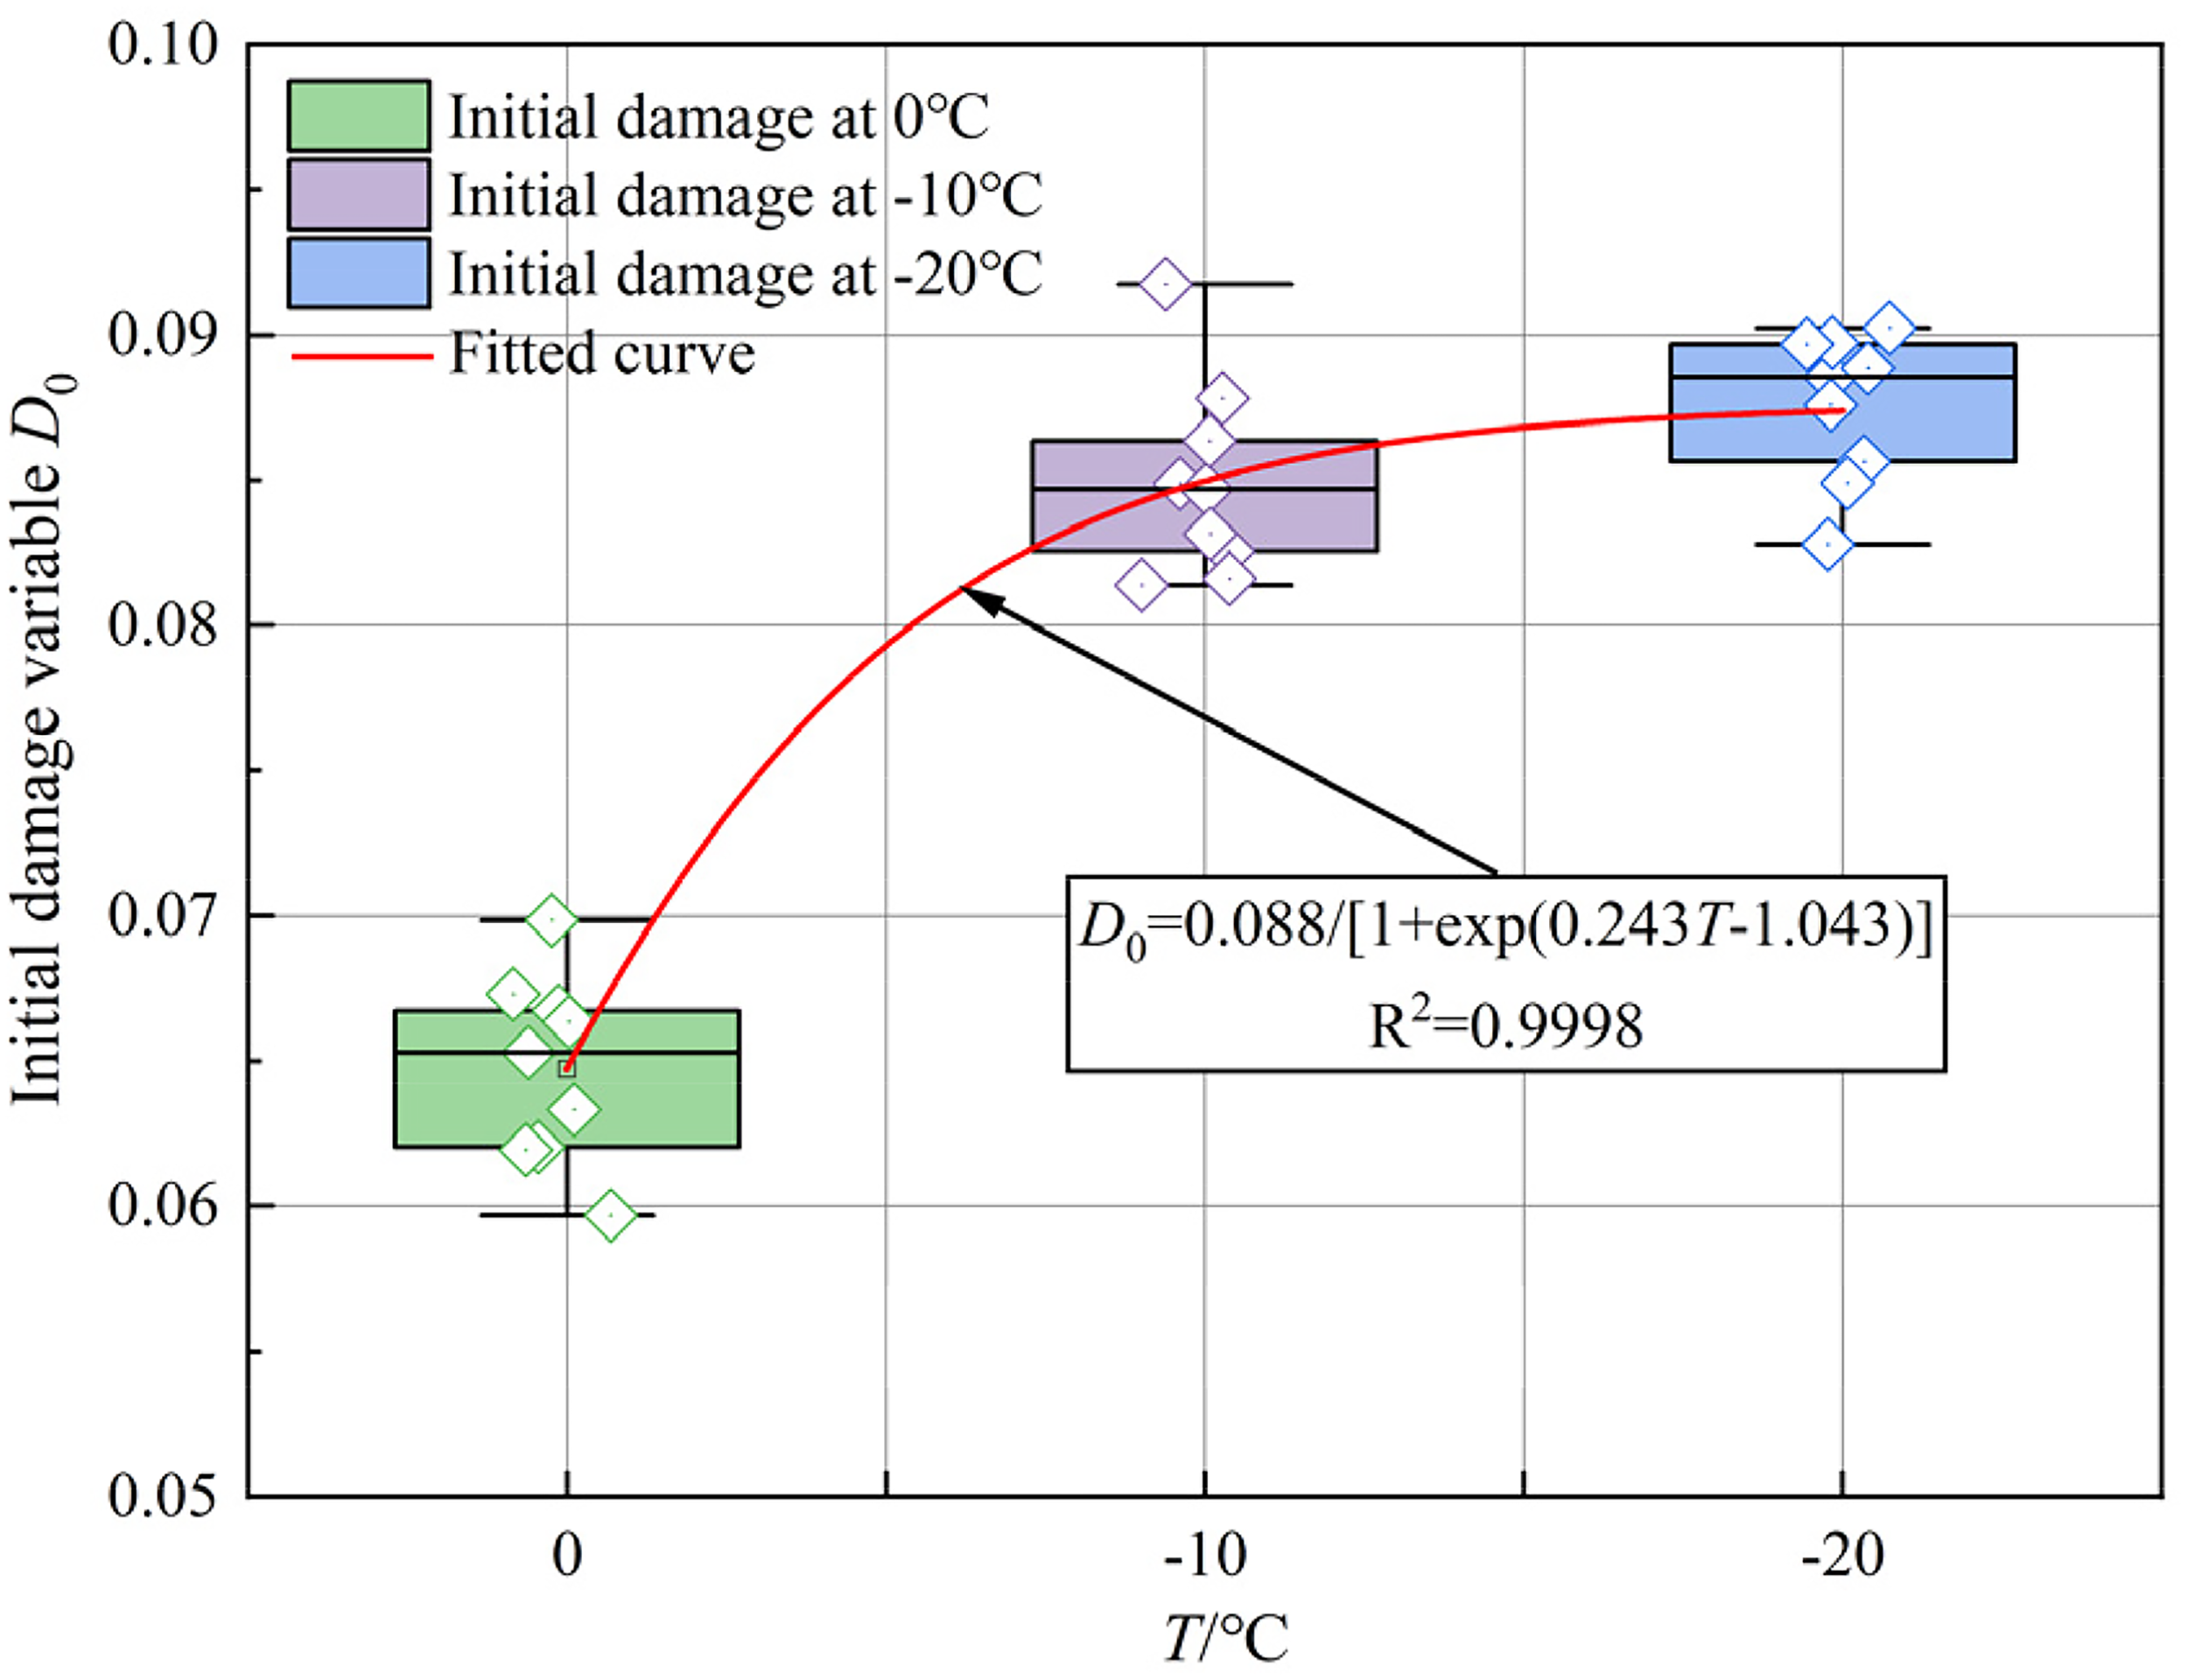
D0 of tuff specimen under different low-temperature curing conditions.
Owing to the inherent heterogeneity of rock, characterized by the irregular distribution and varying scales of internal particles, the failure behavior of mesoscopic microelements under external loading is fundamentally stochastic. Given that the strength of these constituent particles conforms to statistical probability, the Weibull distribution provides a robust mathematical framework to delineate the probability density of microelement failure in tuff (Chen et al., 2024; Bu et al., 2023):
In equation (8), P(x) represents the strength distribution function of the microelements within the tuff specimen; m and λ are parameters of the Weibull distribution function.
The load-induced damage variable D1 of the tuff specimen is defined as the cumulative failure probability of its constitutive microelements, yielding the following expression:
In equation (9), F represents the strength of the rock microelements.
The low temperature–load coupled damage in tuff specimen can be represented by the volume of defects under different damage conditions. V0 denotes the volume of the pristine specimen in its undamaged state, serving as the fundamental baseline for all damage calculations. V1 denotes the damage volume induced by low-temperature curing, which can be further propagated under loading. Finally, V2 captures the additional defect volume that is activated and expanded during mechanical loading, reflecting the synergistic thermomechanical effects on the rock matrix. That is, it is the actual propagated and coalesced defect volume of the aforementioned V1 after being subjected to loading. As a subset of V1, it is not the total damage volume generated by the coupled action.
The initial damage variable D0 and load-induced damage variable D1 can be expressed by the following equations:

By combining equations (10) and (11), the total damage variable D under low temperature–load coupling effects can be obtained:
By substituting equations (7) and (9) into equation (12), the total damage variable D of tuff specimen under low temperature–load effects can be derived as:
Figure 18 shows the evolution curves of the damage variable D for tuff specimen at different curing temperatures. The figure indicates that the damage variable D exhibits an “S”-shaped variation with strain. The evolutionary kinetics of the damage variable demonstrates a nonmonotonic trend, characterized by an initial acceleration followed by a subsequent deceleration. This rate of progression exhibits a distinct inverse dependency on the curing temperature. Specifically, lower thermal gradients exacerbate the accumulation of the damage variable, suggesting that cryogenic exposure triggers interstitial pore dilation and significantly expedites the structural disintegration of the tuff matrix. Thus, the lower the temperature, the more severe the degradation effect.
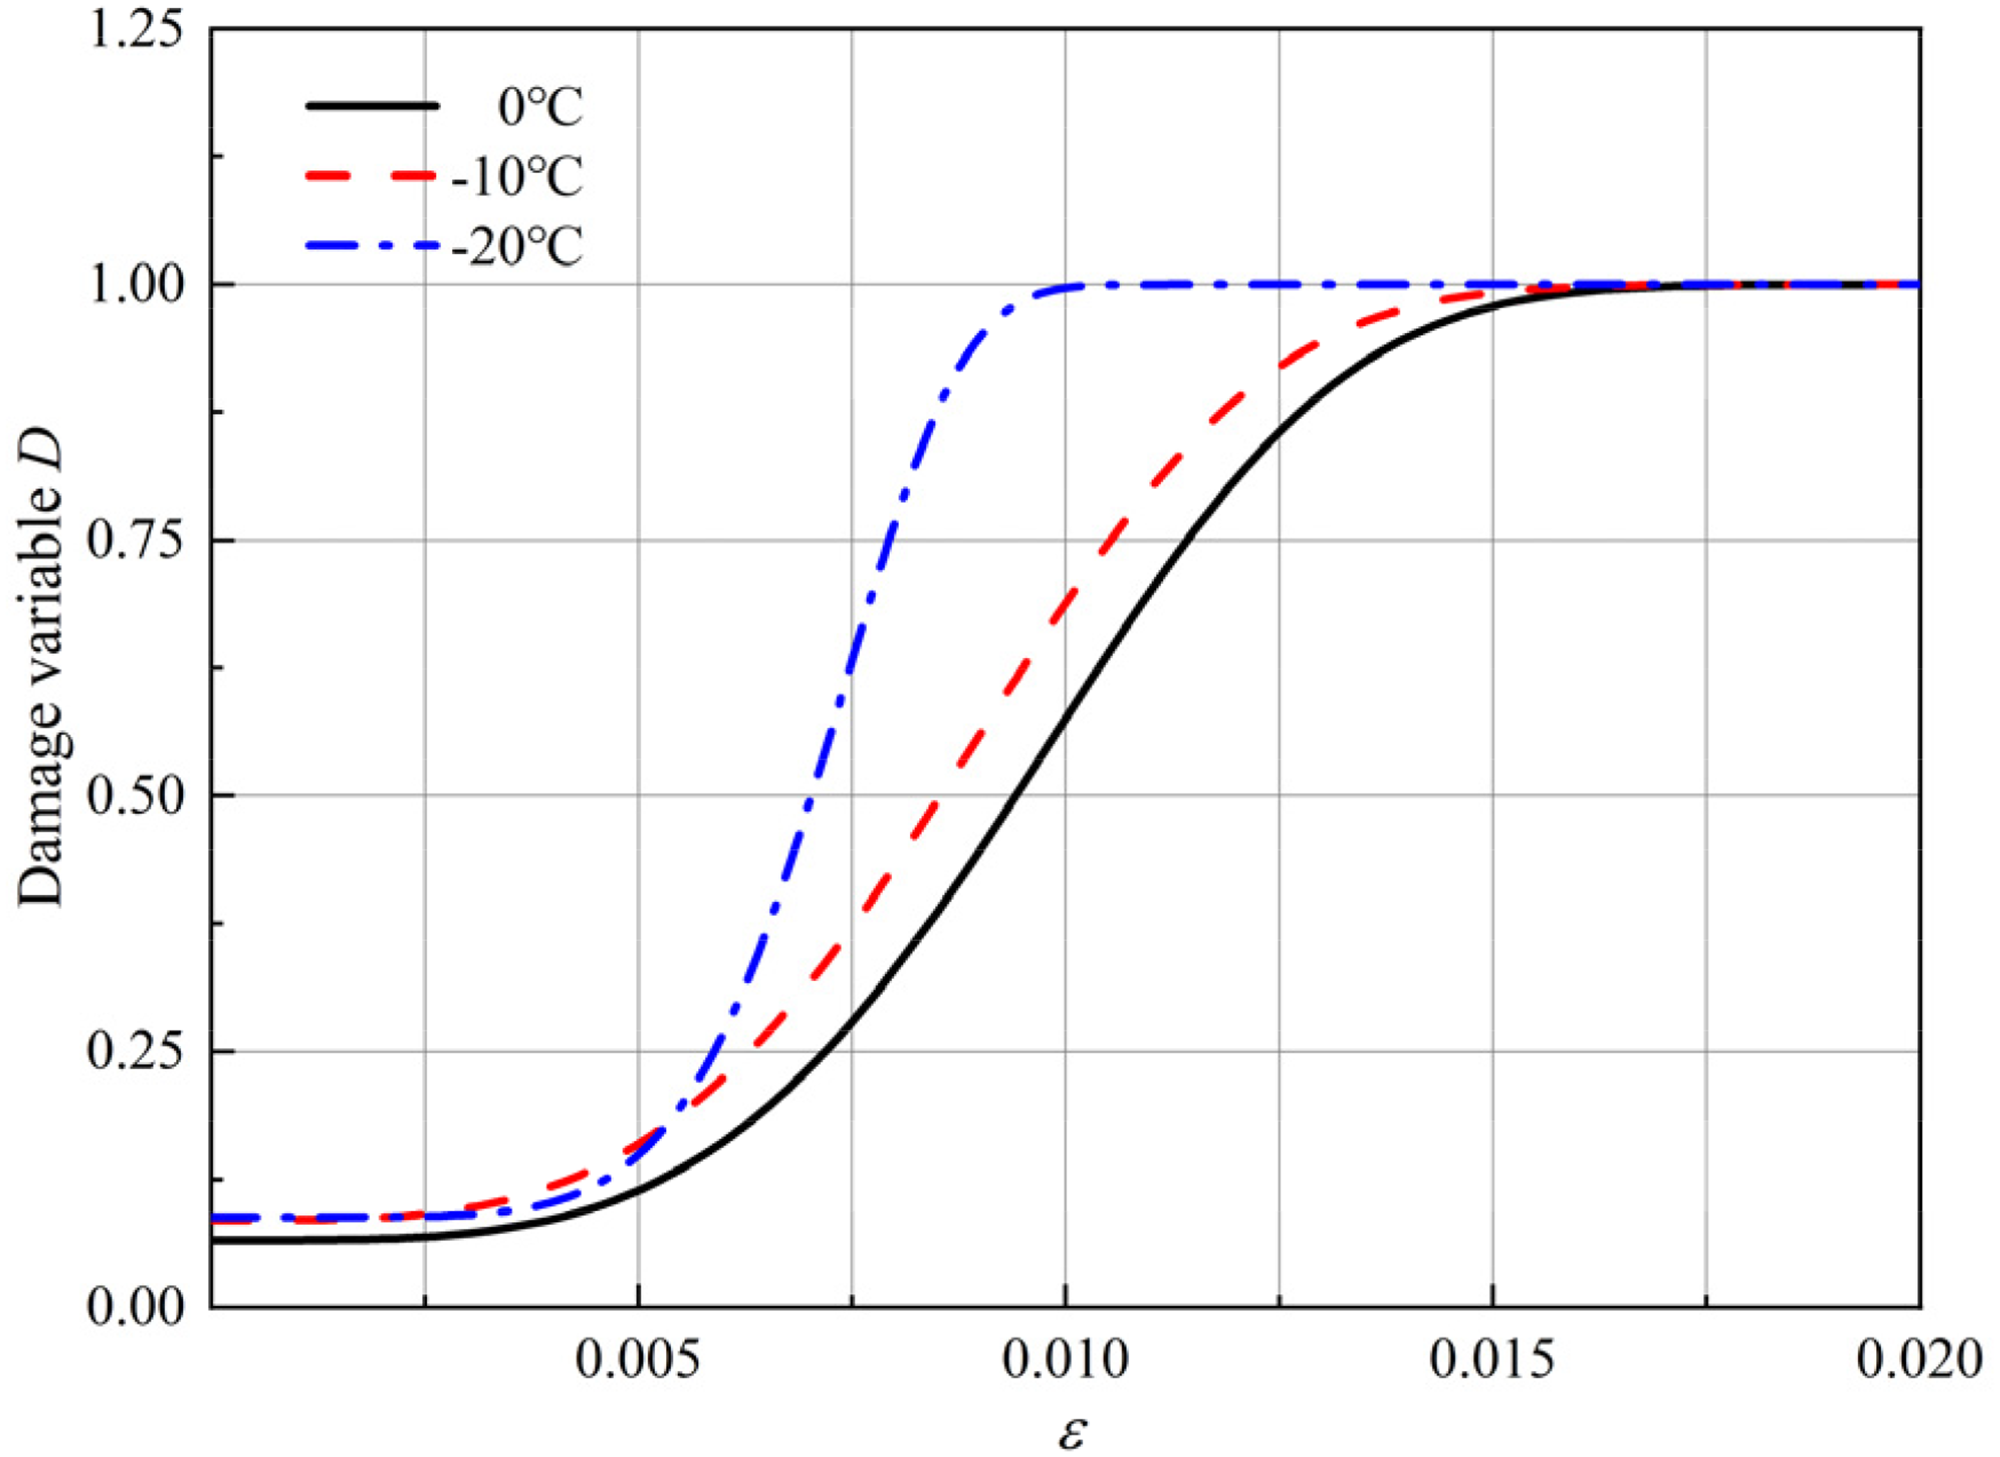
Evolution curves of the damage variable D at different temperatures.
In triaxial compression, where 


During the loading process, the actual axial stress σ1 is defined by the superposition of the recorded deviatoric stress σ1t and the constant confining pressure σ3. Similarly, the total axial strain ɛ1 is determined by combining the measured axial deformation ɛ1t with the preexisting initial axial strain ɛ10, as formulated below:

Under confining pressure, the initial axial strain generated in the rock is:
By combining equations (13) through (19), the damage constitutive model for tuff specimen under low temperature–load coupling effects in triaxial compression can be obtained as:
Determination of constitutive model parameters for damage
Given that rock failure under compressive loading is predominantly driven by shear mechanisms, this study adopts the Drucker–Prager (D–P) criterion as the mechanical threshold for microelement failure (Xu and Karakus, 2018; Feng et al., 2023a, 2023b; Ding and Zhang, 2017). This criterion provides a robust foundation for determining the statistical strength distribution of the rock matrix:



Substituting equations (22), (23), and (24) into equation (21) yields:
To determine the Weibull parameters m and λ, the damage constitutive relationship is linearized through logarithmic transformation. This approach enables the identification of these characteristic constants via linear regression analysis of the experimental datasets. The transformation of equation (25) yields:
Taking the natural logarithm of both sides of equation (26) yields:
Taking the natural logarithm of both sides of equation (27) yields:
Let 
Utilizing the datasets from the triaxial compression tests, the characteristic parameters m and λ are extracted by applying a linear regression to the proposed damage model.
Validation of the damage constitutive model
Under uniaxial compression conditions, the strength of the rock microelements can be simplified as:
The uniaxial damage variable is analytically derived by performing a differential analysis on the stress–strain profile at the peak strength threshold. By leveraging the boundary condition where the tangent modulus vanishes at the peak point, the damage parameters can be rigorously determined (Ding et al., 2024):
To enhance the fitting precision with experimental datasets, a piecewise modeling strategy is adopted, where the stress–strain trajectory is partitioned into two distinct regimes: the nonlinear porosity-compaction phase and the subsequent elastic-to-failure progression. The piecewise constitutive equation for uniaxial compression of tuff specimen under low temperature–load coupling effects is:
In equation (32),
For empirical validation of the proposed uniaxial damage model, the necessary constitutive parameters for tuff specimens were derived from experimental datasets across various thermal conditioning levels. The specific parameters are provided in Table 6.
Parameters of the uniaxial compression damage constitutive equation for tuff specimen.

The theoretical stress–strain curves for the tuff specimen subjected to uniaxial compression across various curing temperatures were generated by inputting the parameters from Table 6 into equation (32). As illustrated in Figure 19, these analytical results are benchmarked against experimental data. The proposed uniaxial damage constitutive model demonstrates a robust correlation with the laboratory findings, accurately capturing the material's mechanical response under low temperature–load coupling conditions.
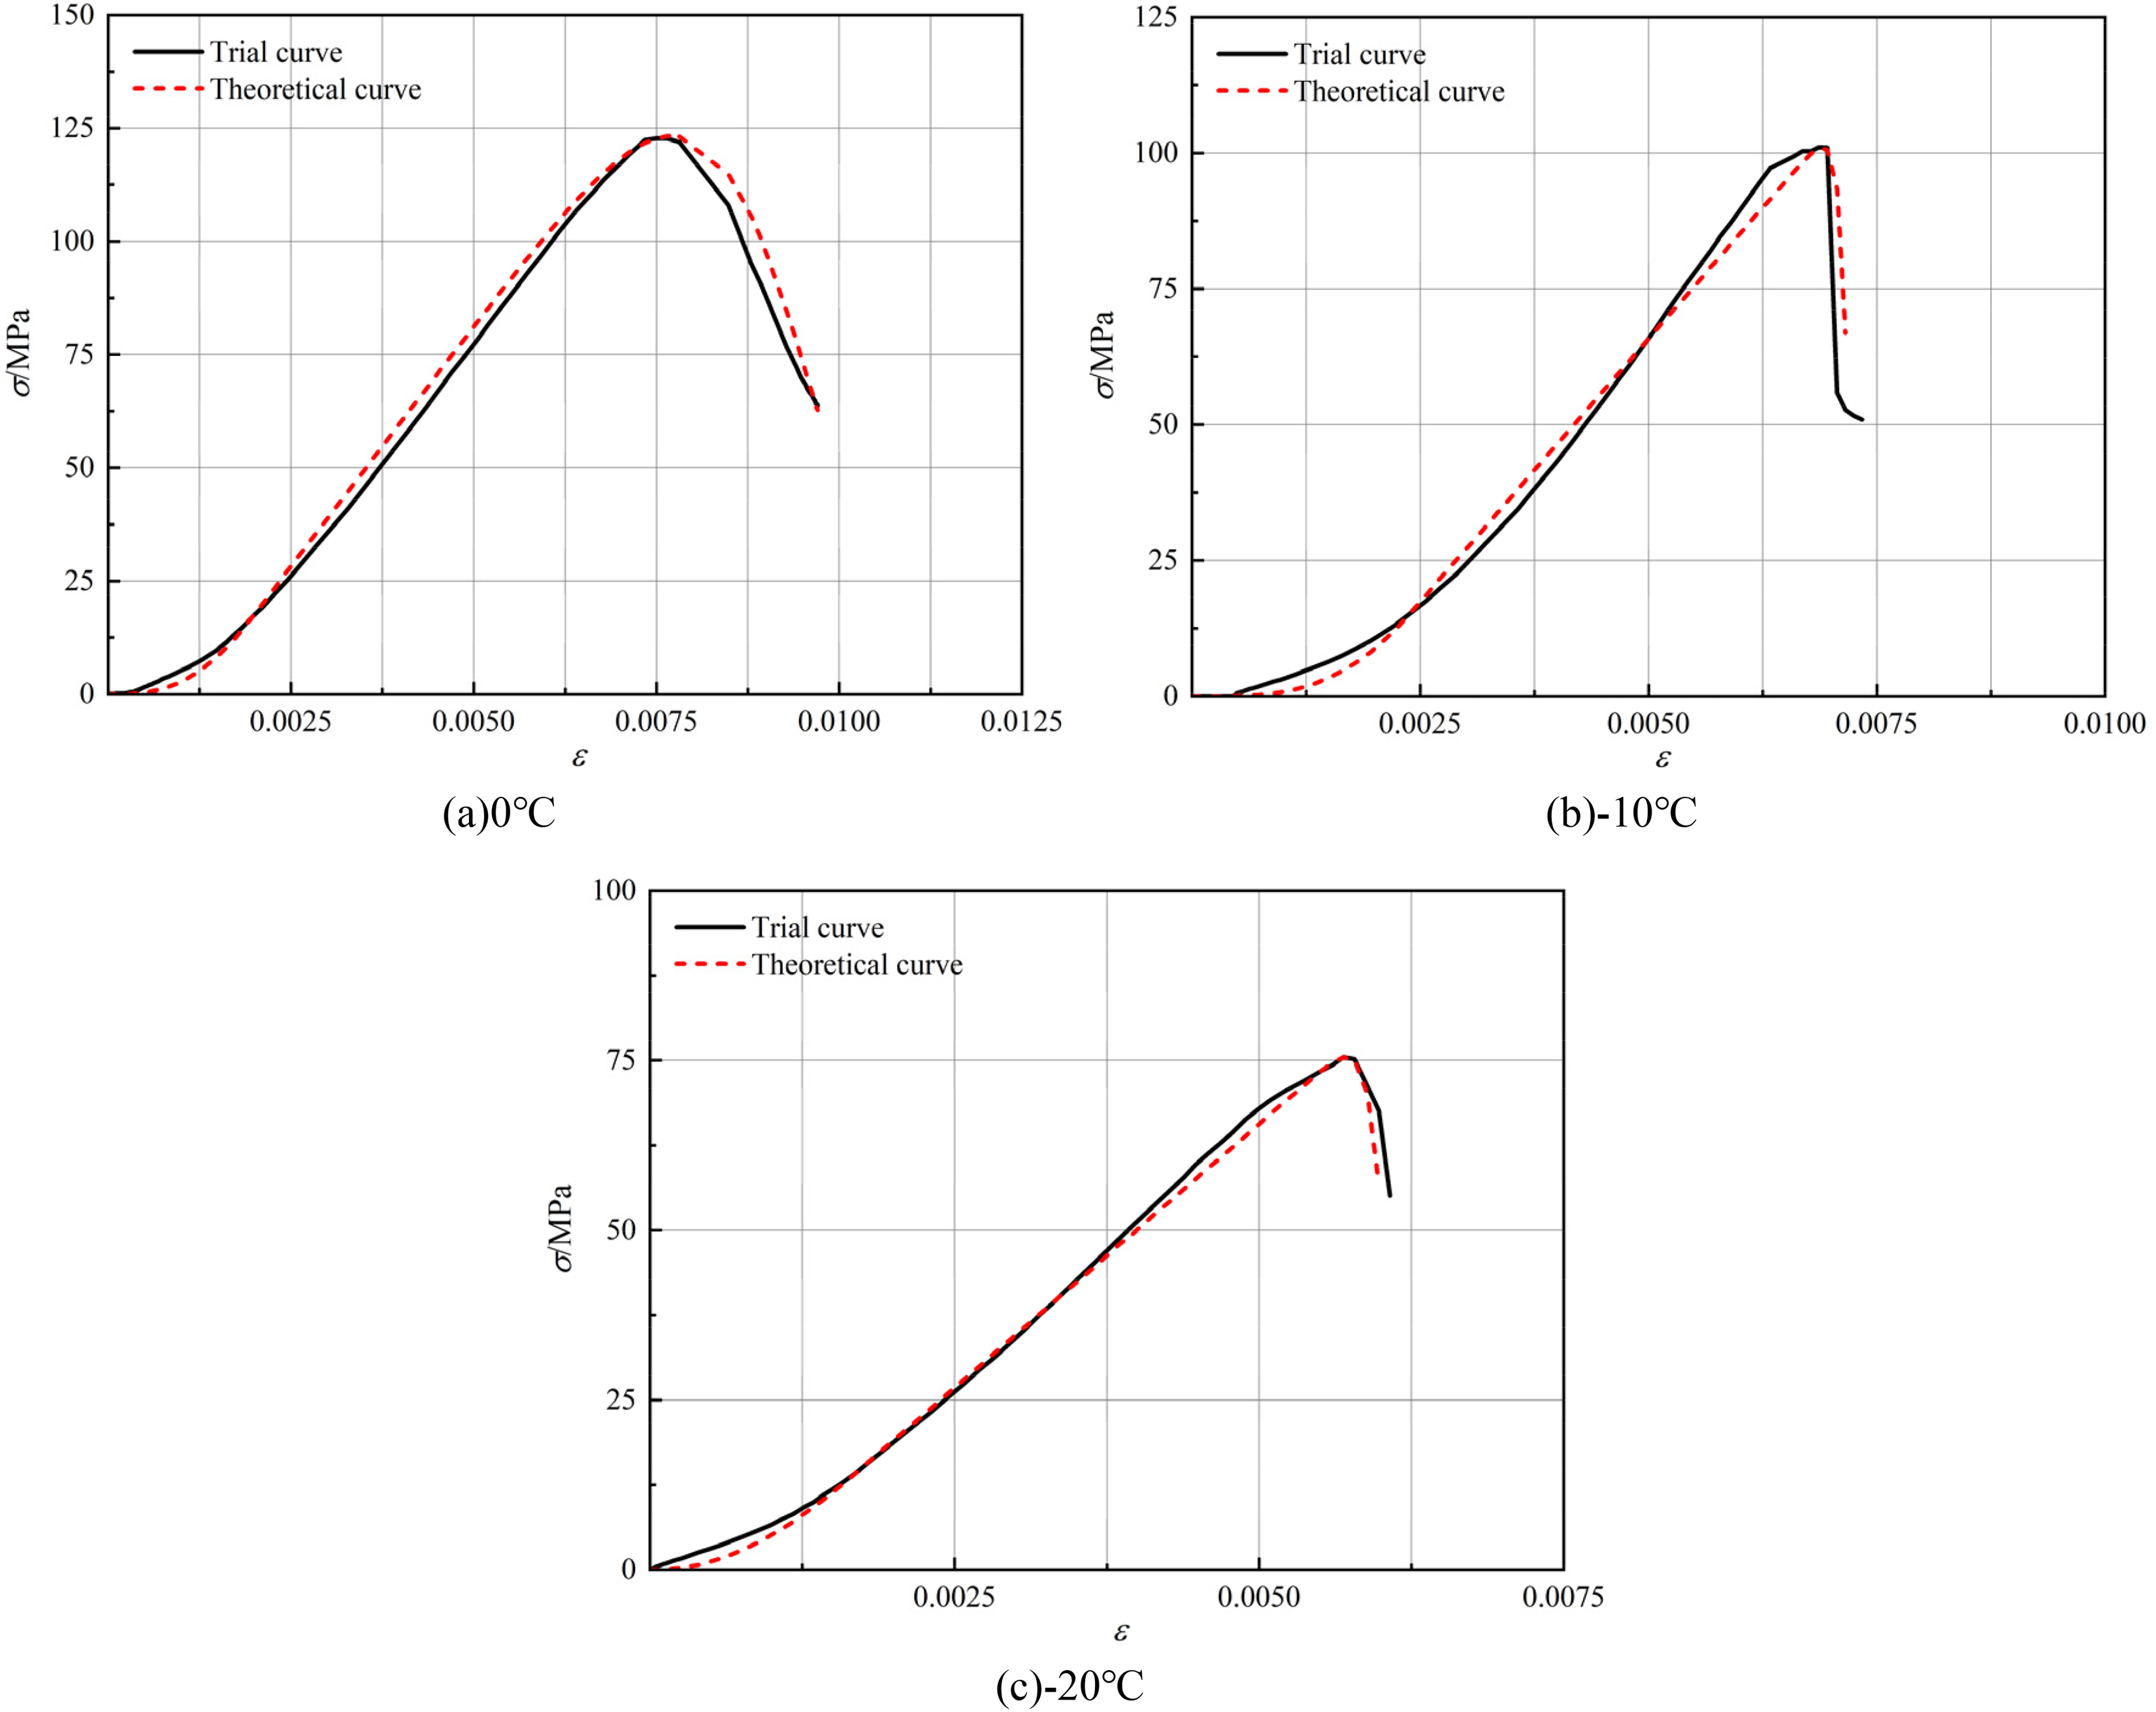
Fitting of experimental curves under uniaxial compression conditions. (a) 0 °C, (b) −10 °C, (c) −20 °C.
Analyzing the specific deformation phases reveals that both profiles share a characteristic concave trend during the porosity compaction stage; however, a minor discrepancy emerges as the predicted slope is marginally flatter than the actual data. Conversely, the model achieves excellent synchronization with the experimental results throughout the elastic and plastic yielding stages. Although a slight divergence occurs in the post-peak stage, where the analytical model underestimates the abrupt stress drop postfailure, the macroscopic trend is well-preserved. Ultimately, this comprehensive agreement confirms the reliability and accuracy of the established damage constitutive model in simulating the uniaxial compressive behavior of tuff specimens.
Under triaxial loading, the damage constitutive model for tuff specimens is implemented via a piecewise fitting strategy, partitioned into three distinct regimes: porosity and fracture compaction stage; elastic deformation and plastic yielding stage; postfailure stage. The triaxial damage constitutive equation for tuff specimen is then expressed as:
In equation (33),
To validate the rationality and applicability of the low temperature–load coupled triaxial damage constitutive model for tuff specimen, the elastic modulus E, Poisson's ratio μ, porosity ratio
Parameters of the triaxial compression damage constitutive equation for tuff specimen.
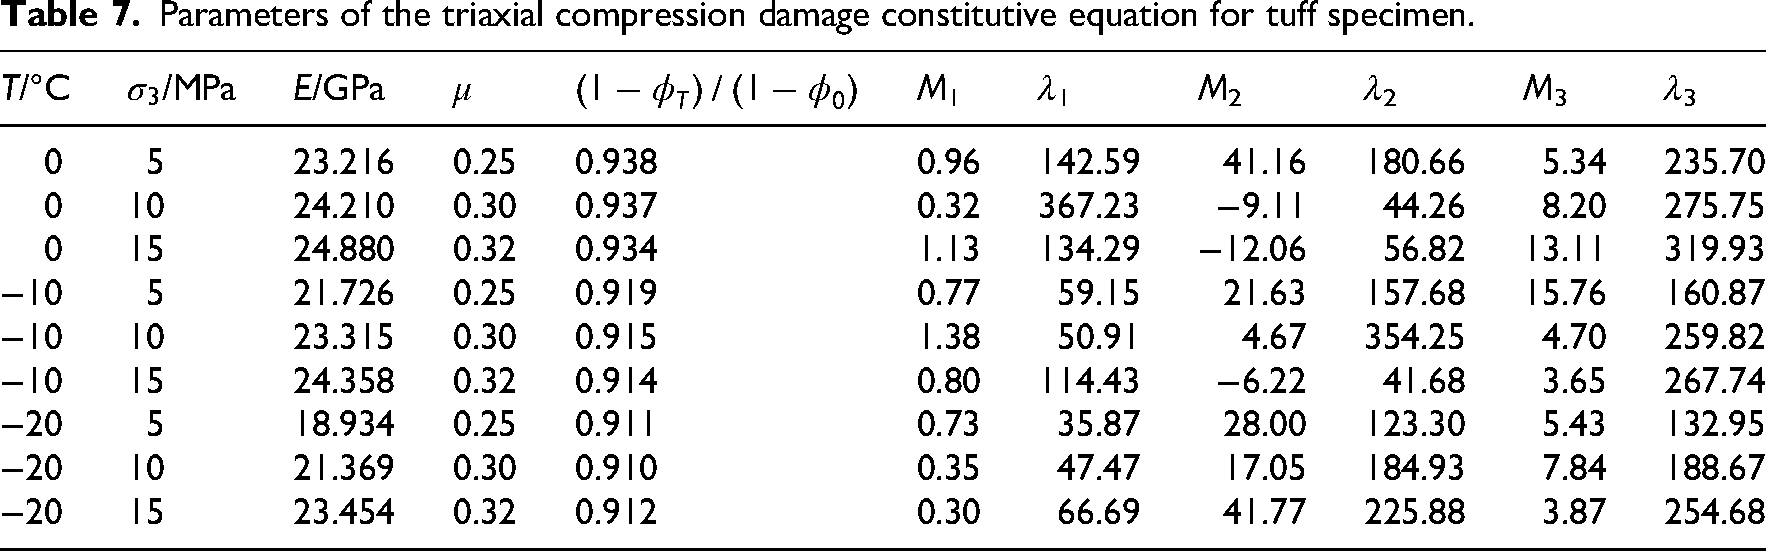
Theoretical stress–strain profiles for various curing temperatures (−20 °C to 0 °C) and confining pressures were generated by applying the parameters from Table 7 to equation (33) (Figure 20). A direct comparison with experimental data reveals that the proposed triaxial damage constitutive model reliably captures the rock's mechanical behavior across all loading phases.
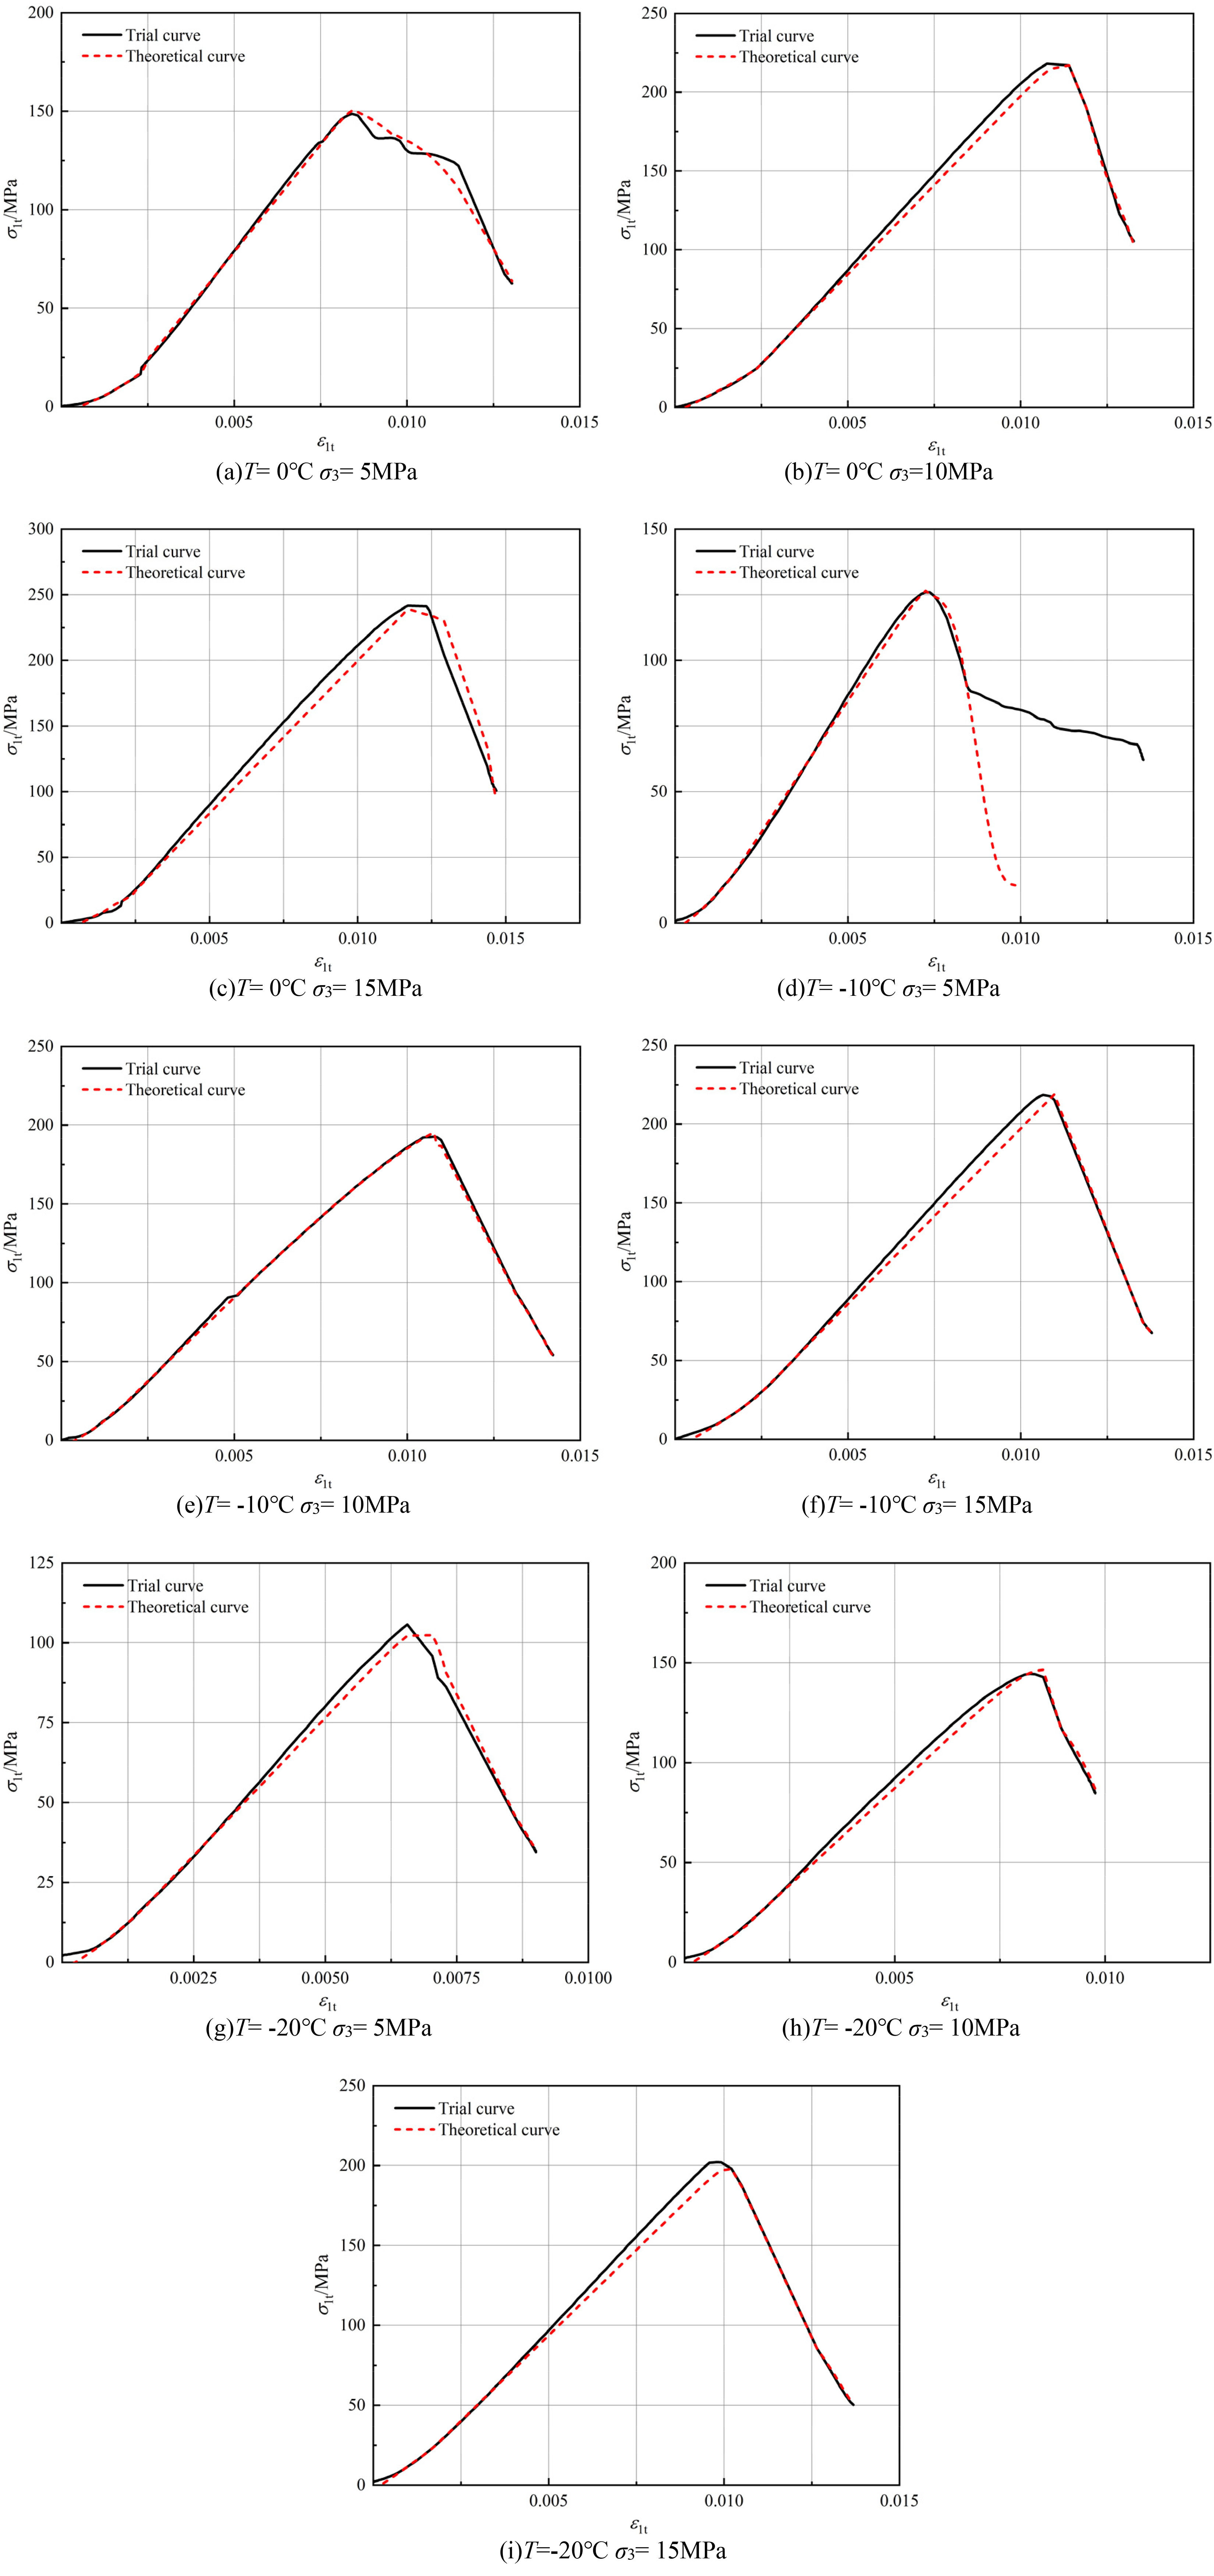
Fitted curves of experimental data under triaxial compression conditions. (a) T = 0 °C σ3 = 5 MPa, (b) T = 0 °C σ3 = 10 MPa, (c) T = 0 °C σ3 = 15 MPa, (d) T = −10 °C σ3 = 5 MPa, (e) T = −10 °C σ3 = 10 MPa, (f) T = −10 °C σ3 = 15 MPa, (g) T = −20 °C σ3 = 5 MPa, (h) T = −20 °C σ3 = 10 MPa, (i) T = −20 °C σ3 = 15MPa.
Specifically, the analytical predictions closely mirror the empirical results during the initial pore and fracture compaction stage. As loading progresses into the elastic deformation and plastic yielding phases, minor discrepancies emerge: the predicted slopes are occasionally flatter under specific conditions, and peak strengths show slight variances. Nevertheless, the macroscopic trajectory remains highly consistent. During the postfailure phase, the model successfully replicates the stress drop characteristic of rock failure. Despite marginal localized deviations, the comprehensive agreement across all deformation stages validates the rationality, accuracy, and broad applicability of the established triaxial constitutive model.
To quantitatively evaluate the fitting accuracy of the damage constitutive model established in this study, the root mean square error (RMSE) (equation (34)) and the coefficient of determination (R2) (equation (35)) were introduced as evaluation indices:

In these equations, n denotes the total number of stress data points; σi represents the measured stress value of the i-th data point; σi′ denotes the corresponding theoretical stress value of the i-th data point; and
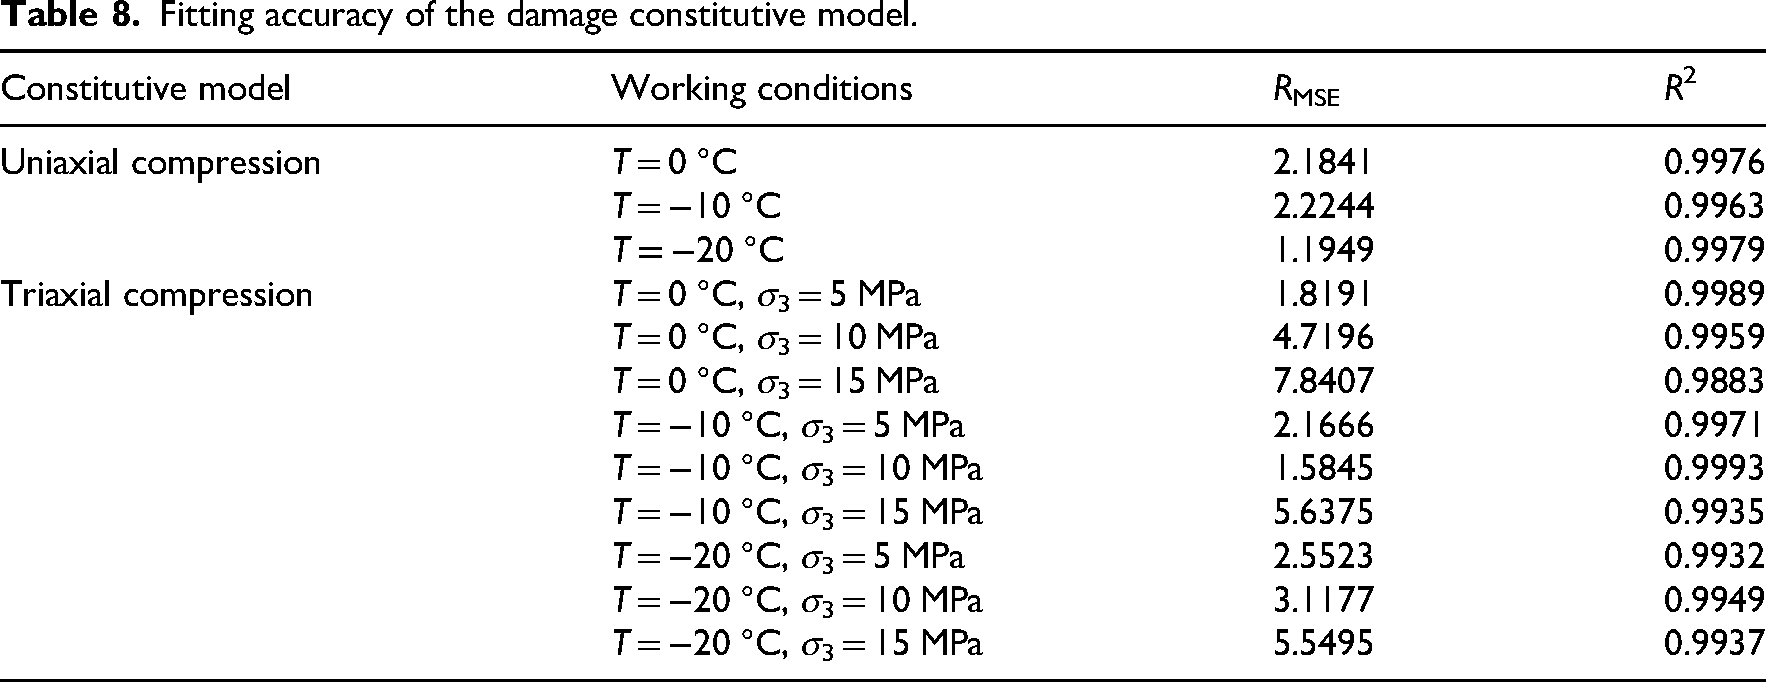
The fitting accuracy of all uniaxial and triaxial constitutive models was calculated and summarized in Table 8. As shown in Table 8, the proposed damage constitutive model exhibits high fitting accuracy under all working conditions. R2 is consistently greater than 0.98 and exceeds 0.99 in most cases, indicating that the model can accurately capture the stress–strain response characteristics of the material. Furthermore, the minimal overall RMSE values underscore a high degree of congruence between the theoretical predictions and the observed experimental datasets, confirming the model's reliability. Under uniaxial conditions, the model achieves the highest fitting accuracy, with RMSE values all below 2.3 MPa and R2 values exceeding 0.996, demonstrating excellent predictive capability. Under triaxial conditions, RMSE shows an increasing trend with the rise in confining pressure; notably, the error becomes relatively larger at high confining pressure (σ3 = 15 MPa). However, R2 remains at a high level, indicating that the overall trend is still well captured by the model. Consequently, the proposed constitutive model demonstrates robust versatility in delineating the mechanical response of rock-backfill composite structures. It exhibits high fidelity across uniaxial and triaxial regimes under low-to-intermediate confinement, while maintaining its predictive accuracy within diverse thermal environments. Nevertheless, further improvement is required for accurately representing the behavior under high confining pressure and complex stress states.
Fitting accuracy of the damage constitutive model.
Conclusions
This article conducted NMR testing, uniaxial compression tests, and triaxial compression tests under varying confining pressures and seepage conditions on the tuff specimens under different low-temperature curing conditions. The research focused on the evolution of pore and fissure structures, fracture mechanisms, and mechanical properties of the tuff specimens under low-temperature conditions, investigating the effects of temperature, confining pressure, and seepage pressure on the mechanical behavior of the rock. Based on the experimental data, a constitutive damage model was established that effectively reflects the damage characteristics of tuff under the coupled effects of low temperature and load, demonstrating strong applicability. The following conclusions are drawn from the research:
Low-temperature conditions significantly promote the development and connectivity of the pore and fracture structures within tuff. Low-temperature curing not only increases the number of pore and fracture structures but also shifts their distribution toward larger pore sizes. Under the experimental temperature conditions, the lower the curing temperature, the more pronounced this change becomes. With declining experimental temperatures, the failure mode of tuff specimens undergoes a distinct transition, shifting from pure shear failure to a mixed shear-tensile regime. High radial confinement effectively suppresses crack proliferation, resulting in a localized single-plane fracture. Conversely, at lower confining pressures, the diminished restraint facilitates the development of secondary tensile fractures. This evolutionary trend underscores the role of cryogenic frost heave—stemming from the phase transition of pore-confined water—in catalyzing structural degradation, a process that intensifies as temperatures descend. The triaxial compression of tuff specimen undergoes four stages: compaction, elasticity, plastic yielding, and failure. With descending experimental temperatures, the stress–strain response exhibits a marked prolongation of the initial compaction phase. Conversely, the plastic yielding regime undergoes a conspicuous contraction, eventually becoming virtually suppressed as the rock transitions toward a more brittle state. The post-peak residual stress declines more rapidly, and the rock failure becomes more severe, exhibiting greater brittleness. Under otherwise constant conditions, the strength of tuff specimen increases with increasing confining pressure, decreases with decreasing temperature, and decreases with increasing pore pressure. These observations demonstrate that the imposition of confining pressure effectively restrains the proliferation of microfractures. Notably, this inhibitory potency exhibits a distinct positive correlation with the magnitude of the radial stress. As the confining pressure decreases, the influence of pore pressure on the strength of tuff specimen becomes more pronounced. Among the factors considered in this study, the strength of tuff specimen is primarily affected by the confining pressure gradient, followed by the temperature gradient, with the pore pressure gradient having the least influence. By introducing the porosity of tuff specimen, a damage constitutive model under the coupling effect of low temperature and load was established. The constitutive parameters were extracted via linear regression analysis, and the resulting theoretical profiles exhibit excellent agreement with the measured stress–strain trajectories. The model is capable of reflecting the complete stress–strain characteristics of tuff specimen under different temperatures and confining pressures, demonstrating good applicability.
Footnotes
Acknowledgments
The authors would also like to thank the anonymous reviewers and the editor for their constructive comments, which helped improve the quality of this manuscript.
List of symbols

Authors’ contributions
Yang Li contributed to conceptualization, writing—review and editing, methodology, and funding acquisition. Jun Ma contributed to writing—original draft, formal analysis, and visualization. Hongyuan Liu contributed to resources, investigation, and project administration. Zhang Li contributed to methodology and data curation. Ling Yu contributed to resources and formal analysis. Yin Tan contributed to investigation, formal analysis, and visualization. Weidong Song contributed supervision. JiaMing Liu contributed to validation.
Funding
The authors disclosed receipt of the following financial support for the research, authorship, and/or publication of this article: This work is supported by the National Key Research and Development Program of China (2022YFC2905005) and China Scholarship Council.
Declaration of conflicting interests
The authors declared no potential conflicts of interest with respect to the research, authorship, and/or publication of this article.
Data availability statement
Data will be made available on request.