
Abstract
The purpose of this study was to construct a demographic and time allocation profile of the typical music education faculty member in the United States. Participant institutions (n = 220) were selected from a random sample of National Association of Schools of Music–accredited institutions offering music education degrees (N = 517). The authors sent invitations to complete the online survey to 665 music education professors at the institutions in the sample. The completed response rate for the survey was 35% (n = 236). Findings aided in the construction of a profile of the typical music education faculty member in the United States. The data demonstrate that the typical respondent has a doctorate, 9 to 12 years of K–12 teaching experience, and is 51.5 years old, but entered the professoriate around age 36. The typical respondent spends approximately 11 hours per week teaching undergraduate students and has only 10% of his or her workload devoted to research. The report explores numerous other variables as well. Certain characteristics of the profile varied according to the type of institution at which the respondent worked. For example, the data demonstrate a significant difference in mean percentage of workload devoted to teaching and research between various institution types but not in time devoted to service. The exploration of demographic and time allocation norms in the music education professoriate may be of interest to those who prepare music teacher education faculty. Such information may also be of value to current and future graduate students preparing for careers in the music education professoriate.
Keywords
In 1982, Ducharme and Agne explored demographic information provided by members of the teacher education professoriate and posed a simple question that generated complex answers. “What is a professor of education?” they asked, noting “there is little that describes the complexity of [education] faculty, their collective and individual professional and personal backgrounds, [and] their roles in higher education” (p. 30). We, as professors of music education, must also have a “professional and personal interest in the [music] education professoriate, its . . . workload, and professional contributions” (p. 30). To date, however, little recent research has been conducted toward the end of describing such collective facets of music education faculty members or their work. Such research may prove crucial in fighting what Asmus (2001) described as the “new challenge . . . befalling music education” namely that “the new pool of music teacher educators is drying up” (p. 3). Elaborating on this premise, Teachout (2004) commented on the declining number of music education doctoral degrees granted between 1998 and 2002 and explored the potential incentives and barriers to earning music education doctorates, noting financial challenges as the “strongest barrier for those considering doctoral study in music teacher education” (p. 245).
In 2006, Hewitt and Thompson published the results of a 2004 large-scale survey to “develop a more comprehensive picture of the members of the music teacher education profession” (p. 50). In describing the need for the study, the authors asserted that “little is known about the professional lives of those who teach current and/or future music teachers” (p. 47). They found that the demographic information reported by respondents tended to mirror reports from the field of general teacher education (e.g., Ducharme, 1986; Ducharme & Kluender, 1990). Most notably, the authors reported that music teacher educators are predominantly male (56.1%), approximately 51.65 years of age, and “overwhelmingly White” (p. 58)—(94.0%). The authors also reported that music teacher educators devote much more of their professional time to teaching and preparing to teach than to research and scholarly activities. With a paucity of studies that examine demographic variables and time allocation among the music education professoriate, particularly studies that compare differences in variables between different types of institutions, it remains true that little is known about music teacher educators and their professional lives.
In this study, we have sought to collect and report data that supports, challenges, and expands the findings of Hewitt and Thompson (2006). To this end, we compared responses from faculty members employed at various types of institutions, an aspect of data reporting not explored by Hewitt and Thompson. LeBlanc and McCrary (1990) investigated motivations for conducting research and noted that 24% of respondents “stated that their university required research activity as a way to earn tenure, promotion, and salary increases” (p. 65) but did not examine what types of institutions might make such requirements. Comparisons of variables by institutional type have proved to be important in previous research examining faculty time allocation. For instance, in studying changes in faculty time allocation, Milem, Berger, and Dey (2000) stated that while
faculty at all types of . . . institutions are spending increasingly more time engaged in activities associated with publication and research, . . . the extent of these increases is partially dependent upon the institutional setting in which faculty work. (p. 454)
Likewise, several other authors have supported the notion that institutional type affects the manner in which faculty spend time and expend effort (Fairweather, 1993; Jacobson, 1992; Tierney & Rhoads, 1993).
Detailed information about the demographic profile and faculty time allocation of the music education professoriate, including comparisons between faculty members at different types of institutions, can help in providing a clearer picture of the professional landscape in which music teacher educators work. Such information is important to current music teacher educators as well as future music teacher educators enrolled in doctoral programs, or those practicing music educators who may be considering enrollment in doctoral programs. Three research questions guided this study: (a) What are the frequencies and distributions of selected demographic and time allocation variables among U.S. music education faculty? (b) What differences may exist in these variables when examined according to gender or institution type? (c) What trends may emerge in faculty members’ reasons for leaving prior positions?
Method
Currently, a centralized, comprehensive, and regularly updated database of music education professors in the United States does not exist. It therefore becomes difficult to determine a definitive total number of professors in the population. The closest such document is the Directory of Music Faculties in College and Universities, United States and Canada published by the College Music Society (CMS). Although this document provides much information, it is costly, not made accessible electronically to the general public, and may contain out-of-date information (Hewitt & Thompson, 2006). The electronically accessible database published by the CMS (n.d.) contains lists of faculty members at most institutions, but contact information is supplied only for those faculty members who are CMS members. Additionally, the electronic database contains outdated listings in some instances and is therefore only partially reliable. Music education professors, and in fact professors in any field, move between institutions, enter higher education, and leave higher education each year. Thus, the lack of a comprehensive and current database creates obstacles in efforts to contact the population of music education professors. From year to year, however, the population of the National Association of Schools of Music (NASM) member schools remains relatively stable. The directory of NASM member schools thus served as the starting point for building a sample in this study. Limiting the sample to NASM schools is still somewhat problematic in that membership is voluntary and therefore not inclusive of all institutions that grant degrees in music. The initial and ongoing requirements of accreditation represent a significant investment of resources, and some institutions may not wish to align their degree policies with NASM standards. These factors may introduce bias into a sample; however, the approximately 630 institutional members of NASM (http://nasm.arts-accredit.org/) offered a broad enough sample of schools in the United States for the purposes of this study.
The Carnegie Foundation, a major resource for higher education information, classifies institutions of higher education based on multiple factors. The classifications serve to “assist those conducting research on higher education. Researchers need a way to deal with the great diversity of colleges and universities in the United States, and classifications enable them to identify groups of roughly comparable institutions” (Carnegie Foundation for the Advancement of Teaching, n.d.). The Carnegie Foundation website provides access to a spreadsheet entitled the Classifications Data File (2008), one source of data used in this study. We compared the NASM directory with the Carnegie Foundation’s Classifications Data File and eliminated any institutions that did not grant degrees in music education, resulting in an initial population of 517 institutions. Using the 2000 Carnegie classifications, we assigned each college or university into 1 of 10 categories based on institutional activity. We then organized these 10 into 6 top-level categories based on highest degrees granted at the institution. For the purposes of this study, five of these six categories were used to create larger groups: associate, bachelors, masters, doctoral, and specialized. No NASM member schools in the sixth top-level category, tribal, were identified. It should be noted that these Carnegie classifications represent a broad multidisciplinary classification of each institution’s activity, and do not specifically designate a limit of the highest degree granted. For example, institutions classified as masters may grant a limited number of doctoral degrees in some fields; institutions classified as associate or specialized may grant bachelor’s degrees.
Using a random sample calculator (Custominsight.com, n.d.) we determined that 220 participant-institutions from the initial population of 517 were needed to sample with 95% confidence. Each institution in the initial population was assigned a random number by a computer function, and then sorted; the first 220 randomly numbered institutions were selected. We compared the random sample with the initial population and found it to be consistent with distribution according to the 2000 Carnegie classifications and the six NAfME regions, indicating that the sample was representative of institutional type and geographic region.
Following the sample selection, the 2007 NASM directory was used as a guide in concert with Internet search engines to locate institution websites from which music education faculty were identified. Applied faculty who taught methods courses were not included in the study unless indicated that they performed additional music education duties or were the only faculty members with any music education affiliation. When no e-mail address was supplied by the school or department website, university directories were used to retrieve e-mail addresses using names provided on the department webpage.
The retrieval of e-mail addresses resulted in a list of 665 individual participants to whom a survey invitation was mailed electronically during the summer of 2008. The actual survey was accessible through a web browser via a link included in the invitation message. After one week, participants who had not yet responded were sent a reminder via e-mail. Of the potential participants in the sample, 6.9% viewed some portion of the survey, but did not complete any questions in the survey (n = 46), while 7.2% (n = 48) partially completed the survey. Approximately 96% of those who responded partially or fully indicated that they were correctly identified as music education professors. The overall valid response rate for usable surveys completed by correctly identified music education professors was 35.5% (N = 236), similar to the response rate reported by Hewitt and Thompson (2006) of 35.66%. Although this response rate is lower than generally desired, the actual number of respondents is relatively high, making the sample usable according to large-sample survey criteria discussed by Creswell (2002).
The online survey was developed by the researchers to specifically address the research questions of this study, while also incorporating similar items explored by Hewitt and Thompson (2006). The survey queried participants about personal demographic variables such as gender and age, along with experience variables such as K–12 teaching experience, highest degree held, and age at first postsecondary position. Items on the survey also collected data about the participant’s time allocation at his or her current position for use in the comparative analysis between institutions of different Carnegie classifications. Additionally, some information was collected pertaining to up to four previous positions held by the respondent. This information was used for the analysis of reasons for leaving prior positions. The initial survey was pretested with 15 research design professionals (in music education and other fields) and was subsequently revised based on feedback and suggestions for clarification (Babbie, 1990). The complete survey instrument is available online at http://jmte.sagepub.com/supplemental as a supplement to the digital edition of this article.
Results
Male respondents made up 55.1% of the sample (n = 124), with females composing 44.9% (n = 101). The mean age of respondents was 51.5 years (SD = 11.0), with a moderate negative skew (the median age was 53.0 years). There was no significant difference (n = 224, t = −0.686, p = .494) in the mean current age for male respondents (M = 51.11) and female respondents (M = 52.13). The mean age at which participants reported attaining his or her first position was 36.2 (SD = 9.4) and was moderately positively skewed (median = 34.0). There was a significant difference (n = 222, t = −2.929, p = .004) in the mean ages at which male (M = 34.61) and female (M = 38.27) respondents began their first position in higher education. Slightly less than half of the sample (41.8%, n = 94) indicated holding only one position in higher education to date, whereas 31.1% of respondents (n = 73) indicated holding two positions. Only 26.6% of respondents indicated holding three or more positions in higher education. There was no significant difference (n = 224, t = 1.237, p = .218) in the mean number of total positions held to date by male (M = 2.19) and female (M = 1.94) respondents.
Of those participants who answered the survey question concerning K–12 teaching experience, 96.4% indicated having such experience. Respondents reported a range of 1 to 50 years teaching K–12, with a mean of 12.25 years (SD = 9.6) and a median of 9.00 years, indicating a positively skewed distribution. There was no significant difference (n = 211, t = −1.625, p = .106) between males (M = 11.30) and females (M = 13.44) in the number of years they had spent teaching in K–12 positions. We asked participants to indicate which subjects they taught in K–12 schools and to check all areas that applied. Overall frequencies and frequencies by gender are shown in Table 1. Additionally, 8.5% (n = 20) of the participants indicated K–12 teaching experiences in other areas, responses that generally included music theory courses and nonmusic courses.
Frequencies of K–12 Teaching Experience by Subject and Gender
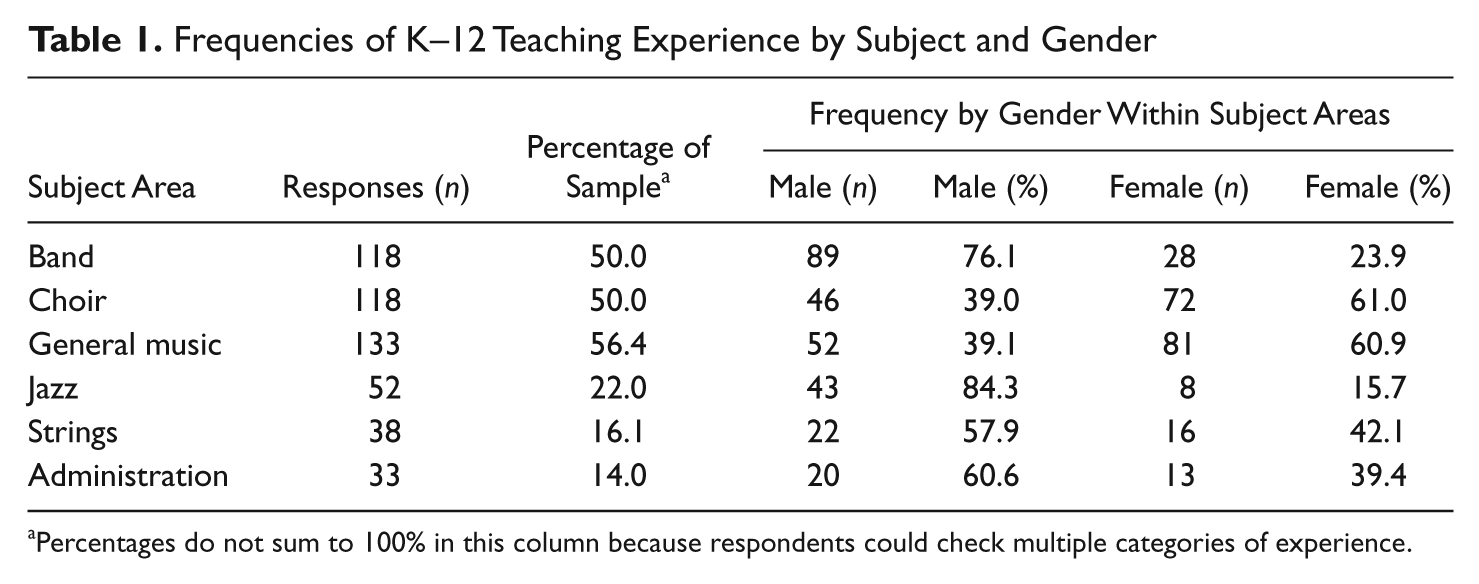
Percentages do not sum to 100% in this column because respondents could check multiple categories of experience.
Reporting their highest degree attained, respondents overwhelmingly indicated holding doctorate degrees (n = 180, 80.4%). Participants holding master’s degrees (n = 35, 14.8%) and other degrees (n = 9, 3.8%) made up the remainder of the sample. Other degrees generally consisted of specialist or other post–master’s degrees. When examining these data grouped by institutions of different Carnegie classifications, the difference in the incidence of doctorates was even more pronounced at doctoral universities as shown in Table 2.
Frequency of Highest Degree Held Within Institution Types
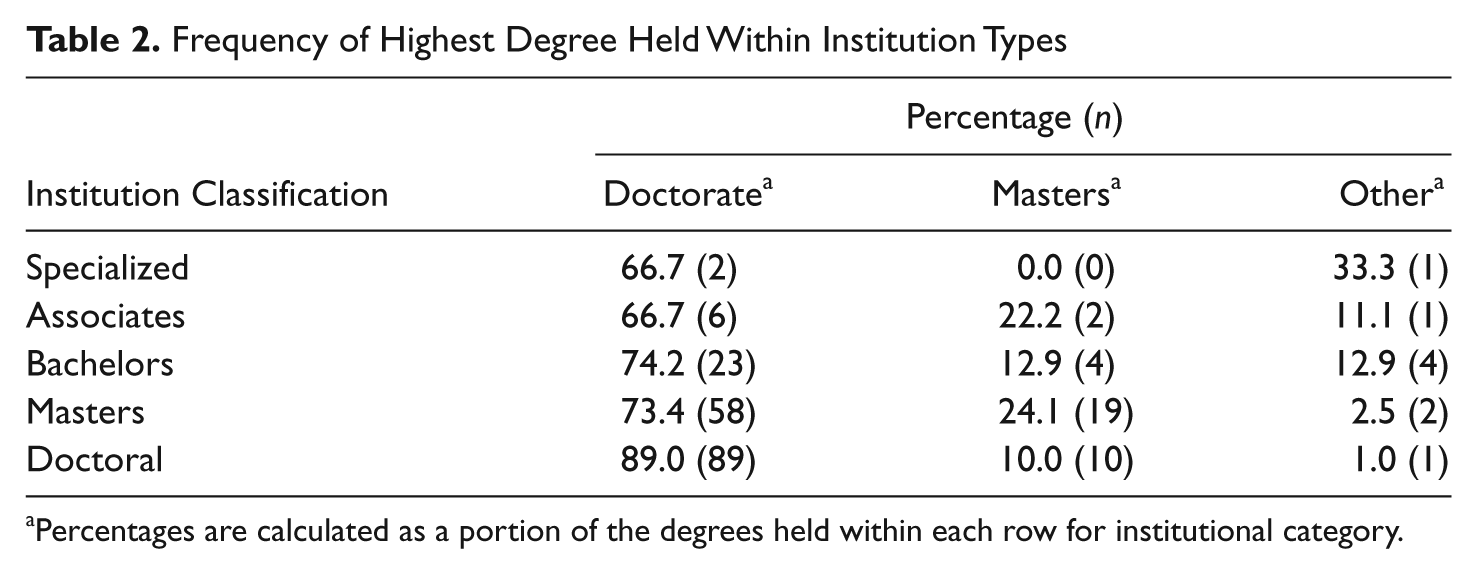
Percentages are calculated as a portion of the degrees held within each row for institutional category.
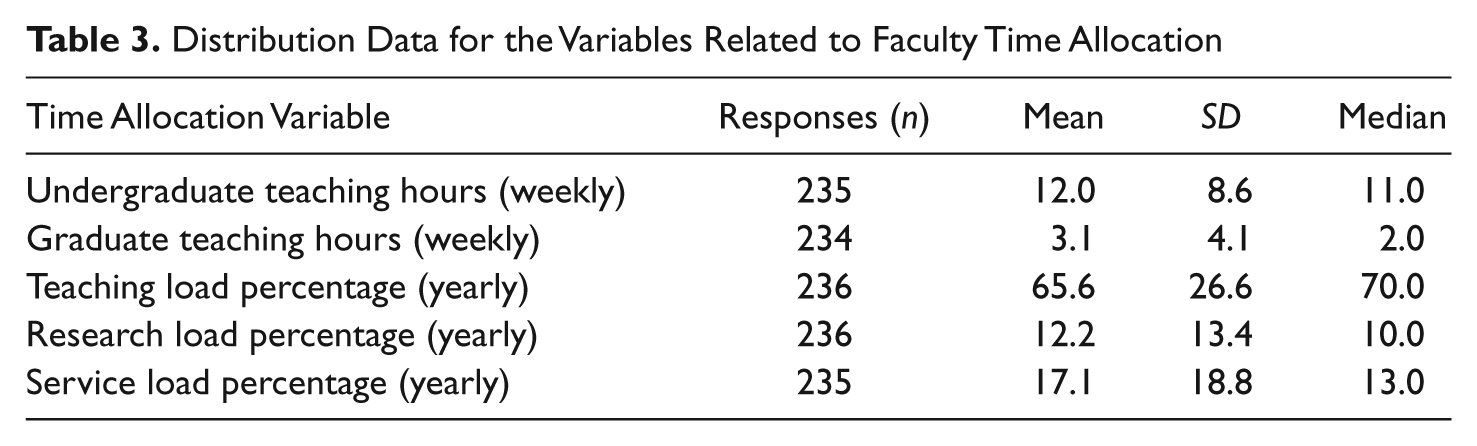
Distribution data for the variables related to faculty time allocation are reported in Table 3. Undergraduate teaching hours and graduate teaching hours referred to the average number of hours devoted weekly to teaching courses at undergraduate and graduate levels. The three load variables (teaching, research, and service) referred to the percentage of assigned workload in each category over a school year.
Distribution Data for the Variables Related to Faculty Time Allocation
The variables for undergraduate and graduate teaching hours were tested for differences between institutions of different categories of Carnegie Foundation classification using a sheltered analysis of variance (ANOVA) approach to test for multivariate differences. Both variables were first entered into a multivariate analysis of variance (MANOVA) design using the classification as the grouping variable. The model was significant (Wilks’s Λ = .851, n = 231, p < .000). Follow-up ANOVA tests were performed on each variable. The ANOVA for undergraduate teaching hours was significant (F = 2.636, n = 232, p = .035). A post hoc Tukey test revealed a significantly higher group mean for undergraduate teaching hours at bachelor institutions (M = 15.00) compared with doctoral institutions (M = 10.13), but not between other pairwise group comparisons. The ANOVA for graduate teaching hours was also significant (F = 7.762, n = 231, p < .000), with post hoc Tukey tests indicating a significantly higher group mean for doctoral institutions (M = 4.32) when compared with bachelors (M = .47) and masters (M = 2.91) institutions. It should be noted that the cell sizes for associate and specialized institutions were very small (n = 9 and n = 3, respectively), which may have limited the ability of the models to detect significant differences in those categories.
The load percentage variables for teaching, research, and service were also tested for differences between institutional categories using a sheltered ANOVA approach. The three variables were entered into a MANOVA design using Carnegie classifications as the grouping variable. The model was significant (Wilks’s Λ = .790, n = 232, p < .000). Follow-up ANOVA tests were performed on each variable. The ANOVA for teaching percentage was significant (F = 4.052, n = 232, p = .003). Post hoc Tukey tests revealed a significantly lower mean for teaching percentage at doctoral institutions (M = 58.88) when compared with bachelors (M = 77.03) and masters (M = 69.72) institutions. The ANOVA for research percentage was significant (F = 13.735, n = 232, p < .000). Post hoc Tukey tests revealed a significantly higher mean for doctoral institutions (M = 18.37) when compared with associates (M = 1.11), bachelors (M = 4.84), and masters (M = 8.43) institutions. The ANOVA for service percentage was not significant (F = 1.000, n = 232, p = .409). As before, the low cell size for specialized institutions (n = 4) may have limited the ability of the models to detect significant differences.
An ANOVA performed on current age using Carnegie classifications as the grouping variable was not significant (F = 0.831, n = 223, p = .506). A similar ANOVA performed on the variable for years of K–12 teaching experience also was not significant (F = 0.764, n = 210, p = .550).
We provided respondents with an open-ended text area where they could indicate reasons for leaving prior positions in higher education where applicable. The total number of responses was 218, where each respondent could enter reasons for leaving up to four prior positions. These responses were coded using NVivo 8 analysis software and grouped into four major categories: (a) professional, (b) problem, (c) personal, and (d) other. Professional reasons were those related to career choices, such as looking for greater opportunity, moving into a tenure-track position, increased salary, or working at a larger institution, among others. Problem reasons were those indicating dissatisfaction or negative circumstances that contributed to the respondent leaving the position. These included such items as temporary positions, unfavorable working conditions, failing to pass review, and position cuts, among others. Personal reasons were those related to the respondents’ personal choices or lives. These included such items as moving closer to family, spouses changing jobs, retiring, and returning to pursue a higher education degree, among others. Responses were coded in the other category if a respondent indicated a “not applicable” response meaning that the respondent was currently still employed at the position in question. Some other responses were also coded as “nondescript” when no clear categorization could be derived from them. Professional reasons tended to dominate the percentage of responses (54.5% of all responses to this item). “Leaving for another faculty position” with no further elaboration was the most common response. In the category of problem reasons (21.9% of all responses), employment termination because of the temporary nature of the position was the most frequent response. The categories for personal and other represented 15.1% and 8.2% of all responses to this item, respectively.
Discussion
The purpose of this study was to examine a small set of demographic and time allocation information provided by music education professionals at institutions of higher education and to make comparisons between these data according to institutional classification. By learning more about who we are and what we do, as a profession, we can begin to recognize trends and better understand the established norms of the profession. We can also better prepare those entering the field by helping them anticipate what they might expect as they consider professional life after graduate school and perhaps enter the professoriate. To this end, construction of a “typical respondent” profile based on participant responses is worthwhile. This cannot be claimed as an exhaustive or comprehensive profile; there are obviously many permutations of all aspects of the study and many categories of information not addressed in the survey. It is beneficial to examine the responses, however, for central tendencies that may help us to better understand our profession and the people within it.
The typical respondent identified by the data in this survey is similar to that from 4 years before (Hewitt & Thompson, 2006). This typical individual is likely to be male, hold a doctorate degree, and be approximately 51.5 years old. He would be in his first or second higher education position, having begun postsecondary teaching at around age 36, with between 9 and 12 years of K–12 teaching experience. If male, he would most likely have experience teaching band; if female, she would most likely have experience teaching choir or general music.
The largest portion of faculty time allocation for the typical respondent by far consists of teaching, likely 65% or more. The majority of time will be spent with undergraduate students, typically about 12 hours per week. It is much less likely that time will be devoted to teaching graduate students, although this changes by institutional classification. Service makes up the next highest portion of the workload for the typical respondent, followed by research, although the variance in these data indicates it would not be uncommon to have no portion of workload in these categories—particularly research, again with variance by institutional classification.
When the typical individual leaves a position in higher education, it is most likely for professional reasons. In particular, he or she will leave a position for another position in higher education, one with increased opportunity and perhaps a tenure-track or full-time position if one was not previously held. If the typical respondent left because of problems with the position, it was most likely because of the temporary nature of the position, workload problems, or unfavorable working conditions. If the typical respondent left for personal reasons, a wide variety of explanations might be given including geographic concerns, moving closer to family, retiring, or returning to school to pursue a higher education degree (most likely a doctorate).
The general trends observable from these data and the profile of the typical respondent have implications for the preparation of music teacher educators. It would seem that a doctoral degree is a necessity for a person wishing to enter the music education professoriate, especially for those desiring to teach at doctoral-classified institutions. Such information could be valuable for K–12 teachers contemplating the possibility of a career in higher education. For a person wishing to enter the music education professoriate, K–12 teaching experience would be highly advisable, with 9 to 12 years as an average length.
In considering implications for future research, the method of identifying music education faculty members via information on institution websites was seemingly effective, yet challenging. Format of department websites and the information provided by them varies greatly among institutions. Some institutions list clearly which faculty members are affiliated with music education by listing members according to department. In some instances, however, department affiliation can only be found by accessing individual faculty biography webpages. In other instances no indication of teaching responsibilities is provided. Additionally, the survey was administered during the summer months and while it was hoped that the survey timing would increase the response rate (assuming participants were likely to have more free time to complete the survey), it is possible that the survey timing had a negative impact on the response rate because participants were not on campus or checking campus e-mail. This may indicate that the typical respondent does not generally respond to work-related e-mail during vacation periods. It would be of use to launch a similar survey during the academic year to examine whether an increase in response rate would occur. Given the difficulty experienced in this study and by Hewitt and Thompson (2006) in accurately identifying and contacting music education faculty at postsecondary institutions, the music education research community may wish to consider the benefits of a survey implemented under the auspices of one or more professional associations for music faculty. Reliable data might be more easily obtained if such a survey became a periodic feature for research in the field, similar to the Schools and Staffing Survey, executed yearly for K–12 schools by the U.S. Department of Education’s National Center for Education Statistics (http://nces.ed.gov/surveys/sass/). Such data would also help alleviate some of the sampling bias problems associated with basing surveys on only those institutions who pursue voluntary NASM membership.
Future research should continue to explore trends in demographics and time allocation variables among the music education professoriate, with particular attention to differences by institutional classification. Such examinations will inform the adequate preparation of future music teacher educators by helping graduate students prepare for a diverse and competitive job market. As noted by Fredrickson and McCabe (2007),
Music students with terminal degrees may well imagine themselves teaching in a place like their graduate school, but . . . it is more likely that their first job will be in a smaller department . . . offering a limited number of, if any, graduate degrees. (p. 58)
Likewise, the issues concerning the potential music teacher educator shortage as identified by Asmus (2001) and Teachout (2004) are in need of reexamination. The economic climate in the United States has changed drastically in recent years and higher education has not been left untouched by these changes. In 2007, Fredrickson and McCabe asserted that “the general outlook for new graduates appears to be promising” but also warned that their “optimism should be balanced by the current higher education budget picture in the United States” (p. 57). In a study of music education job postings, Sims, Jeffs, and Barrow (2010) noted that “the duration and impact of the sudden downturn in the economy at the end of 2008, which resulted in many hiring freezes or ‘chills,’ is yet to be determined” (p. 73). Additionally, a report published by HigherEdJobs.com (2009), one of the largest agencies involved in academic job postings, demonstrates that “while the number of jobs in higher education has remained relatively stable, the number of advertised job openings has decreased significantly” (p. 4) and suggests that “colleges and universities may be trying to reduce payrolls but are doing so through attrition and ‘hiring freezes’ as opposed to mass layoffs” (p. 4). Such findings may also indicate decreased mobility among those employed in higher education, an area of inquiry that, with few exceptions, has received little attention in the field of music education (e.g., Aurand & Blackburn, 1973). Further research examining the impact of the economic recession on employment and time allocation in the music education professoriate is needed.
The need for reliable and sustained research on demographic and time allocation profiles of music teacher educators is clear. It is important to the success of future music teacher educators that they are adequately prepared for varied demands at institutions of different types and for the realities of employment in a professional landscape that may be changing. Such research can inform the decisions of current music teacher educators as they revise programs of study, and guide current and future doctoral students alike as they navigate important and life-changing career decisions.
Footnotes
Authors’ Note
David A. Rickels is now at the University of Colorado at Boulder, Boulder, CO, USA.
Declaration of Conflicting Interests
The author(s) declared no potential conflicts of interest with respect to the research, authorship, and/or publication of this article.
Funding
The author(s) received no financial support for the research, authorship, and/or publication of this article.
References
Supplementary Material
Please find the following supplemental material available below.
For Open Access articles published under a Creative Commons License, all supplemental material carries the same license as the article it is associated with.
For non-Open Access articles published, all supplemental material carries a non-exclusive license, and permission requests for re-use of supplemental material or any part of supplemental material shall be sent directly to the copyright owner as specified in the copyright notice associated with the article.