
Abstract
This article studies the impact of a competing firm's substantial expansion in product variety, achieved through modularity and delayed differentiation, on the sales and inventory of the focal firm in the market. Intuitively, the firm's sales are expected to decrease when a competitor increases its product variety, as existing consumers are drawn to the greater range of competing products, resulting in a substitution effect. However, we also emphasize a simultaneous spillover effect, where the dramatic increase in a competitor's product variety can expand the overall market for all firms (including the focal firm) by attracting new consumers to the market. The net impact thus depends on the tradeoff between the substitution effect and spillover effect, forming an empirical question. To explore this tradeoff and quantify the net impact of a competitor's substantial increase in product variety on the focal firm's sales and inventory, we exploit the launch of Coca-Cola's Freestyle dispenser that offers over 120 beverage products via modularity and delayed differentiation. Our analysis focuses on the treatment effects of the launch of Freestyle on changes in the focal firm's sales quantity, sales dispersion, and inventory levels. Contrary to common intuition, we find that the focal firm's total sales remain unchanged following the launch of Freestyle dispensers, but its sales dispersion increases by 2.2%, which in turn leads to a 1.0% increase in inventory levels at distribution centers. The unchanged total sales and increased sales dispersion imply a redistribution of sales among the focal firm's stock keeping units (SKUs). By analyzing data at the SKU level and the business customer level, we uncover the mechanism behind this sales re-allocation: a 1.9% increase in the sales of the focal firm's long-tail products at the expense of its star product sales. Meanwhile, we identify a 0.9% increase in sales to retailers and entertainment locations, while sales to restaurants decline. These empirical results help disentangle the substitution and spillover effects on the focal firm's sales resulting from its competitor's substantially increased product variety. Managerial implications derived from these findings are discussed.
Introduction
The expansion of product variety has been identified as one of the prominent trends in the consumer packaged goods industry (Deloitte Press 2020). Extant research has shown that increasing product variety can provide firms with competitive advantages, boost sales, and meanwhile increase inventory levels (Fisher and Ittner 1999, Gaur et al. 2005, Kavadias and Ulrich 2020, Lancaster 1990). However, our understanding of how competing firms’ increased product variety affects the sales and inventory of the focal firms remains limited.
When a competitor expands its product variety, it is intuitive to expect a substitution effect on the focal firm's sales as consumers may switch from the focal firm to its competitor's offerings (Fosfuri and Giarratana 2009, Sun and Kumar 2020). Yet, managers often overlook a simultaneous spillover effect, which can actually bolster the focal firm's sales. The spillover effect occurs when the greater variety of products attracts new consumers to the market, some of whom will also purchase the focal firm's products. A classic example of such a spillover effect is the introduction of Kodak's instant cameras, which inadvertently benefited the sales of its rival: Panasonic (Mahajan et al. 1993). Thus, when a competitor's increased product variety gives rise to both substitution and spillover effects, the resulting sales change for the focal firm depends on the tradeoff between these two effects, making it an empirical question. Consequently, knowing the existence and net impact of both effects, whether resulting in a sales gain or loss due to a competitor's increased product variety, is crucial for the focal firm to formulate strategic responses. Moreover, if the tradeoff is heterogeneous across products, the sales dispersion would change as a result, which will subsequently affect the firm's inventory levels (Gallino et al. 2017).
This article empirically investigates the existence and tradeoff of the substitution and spillover effects, the changes in sales dispersion, and the subsequent impact on inventory levels of the focal firm when faced with a substantial increase in its competing firm's product variety. Our study leverages the notable expansion of product variety by Coca-Cola (i.e., the competitor in our context) through its innovative Freestyle dispenser. Unlike traditional dispensers that rely on large five-gallon bags of premixed syrup, Freestyle utilizes ultraconcentrated 46-ounce cartridges, which enable the mixing of syrups, flavors, sweeteners, and carbonated water upon consumers’ selections. That way, a Freestyle dispenser can offer over 120 different Coca-Cola products, compared with the traditional dispensers that typically provide eight products or fewer. Notably, many products, such as raspberry-flavored Fanta Zero and orange-flavored Minute Maid lemonade, did not exist in the market before the launch of Freestyle dispensers. By examining this event of a sudden and substantial increase in product variety, we explore the associated substitution and spillover effects by studying their impact on the sales and inventory of another firm in the soft drink market (i.e., the focal firm). The focal firm produces beverage products that directly compete with Coca-Cola's offerings and sells them to various business customers, such as restaurants and retailers. On the one hand, with the elevated substitution effect due to Coca-Cola's expanded product variety, consumers may switch from the focal firm's products to Coca-Cola's offerings. On the other hand, if the spillover effect exists, new consumers are attracted to the soft drink market by the enhanced product variety, and some of them may purchase the focal firm's products. Specifically, our research addresses the following questions: what is the change in the focal firm's sales quantity resulting from the tradeoff between the substitution and spillover effects due to its competitor's drastic increase in product variety? Are the sales changes heterogeneous across the focal firm's stock keeping units (SKUs) and business customers due to the tradeoff between these two effects? If the heterogeneous changes in sales lead to altered sales dispersion, does the focal firm's inventory level change consequently?
The event and empirical context in our study provide unique characteristics that enable us to address the aforementioned questions. First, the launch of Freestyle dispensers gives rise to a drastic and sudden increase in Coca-Cola's product variety at the point of sales with no imitators for a long time. Firms usually introduce new products incrementally over time, especially in mature markets. For example, car-makers usually take a few years to introduce a brand-new model. The incremental and routine increase in product variety is expected by both consumers and other firms in the market, making it difficult to isolate the specific impact of one firm's increased product variety among similar changes by other firms at the same time. Unlike the incremental increase in product variety, the dramatically increased product variety of a competing firm through modularity and delayed differentiation is not only leading to a larger-scale impact, but also difficult to mimic by other firms in the short term, thus allowing for disentangling the opposite substitution and spillover effects and evaluating their net impact on the focal firm's sales. Second, the carbonated soft drink market exhibits unique characteristics, as soft drink producers typically sign exclusive contracts with their business customers. This exclusive relationship with business customers offers a unique opportunity to uncover the presence of both substitution and spillover effects, and allow us to quantify the net impact with different levels of limitation on the substitution effect. Third, instead of using third-party logistics partners, soft drink manufacturers usually own their distribution centers and maintain inventories to fulfill orders from business customers. As a result, the increased product variety of a competitor may affect not only other firms’ sales but also inventory levels at their distribution centers. These unique characteristics of our empirical context enable us to provide valuable insights into the substitution and spillover effects resulting from a competitor's substantial increase in product variety and quantify their impact on the focal firm's sales, sales dispersion, and inventory levels.
We examine the focal firm's sales records at the SKU level, covering all business customers in 123 zip codes in the Atlanta metropolitan area, where the Freestyle dispensers were first launched. We consider the sales of 203 SKUs within these zip codes from June to September 2009. Importantly, our focal firm is the only source for business customers to purchase these branded products. Hence, our data includes all sales quantity of the focal firm's products to business customers in these zip codes. The launch of Coca-Cola's Freestyle dispensers is considered the treatment event, introducing a significant shock to the soft drink industry. We apply the difference-in-differences framework along with Coarsened Exact Matching (CEM) to uncover the average and heterogeneous treatment effect. Additionally, we validate our empirical findings with alternative methods, such as the synthetic control method (Abadie et al. 2010, 2015) and geographically local markets using ArcGIS (Olivares and Cachon 2009, Ren et al. 2011) together with ample robustness checks on matching, estimation, and time trends.
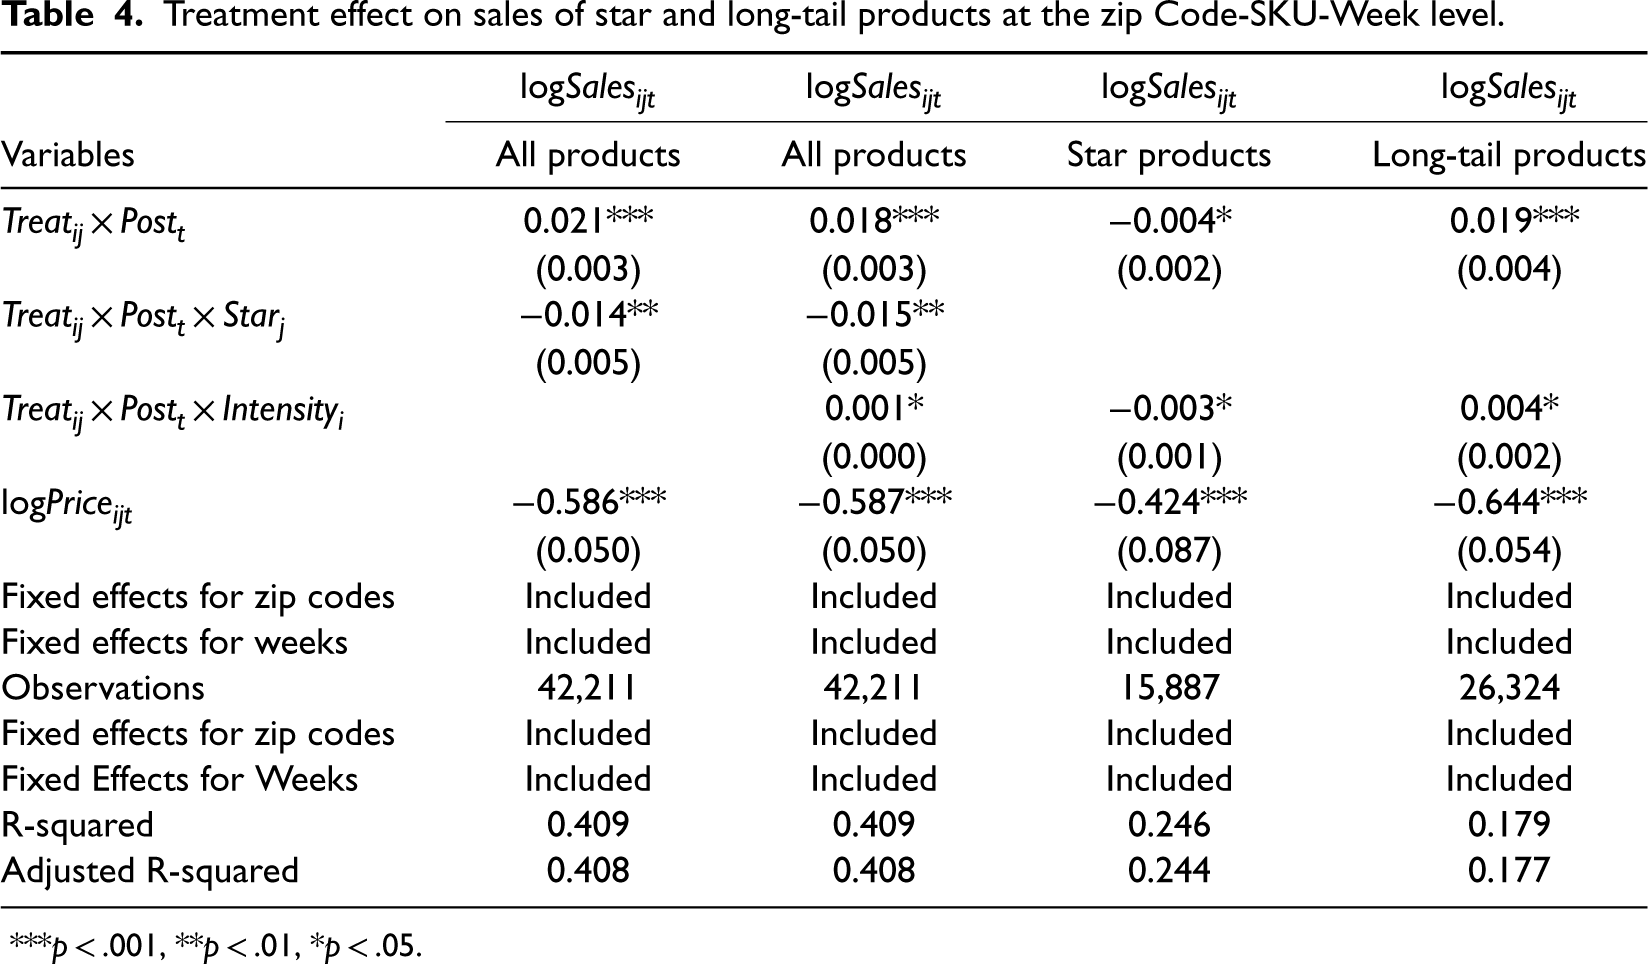
In our empirical analysis, we first investigate the heterogeneous changes in sales across different product categories. Our finding shows that the launch of Freestyle by Coca-Cola leads to a 0.4% sales decrease for the focal firm's star products, while long-tail products experience a 1.9% sales increase. These contrasting sales changes contribute to a rise in the overall sales dispersion for the focal firm, providing empirical evidence for the tradeoff between the substitution and spillover effects. Specifically, a dominant substitution effect is observed for the star products, while a dominant spillover effect affects the long-tail products. These two effects are further amplified by the intensity of treatment, that is, the density of Freestyle dispensers, which intensifies the competition between the two firms (substitution effect) and the expansion of the soft drink market (spillover effect).
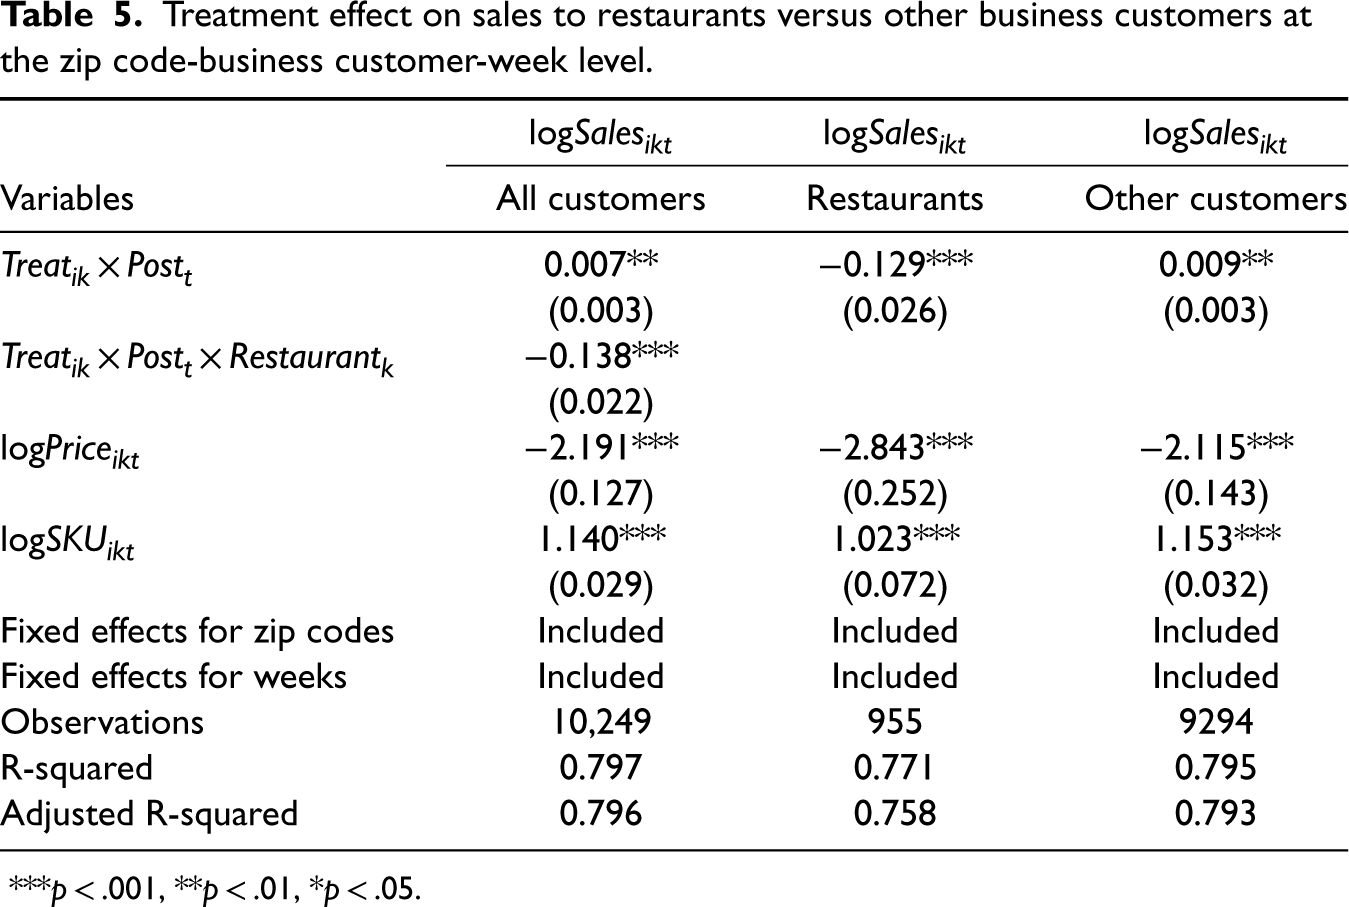
Next, we also explore the sales changes among different business customers of the focal firm, who face different levels of substitution effects. At restaurants where both effects are unconstrained, the net impact leads to a 12.9% decrease in the focal firm's sales. In contrast, for other business customers, the substitution is indirect and dampened, but the spillover is unconstrained. We find a 0.9% increase in the focal firm's sales to these nonrestaurant customers after the launch of Freestyle dispensers. The results suggest that when the substitution effect weakens, the treatment effect of Freestyle dispensers on the focal firm's sales shifts from negative to positive. These findings provide evidence of the existence of both effects—the substitution effect is more pronounced in affecting the sales changes at restaurants, while the spillover effect dominates the sales changes among other business customers.
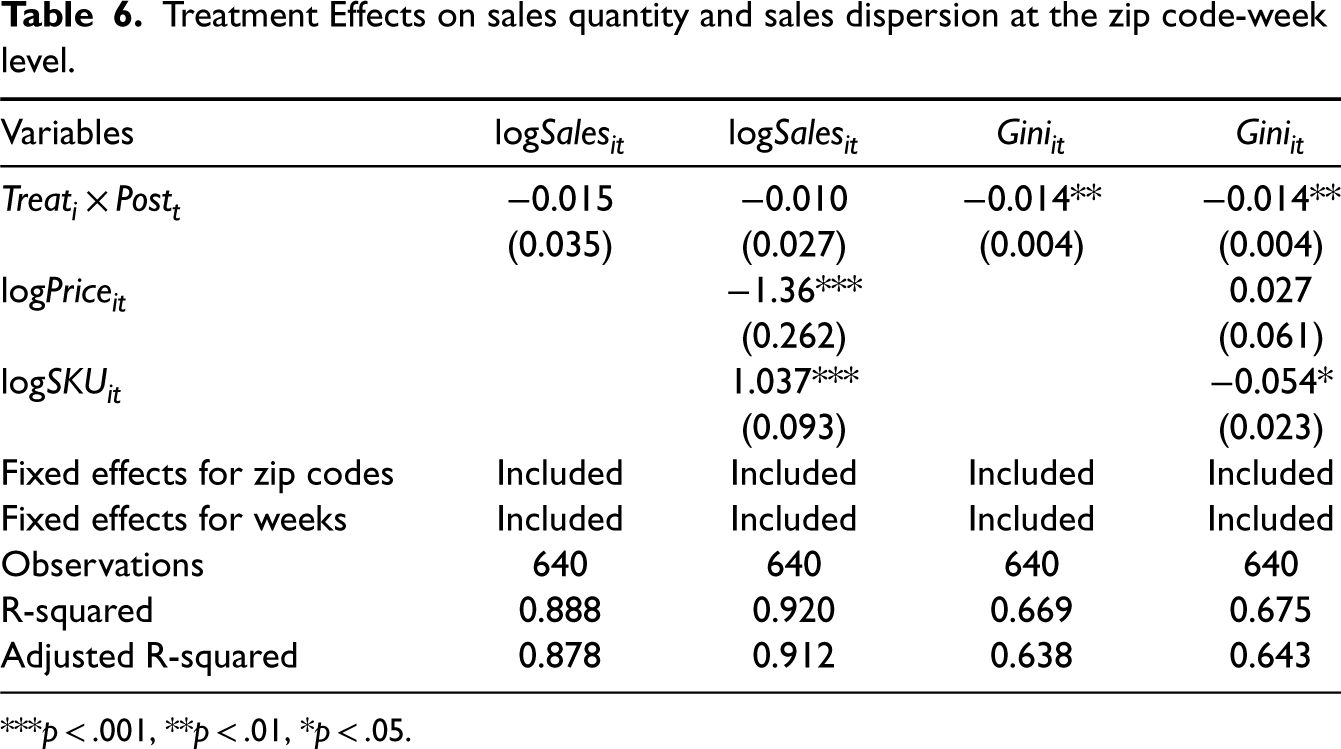
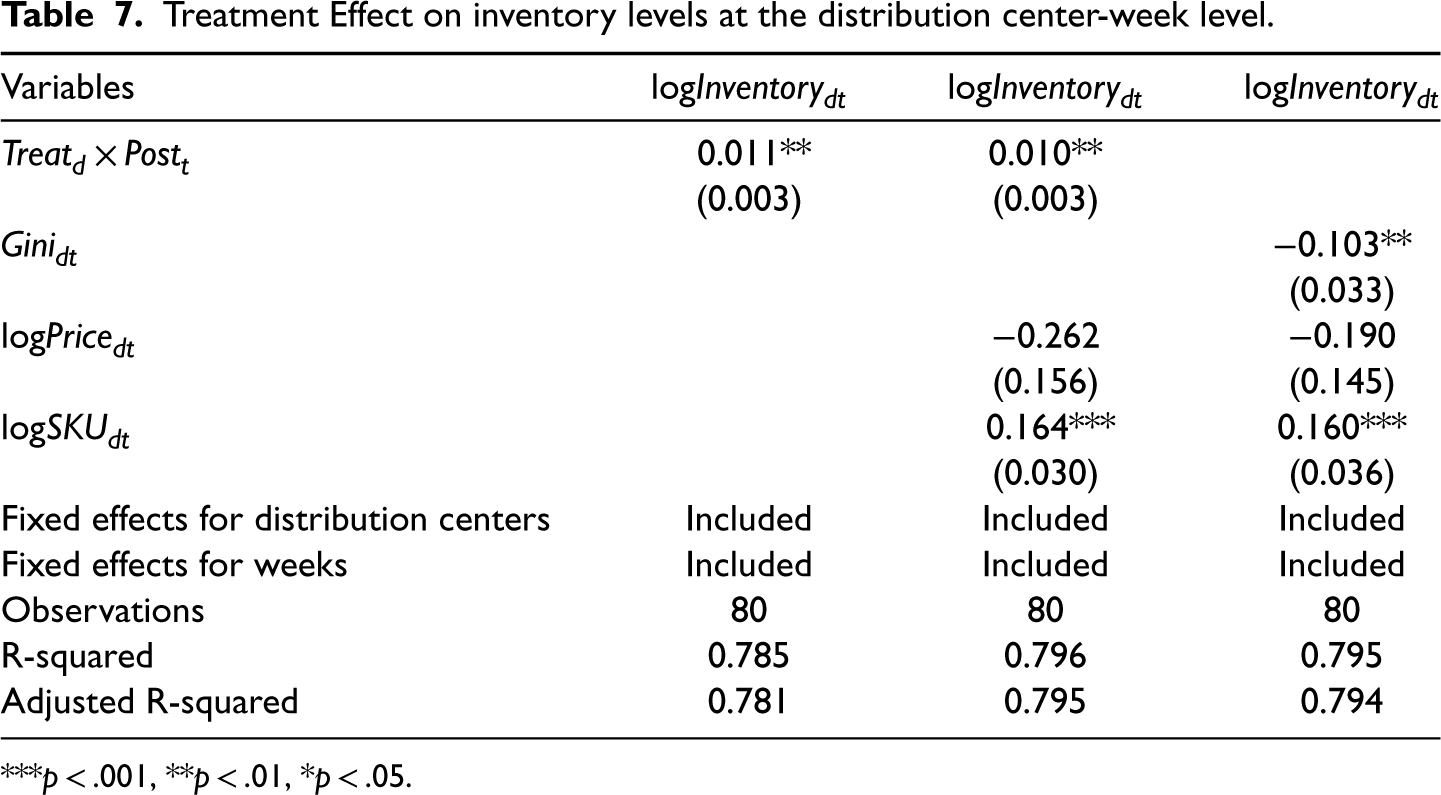
Furthermore, we estimate the overall effect of the increased product variety of Coca-Cola on the focal firm's total sales quantity. Interestingly, the results show no significant changes in the total sales quantity of the focal firm after the launch of Freestyle dispensers, different from an intuitive expectation of sales decrease upon a competitor's increased product variety. Despite the stable total sales quantity, we find that, on average, the Gini coefficient of the focal firm's sales distribution over SKUs in a zip code decreases by 2.2%, indicating a higher level of sales dispersion after the launch of Freestyle. The increased sales dispersion potentially leads to higher inventory levels, because extant theoretical research predicts that a heavy tail in sales distribution reduces the benefit of demand risk pooling (Bimpikis and Markakis 2016). Our empirical findings support this theoretical relationship by reporting a 1% increase in the inventory level at distribution centers of the focal firm after the launch of Coca-Cola's Freestyle dispensers.
We conduct several analyses to ensure the robustness of our findings and rule out potential alternative explanations. First, we examine the number of business customers, the number of SKUs, and the product price of the focal firm, both before and after the launch of Freestyle, but find no significant changes in these variables. Second, we perform robustness tests using different matching methods, estimation techniques, and functional forms. Third, pre-existing time trends are also excluded. Through these analyses, we establish a robust case for the tradeoff between the substitution and spillover effects as the primary driver of the observed changes in the focal firm's sales quantity, sales dispersion, and inventory levels.
Empirical Context
We exploit the introduction of the Coca-Cola Freestyle fountain dispenser, which revolutionized the beverage industry by providing consumers with an interactive and extensive selection of choices. Forbes recognized this innovation as one of the “coolest products of the decade” (Forbes 2011). The Freestyle dispenser features a touch-screen with digital buttons, allowing consumers to create over 120 customized beverages by mixing syrups, flavors, sweeteners, and carbonated water. While the Freestyle dispensers include the existing products in the market, most of the beverages at Freestyle dispensers are new-to-the-world products, such as orange-vanilla-flavored zero-sugar Sprite. Given that fountain drinks contribute a substantial portion to soft drink sales, approximately 30% of Coca-Cola's total sales in North America (Bigg 2009), the launch of Freestyle sparked a new soda war in the market.
The initial testing phase for the Freestyle dispensers began in July 2009, with a small set of business customers in Utah, Southern California, and Georgia (Wilson 2009). Following successful tests, large-scale deployment of Freestyle occurred in June 2010 with over 500 locations in the U.S., including restaurants, university campuses, movie theaters, theme parks, and other venues (Eaton 2010). By May 2018, Coca-Cola had installed more than 50,000 Freestyle dispensers, serving approximately 14 million drinks per day in the U.S., resulting in an 8% increase in beverage servings at the Freestyle outlets (Coca Cola Press Release 2018). The testing locations of Freestyle dispensers primarily consist of quick-service restaurants. Unlike retail stores that offer soft drinks from many different firms, quick-service restaurants usually exclusively serve soft drink brands from a single firm. For example, McDonald's and Subway provide exclusive Coca-Cola fountain products.
Georgia was selected for this study due to its excellent data availability and quality. In July 2009, the Freestyle dispensers were launched in 30 testing locations across 24 zip codes in Georgia. Appendix A in E-Companion shows a list of these 30 locations, with 29 located in 23 zip codes within the Atlanta metropolitan area and one in an adventure park in southern Georgia. To eliminate the potential impact of geographic differences, we focus on the 29 testing locations across 23 zip codes within the Atlanta metropolitan area.
Literature Review
Customization
Extant studies suggest that catering to customer preferences through customized products can lead to better fit and satisfaction (Çil and Pangburn 2017). However, customization often comes with additional production and inventory costs due to the need for unique components (Mendelson and Parlaktürk 2008, Squire et al. 2006). To address these cost challenges, researchers have recommended various approaches. One such approach is modularity, where firms use modular components that can be shared across different product configurations based on customer orders (Davies and Joglekar 2013, Hopp and Xu 2005, Vickery et al. 2016). Another approach is delayed differentiation, which reduces costs by postponing component assembly until customer preferences are clearly identified (Abbey et al. 2013, Lee and Tang 1997, Yang and Zhang 2022).
In the case of Freestyle dispensers, the strategies of modularity and delayed differentiation are effectively applied. By using modularized concentrates, flavors, and sweeteners, Freestyle provided over 120 customized products. The differentiation, that is, mixing these ingredients, is postponed until consumers click on touch screens. These features allow Coca-Cola to provide customization without incurring significant inventory costs. Without the modularity and delayed differentiation that the Freestyle dispenser offers, the costs of customization would be much higher. We contribute to the existing literature by investigating the impact of one firm's customization via modularity and delayed differentiation on other competing firms that lack such capabilities.
Product Variety
Our study is closely related to the literature on product variety, as the Freestyle dispensers dramatically increase the variety of Coca-Cola's products available to consumers. The studies on product variety often bridge the domains of operations management and marketing (Kumar et al. 2021, Xiao et al. 2014). While increased product variety can lead to higher inventory costs (Moreno and Terwiesch 2017, Wan et al. 2020) and complexity in operations (Fisher and Ittner 1999, Ramdas et al. 2003, Shunko et al. 2018, Swaminathan and Tayur 1998, Ton and Raman 2010, Yunes et al. 2007, Zhou and Wan 2017), enhanced product variety renders more options to cater to consumers’ heterogeneous preferences and thus boosts sales (Tayur 2017, Wan et al. 2012).
Our article expands this literature stream by examining the impact of one firm's increased product variety on other firms’ performance. Intuitively, the increased product variety offered by one firm is shown to reduce other firms’ market shares (Champsaur and Rochet 1989, Kekre and Srinivasan 1990). Fosfuri and Giarratana (2009) find that when a firm launches a new product in the carbonated soft drink market, its rival firm's financial market value decreases. However, other firms may also benefit from the increased product variety as it attracts new consumers to the market and expands the overall demand of the market (Mahajan et al. 1993). We enrich this literature by empirically studying the tradeoff between the substitution and spillover effects for our focal firm as a result of Coca-Cola's dramatically increased product variety. Specifically, we quantify the impact on the focal firm's total sales and sales dispersion, while exploring the interplay between the substitution and spillover effects across star products, long-tail products, and various business customers.
Sales Dispersion and Inventory
Sales dispersion, which reflects the distribution of sales across various products offered by a firm, has been extensively studied in the literature (Anderson 2006, Tan et al. 2014). Extant research has found that sales dispersion is affected by product variety (Brynjolfsson et al. 2003), searching cost (Brynjolfsson et al. 2011), online channel (Brynjolfsson et al. 2010), competition (Li and Wan 2023), channel integration (Gallino et al. 2017), and high-quality logistic service (Cui et al. 2020).
The changes in sales dispersion are theoretically proposed to lead to changes in inventory levels. Jain and Tan (2022) show that ignoring changes in sales dispersion leads to suboptimal inventory stocking. Gallino et al. (2017) find that the sales dispersion of a retailer increases when a new distribution channel is added and propose that higher sales dispersion can increase inventory levels using analytical models. Bimpikis and Markakis (2016) develop a single-period, multilocation newsvendor model and find that the benefit of the pooling effect on inventory decreases when the demand has a heavy-tailed distribution. Therefore, they suggest taking the shape of the demand distribution into account when making a risk-pooling decision. To extend these theoretical studies and provide empirical insights, we first examine whether the sales dispersion of the focal firm changes upon the launch of Coca-Cola's Freestyle dispensers. Then, we analyze whether the inventory levels of the focal firm change with sales dispersion according to the expected relationship proposed by previous theoretical research. Through these empirical investigations, we provide empirical evidence for the relationship between sales dispersion and inventory levels.
Theory Development
Spillover Effect Versus Substitution Effect
Coca-Cola's increased product variety through the introduction of Freestyle dispensers can have two potential effects on the sales of the focal firm: a spillover effect and a substitution effect. The drastically increased product variety can generate a spillover effect, benefiting other firms in the market and increasing their sales. The introduction of new and diverse beverage combinations, along with increased awareness of the Freestyle dispensers, can attract new consumers to the soft drink market (Mahajan et al. 1993). These new consumers may be enticed to try beverages from the Freestyle dispensers, ultimately becoming soft-drink enthusiasts who continue to purchase products, including the focal firm's offerings. On the other hand, the substitution effect drives consumers to switch from other soft drink firms to Coca-Cola, leading to a decrease in their sales. As Coca-Cola drastically increases its product variety via the launch of Freestyle dispensers, it better aligns with consumers’ preferences and their variety-seeking behaviors (Berger et al. 2007, Lancaster 1990). The substitution can manifest through brand substitution, where consumers switch from the focal firm's products to Coca-Cola or other producers, and store substitution, where consumers switch from business customers that exclusively sell the focal firm's products to other business customers.
Sales Across Products
According to the Pareto principle (Pareto 1964), a small portion of star products often accounts for a large portion of sales. The star products represent the main offerings of a firm and are in high demand among consumers. Although both the substitution and spillover effects impact all products of the focal firm, the spillover effect on the star products may be weaker than that on the long-tail products, because star products are more established and mature. The spillover effect due to the market expansion through increased product variety is weaker in a more mature product market (Fosfuri and Giarratana 2009). Assuming the substitution effect is the same across products, the weaker spillover effect on star products implies that the sales of star products may decrease more than those of long-tail products. Such differential changes in sales between the star and long-tail products can alter the sales dispersion of the focal firm. Specifically, if the sales of star products decrease more than those of long-tail products, the sales gap between the star and long-tail products will narrow after the launch of Freestyle dispensers. That is, the long-tail products will account for a greater proportion of the total sales. As a result, the sales distribution across the focal firm's products becomes more dispersed (less concentrated) after its competitor increases product variety.
Sales to Different Business Customers
Soft drink products are primarily sold in restaurants and retail stores. Although the Freestyle dispensers introduce new products only to fountain products, consumer choices could still be influenced by the launch of these dispensers through word-of-mouth, traditional media, and social media. Thus, the spillover effect exists for different business customers of the focal firm.
The substitution effect varies across business customers of the focal firm because Coca-Cola's Freestyle dispensers introduce new varieties only to fountain products. In restaurants, soft drinks are usually exclusively provided through a single producer under contracts. Within a restaurant chain, consumers do not have the option to switch to other soft drink products, but they can switch to a different restaurant chain, where Coca-Cola's new products are available through Freestyle dispensers. Although product brand-switching within a restaurant is not possible, potential restaurant-switching can still generate a substitution effect on the focal firm's sales. Moreover, Coca-Cola initially introduced the Freestyle dispensers mainly to restaurants. The increased product variety by Freestyle intensifies the competition for the focal firm's sales to restaurant customers. In this context, the substitution effect on the focal firm's sales to restaurants is strong. Meanwhile, the spillover effect can benefit all soft drink producers in the market through increased product variety and elevated consumer awareness. Thus, both substitution and spillover effects directly influence the focal firm's sales at restaurants.
Apart from restaurants, soft drink producers sell a significant portion of their products to retailers. At retail stores, both the substitution and spillover effects influence sales, as products from multiple producers are available, allowing consumers to switch freely between products from different producers. However, since Coca-Cola's Freestyle dispensers only increase the variety of fountain products, the focal firm's bottled and canned products at retail stores face an indirect impact of the increased product variety enabled by Freestyle dispensers. Therefore, at retailers, the substitution effect on sales changes is indirect and dampened and thus expected to be weaker than the effect observed at restaurants. The spillover effect at retailers, on the other hand, is not limited.
Total Sales
The spillover and substitution effects have opposing impacts on sales. The spillover effect increases sales, while the substitution effect decreases sales of the focal firm. The overall effect of the increased product variety on the focal firm's sales depends on the tradeoff between these two effects, which leads to three potential scenarios for the focal firm: (1) if the substitution effect is stronger than the spillover effect, the sales of the focal firm's products will decrease; (2) if the spillover effect dominates, the sales of the focal firm's products will increase; and (3) if both effects are tied, the focal firm's sales will remain unchanged.
Inventory
The increased product variety introduced by a competitor may also influence the focal firm's inventory. In theory, sales dispersion is positively associated with inventory level because a heavy tail in sales distribution dampens the demand pooling effect on inventory (Bimpikis and Markakis 2016). The inventory level includes both cycle stock and safety stock. When the sales dispersion increases, cycle stock is expected to increase due to the lower economies of scale in customer orders, and safety stock is also expected to rise because the loss in demand for star products jeopardizes the pooling and forecasting accuracy (Gallino et al. 2017). Therefore, after the Freestyle dispensers are introduced, the more dispersed sales distribution may result in a higher inventory level at the focal firm.
Data Collection and Description
Data
To investigate the influence of Freestyle on other firms’ sales, we collected sales data from one of Coca-Cola's primary rivals, which opted to remain anonymous. This focal firm sells a wide range of products that directly compete with Coca-Cola in multiple states in the U.S. The firm stocks inventories at distribution centers and delivers products directly to business customers such as restaurants and retail stores (i.e., store-direct-delivery).
Our research focuses on Coca-Cola's Freestyle dispenser testing locations in Georgia, with details provided in Appendix A. We analyze sales at the zip code level, as the zip code area is commonly used to study sales changes in extant empirical studies (Bell et al. 2018). Our dataset covers 123 zip codes in the Atlanta metropolitan area, as illustrated in Figure 1. The dataset includes all the sales records from the focal firm to its various business customers. Specifically, it contains weekly sales per SKU to business customers, such as retail stores and restaurants, within each zip code. The data spans a 16-week period from June to September 2009 and is organized at the zip code-business customer-SKU-week level. Additionally, we include inventory data from distribution centers that supply these business customers.

Treated and control zip codes in the Atlanta Metropolitan Area.Note: The two white areas are Hartsfield-Jackson Atlanta Internal Airport and Cobb County International Airport.
The Freestyle dispensers were installed at the testing sites in 23 zip codes through July 2009. Thus, we consider the first week of August as the start of the post-treatment period. In our robustness check in section 8, we exclude the data from July 2009, and the results still hold. In total, there are 8 weeks before the treatment and 8 weeks after it. The introduction of Freestyle dispensers affects consumer demand at all business customers (restaurants, retailers, etc.). All business customers in these 23 zip codes where the Freestyle dispensers were introduced in July 2009 belong to the treatment group. The remaining 100 zip codes in the Atlanta metropolitan area are categorized as the control group. In addition to the proprietary data from the focal firm, we have collected data from the 2010 U.S. Census, including information on population and median household income. These demographic and economic data are matched with sales and inventory data at the zip code level.
To address the potential selection bias resulting from nonrandomly chosen treatment locations, we match treatment zip codes with control zip codes. Specifically, for each treated zip code, we first find candidate zip codes from the control group that are from the same television designated market area, to ensure consumers in both the treatment and control groups have similar exposure to TV advertising and experience comparable shifts in demand within their local markets (Seiler et al. 2021). Then, we apply the CEM method to pair zip codes in the treatment group with zip codes in the control group using pretreatment observations, such as average weekly sales, SKU numbers, business customer numbers, population, and median household income in the zip codes. CEM helps alleviate sample selection bias and reduce the impact of specific functional forms on regression results (Iacus et al. 2012, Nandkumar and Srikanth 2016, Singh and Agrawal 2011).
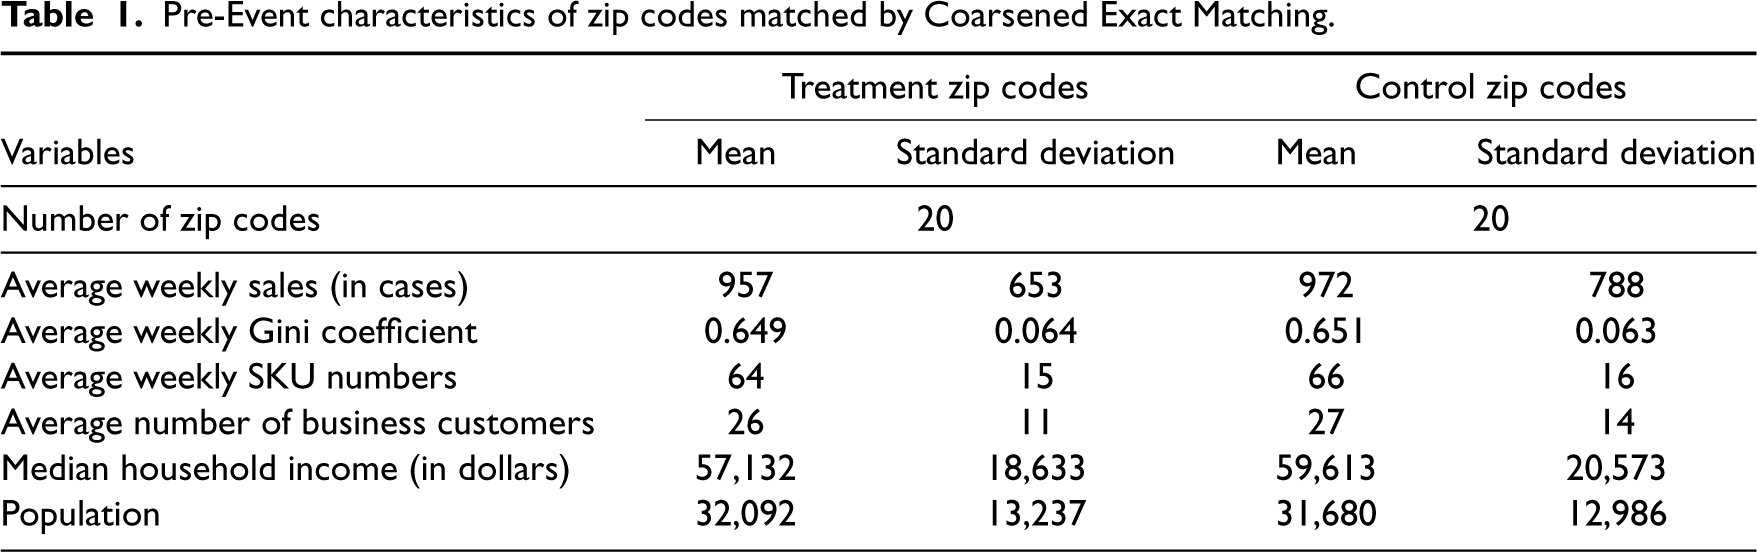
Our matching procedure identifies a sample of 20 pairs of zip codes for the treatment and control groups. Table 1 shows the means and standard deviations of the key variables in the matched treatment and control groups, demonstrating their similarity. After the matching, our data includes 40 zip codes, 1058 business customers, and 203 SKUs, yielding a sample of 113,845 zip code-business customer-SKU-week observations. Please note that not all business customers purchase all 203 SKUs.
Pre-Event characteristics of zip codes matched by Coarsened Exact Matching.
Pre-Event characteristics of zip codes matched by Coarsened Exact Matching.
In addition to the sample matched using the CEM method, we also conduct a robustness check by estimating the treatment effect with the entire dataset of all 123 zip codes. Moreover, we measure the treatment effect with alternative matching methods—synthetic control method (SCM) and geographically local market method. The results of these alternative analyses are reported in Section 8. We choose CEM over SCM for matching in the main analyses because SCM generates synthetic control zip codes, where the observation is at the zip code level and does not capture sales across products. This limitation prevents us from analyzing the heterogeneous treatment effect. Furthermore, we select the zip code level rather than the geographically local market to be consistent with the focal firm's operations, as the focal firm assigns business customers to its distribution centers based on zip codes for their order replenishments and sales.
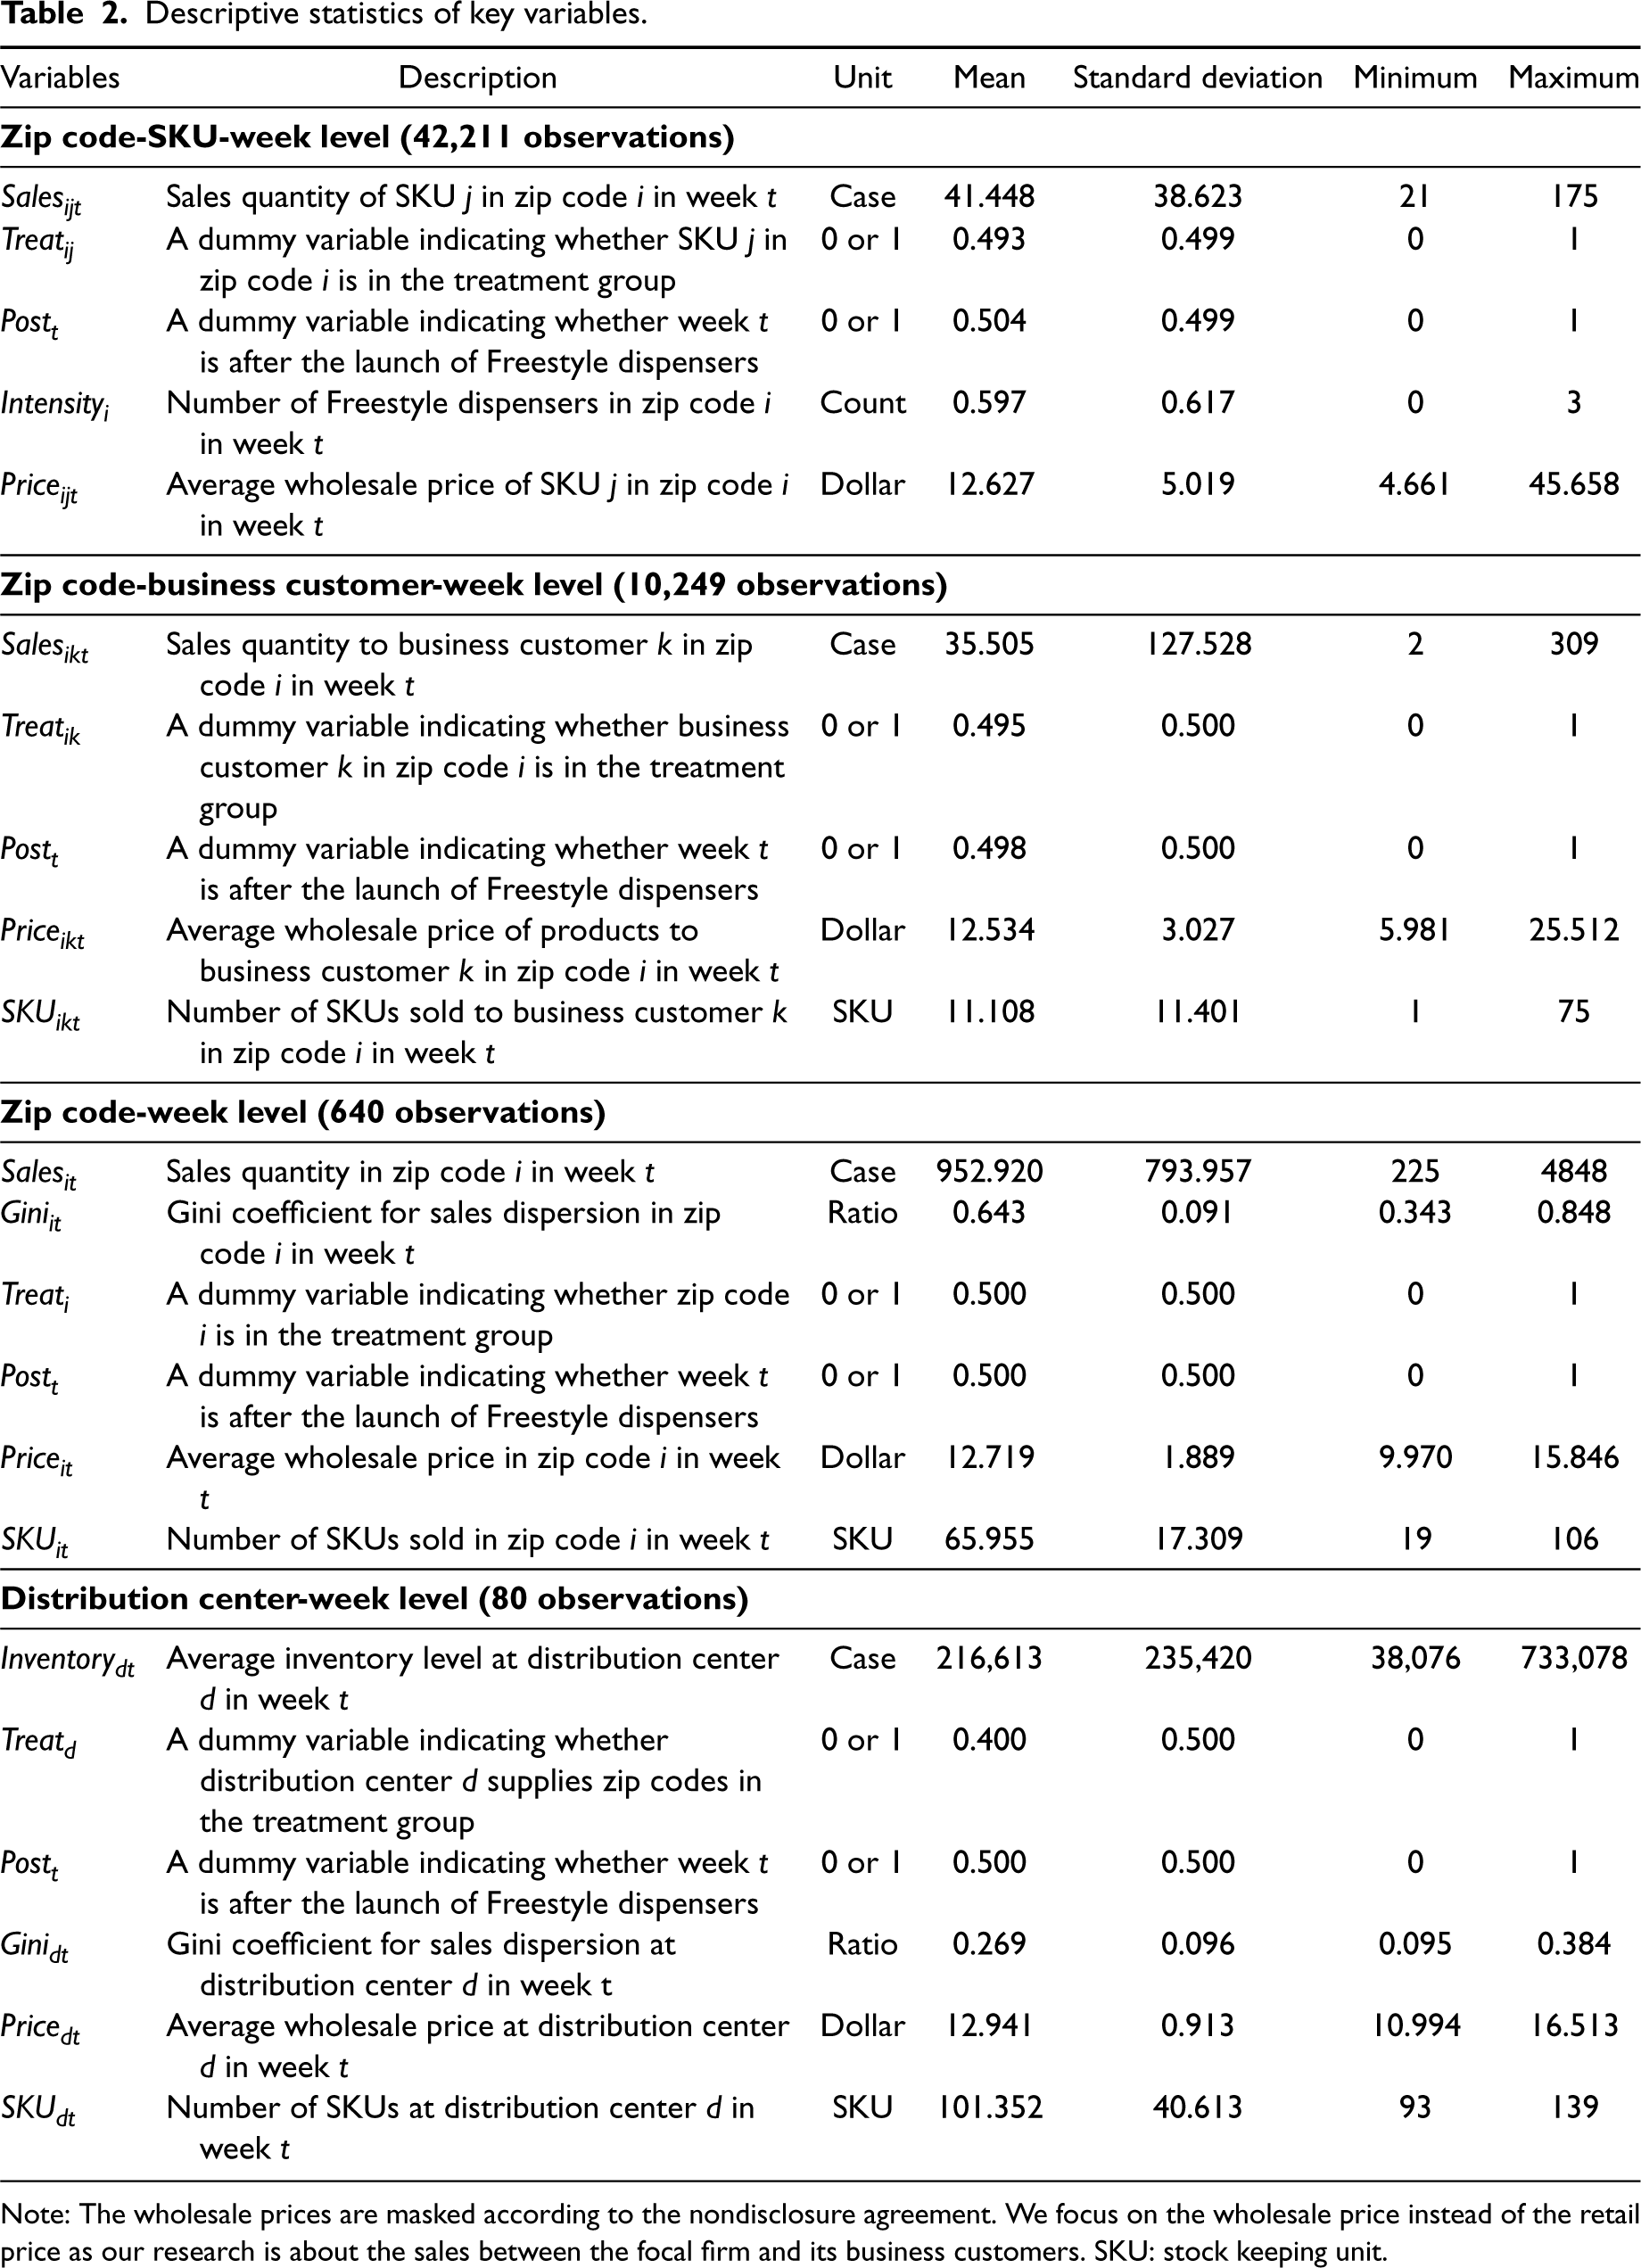
Our data is organized into four observation levels, each providing valuable insights into our analyses of sales quantity, sales dispersion, and inventory. These observation levels are (1) the zip code-SKU-week level for capturing sales across SKUs, (2) the zip code-business customer-week level for tracking sales to various business customers, (3) the zip code-week level for measuring total sales and sales dispersion, and (4) the distribution center-week level for monitoring inventory levels. The descriptive statistics of the key variables at these observation levels are reported in Table 2.
Descriptive statistics of key variables.
Descriptive statistics of key variables.
Note: The wholesale prices are masked according to the nondisclosure agreement. We focus on the wholesale price instead of the retail price as our research is about the sales between the focal firm and its business customers. SKU: stock keeping unit.
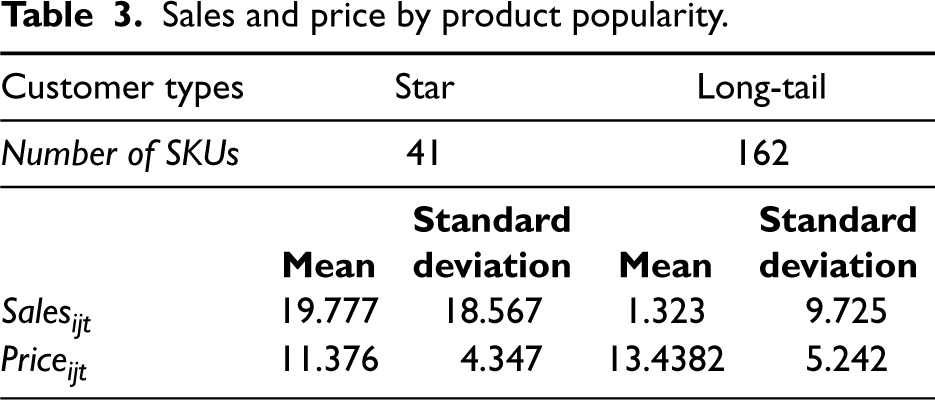
We investigate the sales across SKU popularity at the zip code-SKU-week level with 42,211 observations. According to the Pareto principle, the top 20% of products contribute approximately 80% of the total sales (Pareto, 1964). When managing a product portfolio, managers often categorize products based on their popularity into star and long-tail products (Brynjolfsson et al. 2010). Hence, we investigate the focal firm's star and long-tail products by ranking the SKUs by their sales before treatment and categorizing the top 20% (41 SKUs) as star products, which contribute to 73.05% of the total sales. The remaining 80% (162 SKUs) are classified as long-tail products, accounting for the rest 26.95% of the total sales. The sales quantity and price for both star and long-tail products are summarized in Table 3. On average, star products exhibit significantly higher sales than long-tail products. However, the average wholesale price of long-tail products is higher than that of star products. Moreover, the changes in sales across different customer types are analyzed using the data at the zip code-business customer-week level with 10,249 observations.
Sales and price by product popularity.
To study the total sales quantity and sales dispersion, we aggregate the observations to the zip code-week level, yielding 640 observations (40 zip codes × 16 weeks). The left graph in Figure 2 illustrates the average weekly sales in both the treatment and control groups during the 16 weeks of the observation window. We find the sales in both groups exhibit similar trends both before and after the launch of the Freestyle dispensers.
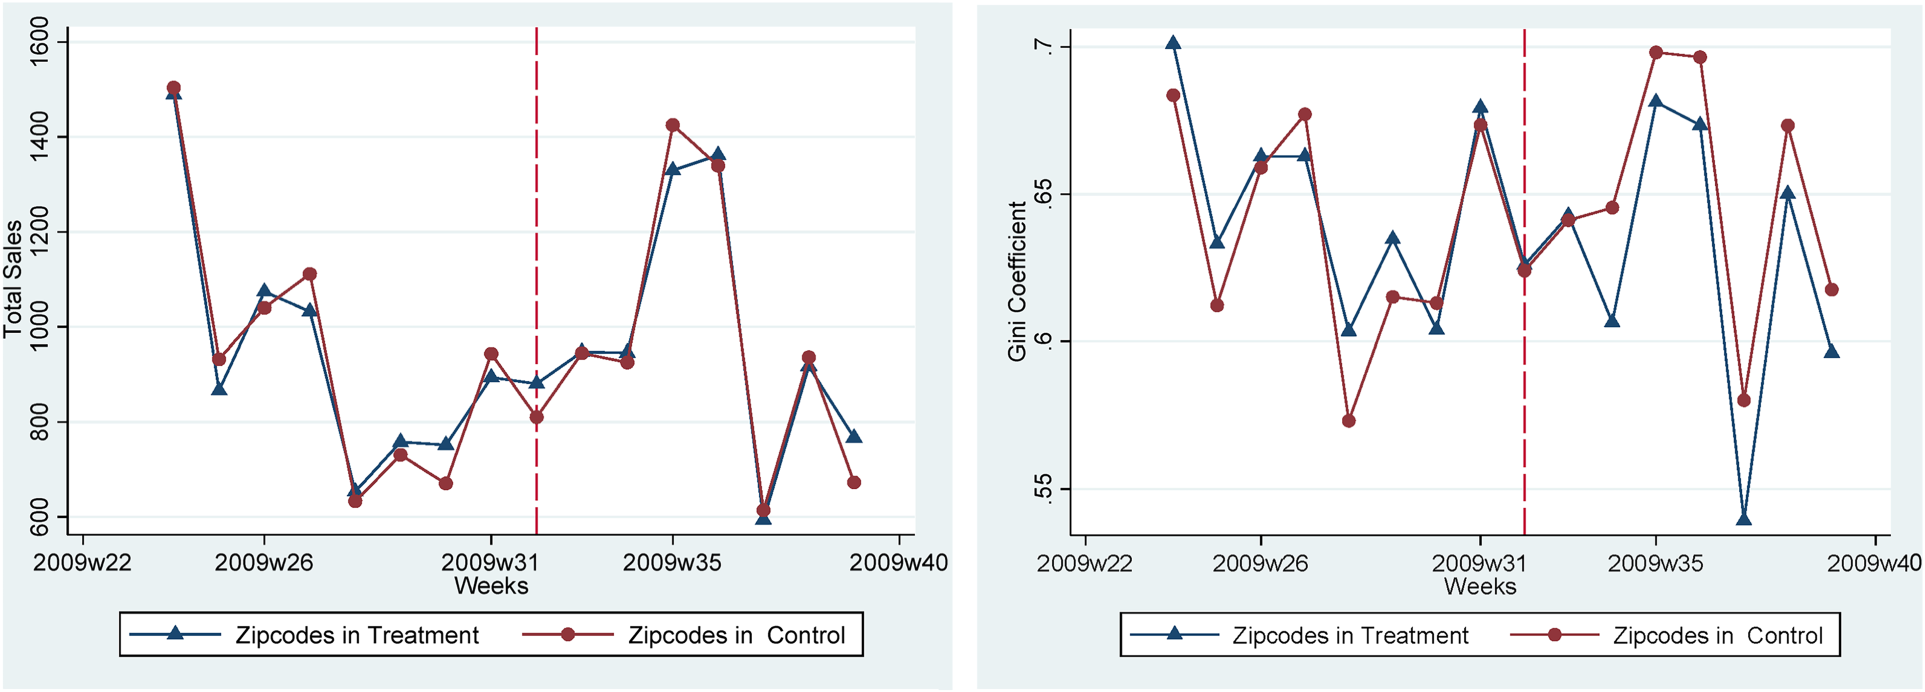
Average weekly sales and Gini coefficients in zip codes of the treatment and control groups.
To assess the sales dispersion, we utilize the Gini coefficient, which is a widely recognized measure of inequality in a distribution. A Gini coefficient of zero implies a uniform distribution, while a coefficient of one indicates maximum inequality such that all sales are concentrated on a single SKU (Yitzhaki 1979). The Gini coefficient provides a measure of sales dispersion that is consistent with other common measures, such as the Lorenz curve and the 90-10 ratio (Gallino et al. 2017). We plot the average weekly Gini coefficients for the zip codes in both the treatment and control groups in the right graph of Figure 2, where we find the Gini coefficients are very similar in both groups before the launch of Freestyle but diverge afterward. These trends in sales and Gini coefficients will be tested statistically in Section 8.
Finally, the inventory data of the focal firm are organized at the distribution center-SKU-week level. There are five distribution centers of the focal firm that supply the 123 zip codes in our data, among which two distribution centers supply the zip codes in the treatment groups, while the remaining three distribution centers do not supply any treated zip codes. Thus, the inventory data is aggregated to the distribution center-week level to examine the inventory changes due to the introduction of Freestyle dispensers.
In this section, we first develop models to understand the sales changes across SKUs at the zip code-SKU-week level and across business customer types at the zip code-business customer-week level. Then, we study the total sales quantity and sales dispersion at the zip code-week level. Lastly, we examine the inventory changes at the distribution center-week level.
Empirical Model for Sales Quantity Across SKUs and Business Customer Types
Our analyses at the zip code-SKU-week level aims to examine the heterogeneous treatment effects across SKUs. In equation (1), Salesijt is the sales quantity of SKU j in zip code i in week t and Priceijt the average wholesale price of SKU j in zip code i in week t. Natural logarithmic transformation is applied to these two variables for a closer approximation of Normal distributions. The fixed effects for zip codes are captured via zipcodei, and the fixed effects for time are captured via weekt. Error terms are clustered by zip codes.

We include a term
Equation (2) is developed for analyzing sales changes across business customers, conducted at the zip code-business customer-week level. The dependent variable Salesikt denotes the sales quantity to business customer k in zip code i in week t. We add 
Our model for the total sales quantity is shown in equation (3). The dependent variable Salesit is the sales quantity in zip code i during week t.

Next, we develop the model for sales dispersion in equation (4). The dependent variable, Giniit, indicates the Gini coefficient for the sales dispersion of the focal firm in zip code i during week t. A positive β1 for Treati × Postt implies the Freestyle dispensers lead to a higher Gini coefficient, indicating a more concentrated sales distribution in the focal firm's sales across SKUs, whereas a negative β1 indicates a more dispersed sales distribution. We also include the average wholesale price and the number of SKUs as control variables in the sales dispersion model.

Lastly, we test whether the inventory levels of the focal firm change when the launch of Freestyle dispensers increases the sales dispersion. We develop equation (5) to examine the changes in inventory levels upon the launch of Freestyle dispensers. The dependent variable, Inventorydt, is the average inventory level at distribution center d in week t. The interaction term Treatd × Postt measures the treatment effect, for which a positive (negative) coefficient θ1 implies an increase (decrease) in inventory levels due to the launch of Freestyle dispensers. We also include the log-transformed average wholesale price (Pricedt) and number of SKUs (SKUdt) as control variables because both the price and product variety of the firm may affect its inventory levels (Gaur et al. 2005, Ton and Raman 2010, Wan and Sanders 2017). The fixed effects for distribution centers (

Results of Sales Quantity Across SKUs: Star Versus Long-Tail Products
We estimate all equations using a least square regression with dummy variables (LSDV). In this section, we unpack the heterogeneous treatment effects by investigating the sales changes in star and long-tail products, which allow us to disentangle the substitution and spillover effects.
We first estimate equation (1) to explore whether the sales changes differ by product popularity. The results are reported in Table 4, first without treatment intensity in column 1 and then with it in column 2. The coefficient for
Treatment effect on sales of star and long-tail products at the zip Code-SKU-Week level.
Treatment effect on sales of star and long-tail products at the zip Code-SKU-Week level.
***p < .001, **p < .01, *p < .05.
Next, we perform subset analyses on star and long-tail products to further explore the heterogeneous treatment effect. We exclude
The changes in sales to different business customer types are analyzed using equation (2) with 10,249 observations at the zip code-business customer-week level. The estimated results are reported in Table 5. The negative and significant coefficient for
Treatment effect on sales to restaurants versus other business customers at the zip code-business customer-week level.
Treatment effect on sales to restaurants versus other business customers at the zip code-business customer-week level.
***p < .001, **p < .01, *p < .05.
The subset analyses for restaurants and other business customers in columns 2 and 3 provide further insights. Column 2 shows the focal firm's sales to restaurants decrease by 12.9%, suggesting a dominant substitution effect over the spillover effect. In our research context, Coca-Cola's Freestyle dispensers were first introduced mostly to quick-service restaurants. As a result, the focal firm's sales at quick-service restaurants face more direct and intense competition than those at other business customers. Although some restaurants, especially quick-service restaurant chains, usually sell products exclusively from one soft drink producer, consumers can still switch to a different restaurant to purchase different soft drinks. The substitution effect arises from such store switching and influences the focal firm's sales to restaurant business customers. On the other hand, the spillover effect is unconstrained. As new consumers enter the soft drink market, the focal firm also benefits from the market expansion along with other soft drink producers.
Interestingly, we find a 0.9% increase in sales to business customers other than restaurants in column 3. This positive treatment effect implies the presence of a spillover effect, which is even stronger than the substitution effect. To further illustrate this, we take retailers as an example, as soft drink producers primarily sell their products to retailers besides restaurants. At retailers, the substitution is limited because Freestyle dispensers introduce new products only to fountain products and thus do not directly compete with packaged soft drink products at retail stores. However, the spillover effect can still occur through increased consumer awareness and interest. Therefore, the substitution effect is dampened, but the spillover effect remains unconstrained at other business customers, allowing us to uncover the presence of the spillover effect.
In the preceding two subsections, we have examined the sales changes across different product categories and across business customers. In this subsection, we estimate the changes in total sales and sales dispersion. The estimated coefficients of equation (3) are reported in the first two columns of Table 6, where we sequentially add the interaction term for treatment effect Treati × Postt and control variables into the model. The coefficient for Treati × Postt in column 1 is negative but not significant. After controlling for price and product variety, the sales still do not change significantly post-treatment. Regarding the control variables, price is negatively associated with sales, whereas the relationship between sales and product variety is positive. The lack of a significant change in total sales, together with the significant but opposite changes in the sales of star and long-tail products from Table 4, implies that the substitution and spillover effects coexist and are tied in their net impact on total sales following the launch of Freestyle.
Treatment Effects on sales quantity and sales dispersion at the zip code-week level.
Treatment Effects on sales quantity and sales dispersion at the zip code-week level.
***p < .001, **p < .01, *p < .05.
Next, we discuss the estimated results for sales dispersion in equation (4). We report the coefficient estimates in the last two columns of Table 6. Both columns show that the coefficient of Treati × Postt is negative (−0.014) and significant at the 0.01 level, suggesting the Gini coefficient decreases by 0.014 after the Freestyle dispenser is introduced. Considering the average Gini coefficient in the treated zip code is 0.649 before the launch of Freestyle dispensers, this indicates a 2.2% (= 0.014/0.649 × 100) decrease. In other words, the focal firm's sales become more dispersed following the entry of Coca-Cola's Freestyle dispensers. We also find the number of SKUs is negatively associated with the Gini coefficient. That is, the focal firm's sales tend to be more dispersed in a zip code with more SKUs. To exclude the possibility that the more dispersed sales result from changes in the numbers of SKUs, numbers of business customers, or product prices of the focal firm, we further investigate these variables before and after the launch of Freestyle and find no significant changes. A more detailed discussion of these robustness checks is provided in Section 8.
The estimated results of inventory levels are reported in Table 7. Column 2 shows the inventory levels at the focal firm's distribution centers have increased by 1.0% after the launch of Coca-Cola's Freestyle dispensers, indicating a positive and significant treatment effect on the focal firm's inventory levels. The control variable of SKU numbers is also positive and significant, implying the inventory levels are higher in distribution centers with more SKUs.
Treatment Effect on inventory levels at the distribution center-week level.
Treatment Effect on inventory levels at the distribution center-week level.
***p < .001, **p < .01, *p < .05.
To support the proposed mechanism that more dispersed sales after the launch of Freestyle lead to higher inventory levels, we estimate equation (6). The estimated results are reported in the last column of Table 7. The negative and significant coefficient for Ginidt indicates that a lower Gini coefficient (more dispersed sales) is associated with a higher inventory level. These findings regarding Gini coefficients in Tables 6 and 7 support the notion that the increased product variety leads to a more dispersed sales distribution, which, in turn, gives rise to higher inventory levels.
In the preceding results, we observe the treatment effect 8 weeks after the launch of Freestyle. However, it is possible that within this relatively short time window, our findings may reflect a transient rather than a persistent phenomenon. During this period, if consumers are merely experimenting with the new product variety, they might eventually return to their original preferences. To further investigate whether the effects on sales and inventory persist, we collect additional data for eight more weeks (16 weeks/about four months) after the launch of Freestyle. Equations (3)–(5) are re-estimated using data in the longer time window (24 weeks in total, including 8 weeks before and 16 weeks after the treatment). The estimated results are reported in Table B1 in Appendix B. The results obtained from the longer time window are consistent with our previous findings based on the shorter time window. It suggests that the treatment effects on sales quantity, sales dispersion, and inventory level persist for at least 4 months after the treatment.
Result Summary
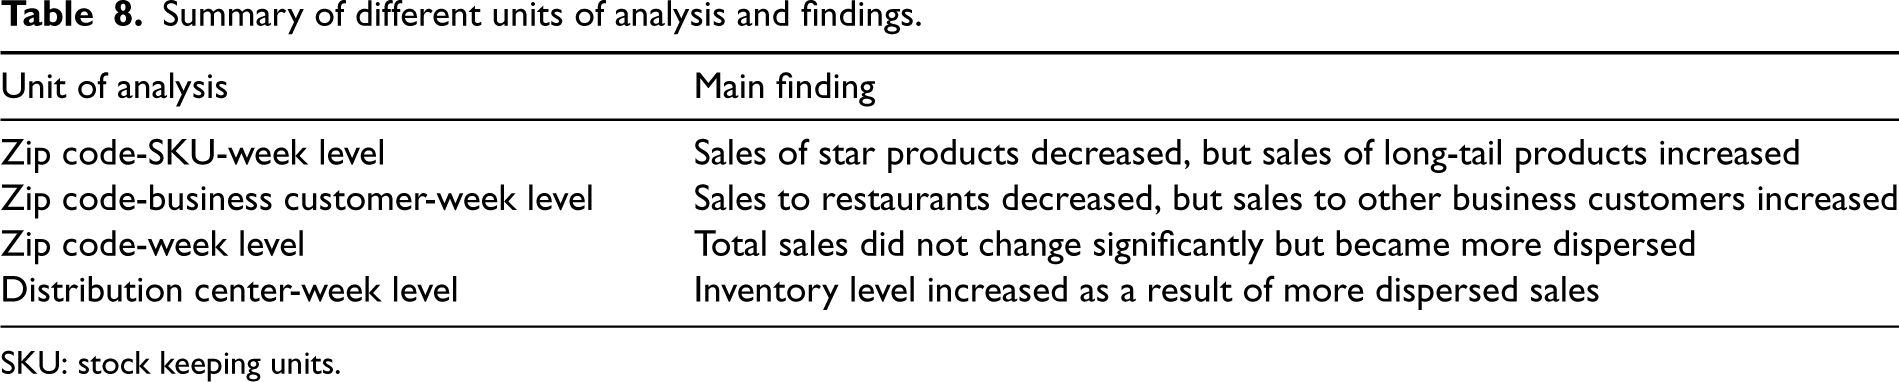
In this study, we employ various units of analysis to examine several outcome variables. Each unit of analysis allows us to capture specific levels of treatment effects. For example, analyzing sales changes across SKUs and product categories requires a more detailed unit of analysis than the aggregated zip code level. Likewise, inventories are managed at the distribution centers of the focal firm, making the data at the distribution center level more suitable for analysis. A summary of these units of analysis and the corresponding findings are reported in Table 8. At the zip code-SKU-week level, we find the sales of star products decreased while the sales of long-tail products increased after the launch of Freestyle. At the zip code-business customer-week level, the results suggest that sales to restaurants decreased, but sales to other business customers increased. Meanwhile, at the zip code-week level, we do not find any significant change in total sales, but we observe a more dispersed sales distribution. In addition, at the distribution center-week level, we find increased inventory levels due to the more dispersed sales.
Summary of different units of analysis and findings.
Summary of different units of analysis and findings.
SKU: stock keeping units.
In this section, we thoroughly examine the robustness of our findings by conducting a comprehensive set of tests to ensure that they are not driven by matching methods, estimation methods, pretreatment time trends, or alternative explanations.
Synthetic Control Method
Other than using the CEM method for pairing control group zip codes with the treated ones, we also apply the synthetic control method (Abadie et al. 2010, 2015) as a robustness check. Specifically, we construct a synthetic zip code for each of the 23 treated zip codes by assigning weights to all zip codes in the control group through data-driven optimizations. Unlike the CEM, which does not guarantee a matched zip code from the control group for every treated zip code, the synthetic control method utilizes all zip codes in the control group. It constructs a synthetic zip code that closely resembles each treated zip code. We report the means and standard deviations of the characteristics for all treatment zip codes and their synthetic zip codes in Table C1 in Appendix C. The average values of the key characteristics between the treatment and synthetic zip codes are very close. The details of the synthetic control method are outlined in Appendix C, where the estimated results corroborate those obtained using the CEM method.
Geographically Local Markets of the Freestyle Testing Locations
Our main analyses are conducted at the zip code level in line with extant literature (Bell et al. 2018). As a robustness check, we also measure the influence of Freestyle dispensers using the geographically local market approach. Considering most of the testing locations are quick-service restaurants catering to local consumers, we draw a circle with a 2-mile radius around each Freestyle location to represent its geographically local market (Olivares and Cachon 2009, Ren et al. 2011). As shown in Figure D1 in Appendix D, business customers located within these circles (i.e., the geographically local markets) are assumed to be influenced by the introduction of Freestyle dispensers and hence assigned to the treatment group, while business customers located outside these circles are assigned to the control group. Finally, we estimate the changes in sales quantity and the Gini coefficient using these newly defined treated and control groups. The estimated results, reported in Table D1 in Appendix D, are consistent with our main results that the total sales do not change significantly, but the sales distribution becomes more dispersed after the event.
Estimation With No Matching, 1-to-m Matching, and the Sample Excluding the Launch Month
To ensure the robustness of our results, we perform additional estimations using different datasets. First, we estimate models using the entire dataset of all 123 zip codes in the Atlanta metropolitan area (23 treated zip codes and 100 controlled zip codes) without employing any matching method. Second, we allow the 1-to-m matching between zip codes in the treatment and control groups, which yields 20 treated zip codes and 46 control zip codes. Third, given that the exact launching weeks of Freestyle dispensers may also influence the treatment effect, we exclude the data in all weeks from the launch month of July 2009 and estimate the models again using the data in June, August, and September 2009. The estimated treatment effects are reported in Table D1 in Appendix D. Consistent with our main results, we find the treatment effects are still negative and significant on the Gini coefficients and not significant on sales quantity.
Alternative Estimation Methods
In the results section, we estimate models using the LSDV approach to account for the fixed effects for zip codes and weeks. As an alternative, the first difference equation method is used to address the problem of unobservable variables in the panel data. In Appendix D, we present the results using the first difference equation in Table D1. This alternative estimation method provides consistent results with those based on the LSDV approach.
Furthermore, to ensure that our results are not driven by the functional forms employed, we estimate the model for the Gini coefficient using a Logistic regression as the value of the Gini coefficient ranges between 0 and 1. The estimated coefficients are also reported in Table D1. Again, we find the treatment effect on the Gini coefficients is negative and significant. That is, the sales of the focal firm are more dispersed due to the entry of Freestyle dispensers.
Time Trend
We conduct analyses to rule out the possibility that the changes in the Gini coefficients between the treatment and control groups are influenced by consistent time trends in sales dispersion. Specifically, we examine whether the changes in the Gini coefficients can be explained by pre-existing time trends. Apart from the visual illustration in Figure 2, we statistically test the differences in time trends prior to the event. For this purpose, we use the pretreatment data to estimate the following model, including the fixed effects for zip codes and weeks:

To confirm that the observed treatment effect is specific to the actual launch of Freestyle dispensers, we conducted placebo tests. First, we use the data from the eight pretreatment weeks and pretend that the Freestyle dispensers were launched in each of these 8 weeks, respectively, with the last week excluded due to the lack of postevent observations. Then, we estimate equation (4) using these placebo weeks. The estimated coefficients are reported in Table F1 in Appendix F. None of the coefficients for these placebo event weeks is significant. Thus, a randomly selected placebo week does not replicate the significant treatment effect associated with the launch of Coca-Cola's Freestyle dispensers.
Second, an alternative placebo test is to randomly assign pseudo-treated and pseudo-control zip codes in the control group. Specifically, from the 100 zip codes in the Atlanta metropolitan area where no Freestyle dispenser was launched, we randomly select 30 zip codes as the pseudo-treatment group and another 30 zip codes as the pseudo-control group. These pseudo-treated zip codes are indicated by PseudoTreati. Then, we estimate the treatment effects using these pseudo treatment and control groups. The estimated coefficients are reported in Table F2 in Appendix F. Notably, these randomly selected treated and control zip codes do not exhibit the significant treatment effect observed in the actual launch of Freestyle dispensers.
Alternative Control Group
We assume no spillover effect of the Freestyle dispensers on the zip codes in the control group. However, we acknowledge the possibility that customers in the neighboring zip codes of the treated ones may have been exposed to the Freestyle dispensers and potentially changed their purchase patterns in those markets. This scenario raises concerns regarding the violation of the Stable Unit Treatment Value Assumption (SUTVA). To validate this assumption, we collected data from 188 zip codes in the state of Maryland, where Freestyle dispensers were not launched during the timeframe of our data. These Maryland zip codes serve as an alternative control group. The treatment effects are estimated using the treatment group in the Atlanta metropolitan area and the control group in Maryland and reported in Appendix G. The estimated results using the alternative control group are consistent with our main results reported in the previous section.
Alternative Measures for Sales Dispersion
In addition to using the Gini coefficient as a measure of sales dispersion in our main results, we acknowledge that the Pareto measure is another commonly employed metric for studying sales dispersion (Brynjolfsson et al. 2010, Gallino et al. 2017, Pareto, 1964). The Pareto measure offers the advantage of facilitating a counterfactual exercise by linking changes in sales dispersion to the expected change in inventory mismatch. To ensure the robustness of our findings, we follow Gallino et al. (2017) and use Paretoit to measure sales dispersion. A higher value of Paretoit suggests a more dispersed sales distribution. The estimated results are reported in Appendix H. As shown in Table H1, the positive coefficient suggests that sales became more dispersed after the launch of Freestyle dispensers. This finding aligns with the results from the Gini coefficient analysis reported in Table 6. Similarly, we use the Pareto measure for the effect of sales dispersion on inventory levels. The estimated results in Table H2 are consistent with our main analysis in Table 7, confirming that more dispersed sales lead to higher inventory levels.
Alternative Explanations
In addition to the substitution and spillover effects on consumer demand, changes in the number of business customers and product variety of the focal firm could serve as alternative mechanisms to explain the changes in the focal firm's sales dispersion when Freestyle is launched. For example, some of the focal firm's business customers might stop purchasing products from the focal firm and switch to other soft drink producers. Consequently, individual shoppers who previously bought through these departed business customers would no longer have access to the focal firm's products, especially the star products, which leads to increased sales dispersion. Another alternative explanation for increased sales dispersion is that the focal firm expands its product variety or adjusts prices, either coincidentally or strategically, in response to the launch of Freestyle. In this section, we exclude the aforementioned three alternative mechanisms, that is, changes in the number of business customers, product variety, and product price, to support the proposed tradeoff mechanism between the substitution and spillover effects.
Changes in the Number of Business Customers of the Focal Firm
We first investigate the number of business customers served by the focal firm both before and after the treatment. Specifically, we estimate the treatment effects of the Freestyle dispensers on the number of total business customers and different business customer types, respectively. The estimated results are reported in Table I1 in Appendix I. We do not find a significant change in the number of business customers after the introduction of Freestyle dispensers. Hence, the increased sales dispersion does not result from any alteration in the number of business customers.
Changes in Product Variety and Product Price of the Focal Firm
We analyze the changes in product variety and price at the zip code level by estimating the treatment effect on LogSKUit and LogPriceit. The estimated results are reported in Table J1 in Appendix J. The treatment effects of Freestyle dispensers on LogSKUit and LogPriceit are not significant, indicating the post-treatment number of SKUs and product price are not significantly different from the pretreatment ones. The focal firm's stable product variety and price before and after the event implies that changes in sales dispersion are not a result of changes in the focal firm's product variety and price.
Implications, Contributions, and Limitations
The existing literature has extensively explored how firms gain competitive advantages by increasing their product variety (Fisher and Ittner 1999, Ramdas 2003, Ton and Raman 2010, Zhou and Wan 2017). However, the specific impacts of such increases in product variety on other firms remain unclear. To fill this gap, we focus on a significant event in the soft drink industry: the introduction of Coca-Cola's Freestyle dispenser. Unlike traditional dispensers that typically offer a maximum of eight flavors, the Freestyle dispenser provides over 120 flavors through a single machine, which creates a sudden and drastic expansion of Coca-Cola's product variety, causing a substantial shock to the mature soft drink market.
Our findings emphasize the existence of the spillover effect on the focal firm's sales when a competitor initiates a sudden and substantial increase in product variety. This intensified competition primarily affects the firm's star products, while the long-tail products offer unique features that cater to consumers’ specific preferences, allowing the spillover effect to have a greater influence. It suggests that firms facing similar underdog situations can leverage their long-tail products in response to competitors’ increased product variety. Furthermore, these effects are amplified by the intensity of Freestyle dispensers. The focal firm's star products experience a greater decline in sales, whereas its long-tail products gain more sales, in areas with more Freestyle dispensers installed.
We observed a 0.9% increase in sales to business customers outside the restaurant sector. This finding points to an opportunity for the underdog firms to secure their sales or even benefit from a competitor's suddenly increased product variety. When faced with the challenge of losing sales to customers attracted by their competitors’ broader range of products, underdog firms can strategically redirect resources to promote sales to alternative customers and benefit from the spillover effect.
Our empirical analyses show that the focal firm's total sales do not change significantly upon the launch of Freestyle, suggesting a tie between the substitution and spillover effects on the focal firm's total sales. If managers do not scrutinize the changes that occur at the product subgroups and business customer levels, the spillover effect could have been overlooked as it is not reflected in the unchanged total sales. This finding suggests that managers should not rely solely on aggregated performance measures and focus only on the “big picture.” Instead, they should prioritize understanding the underlying mechanisms at play. An unchanged overall performance measure does not necessarily indicate the absence of effects.
Moreover, the sales of the focal firm are found to be 2.2% more dispersed across SKUs, according to the Gini coefficients post the event. Understanding the changes in sales dispersion due to a competitor's increased product variety is important to a firm's strategic and operational decisions regarding its own product variety and responses to competitors’ increased product variety. When sales become more dispersed, low-demand products account for a larger share of total sales. This information can guide firms in allocating more investment toward new product innovation for niche products. Besides, this demand shift may indicate a trend in the industry. For example, in recent years, there has been a noticeable shift in consumer demand in the soft drink market from traditional soda to healthier beverages with low sugar content (Bhushan, 2019). Being aware of and adapting to these changes in demand allocated to different product categories enables firms to adjust their product variety strategies accordingly.
Furthermore, the changes in sales dispersion can have implications for a firm's inventory management. Our results reveal an increase in inventory levels at the focal firm's distribution centers after Coca-Cola launched the Freestyle dispensers. This finding suggests that when a competitor substantially expands its product variety, inventory managers of other firms need to take into account the potential increases in inventory levels and associated costs when making subsequent decisions.
This empirical study contributes to three distinct literature streams: customization, product variety, and sales dispersion and inventory. First, this article adds to the literature on customization by studying a case of sudden increases in customized products via modularity and delayed differentiation. Prior literature recognizes the value of customization (Mendelson and Parlaktürk 2008, Squire et al. 2006) and suggests modularity and delayed differentiation can lower costs for firms implementing customization (Hopp and Xu 2005, Vickery et al. 2016, Yang and Zhang 2022). Our study investigates the impact of an instant and dramatic increase in one firm's product variety via modularity and delayed differentiation on other competing firms that face technological barriers to achieving similar capabilities in the short term.
Second, the literature on product variety primarily focuses on a firm's decisions on product variety and the impact on its performance (Moreno and Terwiesch 2017, Ton and Raman 2010, Wan et al. 2012). This study contributes to the existing literature by investigating the impact of one firm's increased product variety on its competitor's sales and inventory. We disentangle two opposing effects: the substitution and spillover effects, generated by the dramatic increase in Coca-Cola's product variety enabled by Freestyle on the focal firm. While the substitution effect is intuitive, we also identify a positive spillover effect on the focal firm as Freestyle attracts new consumers to the soft drink market, who subsequently purchase products from other firms in the industry. Furthermore, these two effects are amplified by the intensity of Freestyle dispensers. Our findings provide new empirical evidence for the tradeoff between the substitution effect and the spillover effect due to a competitor's increased product variety through modularity and delayed differentiation.
Third, our study also contributes to the inventory literature by providing empirical evidence to support the theoretical proposition of a positive relationship between sales dispersion and inventory levels (Gallino et al. 2017). While it is widely recognized in the inventory management literature that a firm pursuing higher product variety tends to have higher inventory levels (Fisher and Ittner 1999, Ramdas 2003), our findings reveal that as one firm drastically increases its product variety, other competing firms will also suffer increased inventory levels, which result in additional inventory costs and exacerbating the overall loss for these firms.
We acknowledge that our findings based on the increased product variety enabled by Freestyle dispensers may not be generalizable to all industries. The exact net impact of increased product variety depends on factors such as the magnitude of the increase and the maturity of the market. However, our empirical framework and models can be readily adjusted to study the impact of competitors’ increased product variety in different contexts. The implications of the sales gain on long-tail products through the spillover effect and increased sales dispersion and inventory levels can offer valuable insights for many firms operating in highly competitive markets with a focus on product variety and provide useful guidance for firms navigating intense competition and making strategic decisions related to product variety.
Supplemental Material
sj-pdf-1-pao-10.1177_10591478241231853 - Supplemental material for Gaining From Losing a Competition in Product Variety
Supplemental material, sj-pdf-1-pao-10.1177_10591478241231853 for Gaining From Losing a Competition in Product Variety by Xiang Wan and H Alice Li in Production and Operations Management
Footnotes
Declaration of Conflicting Interests
The authors declared no potential conflicts of interest with respect to the research, authorship, and/or publication of this article.
Funding
The authors received no financial support for the research, authorship, and/or publication of this article.
How to cite this article
Wan X and Li HA (2024) Gaining From Losing a Competition in Product Variety. Production and Operations Management 33(2): 577–594.
References
Supplementary Material
Please find the following supplemental material available below.
For Open Access articles published under a Creative Commons License, all supplemental material carries the same license as the article it is associated with.
For non-Open Access articles published, all supplemental material carries a non-exclusive license, and permission requests for re-use of supplemental material or any part of supplemental material shall be sent directly to the copyright owner as specified in the copyright notice associated with the article.