
Abstract
An equal employment opportunity (EEO) policy is an essential practice of workplace diversity, equity, and inclusion. Using a novel measure of workplace EEO based on the textual analysis of online job postings, we show a lead–lag pattern of EEO practice between principal customers and their dependent suppliers. The leadlag effect is more pronounced when principal customers enjoy greater bargaining power, consistent with the view that dependent suppliers adjust EEO policies to cater to customer preferences. We use the 2017 Diversity Campaign of the “Big Three” institutional investors as our main identification strategy to support a causal interpretation. We demonstrate that the diffusion of EEO policies along supply chains improves the likelihood of retaining female employees, implying the presence of social benefits in addition to economic advantages.
Introduction
The attention on diversity, equity, and inclusion (DEI) has reached an unprecedented level recently, particularly in the wake of significant events such as the #MeToo and Black Lives Matter protests, which have sparked widespread social equality movements globally. 1 This rapidly growing attention is unsurprising given that DEI serves as a crucial practice in fostering an inclusive community where all individuals are esteemed and treated with respect. Moreover, DEI acts as a vital catalyst for corporate creativity and productivity, thereby generating substantial value for shareholders. From a standalone company’s perspective, researchers have shown that DEI is crucial to improve decision-making process (e.g., Kim and Starks, 2016; Bernile et al., 2018; Delis et al., 2017), engage and retain talents with diverse skills (e.g., Morgan and Várdy, 2009; Dezsö and Ross, 2012; Matsa and Miller, 2011), increase customer satisfaction and loyalty (e.g., Cen et al., 2022; Khan and Kalra, 2022), and reduce litigation risk related to legal compliance (e.g., Cumming et al., 2015; Adhikari et al., 2019; Wowak et al., 2021).
Equal employment opportunity (EEO), considered an essential component of DEI, prevents employers from “discriminating against a job applicant or an employee because of the person’s race, color, religion, sex (including pregnancy and related conditions, gender identity, and sexual orientation), national origin, age (40 or older), disability, or genetic information.” 2 Since recruitment is the starting point of employment, hiring with a sound EEO policy is the key to opening the “front door” to DEI. Specifically, an effective equal opportunity policy in recruitment removes systematic biases against minority groups and allows applicants from diverse backgrounds to gain job opportunities with their unique qualities. The respect for diversity and equity, as a natural outcome of practicing EEO in recruitment, nurtures a strong sense of belonging among employees (existing and new) and creates inclusive workplaces.
We argue in this paper that the importance of EEO extends beyond its impact on standalone firms. Over the past few decades, companies have realized that managing environmental, social, and governance (ESG) risks is crucial to maintaining sustainable and efficient supply chain relationships. While much emphasis has been placed on environmental and governance issues, the “social” aspect of ESG, particularly EEO-related labor issues, has received less attention in supply chain management. 3 Recently, there has been a substantial shift in this trend. For example, Unilever set a goal to encourage its suppliers to participate in a fairer, more inclusive, and more equitable manner of conducting business. 4 In 2014, Unilever introduced its Responsible Partner Policy, which requires its suppliers to enforce workplace equality. The mandatory requirements include “…no discrimination in employment (including hiring), any aspects of training, personal and professional development, compensation, advancement, discipline, employment termination or retirement.” In addition, Unilever mandates its suppliers to provide training for all workers, particularly managers, to prevent discrimination. 5 In another example, PepsiCo leveraged the company’s scale and invited its suppliers to join PepsiCo’s Racial Equality Journey to create shared value, “a key pillar of its pep+ (PepsiCo Positive) transformation.” 6
Despite strong corporate EEO initiatives in supply chain management, researchers have not fully understood whether and how such initiatives generate a systematic diffusion of EEO practices along the supply chain; if this diffusion does exist, what are the economic channels and outcomes of the EEO diffusion along the supply chain? This study fills these gaps in the literature. Taking advantage of a novel EEO measure based on textual analysis of EEO statements in online job postings, we study how firms interact with EEO practices in the supply chain setting and investigate the impact of EEO interaction on supply chain relationship improvement. We also explore whether supply chains that adopt EEO, that is, suppliers catering to their customers’ EEO preferences, can achieve both positive economic outcomes and social good.
While EEO is protected by laws and regulations in the United States, 7 these laws and regulations do not require companies to include the “equal opportunity” label in their job postings. However, anecdotal evidence suggests that passionate EEO statements in job postings encourage potential employees, particularly those from minority groups, to apply. 8 Cen et al. (2022) identify a significant cross-sectional difference in the EEO statements of US firms in their online job postings. They argue that, since EEO statements are public commitments that are verifiable ex-post, the sincerity and enthusiasm in EEO statements can accurately signal the level of corporate EEO preferences and practices. Moreover, while most existing EEO measures in the literature capture workplace equality in boardrooms or C-suits, the EEO measure in Cen et al. (2022) is based on EEO statements in job postings and, therefore, captures corporate workplace equality practices relevant to rank-and-file employees. 9 We combine this measure with the customer–supplier relationship data from the Compustat Customer Segment File and empirically examine the diffusion of EEO policies along supply chains.
Our baseline results show that an increase in principal customers’ EEO scores is correlated with a future improvement in the EEO scores of their suppliers. We conduct two placebo tests to ensure that this pattern is specific to firm-level supply-chain relationships and not driven by industry-level economic links. First, we construct a placebo sample by keeping the actual customer firm and replacing the actual supplier with placebo suppliers that produce similar products. Second, we conduct a simulation exercise using 1,000 benchmark samples in which placebo suppliers are randomly chosen from the industry that the actual suppliers belong to. Both tests confirm that the empirical pattern in our baseline tests is not driven by industry-level links or spurious correlations driven by economic factors unrelated to supply-chain relationships.
Our main conjecture for the baseline results above is that suppliers adjust their EEO practices to cater to their customer preferences and thereby maintain and strengthen the relationships with principal customers. A potential endogeneity concern in our interpretation is that customer and supplier firms may adjust their EEO policies together as a result of common economic factors unobserved by researchers (i.e., the “omitted variable” issue). To alleviate this endogeneity concern, we take advantage of the 2017 Diversity Campaign of the “Big Three” institutional investors as an exogenous shock to the EEO policies of customer firms. 10 We verify that customer firms with higher Big Three institutional ownership but fewer female directors (the “affected” firms) were disciplined by the Big Three institutions, following which their EEO scores improved more significantly than peer firms. Our results show that the EEO scores of affected customers’ suppliers experienced a more substantial increase than those of other suppliers, even after controlling for suppliers’ exposure to this campaign. Our results from this identification strategy are consistent with the causal claim that customers’ workplace equality practices affect the workplace equality of their suppliers.
We argue that suppliers have a strong economic incentive to adjust their workplace EEO policies and cater to the preferences of their principal customers because the purchases of principal customers account for a large proportion of their total sales. Therefore, whether principal customers can effectively play this implicit disciplinary role on EEO policies along the supply chain depends on their relative bargaining power with dependent suppliers. One of the most important determinants of customer bargaining power in bilateral trade relationships is the credibility of the threat to switch, that is, how costly it would be for a customer to switch to other “substitute” suppliers (Crook and Combs, 2007; Banerjee et al., 2008). We proxy customers’ bargaining power with two measures related to customer switching costs: product market competitiveness and product similarity in the supplier industry. Consistent with our conjecture, we find a much stronger lead–lag pattern in workplace EEO policies along the supply chain when suppliers face more intensive market competition or have products more similar to their industry peers, that is, when customers face a lower switching cost and, therefore, enjoy greater bargaining power.
Finally, we examine the real economic and social outcomes when EEO policies diffuse along supply chains. Specifically, we investigate the impact of EEO diffusion along supply chains on the retention of female employees. We measure female (male) employee retention by the average employment duration of female (male) employees at the end of the year. We show that, even after controlling for its own EEO score, a supplier is more likely to perform better in female employee retention if its customers have higher EEO scores. In comparison, suppliers’ own EEO scores and EEO diffusion along the supply chain do not have significant effects on male employee retention, which is consistent with anecdotal evidence that the effects of workplace equality practices are more pronounced in retaining female workers. 11
The rest of this paper is organized as follows. In Section 2, we discuss our contributions to various strands of related literature. Section 3 describes the data and variable construction. Section 4 presents the baseline results on the diffusion of EEO practices along supply chains, placebo tests to address alternative interpretations, and the identification strategy to address endogeneity issues. Section 5 presents our analysis of moderating mechanisms. Section 6 examines the real economic outcomes of EEO diffusion along the supply chain. Section 7 concludes our study.
Literature Review
We examine several important social and labor aspects of sustainable (or responsible) supply chain management. The vast operations management literature on sustainable supply chain management explores environmental dimensions. 12 For example, Bowen et al. (2001) study the role of “green supply” management. Jira and Toffel (2013) and Blanco (2021) show that carbon emissions along the supply chain generate significant impacts on the nature and content of climate change disclosures. 13 Lee and Klassen (2008) identify the key factors that contribute to the development of environmental management capabilities for small- and medium-sized suppliers in supply chains. Despite the early focus on environmental issues along the supply chain, recent studies have shifted their attention to other dimensions of sustainability, such as social and labor issues, by considering a more comprehensive set of stakeholders (Sodhi, 2015). For example, Soundararajan and Brammer (2018) use a longitudinal multiple case study method to study supply chains of the knitwear garment industry in South India and find that social sustainability requirements affect suppliers’ fairness perceptions and reciprocity. Using multiple case studies, Kalkanci et al. (2019) discuss the practices of inclusive supply chain innovation and highlight the importance of collaboration with other stakeholders to build an inclusive supply chain. Erhun et al. (2021) examine how Coca-Cola’s restructuring of its mango supply chain to support Haitian farms resulted in socially responsible procurement that reduced customers’ costs and lead time. Huq et al. (2016) use cases of the clothing industry to explore social management capabilities and their effects on sustainable supply chain management. In their theoretical framework, Villena and Gioia (2018) incorporate “people” as one of the sustainability dimensions for managing sustainable supply networks. Unlike previous studies that mainly rely on experiments, surveys, or case studies, we explore workplace equality issues along the supply chain based on granular archival information in almost all online job posts issued by US firms. We also provide a comprehensive set of verification tests to show that our measure is able to capture the quality of corporate DEI accurately and that our approach is generalizable.
We also contribute to the literature on the economic dynamics of the diffusion (cascade) of sustainability along the supply chain. Previous studies have shown that productivity (Serpa and Krishnan, 2018), quality (Zhu et al., 2007; Corbett, 2006), innovation (Chu et al., 2019), operating risks (Hertzel et al., 2008; Osadchiy et al., 2021), and credit risk (Agca et al., 2022; Wu et al., 2021) propagate along the supply chain. Not surprisingly, sustainability is no exception: although customer and supplier firms are separate business entities, the customer firms are still held responsible when suppliers experience sustainability-related incidences (Hartmann and Moeller, 2014). Since most severe environmental and social risks are concentrated among the lower-tier suppliers in the supply chain (Villena and Gioia, 2018), customer firms have a strong economic incentive to mitigate sustainability-related risks along the supply chain. 14
Recent studies have started to focus on how the structure of supply chains affects the cascade of sustainability practices. Villena and Gioia (2018) establish a theoretical framework for the optimal structure of a sustainable supply chain network in which customers can cascade sustainable practices via direct or indirect control. Using a game theoretic model, Huang et al. (2022) show that the optimal cascading practice is either direct control, delegation, or no effort under different economic conditions. Empirically, researchers find that indirect control is usually more efficient (Lee and Klassen, 2008), especially when the first-tier suppliers possess more information about the production process (Huang et al., 2022) and the institutional environment (Soundararajan and Brammer, 2018) of the lower-tier suppliers. 15 Under the setting of indirect control, researchers dig into the economic mechanisms that generate and facilitate sustainability cascades along the supply chain. For example, Porteous et al. (2015) develop a model showing that both suppliers’ economic incentives (“carrots”) and customers’ threat of potential penalties (“sticks”) reduce suppliers’ environmental and social violations. Consistent with their views, we suggest that the bargaining power of principal customers, based on credible threats of switching to other suppliers, plays an important role in the cascade of workplace equality practices along the supply chain. More importantly, we address the endogeneity issues (i.e., unobserved economic factors may affect workplace equality practices of both customers and suppliers) in this cascade by taking advantage of an identification strategy based on the Big Three Diversity Campaign and show that the workplace equality practices of principal customers causally affect those of their dependent suppliers.
Last but not least, our study is related to the existing literature on the real economic outcomes of sustainable supply chain management. Previous studies show that sustainable supply chain management boosts sales and profitability. Using game theory models, Buell and Kalkanci (2021) and Kalkanci and Plambeck (2020) show that transparency regarding suppliers’ sustainability performance improves sales and profitability for both the customer and the supplier. Parmigiani et al. (2011) establish a connection between sustainable supply chain management and the gaining of competitive advantage. Other studies connect supply chain management with cost efficiency. Based on multiple case studies, Erhun et al. (2021) suggest that socially responsible procurement reduces customers’ costs and lead time. Based on both model and survey evidence, Porteous et al. (2015) show that sustainable supply chain management is positively associated with operating cost reduction of the customers. Bird et al. (2019) show that labor codes of conduct imposed by customers improve suppliers’ labor practices using social audit data. Consistent with these findings in the literature, we find that the diffusion of workplace equality practices generates real economic outcomes for suppliers. Specifically, while workplace equality practices diffuse along the supply chain from customers to suppliers, suppliers’ improvement in social sustainability leads to an increase in the likelihood of retaining female workers.
Data and Variable Construction
DEI Measure: EEO Score
We construct the EEO scores to measure the levels of corporate diversity, equity, and inclusion of US firms based on the big data of online job postings from Burning Glass Technologies (BGT) following Cen et al. (2022). BGT is an analytic software company that collects and manages the world’s largest online job vacancy database. 16 BGT web crawls job postings from more than 50,000 career and company websites, covering the near-universe online job postings of US firms. The job posting data set consists of 54 million job postings for the period 2010 to 2020. The employers in the BGT data are matched to firms in the Compustat database by a name-matching algorithm. The matching results are manually checked to ensure their accuracy and reliability.
While BGT data are widely used in the labor literature (e.g., Hershbein and Kahn, 2018), one unique feature of the BGT data used in Cen et al. (2022) is that the data contain not only the standardized and structured data items developed by BGT, but also the original unstructured texts of the job postings. The original text of job postings enables us to extract information embedded in the equal employment opportunity (EEO) statements of job postings.
Companies include EEO statements in their job postings to publicize their commitments to workplace EEO. Firms that genuinely embrace workplace EEO tend to make enthusiastic and original EEO statements in their job postings. Forexample, Gap Inc., which leads in the list of top 100 most diverse and inclusive companies rated by Refinitiv, has the following EEO statement in its job postings: 17
Gap Inc. is an equal-opportunity employer and is committed to providing a workplace free from harassment and discrimination. We are committed to recruiting, hiring, training, and promoting qualified people of all backgrounds, and make all employment decisions without regard to any protected status. We have received numerous awards for our long-held commitment to equality and will continue to foster a diverse and inclusive environment of belonging.
However, simply stating that “EEO is law” should not be taken as a credit for the positive signal of the firm’s EEO commitment.
18
Following Cen et al. (2022), we use the Valence Aware Dictionary and Sentiment Reasoner (VADER) algorithm from the natural language processing sentiment analysis toolkit to distinguish the actual attitudes toward EEO underlying the EEO statements of firms.
19
The VADER is a lexicon-based and language rule-adjusted sentiment analysis algorithm that assigns sentences with sentiment scores ranging from
The firm-year level EEO score is the normalized rank of the average sentiment score of EEO statements of all the job postings of the firm in the particular year:
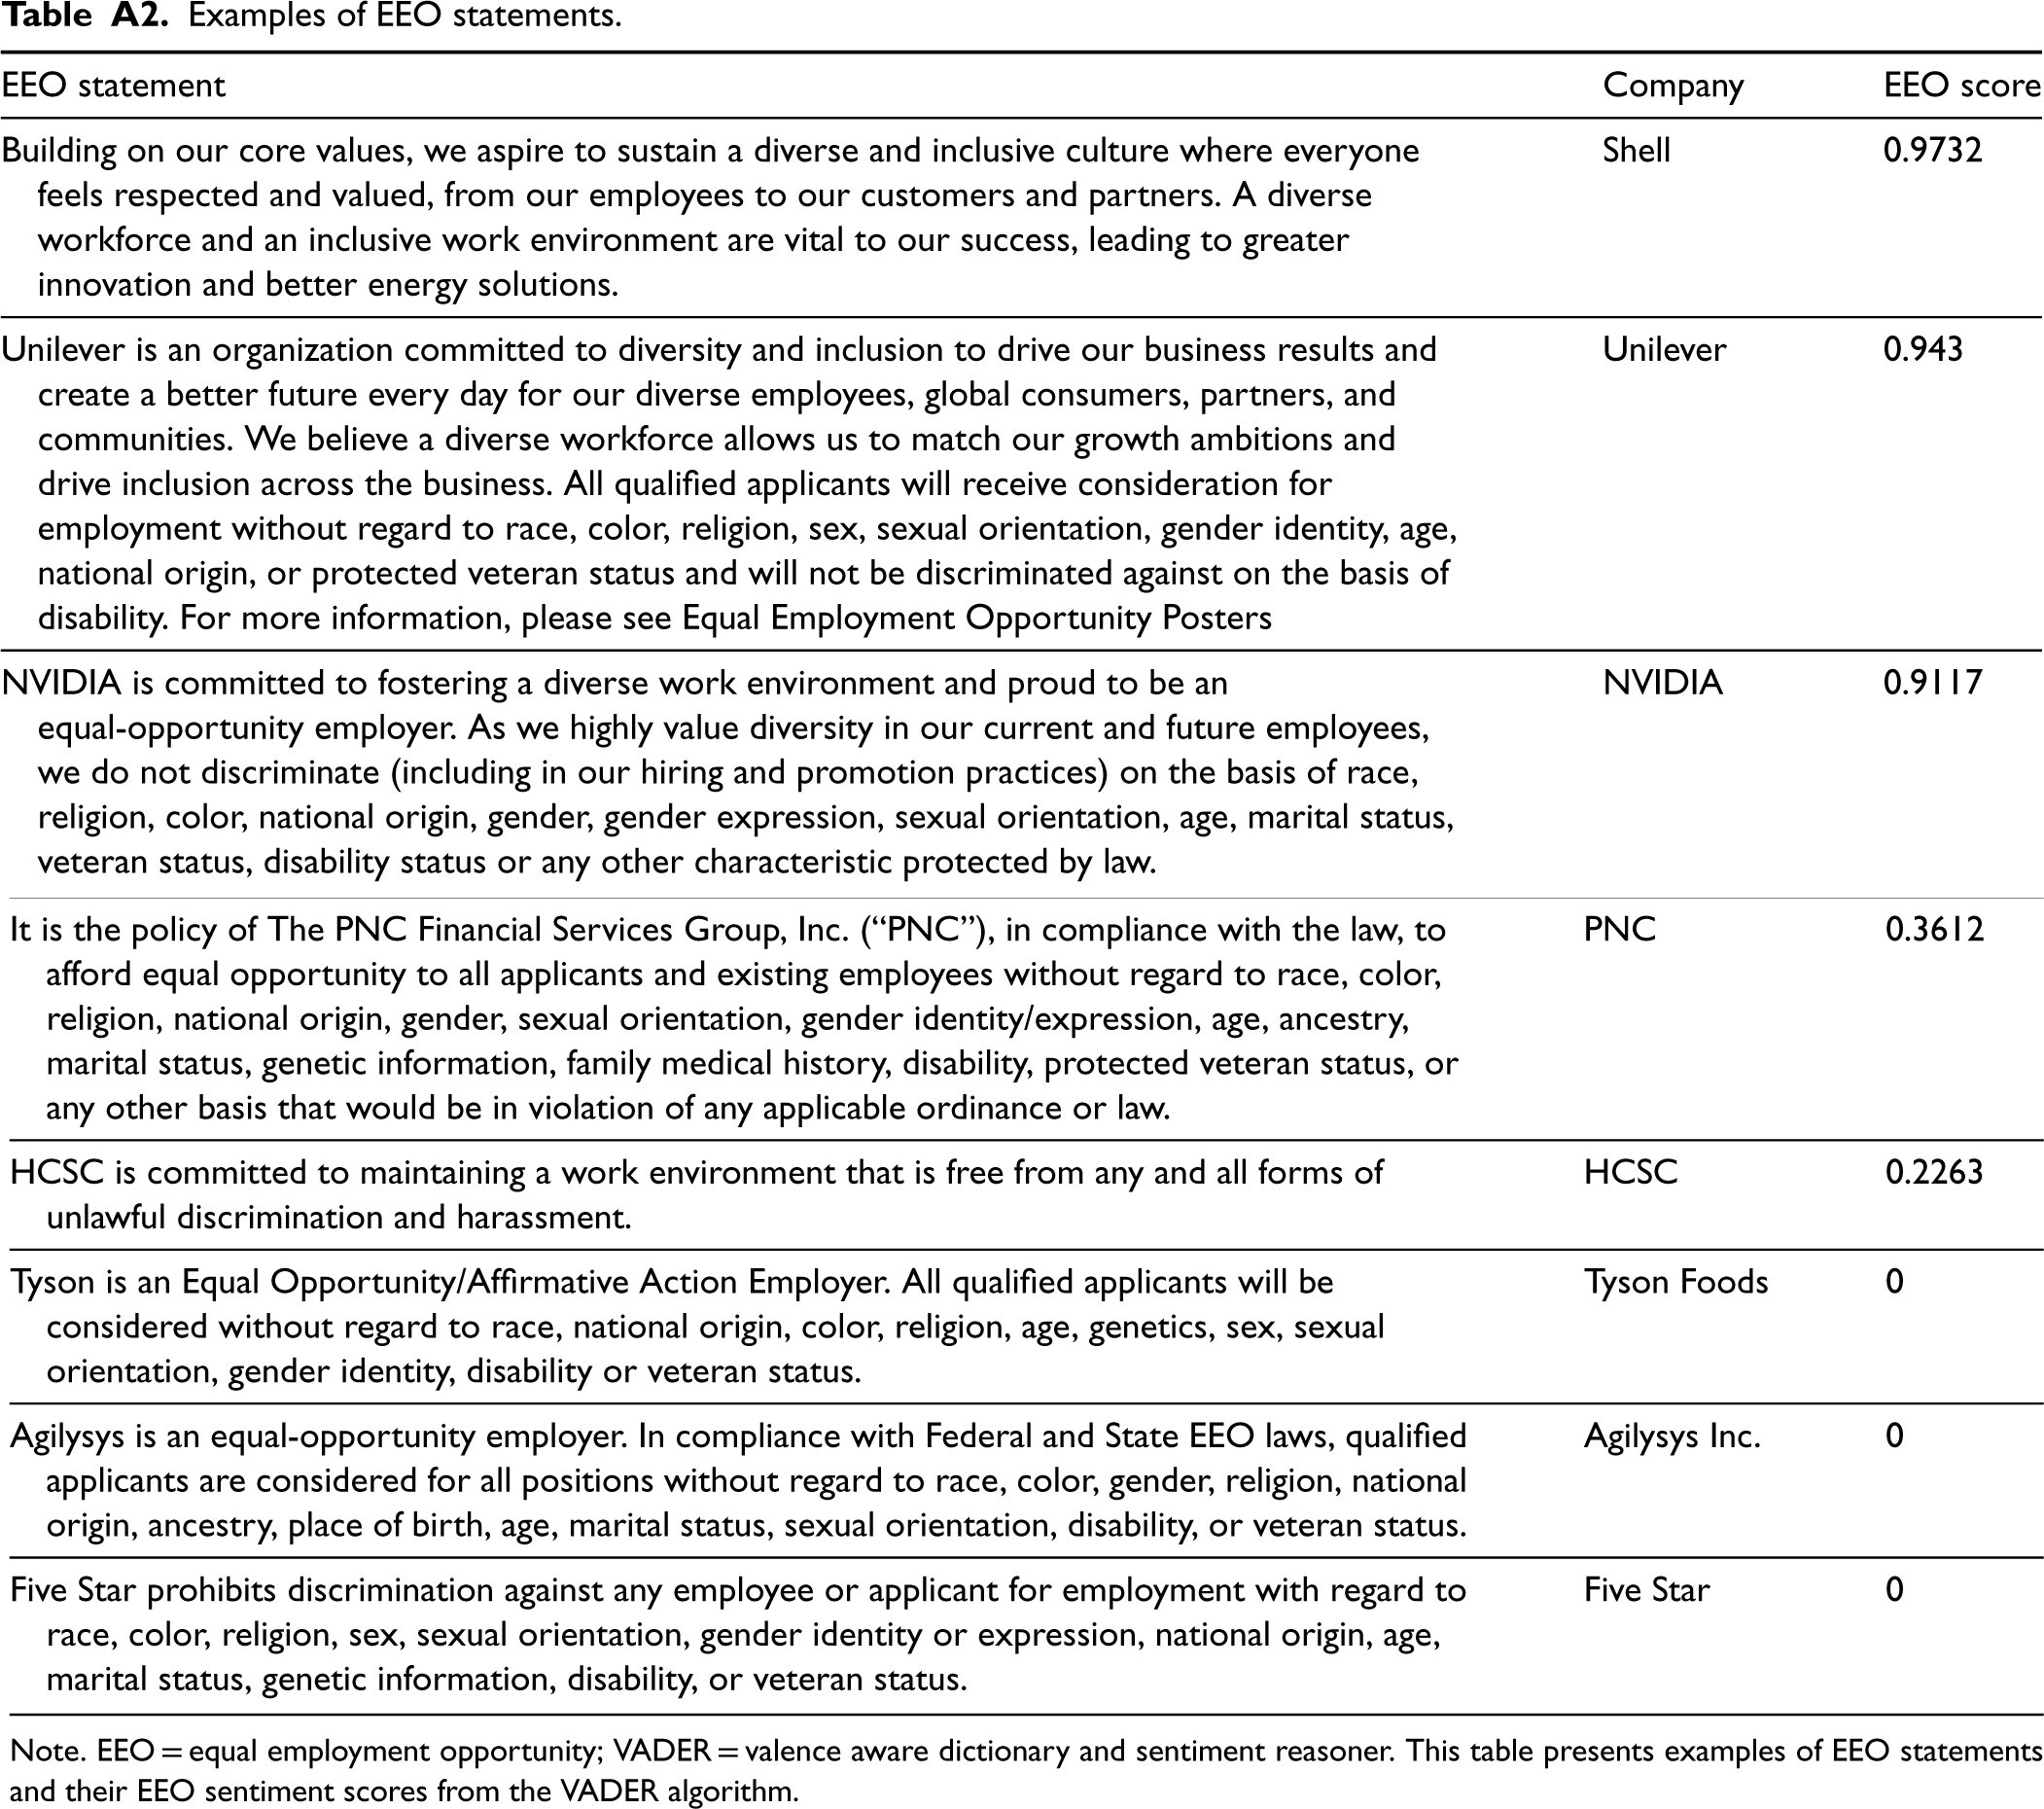
We provide examples of EEO statements and their corresponding EEO sentiment score rated by the VADER algorithm in Appendix Table A2. Take the EEO statement of Shell plc as an example: Building on our core values, we aspire to sustain a diverse and inclusive culture where everyone feels respected and valued, from our employees to our customers and partners. A diverse workplace and an inclusive work environment are vital to our success, leading to greater innovation and better energy solutions.
The EEO sentiment score of this warm and genuine statement is high, at 0.973. In contrast, the EEO statement of Tyson Foods is plain and perfunctory, the EEO sentiment score of which is 0: Tyson is an Equal Opportunity/Affirmative Action Employer. All qualified applicants will be considered without regard to race, national origin, color, religion, age, genetics, sex, sexual orientation, gender identity, disability, or veteran status.
When a supplier firm has multiple principal customers, we compute the lagged customer EEO score of the supplier firm i (
Supply Chain Data and Sample Construction
We obtain the supply chain relationship data from the Compustat Customer Segment database, covering the period 1976–2019. Securities and Exchange Commission Regulation S-K requires all US public firms to disclose their principal customers representing more than 10% of the firm’s total sales. 20
Since the suppliers only report the names of their principal customers, the unique firm identifiers (i.e., GVKEYs) for customer firms are missing from the Compustat Customer Segment database. Suppliers may report various versions of customer names, including abbreviations, misspellings, and subsidiary names. To circumvent the data challenge, we use the Compustat customer segment company names-GVKEY link from Wharton Research Data Service (provided by Cen et al. (2017)) to match the names of principal customers with the unique GVKEYs in the Compustat database.
To construct the sample for our empirical analysis, we merge the Compustat Customer Segment File with the Center for Research in Security Prices (CRSP)-Compustat Merged File to obtain financial variables for both supplier and customer firms. The supply chain relationship data are merged with BGT data for the workplace EEO scores of suppliers and customers. Since the BGT data set spans the period 2010–2020, the lagged
Summary Statistics
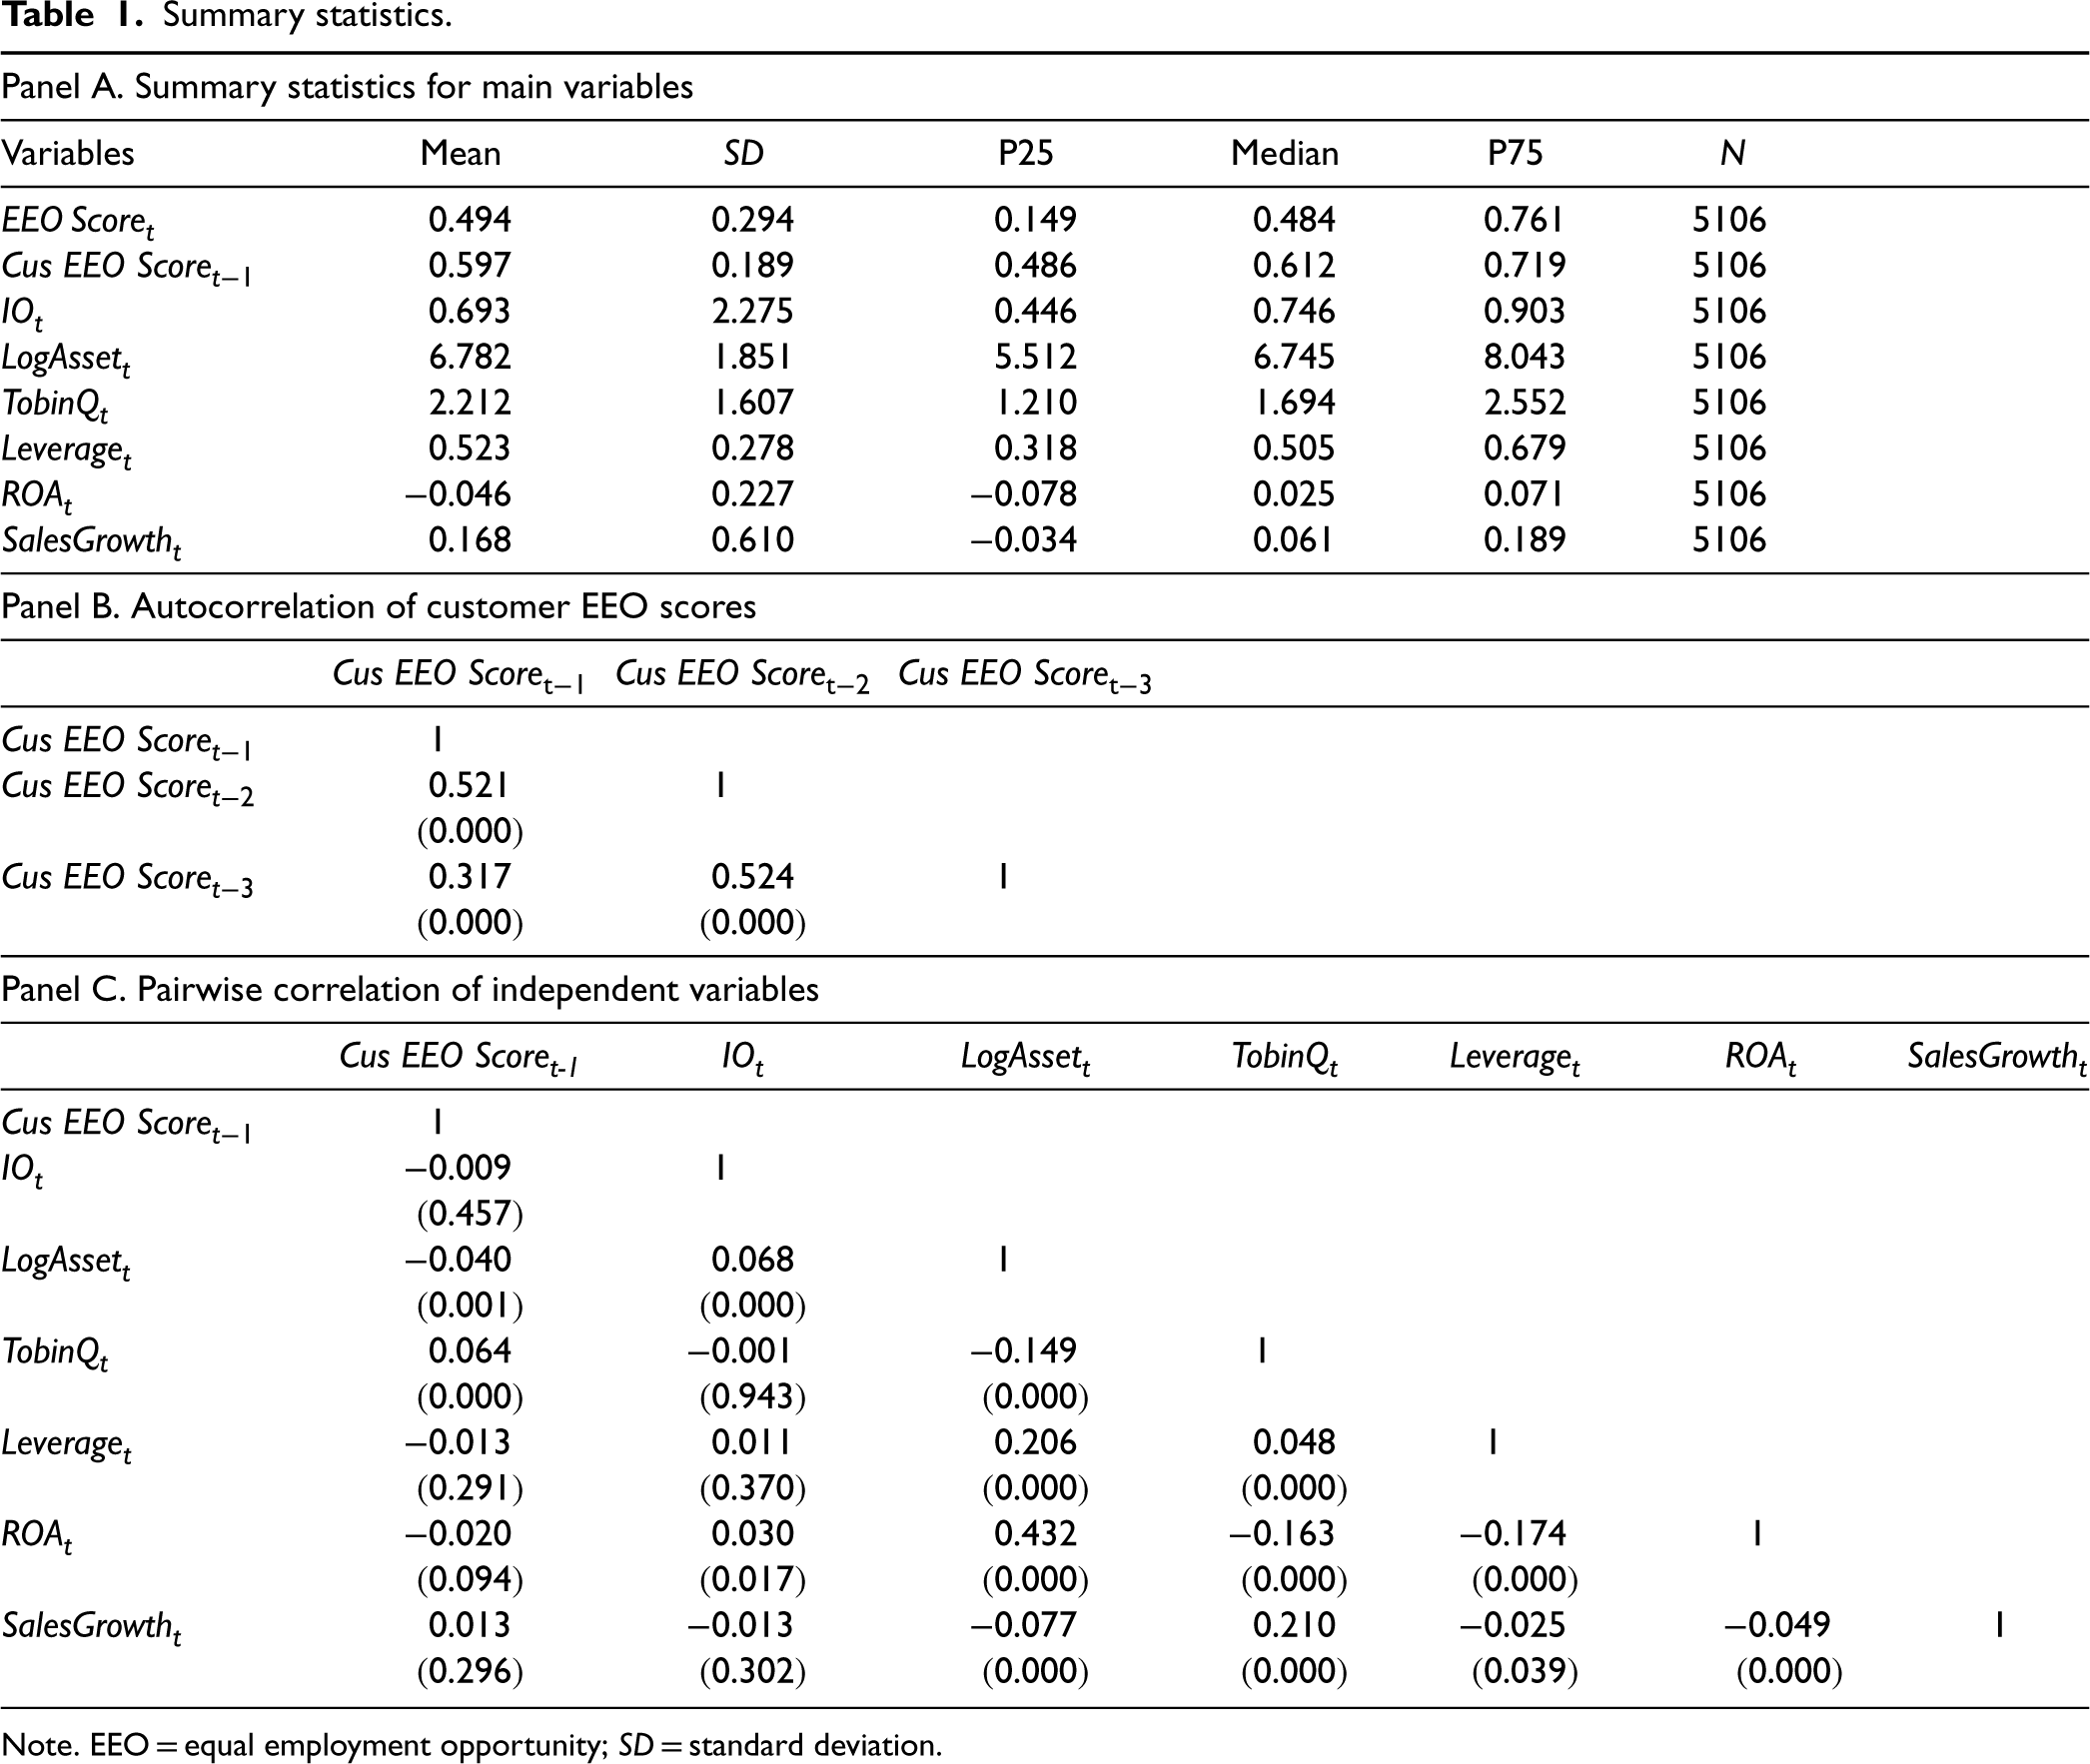
We present the summary statistics for the
Summary statistics.
Summary statistics.
Note. EEO = equal employment opportunity;
We report the autocorrelations of
Panel C of Table 1 presents pairwise correlations among independent variables. The pairwise correlations are generally small, ranging from −0.174 to 0.432. The low correlation coefficients between independent variables indicate that multicollinearity is not likely a major concern in our study.
Baseline Tests
Our baseline sample is organized at the supplier-year level. Specifically, we regress the contemporaneous EEO score of supplier firms (
The baseline regression is reported in column (1) of Table 2. The coefficient of
Diffusion of workplace EEO practice along supply chains.
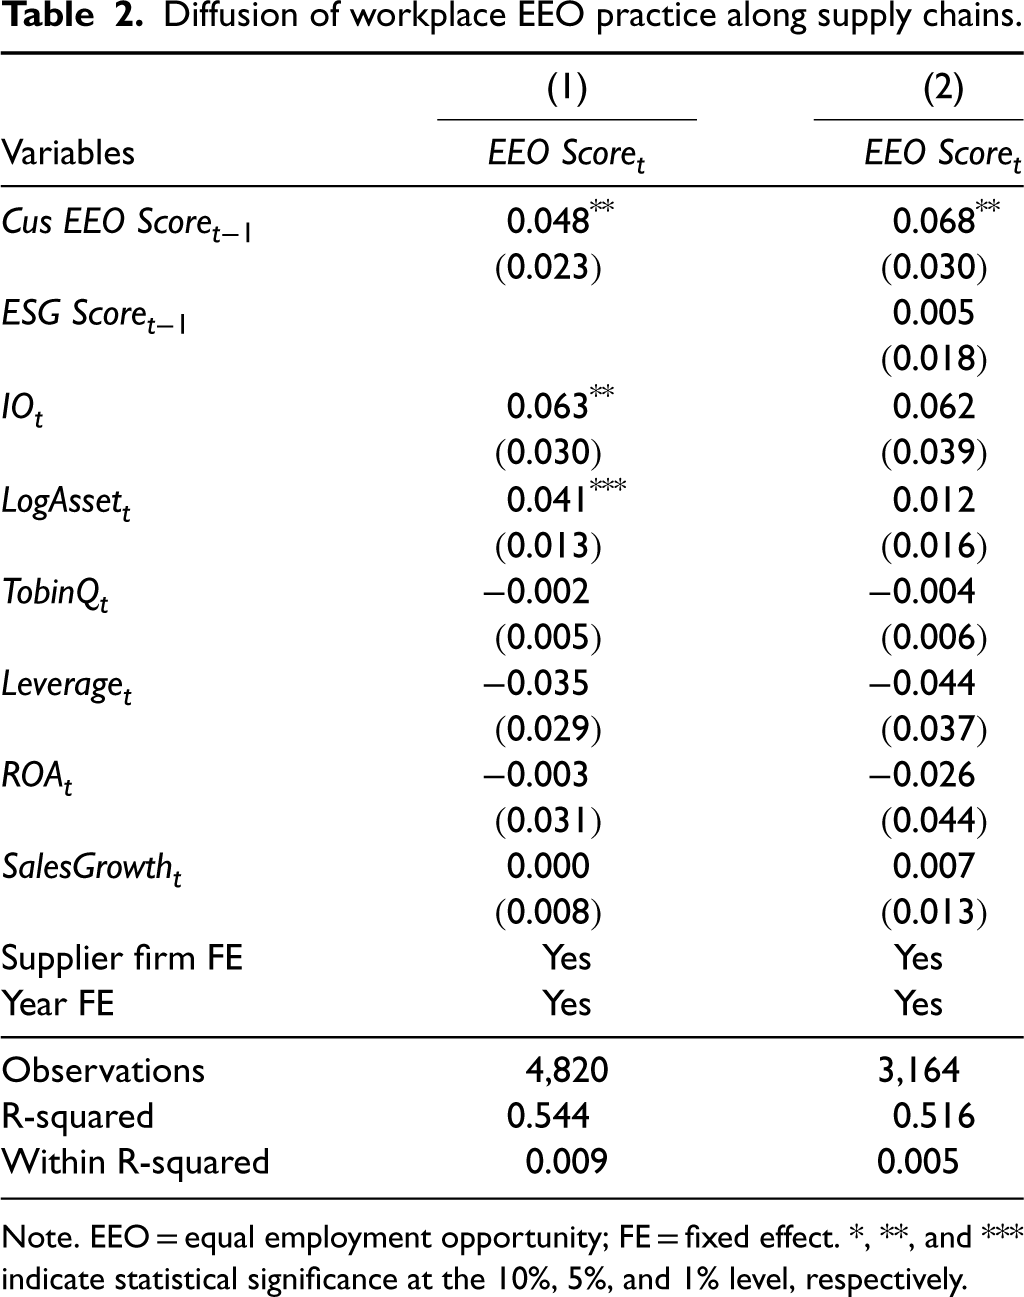
Note. EEO = equal employment opportunity; FE = fixed effect. *, **, and *** indicate statistical significance at the 10%, 5%, and 1% level, respectively.
Next, we carry out a series of robustness checks of our baseline results reported in column (1). First, we repeat our baseline test with an additional control variable, the (lagged) KLD-MSCI ESG measure of suppliers, into our test specification. We include this measure to verify whether our baseline effect is specific to the diffusion of corporate workplace practice along the supply chain. One possibility that we want to rule out is that the EEO practice is highly correlated with other ESG policies, and, therefore, the baseline result captures the correlation of aggregated ESG policies between customers and suppliers. We report this test in column (2) of Table 2. Our results in column (2) suggest that (1) suppliers’ EEO scores are positively correlated with their aggregated ESG scores, although this correlation is not statistically significant, and (2) including the aggregated ESG measure of suppliers does not weaken our baseline results.
In the second set of tests reported in Online Appendix Table OA1, we show that our baseline results are robust to the inclusion of different combinations of control variables. In the third set of tests reported in Online Appendix Table OA2, we replace the year fixed effects with industry-year fixed effects to control for time-varying industry-specific shocks. The main patterns of our baseline test are unaffected.
It is important to point out that the lagged structure of our baseline specification does not guarantee a causal interpretation. We face three layers of endogeneity concerns. First, we need to investigate whether the EEO diffusion along the supply chain is relationship-specific; for example, the correlation above may be driven by vertical economic links at the industry level. Second, it is possible that the correlation of the EEO scores between supply chain partners is driven by a selection effect; for example, principal customers systematically select suppliers with good EEO practices at the relationship establishment. Third, the correlation of the EEO scores between supply chain partners may be driven by common (and time-varying) economic factors that researchers do not observe (i.e., the “omitted variable” concern). We will address these three endogeneity concerns in the following subsections.
We address the first endogeneity concern by conducting the following placebo tests. We first construct a placebo sample as a benchmark for interpreting our findings. In the placebo sample, we keep the actual customer firm in each supply chain relationship and replace the actual supplier with placebo suppliers. For each supplier, we identify the corresponding placebo suppliers based on product similarity. We obtain product similarity score following Hoberg and Phillips (2016). 25 Using the product description in 10-K filings, Hoberg and Phillips (2016) conduct pair-wise textual similarity analysis and calculate pair-wise product similarity scores for US public firms, which measures how similar the products of the firm are to products of every other US public firm. They define the two firms to be product-market competitors if the pair-wise product similarity score between the two firms exceeds the minimum threshold. 26 A higher product similarity score between firm i and firm j indicates that firm i and firm j produce more similar products and, henceforth, have a higher propensity to serve the same customer firm. Similar to the formation of our baseline sample, when a placebo supplier has multiple principal customers, we compute the sales-weighted average of customer EEO score using the sales of the corresponding actual supplier.
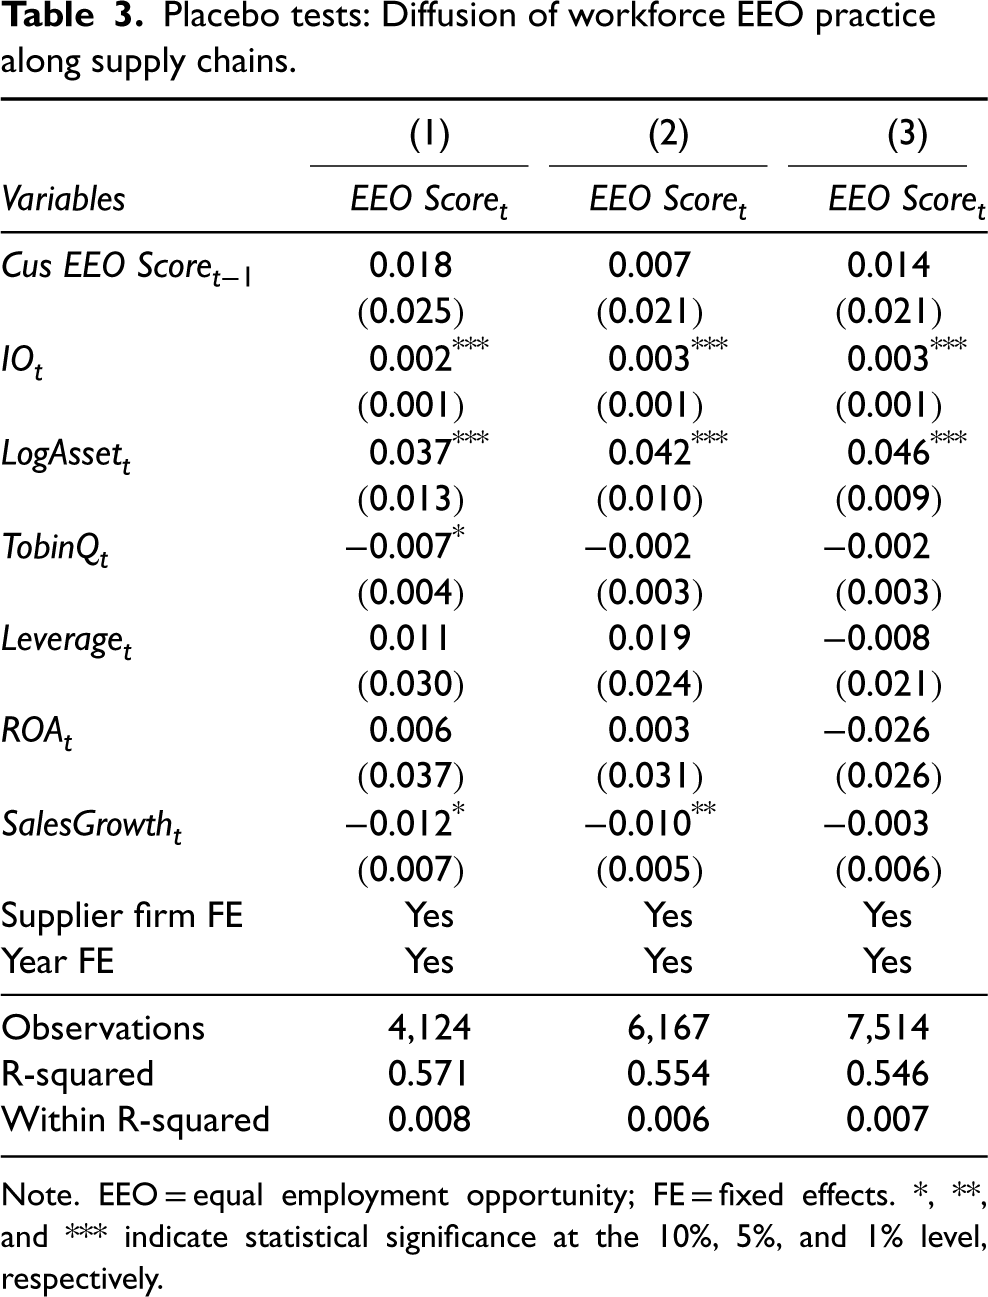
Table 3 presents the results of our placebo tests. The test specification is exactly the same as that in column (1) of Table 2 where actual suppliers are replaced by placebo suppliers. In columns (1)–(3), each actual supplier is matched with the one, two, or three placebo suppliers that have the highest product similarity to the actual supplier but with no disclosed supply chain relationship with the actual customers. 27 From these placebo test results, we can see that the customer EEO score is not related to its placebo suppliers, suggesting the diffusion of EEO practice along supply chains is driven by firm-specific relationships rather than industry-level economic links.
Placebo tests: Diffusion of workforce EEO practice along supply chains.
Placebo tests: Diffusion of workforce EEO practice along supply chains.
Note. EEO = equal employment opportunity; FE = fixed effects. *, **, and *** indicate statistical significance at the 10%, 5%, and 1% level, respectively.
A potential concern with the above placebo tests is that the results may be specific to the matching technique based on product similarity that we use to identify placebo suppliers. To address this concern, we further carry out a simulation test using 1,000 benchmark samples as follows: First, for each actual customer, we randomly select a simulated supplier from the same SIC2 industry that the actual supplier belongs to. We only require that the simulated supplier has no direct economic link with the actual customer. Second, we form a benchmark sample of simulated relationships using the actual customers and their simulated suppliers. When a simulated supplier has multiple principal customers, we aggregate the sample to the supplier-year level by computing the sales-weighted average of customer EEO scores. Third, we repeat this process 1,000 times to form 1,000 simulated benchmark samples. Finally, we reestimate our baseline specification for all 1,000 simulated benchmark samples and generate 1,000 coefficient estimates with corresponding
The main advantage of this simulation exercise is that we do not rely on any specific choices of models or parameters. Furthermore, given the large number of simulations, it is unlikely that the coefficient in the actual relationship sample can “beat” most coefficients based on simulated benchmark samples by luck. Essentially, this technique allows us to see where the coefficient (
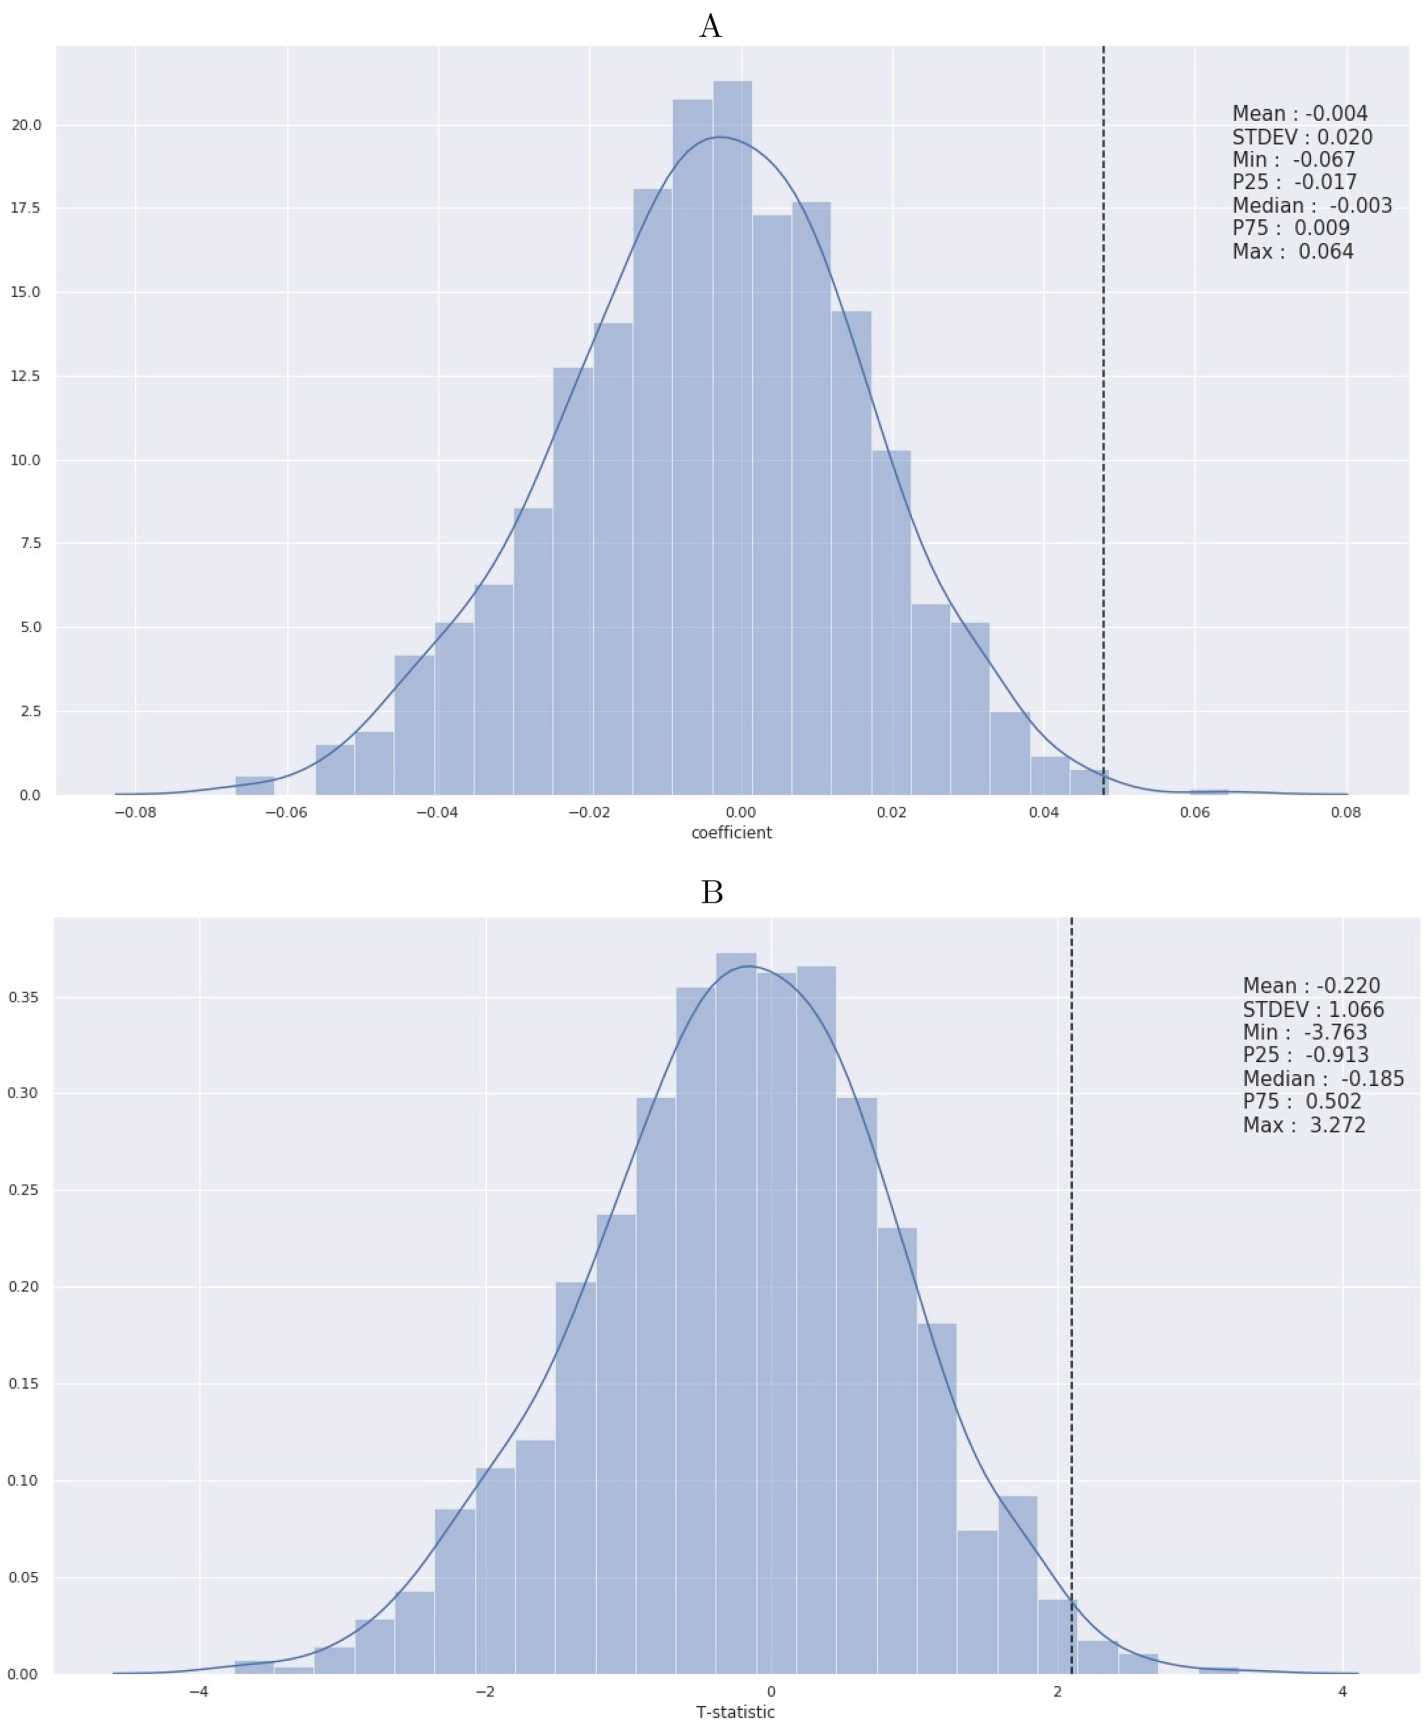
The distribution of 1,000 coefficient estimates and
The placebo test shows that our baseline result is not driven by industry-level economic links. However, this test does not address all endogeneity concerns, especially the selection issue and any unobserved common factors that affect the EEO practices of customer and supplier firms simultaneously.
We first run a selection test to investigate whether suppliers with better EEO practices are more likely to be selected by principal customers. The results of this test are reported in Online Appendix Table OA3. Specifically, for any recently added supplier firms in year t, we identify all comparable firms in the same SIC2 industry in year
Next, we formally address the remaining endogeneity concerns by exploiting an identification strategy based on the Big Three Diversity Campaign in 2017. The “Big Three” refers to three major institutional investors, including BlackRock, Vanguard, and State Street. The Big Three collectively represent 75% of indexed funds. In nearly 90% of S&P 500 companies, either Blackrock, Vanguard, or State Street holds the largest stake. 29 Moreover, the Big Three have disproportionately high voting power as not all investors exercise their voting rights, making them “the most important players in corporate America.” 30 On International Women’s Day (March 8) of 2017, State Street launched its “Fearless Girls” campaign to encourage firms to add female directors. This initiative was subsequently echoed and supported by BlackRock in July and by Vanguard in August 2017. After launching this initiative, the Big Three began to vote against firms with lower gender diversity. The Big Three’s diversity campaign had a substantial impact on boards’ gender diversity (Gormley et al., 2023).
In this identification strategy, we define the “affected” (i.e., treated) firms as those whose percentage of outstanding shares held by the “Big Three” institutions is higher than the sample average but for which the number of female directors is lower than the sample average. The firms in the benchmark sample either have low institutional ownership by the Big Three (i.e., so that the “Big Three” institutions do not have sufficient stakes to discipline them) or a high level of female directors (i.e., so that the “Big Three” institutions have no reasons to discipline them). Based on this identification strategy, we estimate the following difference-in-differences regression:

Results in Table 4 suggest that the EEO policies propagate along the supply chain after the exogenous increase in customers’ EEO levels. Suppliers with customers affected by the 2017 Big Three Diversity Campaign experienced a larger increase in EEO scores after 2017 relative to other supplier firms. The effect is sizable in economic magnitude: the additional increase in the EEO scores of suppliers with one more affected customer relative to their peers is 0.07, which represents 14.2% of the average EEO score in the full sample. The results are robust to excluding suppliers that are directly affected by the Big Three Diversity Campaign themselves (column (2) of Table 4). We also show in Online Appendix Table OA4 that our results are robust to including industry-year fixed effects. Overall, our results based on the 2017 Big Three Diversity Campaign are consistent with the causal claim that the workplace equality practices of customers affect subsequent workplace equality levels of their suppliers.
Exogenous shock to customers’ workforce equality: 2017 Big Three gender diversity campaign.
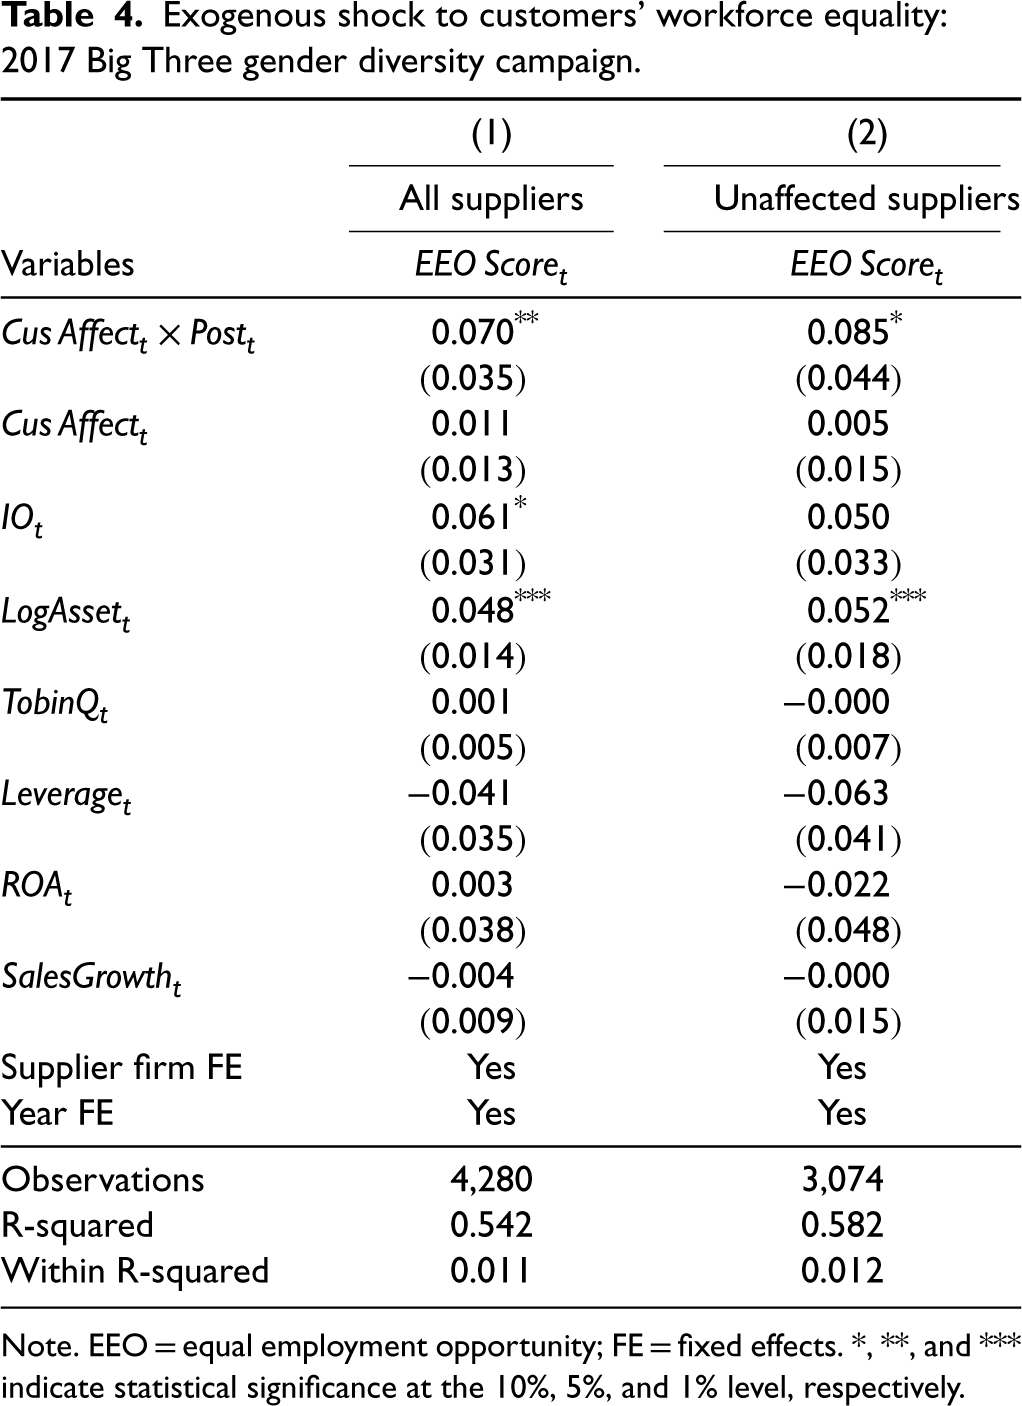
Note. EEO = equal employment opportunity; FE = fixed effects. *, **, and *** indicate statistical significance at the 10%, 5%, and 1% level, respectively.
Our main point is that suppliers, in order to maintain and strengthen relationships with their principal customers, adjust their workplace equal opportunity policies to cater to the preferences of their principal customers. Implicitly, principal customer firms play a disciplinary role while they pay attention to the labor-related risks along supply chains. The effectiveness of this implicit disciplinary role depends on the bargaining power of principal customers with their dependent suppliers. 32
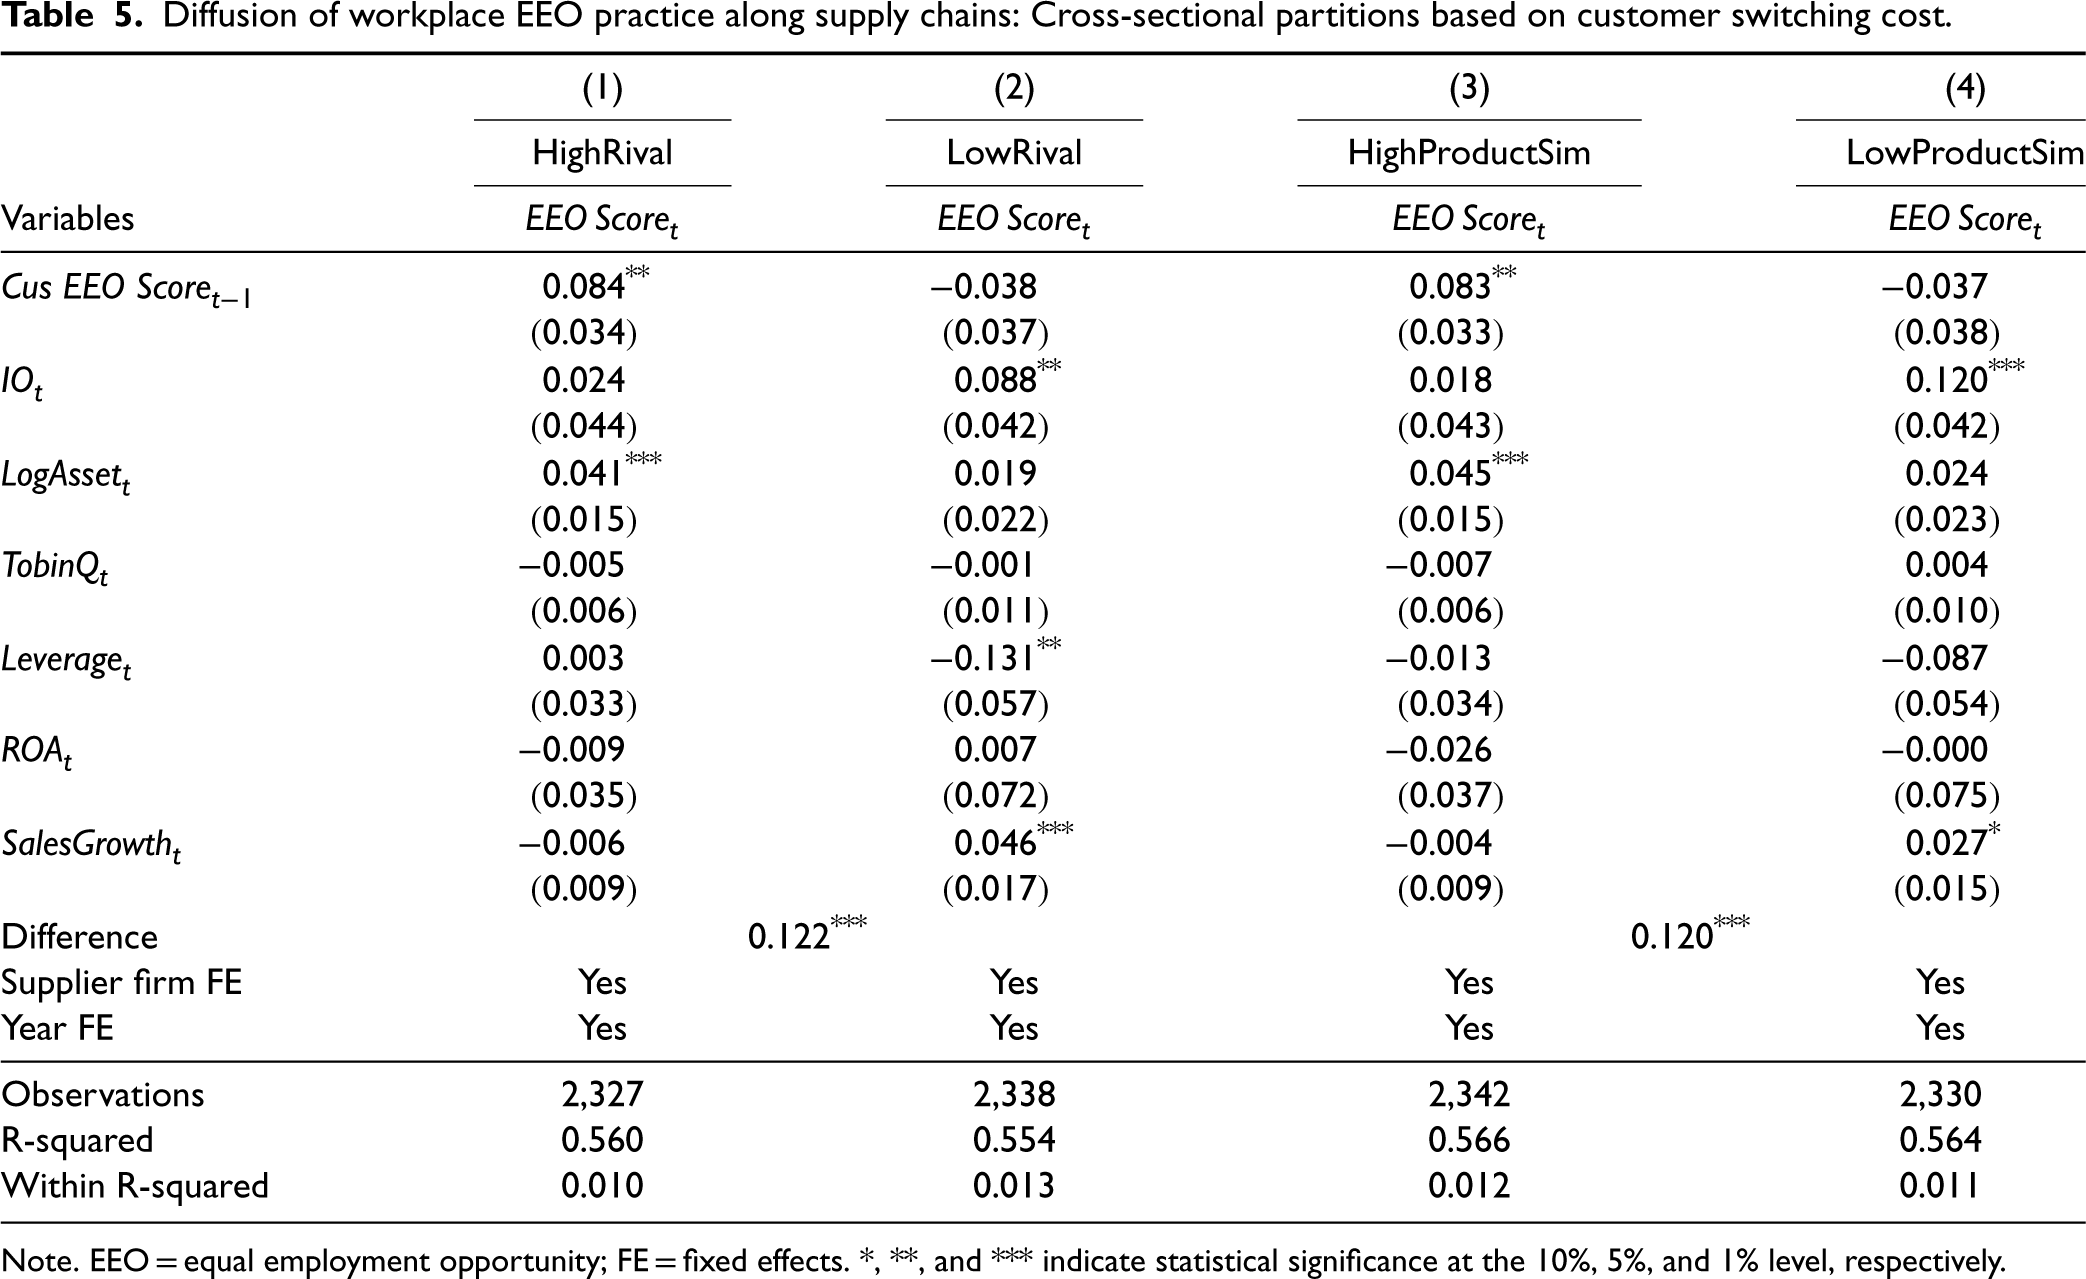
We proxy customers’ bargaining power with their suppliers by customer switching cost, that is, how costly it is for a customer to replace its existing supplier with a “substitute” supplier. Following Hoberg and Phillips (2016), we construct two measures for the customer switching cost: the number of product-market competitors and product similarity in the supplier industry. The number of product market competitors is closely related to the market share of the firm: the more product competitors a firm has, the less likely the firm occupies a large market share. Intuitively, we argue that when a supplier firm belongs to an industry with a larger number of competitors or a higher level of product similarity, its customer firms face a lower cost to replace the supplier firm and, therefore, the supplier is more likely to adjust its workplace EEO policies to cater to the preferences or requirements of its customers.
Diffusion of workplace EEO practice along supply chains: Cross-sectional partitions based on customer switching cost.
Diffusion of workplace EEO practice along supply chains: Cross-sectional partitions based on customer switching cost.
Note. EEO = equal employment opportunity; FE = fixed effects. *, **, and *** indicate statistical significance at the 10%, 5%, and 1% level, respectively.
Results in Table 5 are consistent with our conjecture. Specifically, we have a much stronger lead–lag pattern in workplace EEO policies between customers and suppliers in the
In previous sections, we have shown the EEO diffusion along the supply chain and established the causality that suppliers adopt EEO policies to cater to their principal customers’ preferences. In this section, we focus on the real economic outcomes of EEO diffusion along the supply chain. Specifically, we examine whether the diffusion of workplace EEO practices from customers to suppliers affects how suppliers retain female workers. This test is motivated by anecdotal evidence that the effects of workplace equality practices are more pronounced in retaining female employees. 33
In this test, we retrieve the career histories of male and female workers from the Lightcast US Profile database. In this database, we are able to see the duration (i.e., starting and ending year months) of each individual job for both male and female workers. Our main conjecture is that, after controlling for the contemporaneous EEO level of supplier firms themselves, the lagged EEO level of customers would still affect how long female workers would be retained in the workforce of suppliers. We test this conjecture with the following model:


To account for the impact of suppliers’ own EEO practices on the likelihood of retaining female employees, we include the contemporaneous EEO score of the supplier as a control variable. We also control for the natural logarithm of the total number of employees of the supplier (
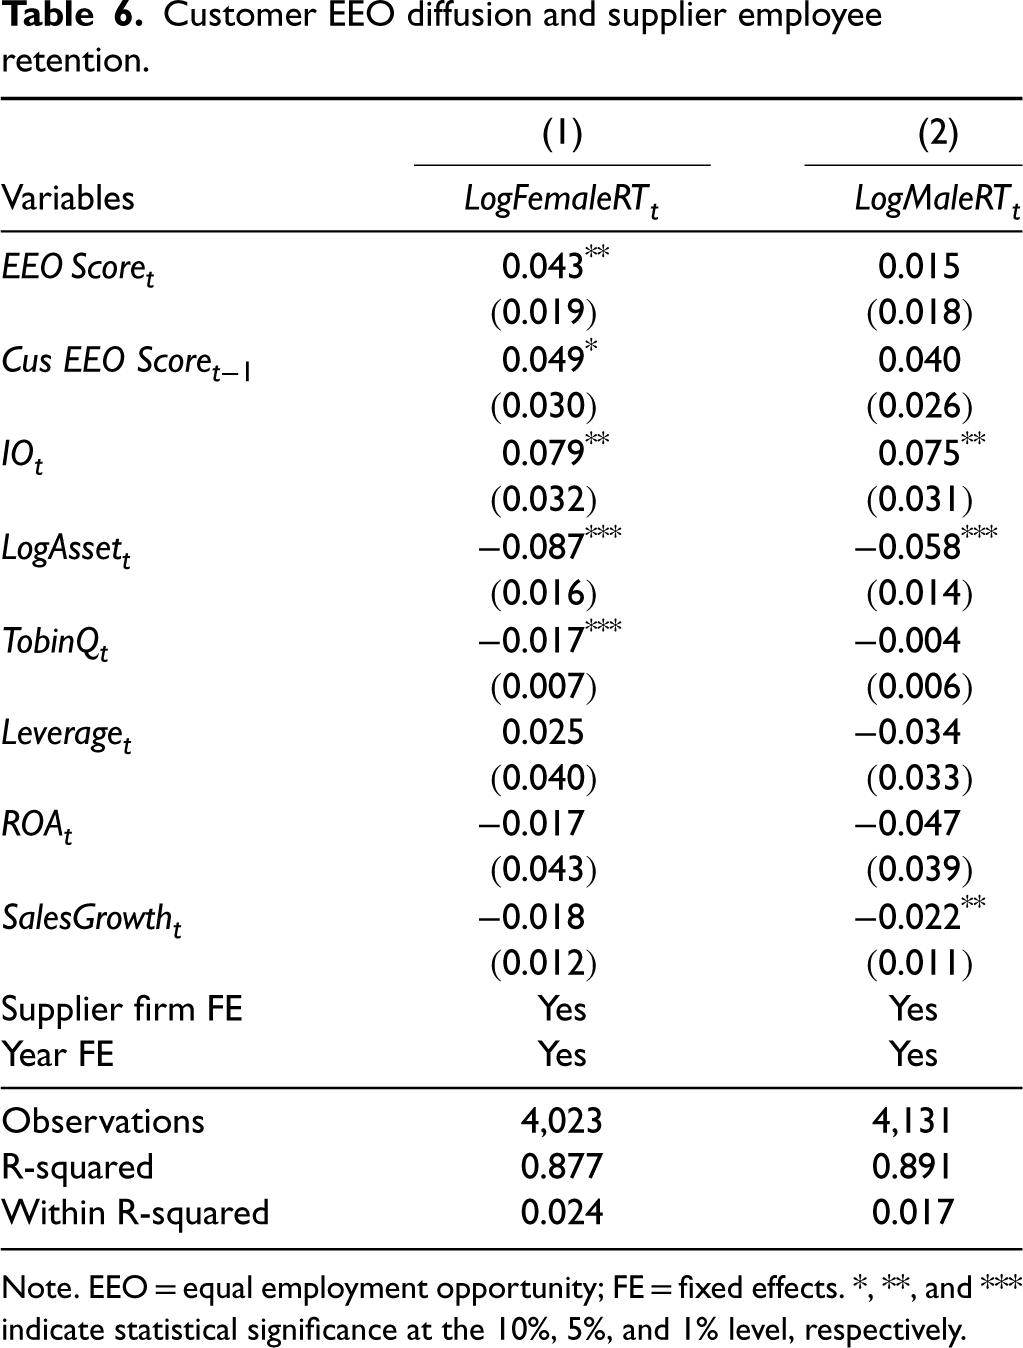
Table 6 presents the results for the effect of workplace EEO diffusion on the career duration of female and male employees in supplier firms. The coefficient of
Customer EEO diffusion and supplier employee retention.
Note. EEO = equal employment opportunity; FE = fixed effects. *, **, and *** indicate statistical significance at the 10%, 5%, and 1% level, respectively.
Our main interest lies in the coefficients of
As shown in Online Appendix Table OA5, our results are robust to including supplier industry-year fixed effects. Our results are also robust to different model specifications. 34 One caveat here is that we do not intend to claim causality in our tests of real economic outcomes in Section 6. Instead, we suggest that our results are consistent with the notion that the diffusion of EEO policies along the supply chain may generate real economic outcomes, particularly for the dependent suppliers.
EEO policies play a crucial role in fostering workplace DEI. Firms are increasingly recognizing the importance of integrating EEO initiatives into their business models to build a sustainable competitive advantage in the marketplace. Despite the growing recognition of EEO’s importance, its influence on supply chains remains largely unexplored as an empirical question. We use a unique dataset that combines job posting textual analyses and supply chain information, to illuminate how EEO practices propagate throughout supply chain relationships.
Our research reveals a compelling pattern of EEO diffusion (cascade) in the supply chain. That is, the EEO policies of downstream companies affect the EEO practices of their upstream suppliers. This effect is amplified when the bargaining power of downstream companies is greater. Furthermore, we find that the diffusion of EEO policies along the supply chain generates important economic outcomes. Specifically, the diffusion of good EEO policies from customers to suppliers helps suppliers retain female employees. In conclusion, our study demonstrates that EEO diffusion along the supply chain is an important economic dynamic to ensure “doing well by doing good” in sustainable supply chain management.
While the significance of EEO transcends regional or industry boundaries, our findings regarding the EEO diffusion along supply chains may have important policy implications. That said, an increase in a company’s EEO score could have ripple effects across the entire supply chain network. Therefore, forward-thinking companies that prioritize sustainable development can enhance overall social welfare and supply chain performance by promoting EEO policies. Policymakers should also be aware that EEO practices can interact with and spill over into supply chains and generate greater positive social returns. For companies that have not fully implemented EEO policies, our results show compelling evidence that adopting such policies is not only socially responsible but also supported by supply chain economic incentives, warranting strategic considerations.
Supplemental Material
sj-pdf-1-pao-10.1177_10591478241238968 - Supplemental material for Equal Employment Opportunity in Supply Chains
Supplemental material, sj-pdf-1-pao-10.1177_10591478241238968 for Equal Employment Opportunity in Supply Chains by Ling Cen, Yanru Han and Jing Wu in Production and Operations Management
Footnotes
Appendix
Variable definition. Note. EEO = equal employment opportunity. Examples of EEO statements. Note. EEO = equal employment opportunity; VADER = valence aware dictionary and sentiment reasoner. This table presents examples of EEO statements and their EEO sentiment scores from the VADER algorithm. Sample selection. Note. CRSP= Center for Research in Security Prices; SIC = Standard Industrial Classification.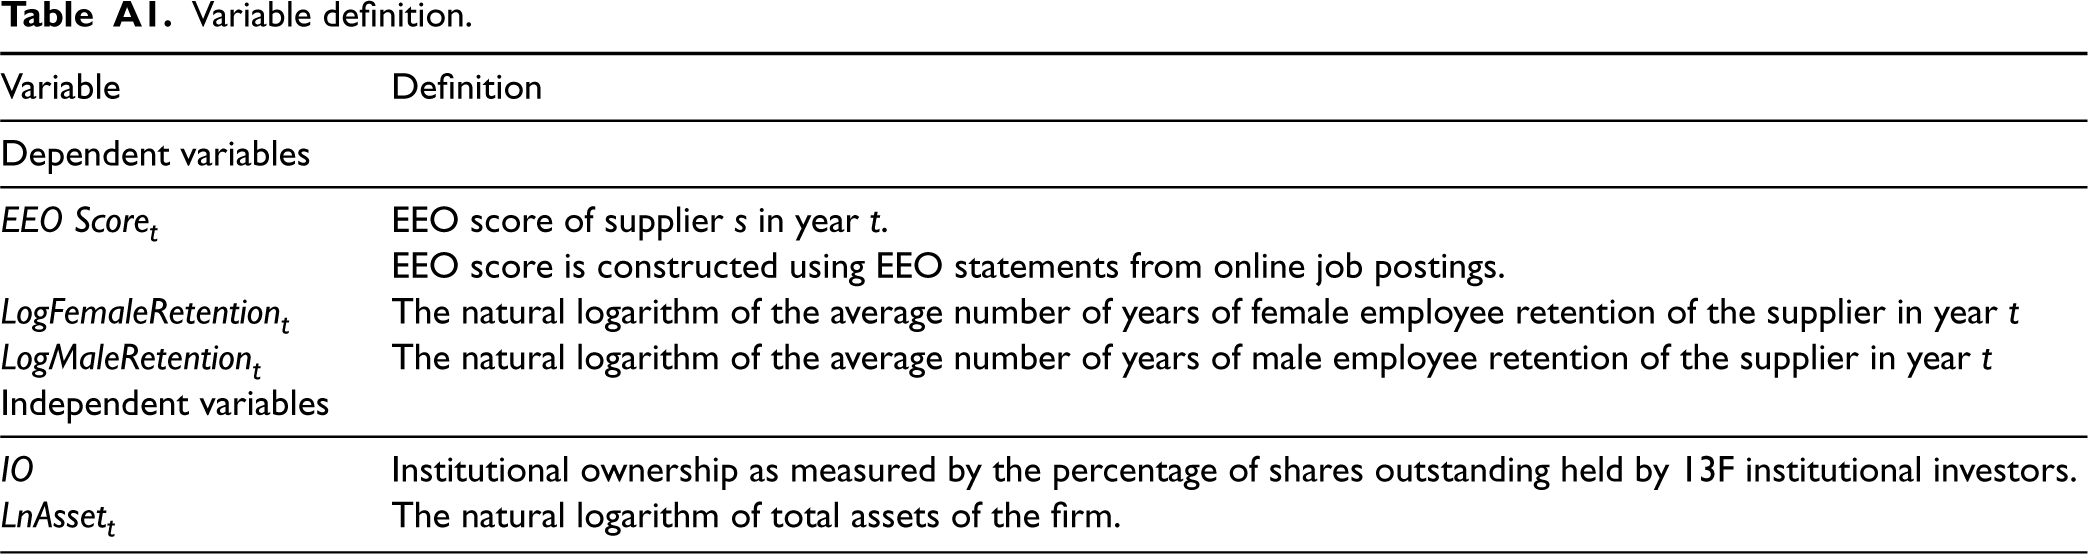
Variable
Definition
Dependent variables
EEO score of supplier s in year t.
EEO score is constructed using EEO statements from online job postings.
The natural logarithm of the average number of years of female employee retention of the supplier in year t
The natural logarithm of the average number of years of male employee retention of the supplier in year t
Independent variables
Institutional ownership as measured by the percentage of shares outstanding held by 13F institutional investors.
The natural logarithm of total assets of the firm.
Variable
Definition
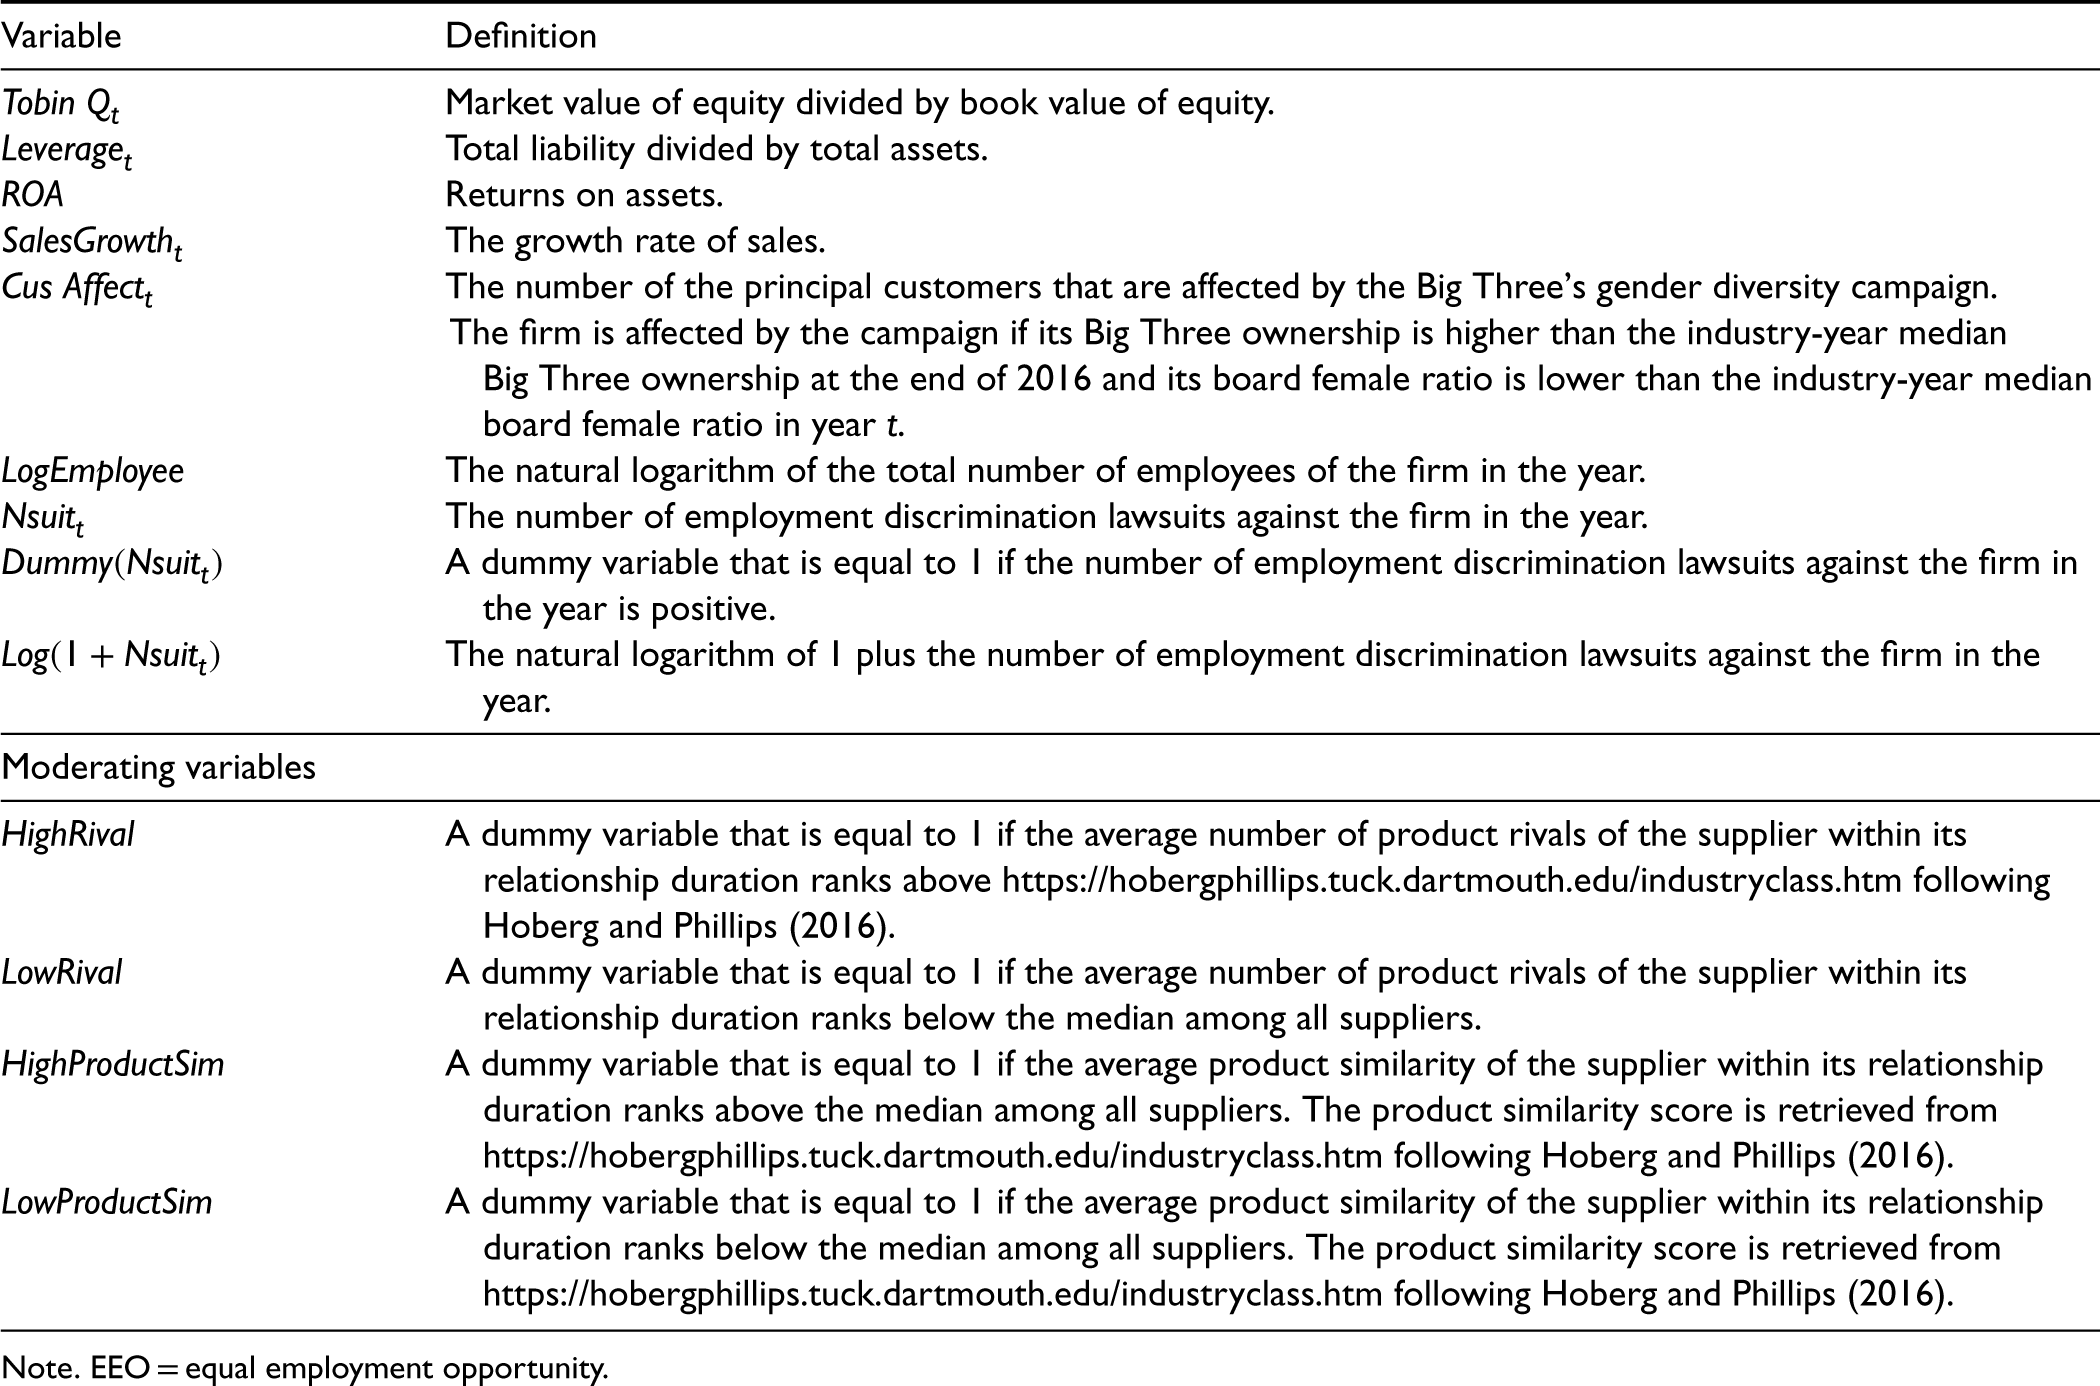
Market value of equity divided by book value of equity.
Total liability divided by total assets.
Returns on assets.
The growth rate of sales.
The number of the principal customers that are affected by the Big Three’s gender diversity campaign.The firm is affected by the campaign if its Big Three ownership is higher than the industry-year medianBig Three ownership at the end of 2016 and its board female ratio is lower than the industry-year median board female ratio in year t.
The natural logarithm of the total number of employees of the firm in the year.
The number of employment discrimination lawsuits against the firm in the year.
A dummy variable that is equal to 1 if the number of employment discrimination lawsuits against the firm in the year is positive.
The natural logarithm of 1 plus the number of employment discrimination lawsuits against the firm in the year.
Moderating variables
A dummy variable that is equal to 1 if the average number of product rivals of the supplier within its relationship duration ranks above https://hobergphillips.tuck.dartmouth.edu/industryclass.htm following Hoberg and Phillips (2016).
A dummy variable that is equal to 1 if the average number of product rivals of the supplier within its relationship duration ranks below the median among all suppliers.
A dummy variable that is equal to 1 if the average product similarity of the supplier within its relationship duration ranks above the median among all suppliers. The product similarity score is retrieved from https://hobergphillips.tuck.dartmouth.edu/industryclass.htm following Hoberg and Phillips (2016).
A dummy variable that is equal to 1 if the average product similarity of the supplier within its relationship duration ranks below the median among all suppliers. The product similarity score is retrieved from https://hobergphillips.tuck.dartmouth.edu/industryclass.htm following Hoberg and Phillips (2016).
EEO statement
Company
EEO score
Building on our core values, we aspire to sustain a diverse and inclusive culture where everyone feels respected and valued, from our employees to our customers and partners. A diverse workforce and an inclusive work environment are vital to our success, leading to greater innovation and better energy solutions.
Shell
0.9732
Unilever is an organization committed to diversity and inclusion to drive our business results and create a better future every day for our diverse employees, global consumers, partners, and communities. We believe a diverse workforce allows us to match our growth ambitions and drive inclusion across the business. All qualified applicants will receive consideration for employment without regard to race, color, religion, sex, sexual orientation, gender identity, age, national origin, or protected veteran status and will not be discriminated against on the basis of disability. For more information, please see Equal Employment Opportunity Posters
Unilever
0.943
NVIDIA is committed to fostering a diverse work environment and proud to be an equal-opportunity employer. As we highly value diversity in our current and future employees, we do not discriminate (including in our hiring and promotion practices) on the basis of race, religion, color, national origin, gender, gender expression, sexual orientation, age, marital status, veteran status, disability status or any other characteristic protected by law.
NVIDIA
0.9117
It is the policy of The PNC Financial Services Group, Inc. (“PNC”), in compliance with the law, to afford equal opportunity to all applicants and existing employees without regard to race, color, religion, national origin, gender, sexual orientation, gender identity/expression, age, ancestry, marital status, genetic information, family medical history, disability, protected veteran status, or any other basis that would be in violation of any applicable ordinance or law.
PNC
0.3612
HCSC is committed to maintaining a work environment that is free from any and all forms of unlawful discrimination and harassment.
HCSC
0.2263
Tyson is an Equal Opportunity/Affirmative Action Employer. All qualified applicants will be considered without regard to race, national origin, color, religion, age, genetics, sex, sexual orientation, gender identity, disability or veteran status.
Tyson Foods
0
Agilysys is an equal-opportunity employer. In compliance with Federal and State EEO laws, qualified applicants are considered for all positions without regard to race, color, gender, religion, national origin, ancestry, place of birth, age, marital status, sexual orientation, disability, or veteran status.
Agilysys Inc.
0
Five Star prohibits discrimination against any employee or applicant for employment with regard to race, color, religion, sex, sexual orientation, gender identity or expression, national origin, age, marital status, genetic information, disability, or veteran status.
Five Star
0
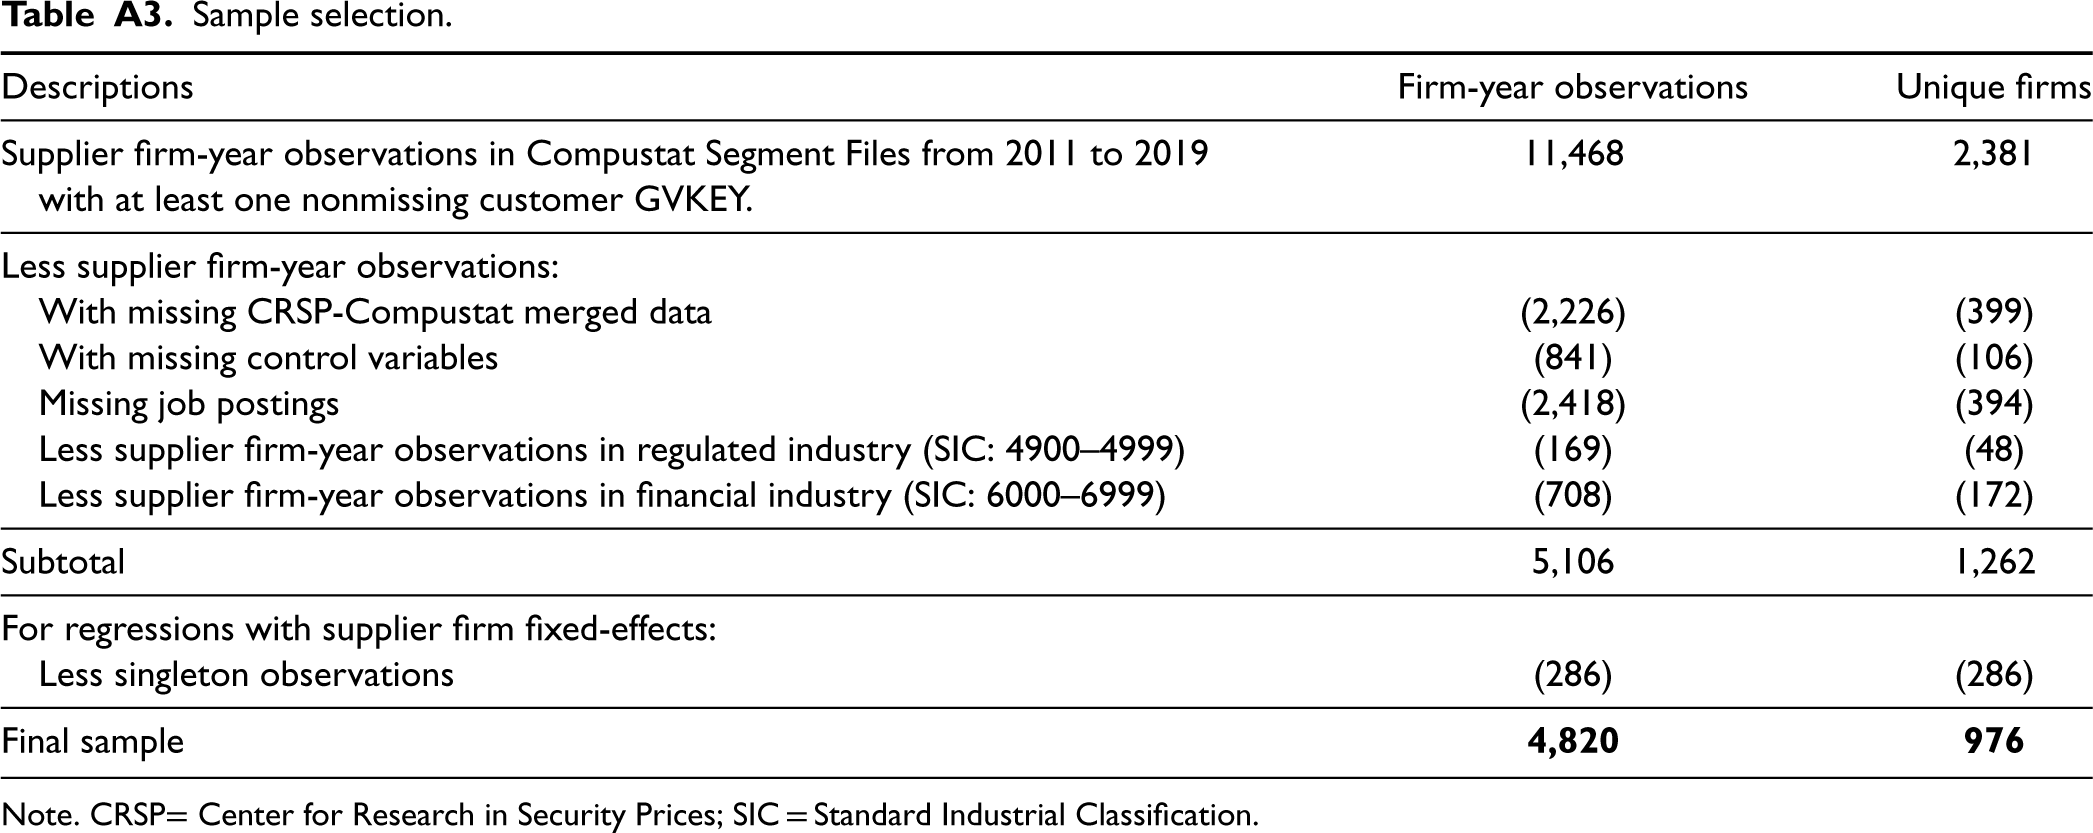
Descriptions
Firm-year observations
Unique firms
Supplier firm-year observations in Compustat Segment Files from 2011 to 2019 with at least one nonmissing customer GVKEY.
11,468
2,381
Less supplier firm-year observations:
With missing CRSP-Compustat merged data
(2,226)
(399)
With missing control variables
(841)
(106)
Missing job postings
(2,418)
(394)
Less supplier firm-year observations in regulated industry (SIC: 4900–4999)
(169)
(48)
Less supplier firm-year observations in financial industry (SIC: 6000–6999)
(708)
(172)
Subtotal
5,106
1,262
For regressions with supplier firm fixed-effects:
Less singleton observations
(286)
(286)
Final sample
Declaration of Conflicting Interests
The authors declared no potential conflicts of interest with respect to the research, authorship, and/or publication of this article.
Funding
The authors disclosed receipt of the following financial support for the research, authorship, and/or publication of this article: Ling Cen acknowledges the funding support from GRF 14506522 offered by the Hong Kong Research Grants Council. Jing Wu acknowledges the funding support from GRF 14505320 offered by the Hong Kong Research Grants Council.
Notes
How to cite this article
Cen L, Han Y and Wu J (2025) Equal Employment Opportunity in Supply Chains. Production and Operations Management 34(3): 524–540.
References
Supplementary Material
Please find the following supplemental material available below.
For Open Access articles published under a Creative Commons License, all supplemental material carries the same license as the article it is associated with.
For non-Open Access articles published, all supplemental material carries a non-exclusive license, and permission requests for re-use of supplemental material or any part of supplemental material shall be sent directly to the copyright owner as specified in the copyright notice associated with the article.