
Abstract
In theory, discretionary pricing enhances company performance by enabling managers to incorporate local information. However, in practice, managers may be prone to behavioral biases that can lead to suboptimal decisions. This paper investigates the effectiveness of discretionary pricing and behavioral elements on pricing decisions via field and lab experiments. Collaborating with a pharmacy chain retailer, we first analyzed a field experiment that delegated pricing authority to store managers. We find that managers began engaging in discretionary pricing after two months of experiment implementation and tended to raise the prices of high-priced drugs, resulting in significant sales and revenue losses. This effect was particularly prominent among less-experienced managers and in low-competition stores. We further designed a set of lab experiments to generalize our field observations and explore possible behavioral drivers. We requested lab participants to make pricing decisions under different information display scenarios and compared the average price adjustments between the direct display and click-to-view designs. We observe that participants also tended to raise product prices, and the magnitude of elevation was higher in the click-to-view group where the demand function information is less salient and accessible. Follow-up lab experiments support our field observations, suggesting that experience through repeated decisions and real-time feedback could alleviate the bias effect. Additionally, participants focused on high-priced products when given a list of items for discretionary pricing. Our results highlight the need to consider behavioral biases in human–algorithm collaborations and provide practical insights for improving information provision and training in discretionary settings.
Introduction
Discretionary policies provide decision-makers with the flexibility to incorporate their own knowledge into the decision-making process. They are widely applied to various business settings, including retail store managers’ ordering decisions (van Donselaar et al., 2010), bank branch managers’ capacity planning decisions (Campbell and Frei, 2011), local lenders’ pricing decisions (Phillips et al., 2015), and local merchants’ stock-keeping units (SKUs) removal decisions (Kesavan and Kushwaha, 2020). Among the various business decisions, firms often delegate certain pricing responsibilities to their salespeople (Hansen et al., 2008). Compared to centralized pricing, discretionary pricing enables individuals to make pricing decisions based on their judgment of the local market conditions. In theory, price delegation can improve firm performance, especially in markets with large heterogeneity. Weinberg (1975) shows that under the optimal commission plan, discretionary pricing maximizes the profits of both the firm and the salespeople. Lal (1986) demonstrates that when the salespeople have superior information about the market environment, the delegation of pricing decisions can generate higher profits for the firm. Bhardwaj (2001) finds that the competition level affects the price-delegation decisions. Specifically, under intense price competition, it is optimal for firms to delegate pricing decisions to salespeople. Intuitively, decentralized decision-makers, such as salespeople or store managers, possess superior information compared to centralized decision-makers (Van Boven et al., 2000). They are better aware of the local market dynamics and can potentially take local knowledge into account in pricing decisions. Therefore, granting discretionary pricing power to decision-makers can improve firm performance.
Despite a consistent conclusion from theory papers showing that discretionary pricing is beneficial to firms, empirical literature demonstrates a mixed conclusion about the effectiveness of discretionary pricing (Stephenson et al., 1979; Phillips et al., 2015). In practice, managers may deviate from the optimal decisions due to behavioral biases. Such deviations have been documented by previous studies in various business settings (e.g., Su, 2008; Chen et al., 2015; Tong et al., 2018; Caro and de Tejada Cuenca, 2023).
In this paper, we analyzed a field experiment to demonstrate the overall effectiveness of discretionary pricing for over-the-counter (OTC) drugs in a retail pharmacy setting. 1 Based on these field observations, we conducted follow-up lab experiments to study behavioral mechanisms and explore solutions that allow firms to leverage the benefit of flexible discretionary pricing while alleviating the impact of human biases. Specifically, we answer the following research questions: (a) How do managers make pricing decisions under discretionary pricing? What is the overall effectiveness of discretionary pricing on sales performance? (b) What are the behavioral mechanisms behind managers’ pricing decisions? (c) Is there any moderator that can alleviate the bias effect?
We first exploited the pricing experiment implemented by our collaborating firm. The company priced its products in a centralized and uniform manner. Its headquarters determines prices uniformly for all pharmacies, with limited store-specific promotions. As competition intensified, our collaborator experimented with a discretionary pricing policy aimed at staying competitive in the market while maintaining a healthy margin. The experiment selected a list of 48 OTC drugs under different therapeutic classes and allowed managers to set prices for those drugs within allowable price ranges. We analyzed eight months of daily store sales and price data in 2018 from our collaborator for all OTC drugs from the experiment stores, covering four months before and after the experiment’s implementation. We conducted matching to construct comparable treatment and control drug groups and applied the difference-in-differences (DiD) method to evaluate the effectiveness of discretionary pricing on pricing decisions and sales performances.
We observe a gradual shift in manager behavior toward price adjustments under discretionary pricing. Specifically, managers only began to actively engage in pricing decisions after two months of experiment implementation. Focusing on the third and fourth months in the post-experiment period, we find that managers significantly adjusted prices for high-priced products. On average, managers increased prices by 5.7%, and consequently, sales declined by 7.5%. Unfortunately, the combined total revenue significantly drops under discretionary pricing. Furthermore, we observe that managers adopted different pricing decisions depending on the store’s nearby competition levels. Managers of stores with low competition (i.e., fewer nearby stores) tended to increase drug prices more aggressively, resulting in significant sales and revenue losses. On the contrary, we find no significant price and sales performance changes in stores with high competition (i.e., more nearby stores). The impact of discretionary pricing is also heterogeneous across stores with distinct manager experience levels. Granting pricing power to experienced managers did not result in significant sales or revenue losses, whereas it did for inexperienced ones, suggesting that experience levels mitigate behavioral biases in discretionary decisions.
Motivated by the field observations, we conducted a series of lab experiments to generalize the findings and explore potential explanatory mechanisms. We recruited participants from the Prolific platform and requested them to act as store managers and make pricing decisions to maximize total revenue under different information scenarios. While we do not intend to rule out other mechanisms and solely attribute the field observations to one particular factor, we investigated salience bias as a possible behavioral driver. Salience bias suggests that decision-makers tend to focus on salient information but overlook other implicit information that could be more relevant to the goal (Weinberg, 1975; Tversky and Kahneman, 1973; Taylor and Thompson, 1982). Compared to price, which is readily observable and a more salient contributor to revenue and profitability, demand—as a function of price—is less transparent and requires more cognitive processing to retrieve and estimate. Influenced by salience bias, decision-makers might focus more on the revenue contribution coming directly from adjusting prices while underestimating the impact through demand.
In the first lab experiment, we varied the relative salience level of price and demand information by manipulating the design of information display. Specifically, we considered two designs: direct display and click-to-view. The direct display group allows participants to access all relevant price and demand information without further actions, while the click-to-view group requires participants to click buttons to gain access to nearby competition and demand sensitivity levels, which could help them estimate the nuanced demand function. Consistent with our field results, we observed in the lab that participants tended to increase product prices to pursue higher revenues. In particular, compared to the click-to-view group, participants in the direct display group chose to elevate prices to a significantly smaller scale, suggesting that increasing the accessibility of demand-relevant information could alleviate the salience bias and reduce the upward pricing trend. We also noticed that the effect of salience bias on pricing decisions was larger when the nearby competition level was the contracted information. To validate our field results regarding differential pricing based on manager experience, we conducted a second lab experiment with a repeated pricing design to confirm that experience, through feedback and learning, could alleviate the upward pricing bias and promote more rational decisions. Lastly, we introduced the third lab experiment to demonstrate that when presented with a list of candidate products for potential price adjustments, participants were inclined to prioritize those high-priced products.
In sum, our findings from the field and the lab experiments are highly consistent and corroborate each other. Unlike many other studies that report and analyze successful field implementations, our paper analyzed an intervention that is not considered a success in conventional terms. However, it provides valuable learning opportunities for research and practice communities alike. Specifically, our field experiment demonstrates that behavioral biases can be a threat to successfully implementing discretionary decision-making in practice. Firms should thus be cognizant of potential human errors when implementing discretionary decision-making. Our lab experiments further confirm that these findings are not specific to the company that we collaborated with or the setting we analyzed—they are generalizable to generic discretionary pricing settings. Through these experiments, we identify that (a) salience bias is one of the behavioral factors contributing to the upward pricing trend under discretionary pricing, and (b) increasing the accessibility to the demand function information and highlighting its impact on revenue can mitigate the upward pricing trend. In practice, firms should consider providing interpretable demand-relevant attributes in the decision support systems and offering relevant training to help managers better understand the concept of demand sensitivity. These solutions can enable firms to better leverage discretionary pricing systems while mitigating the impact of behavioral biases.
Literature Review
There is a growing stream of literature that studied human–algorithm interaction, with an emerging research theme on human deviations from algorithmic optimality (Roels and Staats, 2021). Existing papers have examined the impact of human overrides on operational algorithms in various decision-making settings (e.g., van Donselaar et al., 2010; Ibanez et al., 2018; Kawaguchi, 2021; Sun et al., 2022). In particular, the literature has identified scenarios where human overrides could and could not help improve performance. For example, Kesavan and Kushwaha (2020) show that manager overrides improved profits for growth-stage products, despite an overall profit decline from the override behavior. Khosrowabadi et al. (2022) demonstrate that although human overrides did not improve average forecast performance, overrides could improve forecast accuracy for non-fresh and high-priced products. The concern regarding the effect of human overrides is rooted in behavioral biases. Behavioral literature has identified several common biases that can lead people to make suboptimal decisions, including anchoring, bounded rationality, representativeness, and mental sampling with recency (Su, 2008; Chen et al., 2015; Tong et al., 2018). A recent paper by Caro and de Tejada Cuenca (2023) closely relates to our work and studies algorithm reliance for clearance markdown decisions. They find that managers’ overrides on pricing decisions are affected by the salience level of inventory run-out time. In this paper, we also examine managers’ override behavior and study how the salience level of demand sensitivity information affects pricing decisions. We contribute to this stream of work by assessing the impact of human biases through field observations and exploring salience bias as one explanatory mechanism in the lab studies.
Operations researchers have identified several vital factors that can affect decision-making and operational performances, including information availability, employee experience, and workload (KC and Staats, 2012; Buell et al., 2017; Schmidt and Buell, 2017; Tan and Netessine, 2014; Xu et al., 2022). Among the various factors, the value of information has been widely recognized. Croson and Donohue (2006) find that the availability of inventory information helps alleviate the bullwhip effect. Kesavan and Kushwaha (2020) demonstrate that under a discretionary SKU removal decision setting, profitability increases for growth-stage products when more historical data information becomes available. Tiefenbeck et al. (2018) show that real-time feedback can help individuals overcome salience bias and act more in line with their preferences. Our study also investigates approaches to alleviate salience bias within the discretionary decision context. In the lab, we manipulated the display of information offerings to investigate the impact of salience bias on pricing decisions as well as its differential effects across competition and demand sensitivity attributes. Our findings offer insights for pricing practitioners regarding the importance of information availability and the type of information to be presented.
This paper is also relevant to retail operations and links to the discretionary pricing literature. Most theory papers in this domain assume perfect rationality among decision-makers and demonstrate the value of local information as an advantage under incentive-aligned contracts (Weinberg, 1975; Lal, 1986; Bhardwaj, 2001). The empirical research in discretionary pricing finds mixed evidence on the impact of discretionary pricing on retail performance (Stephenson et al., 1979; Frenzen et al., 2010; Phillips et al., 2015; Lim and Ham, 2014). We contribute to the retail operations literature by examining the effectiveness of discretionary pricing. We complement field observations with corroborating lab experiments to generalize the field observations and offer solutions to mitigate human biases when utilizing the discretionary pricing scheme.
Field Experiment Design
In this section, we begin by providing specific information about the experimental setup and outlining the characteristics of the data. Next, we explain our methodology for creating treatment and control groups to address endogeneity concerns and potential spillover effects from drug substitution. Finally, we introduce our empirical specification to investigate the impact of the experiment.
Experiment Background and Field Setting
We collaborate with a leading pharmacy retail chain in China to examine the effectiveness of discretionary pricing in a real-world setting. This pharmacy chain operates thousands of brick-and-mortar pharmacies serving millions of customers, and it has positioned itself as a low-price retailer with a mission to increase medication accessibility. The company adopted a centralized pricing strategy where a dedicated team at headquarters applied quantitative revenue management tools to determine the retail price of products based on historical sales data. Facing growing competition from the increasingly segmented and localized OTC drug market in China, the company was motivated to reassess its current centralized pricing strategy for OTC drugs and explored an alternative discretionary pricing strategy by delegating pricing power to local pharmacy managers. This move aimed to help the company stay competitive without hurting its profit margin (National Medical Products Administration of China, 2020).
The centralized pricing strategy allowed the retail chain to adopt a standardized pricing practice, with headquarters coordinating and controlling prices across stores. However, this approach limits the flexibility of individual stores to react to local market signals. To better respond to the local dynamics, the company considered switching to discretionary pricing, which would allow store managers to have more pricing power. Brick-and-mortar store managers have advantages in gathering local information. Through direct consumer contact and in-store sales management, they can gain a better understanding of patients’ medical needs, as well as infer nearby competition levels and consumers’ sensitivity to price changes. Importantly, store managers’ incentives are aligned with the company’s, as part of their compensation is a commission proportional to the store’s revenue. The discretionary pricing strategy should, therefore, motivate store managers to leverage their local information advantage to improve the company’s overall performance.
The pharmacy chain conducted a field experiment in a metropolitan area in China from 1 September 2018 to 31 December 2018, to evaluate the potential value of discretionary pricing. For the experiment, the company selected 10 participating stores that are distant from each other to avoid spillover effects. The company provided the managers of participating stores with a list of 48 OTC drugs and their ranges of allowable prices that included the minimum and the maximum price limits. The drug selection was primarily based on historical sales and profit margins. Top-selling drugs were excluded from the experiment to avoid significant impacts on the company’s sales and revenue. Drugs with poor sales were also excluded due to potentially low statistical power. In addition to sales levels, the selected drugs had relatively higher profit margins to provide managers with sufficient price adjustment room and minimize the risk of incurring a loss if managers choose to decrease the drug prices. The treatment drug group was randomly selected from drugs with mid-range sales and higher margins across all major therapeutic classes.
The treatment drugs selected for the field experiment cover a range of major therapeutic classes, including skin diseases, colds, fevers, health supplements, etc. These drugs account for 10.26% of total sales and 18.05% of total revenue from all OTC drugs during the pre-experiment period. Although the treated drugs are representative in terms of medical use and sales volume, a direct comparison between treated drugs and other untreated drugs may be biased because their sales trends could differ. Additionally, price changes in treated drugs may have spillover effects on other drugs intended for similar uses. Therefore, to ensure a fair comparison and accurate estimation of the experiment outcomes, we selected a group of matching control drugs. These control drugs share similar characteristics to the treatment drugs and, at the same time, are not direct substitutes for treatment drugs. We describe the matching procedure in detail in Section 3.3.
Data
To investigate how store managers reacted to the new discretionary pricing strategy and the impact of this pricing experiment on store sales and revenue, we collected the daily sales and price data of all drugs sold at 10 experiment stores from our collaborating pharmacy chain. 2 We also obtained drug level daily inventory data at each store to create out-of-stock indicators. 3
We further collected drug characteristics data from the pharmacy chain. Each drug SKU is a unique combination of drug name, dosage, dosage form, and manufacturer. For example, a drug SKU could correspond to a 30-tablet box of 20 mg Zocor from Teva Pharmaceuticals. The data sample includes drugs from 29 general drug therapeutic classes coded by three-digit IDs. The three-digit therapeutic classes can be further separated into more granular therapeutic classes coded by seven-digit IDs. On average, each three-digit therapeutic class contains six granular seven-digit classes, and a seven-digit therapeutic class contains an average of 32 drug products. In addition to the therapeutic classes that indicate the drug’s medical use and substitutability across drug products, we also retrieved other drug characteristics data, including the medical condition (chronic vs. acute disease), the manufacturer origin (import vs. domestic), the drug seasonality (season-specific indicators), and the commission level (high vs. low).
Besides drug characteristics, we gathered information on various store characteristics from the pharmacy chain, such as store size, age, geographic location, and manager’s employee tenure. We separately crawled the geographic location of competitor pharmacies through Baidu Map API v3.0 (http://api.map.baidu.com) to capture the level of competition at each store.
Summary statistics for before and after matching.
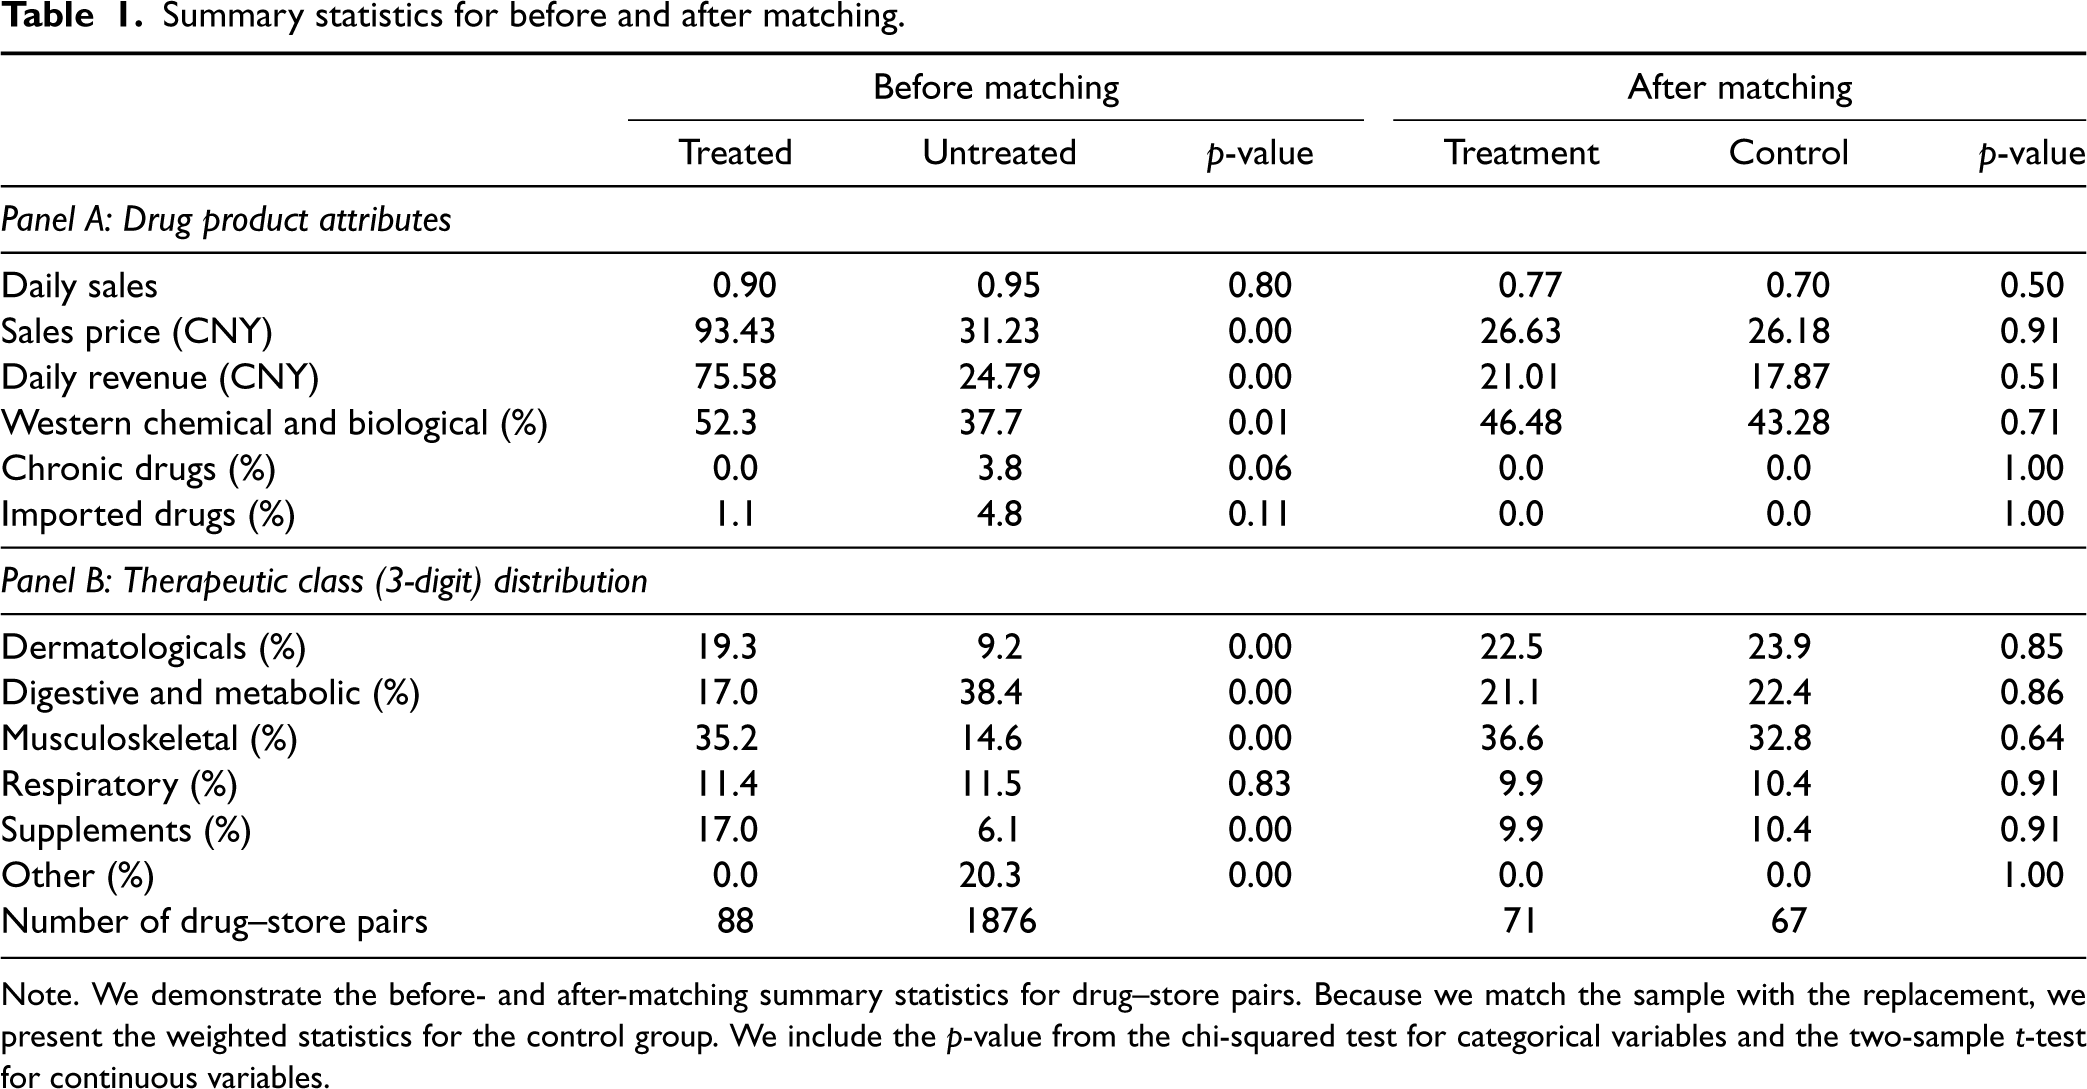
Summary statistics for before and after matching.
Note. We demonstrate the before- and after-matching summary statistics for drug–store pairs. Because we match the sample with the replacement, we present the weighted statistics for the control group. We include the
To examine the pricing decisions under discretionary pricing strategy and its impact on sales, we construct two comparable groups of drug SKU–store pairs by matching drug and store characteristics (drug–store pairs hereafter). The treatment group comprises drug–store pairs where managers could determine the drug price with discretion in the experiment, and the control group is made up of drug–store pairs where the pharmacy headquarters centrally determined the drug price. In this section, we present our matching procedure, summarize the matched sample, and assess the matching balance.
The first set of matching variables is drug attributes. Specifically, we require the matched drug–store pairs to have the same drug attributes, including the general three-digit therapeutic class, medical condition, manufacturer origin, and drug seasonality. In addition, we account for each drug SKU’s commission level in the matching process because managers may adjust prices differently based on the commission level.
Besides drug attributes, we also consider store features in the matching process. However, we find that comparable control stores with similar size, age, and local income levels are usually located close to treatment stores as well (with a minimum of 200 m). It brings challenges to our matching procedure because the new discretionary pricing scheme may have spillover effects on those nearby control stores, thus biasing the estimation. Therefore, we focus on the drug characteristics and identify comparable control drug products sold at the same store. Matching within stores can still introduce biases due to across-product substitutions. For example, suppose a pharmacy store offers two substitutable drugs to customers, with one drug in the treatment group and the other in the control group. If sales of the treatment drug decline after the pricing policy switch, the sales of the substitute in the control group will likely increase. This substitution effect can result in an overestimation of the treatment effect. Therefore, although we match control drugs under the same general three-digit therapeutic class (e.g., cardiovascular system drugs) with treatment drugs to ensure their comparability, we require the matched drugs to be from different seven-digit therapeutic classes (e.g., prostaglandins vs. proton pump inhibitors).
For each treated drug–store pair, we conduct the nearest neighbor matching with replacement to identify the matched control drug–store pair. Two matched drugs should be sold in the same store and share the same drug attributes (i.e., the same three-digit drug therapeutic class, medical condition, manufacturer origin, seasonality, and commission level). Specifically, we calculate the Mahalanobis distance for all drug–store pairs based on their average daily sales, price, and revenue during the pre-experiment period and find matches for the treated drug–store pairs with the smallest Mahalanobis distance. The nearest neighbor matching can result in poorly matched results when it fails to find sufficiently similar controls for a treatment unit. Thus, we exclude matched pairs with Mahalanobis distance
In the final sample, we match 71 treated drug–store pairs with 67 control drug–store pairs, with a total of 33,810 observations of daily sales performance from 1 May 2018 to 31 December 2018. The summary statistics of our matched sample are shown in Table 1. The results from the chi-squared test and the two-sided
To ensure the robustness of our matching method, we adopt two alternative matching methods, the
Empirical Specification
Based on the matched sample, we compare the outcomes of drug–store pairs under discretionary pricing and drug–store pairs under centralized pricing in the post-experiment period. We propose the following DiD model to estimate the effect of discretionary pricing on price adjustment, sales, and revenue:

The coefficient
Other than the overall treatment effect, to further investigate the potential differential effects of the discretionary pricing scheme across different drug features, we incorporate a three-way interaction term to examine whether the treatment effect characterized by 
In this section, we analyze the impact of the field experiment. We start by testing how managers adjust prices under discretionary pricing and presenting the changes in performance outcomes. We then investigate how the effect of discretionary pricing varies with the degree of local competition and the experience level of managers.
Manager’s Pricing Decisions Under Discretionary Pricing
We first examine how managers adjust drug prices under discretionary pricing using the DiD model and theorize the effect of behavioral biases on pricing decisions. The DiD approach requires a parallel trend between the treatment and control groups; in particular, the variables of interest for the treated and control drug products should follow the same trend in the absence of the treatment. We thus investigate the time-series pattern in the drug prices of our matched samples. Figure 1 shows the trends in the average daily prices for drugs in the treatment and control groups and visually confirms the validity of the parallel trend assumption. We also perform a formal parallel trend test in Appendix EC.2.1 to provide statistical evidence that supports the parallel trend assumption for price and sales performance metrics at the drug–store level.
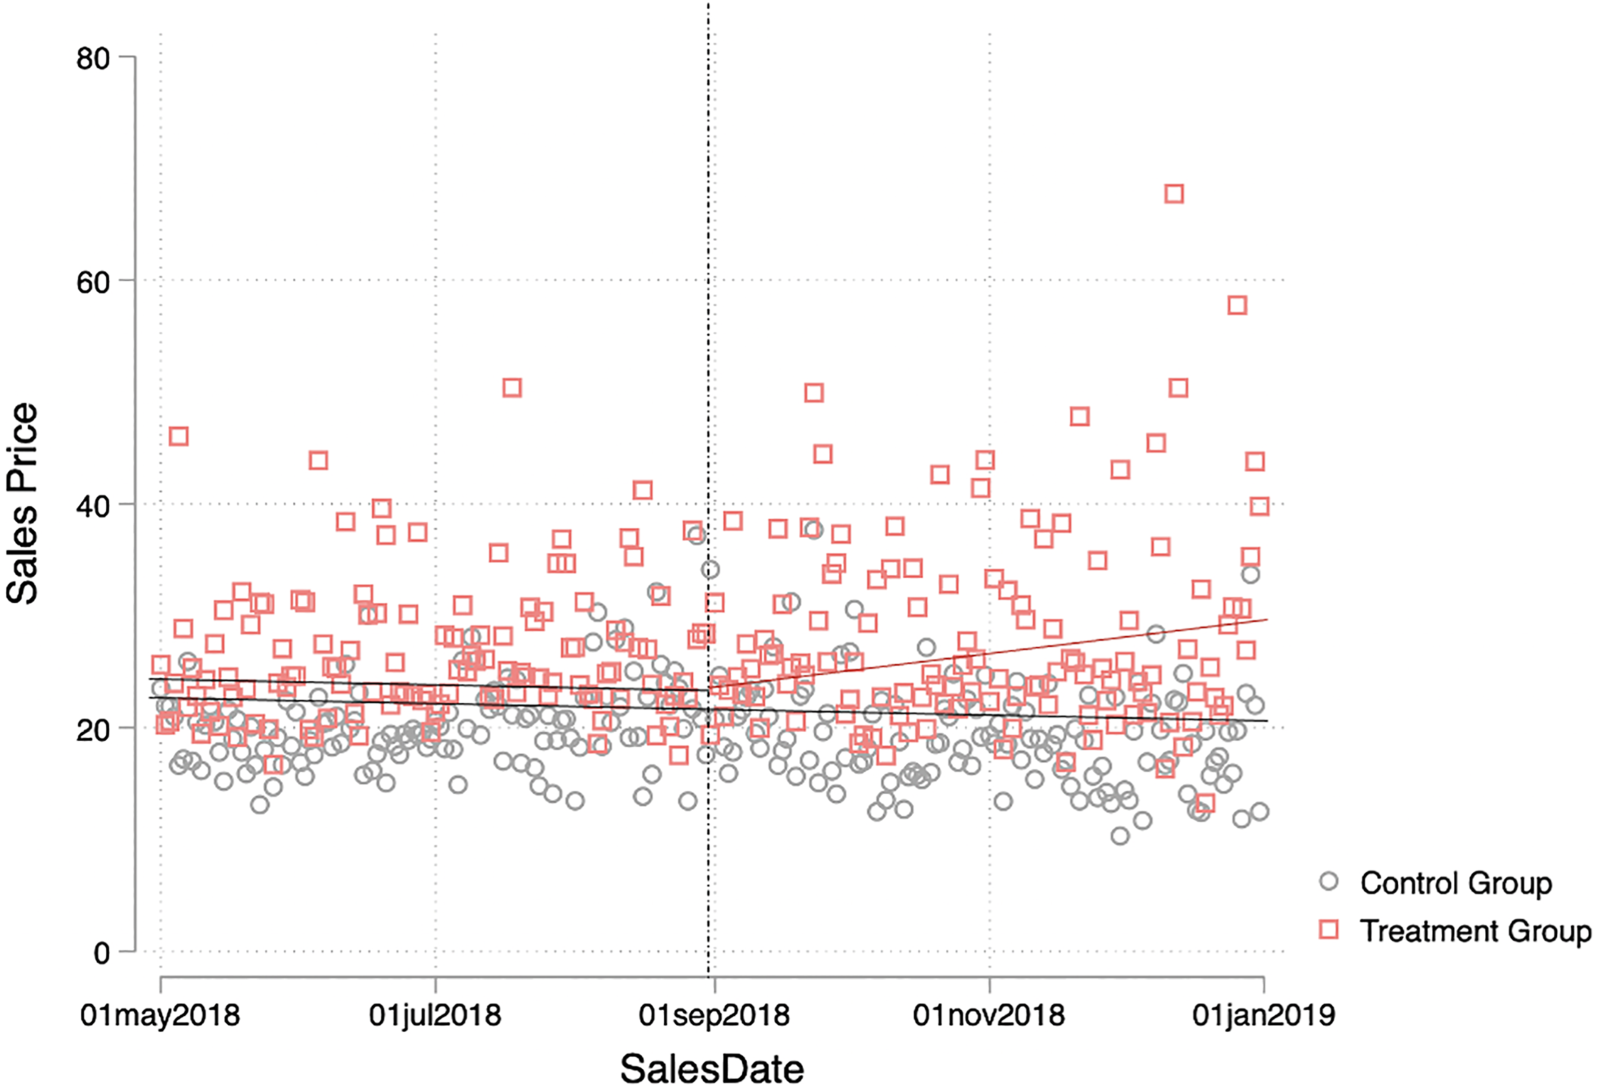
Parallel trends in average drug prices: May 2018 to December 2018.
Before the launch of the discretionary pricing experiment, the average sales prices for two drug groups follow a similar downward trend. Notably, the trend line of the average price of the control group demonstrates a consistent downward progression throughout our study window. Two potential reasons may explain the overall decreasing trend in the average price. First, pharmacy chains may decrease the overall OTC drug prices to secure the market share under increasingly intense competition in the retail pharmacy industry. In addition, the post-experiment period covers the year-end promotion period from September to December 2018. The year-end promotion events could have further contributed to the decreasing average drug prices.
After the implementation of the experiment on 1 September 2018, we found divergences between two price series of treatment and control groups. In particular, the average price of treatment drugs increases in the post-experiment period, and the divergence becomes more noticeable over time.
Table 2 reports our estimation results on pricing decisions from the DiD model. We separate the post-experiment period into two parts, September to October and November to December, to reflect the gradual price divergence trend between treatment and control groups following the observation in Figure 1. We present the effect of the discretionary pricing experiment on the pricing decisions for the two time periods in columns (1) and (2) and columns (3) and (4), respectively. In columns (1) and (3), we show that managers do not significantly change prices on average when controlling for the drug–store fixed effects and time effects. However, we demonstrate in column (4) that the sales prices for those high-priced drugs increase significantly relative to low-price drugs from November to December. The shift from September and October to November and December suggests that managers progressively began adjusting prices. Several behavioral factors could contribute to this shift in manager pricing practice. For example, managers might exercise caution during the initial months, opting to test small price adjustments before making significant changes. In addition, the learning curve might demand managers’ time and effort to grasp the new discretionary pricing scheme and become familiar with the price adjustment process (Argote, 1999; Lapré and Tsikriktsis, 2006). Last, the delay in price change behavior could result from adherence to existing pricing methods. Managers can suffer from psychological resistance to changes and choose to stick with the original centralized pricing practice rather than actively engaging in discretionary pricing at the beginning of the experiment (Allon et al., 2023; Ford et al., 2008).
Effect of the pricing scheme change on the sales price.
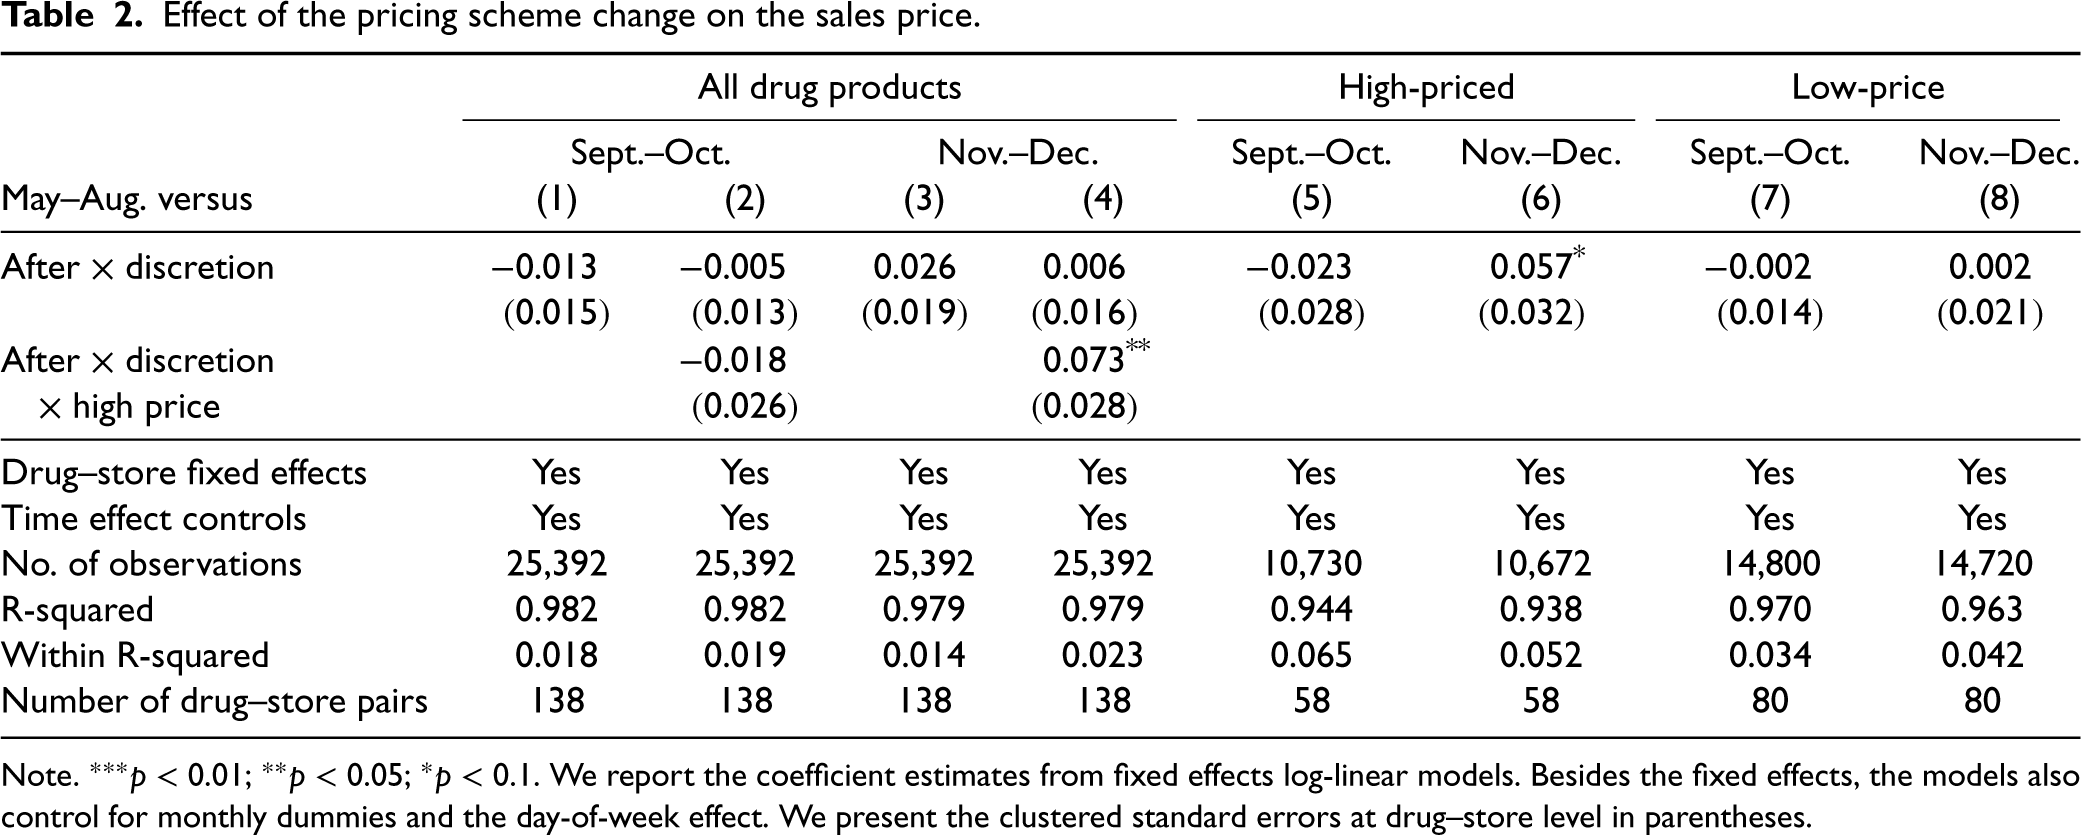
Note.
Compared to the prices in the pre-treatment period, the coefficient estimate for the interaction term of discretion treatment and high-priced indicator suggests that the price increase for high-priced drugs is 7.3% higher than the price increase for low-price drugs. We further conduct subsample analyses for high-priced drugs and low-price drugs and present the estimation results in columns (5) and (6) and columns (7) and (8) of Table 2, respectively. The insignificant estimates in columns (5) and (7) suggest that there are no significant price changes in either drug group from September to October. For the later November and December period, we observe in column (6) that managers significantly increase prices by 5.7% for high-priced drugs. In contrast, the result in column (8) indicates that managers do not significantly adjust the prices of low-price drugs. Besides insignificant price adjustment, the point estimate is mild too.
We discuss two potential reasons that can lead managers to be more engaged with price adjustments for high-priced drugs than low-price drugs. First, since managers are provided with a list of products for potential price adjustments, they may be reluctant to put in the effort to consider low-priced drugs with smaller sales potential, resulting in active price changes primarily for high-priced drugs. Second, the in-store promotions at our collaborating pharmacy chain are mostly presented as percentage reductions of the list prices. Managers are thus more used to perceiving price changes in the percentage scale. Since managers are typically averse to substantial percentage changes, they may view high-priced drugs as having a greater potential for revenue gains.
We next demonstrate the overall effect of discretionary pricing on two performance metrics, viz., sales volume and revenue. As we intend to study the impact of significant price increases on sales performance, we focus on the performance comparison between the pre-experiment period and the later two months in the post-experiment period, that is, November and December. 6
We present the estimation results of the sales performance panel in Table 3. The triple difference estimates and the subsample estimation results demonstrate that only high-priced drugs experience significant sales performance changes. Specifically, for those high-priced drugs, we find that the sales volume and the revenue decline by 7.5% and 28.7% in columns (5) and (6), respectively. 7 The resulting declined sales volume with price increases suggests that customer demand for OTC drugs is sensitive to price changes. The sensitivity may stem from the OTC drugs’ non-emergent medical uses and the multiple purchasing options that offer alternatives to customers when facing price increases. Overall, we find in the field that discretionary pricing leads to undesired sales performance, specifically, among high-priced drugs.
Effect of the pricing scheme change on the sales performance.
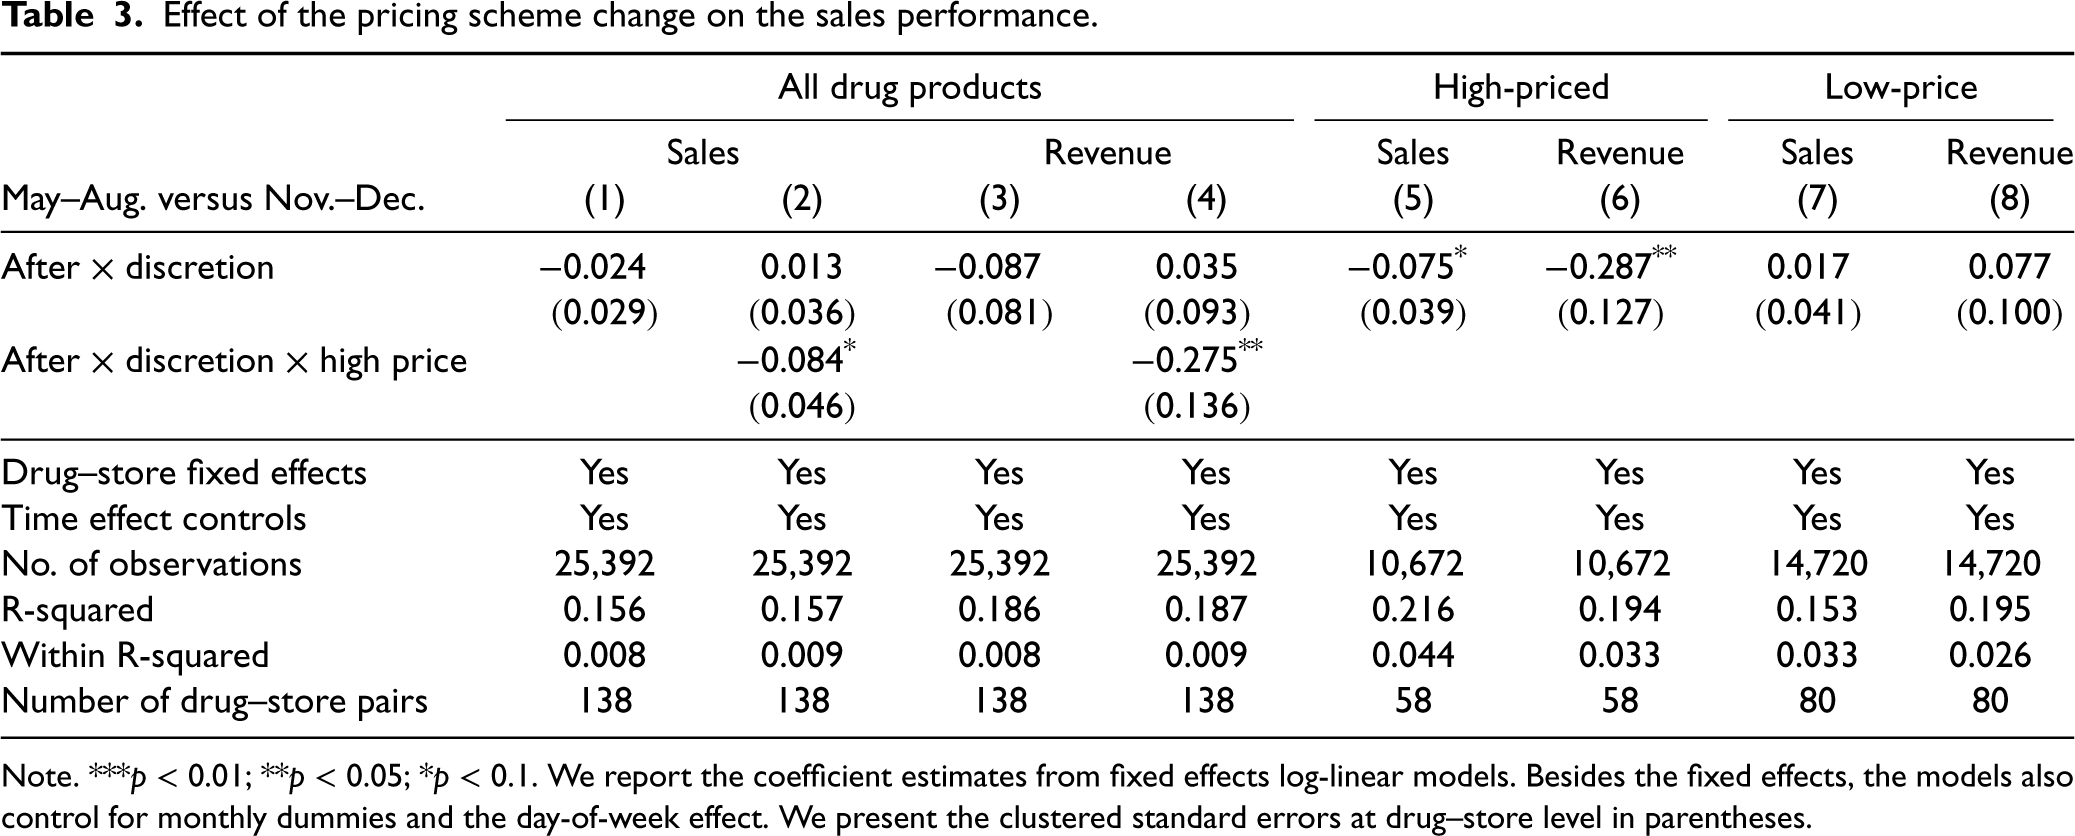
Effect of the pricing scheme change on the sales performance.
Note. ***
We now examine the differential effects of discretionary pricing across stores with varying competition levels. Pharmacy retail chains in China rely on brick-and-mortar stores to generate most of the industry’s revenue. Customers usually live near those brick-and-mortar stores and consider convenience as the primary factor that drives their purchasing decisions of OTC drugs (Thomas and Noyce, 1996). The convenience factor limits residents’ purchasing options to nearby pharmacy stores, resulting in localized competition and a geographically segmented OTC drug market.
In such a segmented market, the intensity of local competition is one critical factor that can affect a drug product’s demand. Correspondingly, consumer demand can vary significantly across pharmacy stores with varying competition levels. For example, for pharmacies with high competition, their product demand is likely more sensitive to price changes because customers have more purchasing alternatives. Compared to headquarters, managers have better insights into the local competition level, owing to their familiarity with the neighborhood and nearby competing pharmacy stores. Hence, managers could be aware of the local demand pattern and can price accordingly based on the competition intensity.
Based on the discussion with our collaborator, we identified one competing pharmacy chain as the company’s major competitor in the focal metropolitan area. The competing pharmacy chain is headquartered in the same city and has a similar market share to our collaborator. Meanwhile, store managers could consider nearby pharmacies that also belong to our collaborating pharmacy chain as potential competitors since each store is operated independently. When constructing the local competition intensity measure, we thus take into account neighboring pharmacy stores of our competitors as well as other stores of our collaborator. Specifically, we capture the competition level using the count of competing stores within a radius of 1 km. Our findings are robust if we ignore stores belonging to our collaborator or change the distance threshold to 2 km. To balance the drug–store pairs in both high- and low-competition groups, we categorize stores with over 10 competing stores in the vicinity as high-competition stores and those with no more than 10 nearby competitors as low-competition stores.
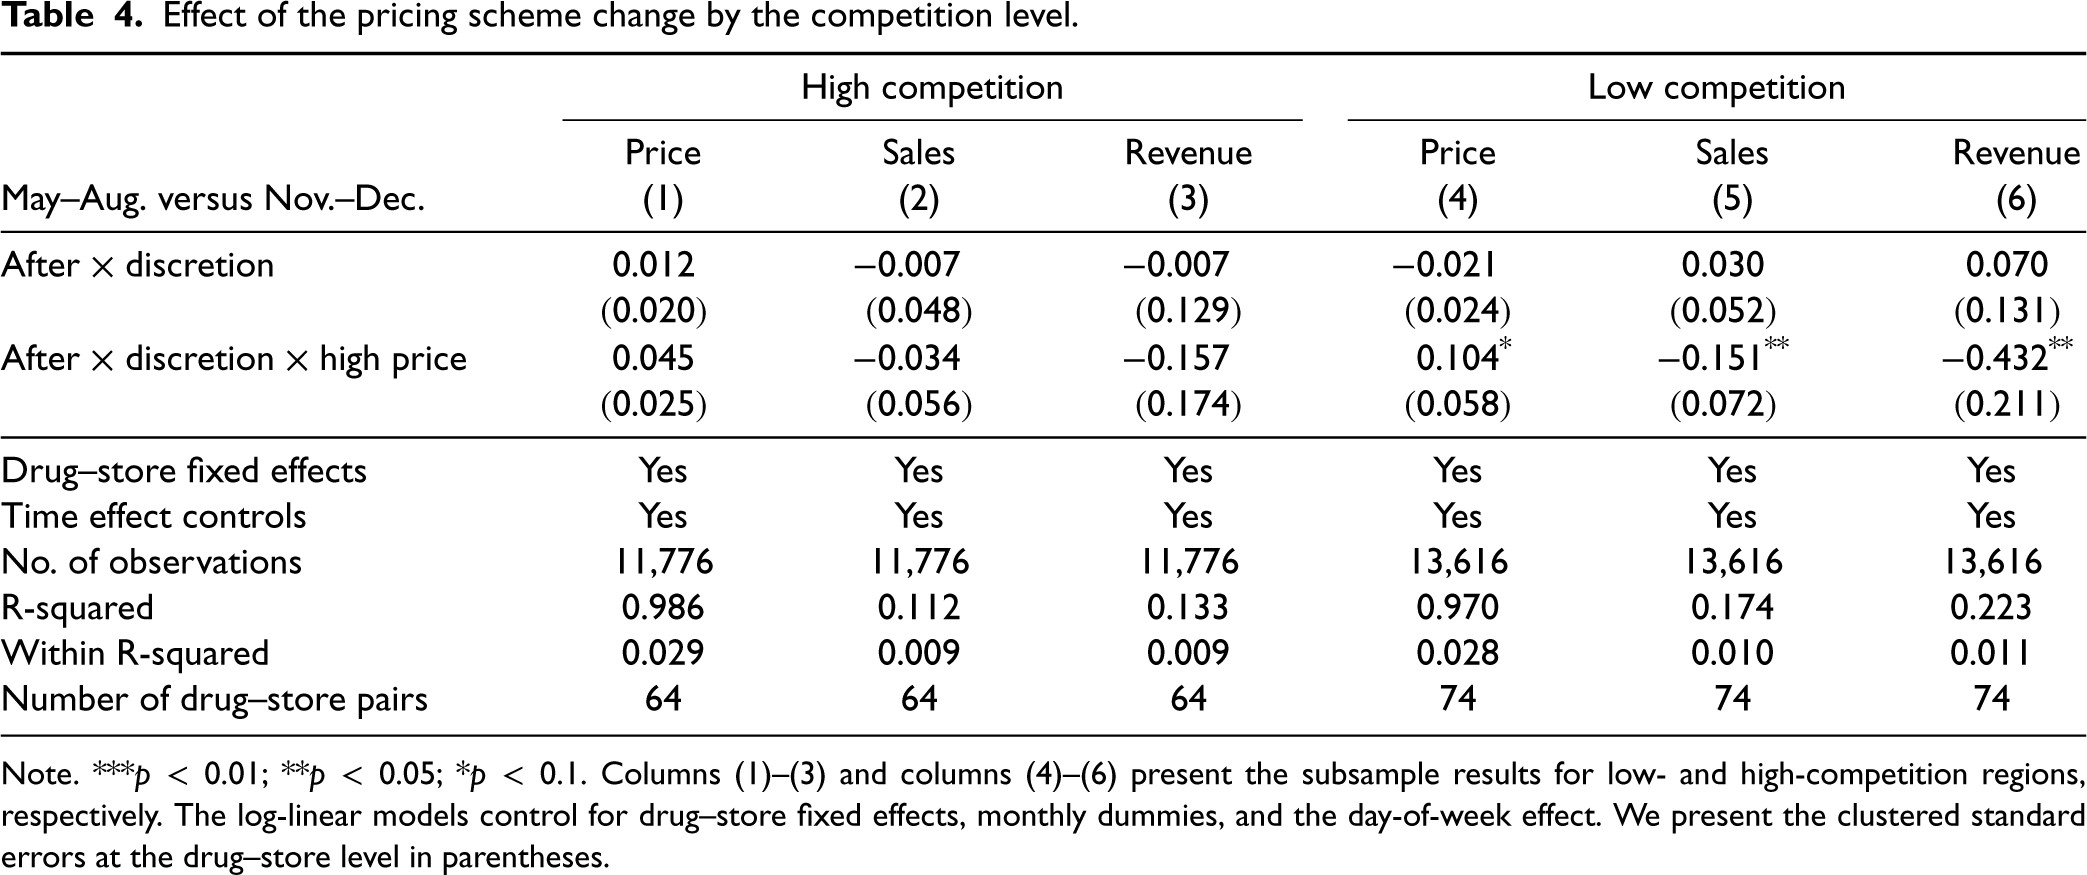
Table 4 presents the estimation results from the subsample analysis. Column (1) shows no significant price changes in high-competition stores. On the contrary, managers of low-competition stores make significant price adjustments for the high-priced drug group. As shown in column (4), while there is an insignificant average price change for low-priced drugs under discretionary pricing, the price adjustment for high-priced drugs is 10.4% higher than that of low-priced drugs. Besides the significance level, the magnitude of price changes in high-competition stores is also smaller. Correspondingly, we observe no significant changes in the sales volume and revenue at high-competition stores in columns (2) and (3) of Table 4. However, for stores facing lower competition, the OTC drug demand seems quite elastic following the price increases. Specifically, we demonstrate in columns (5) and (6) that the sales volume decreases by 15.1% more for high-priced drugs. The revenue decline is also notably higher at 43.2% for high-priced drugs compared to low-priced drugs. Although there are fewer competitors in the neighborhood of low-competition stores, consumers still have several alternatives for OTC drugs, including purchasing at farther pharmacies or online pharmacies and slightly delaying the treatment for non-emergent medical needs.
Effect of the pricing scheme change by the competition level.
Effect of the pricing scheme change by the competition level.
Note. ***
Our results suggest that managers understand the demand–price dynamics under different competition levels and could account for the local competition intensity when making pricing decisions. However, managers inaccurately estimated the sensitivity and increased prices aggressively, offsetting the potential information advantage and leading to undesired performances.
Enhancing managers’ knowledge of the demand function can potentially help alleviate the bias effect in pricing decisions. One channel to gain knowledge about demand is through in-store operations experience. In behavioral economics, it is well established that past experience helps promote more rational behaviors (List, 2011; Cecchi and Bulte, 2013; KC et al., 2013; Damali et al., 2022). Specifically, Lee et al. (2018) show that more experienced workers are less likely to exhibit the salience bias in a crowdsourcing setting. To foster the benefit of discretionary pricing, it is thus crucial to identify potential factors that can mitigate the bias effect. As a result, we examine how manager decisions vary when they possess different in-store operations experiences.
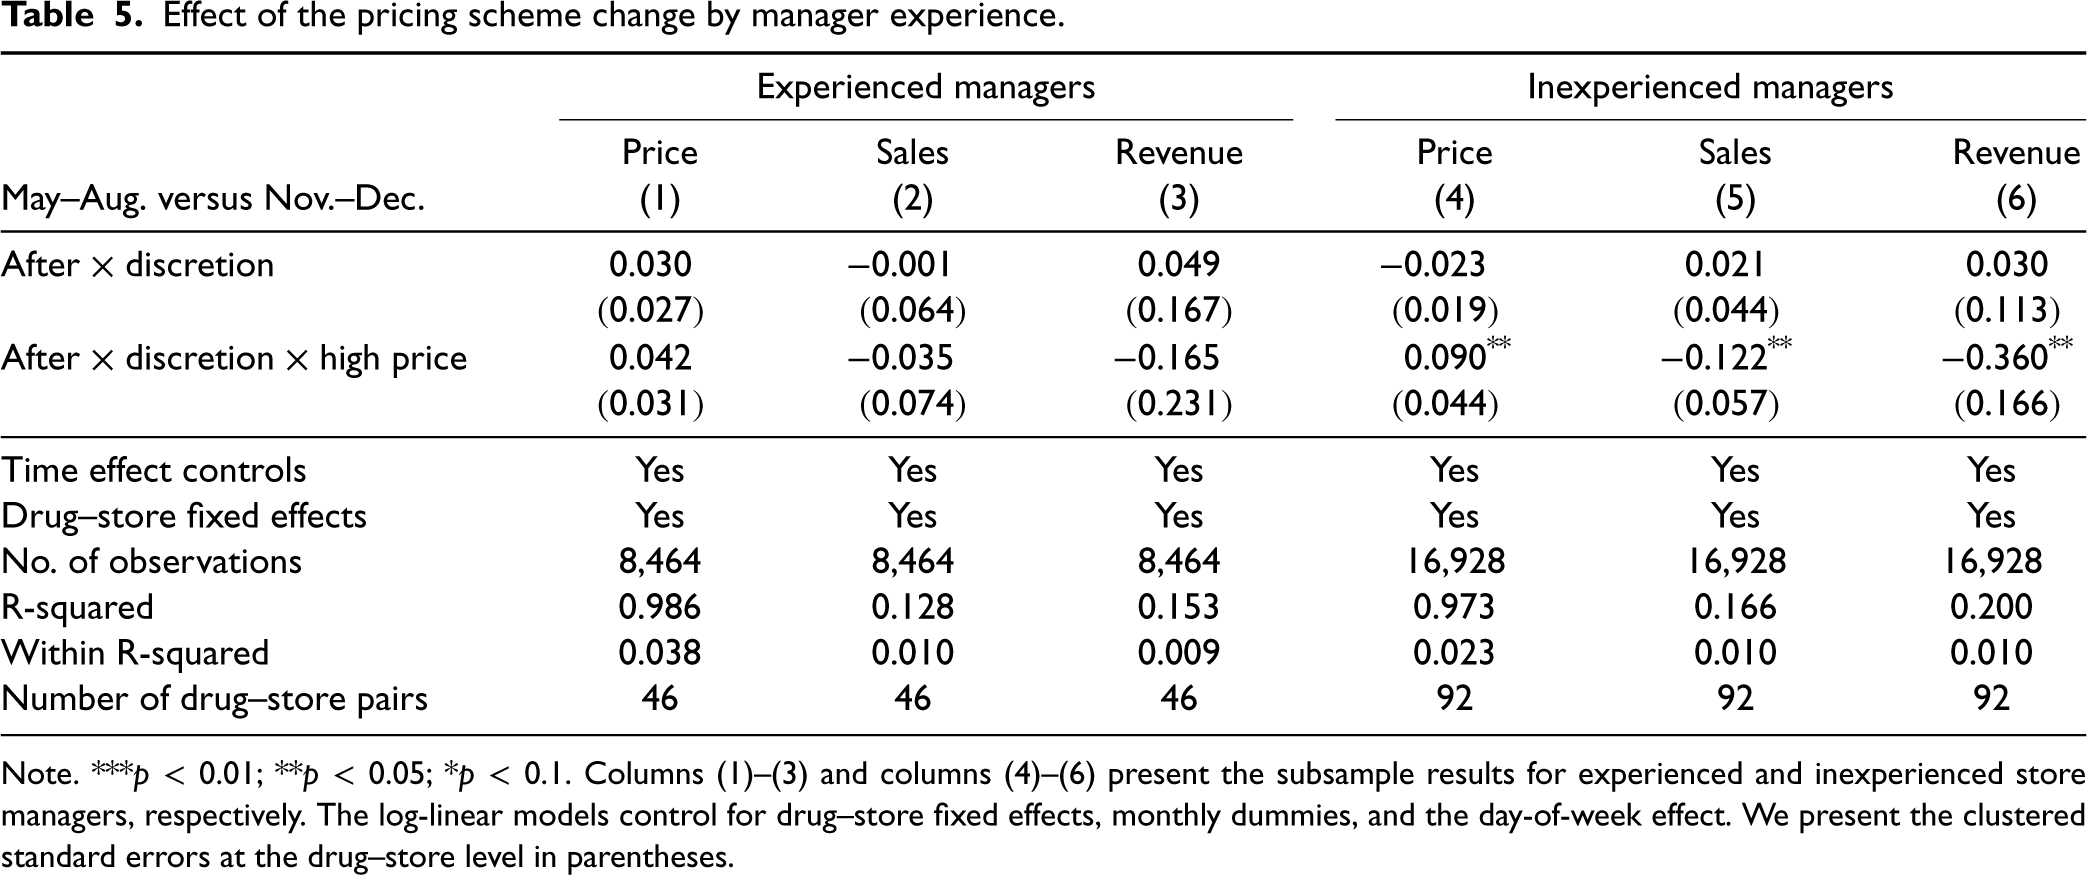
Similar to the previous section, we conduct a subsample analysis for different manager experience levels. We quantify managers’ experience levels by their employee tenure at the pharmacy chain. We observe that the firm tends to assign more experienced managers to larger or newly opened stores, irrespective of the local competition level. Therefore, the manager’s experience level does not directly interact with the store’s competition level. We use the median experience level as the cutoff (80 months) and present the subsample results in Table 5.
Effect of the pricing scheme change by manager experience.
Effect of the pricing scheme change by manager experience.
Note. ***
Columns (1)–(3) of Table 5 show that experienced managers do not significantly increase product prices. Correspondingly, the sales and revenue are also not affected in the post-experiment period. However, inexperienced managers significantly increase the prices of high-priced drugs—the price adjustment scale is 9.0% more compared to that of low-priced drugs. The aggressive price increase leads to decreased sales and revenue. Our results suggest that manager experience serves as a moderator for the bias effect. Experienced managers are less likely to be affected by behavioral biases and tend to increase drug prices less aggressively compared to inexperienced managers. Managers might predict demand more accurately and adopt more rational pricing decisions with enhanced knowledge of the demand–price relationship. Therefore, under discretionary pricing, providing training to managers to improve their understanding of demand sensitivity can benefit firms and allow them to better utilize managers’ local market information.
We conduct three sets of robustness analyses to verify the reliability of our results and make sure that they are not influenced by (a) how treatment and control groups were defined, (b) the methods used for matching, and (c) the definition of competition levels. We provide a summary of these tests and their results below. We refer readers to Appendix EC.2 for more detailed descriptions.
We first assess whether our results are robust to alternative treatment definitions. In the main analysis, we define the treatment and control groups at the drug level. We prohibit the matched control drug from sharing the same granular seven-digit therapeutic class as the treated drug. To further validate the results, we adopt an alternative treatment definition where we define the treatment group at the seven-digit therapeutic class level. This means that for any drug selected for the field experiment, we assign all drugs in the same seven-digit therapeutic class to the treatment group. We consider all drugs from different seven-digit therapeutic classes but the same three-digit class as potential control drugs and ensure the comparability between matched drugs using the nearest neighbor matching. This alternative definition of treatment and control groups produces consistent results, indicating that demand substitution effects do not drive our findings. Our next group of tests examines the robustness of our results through alternative matching methods. We apply
Lab Experiments
Following our field experiment, we designed a series of lab experiments to evaluate the generalizability of our findings in generic pricing settings and investigate the potential behavioral mechanism behind the field observations and mitigation methods.
Motivating Context
Behavioral research suggests that decision-makers are subject to bounded rationality (Simon, 1955), meaning that they do not always make optimal decisions, but rather satisfactory ones due to their cognitive limitations. In our field setting, store managers are susceptible to behavioral biases that can lead to suboptimal pricing decisions. Compensation for store managers at our collaborating pharmacy chain is directly linked to the store’s revenue, which is determined by the demand and price of all products jointly. Compared to demand, price is more salient and accessible to managers. While managers can adjust product prices under discretionary pricing, they cannot directly alter consumer demand. Instead, they indirectly affect demand by adjusting factors such as price, promotion, and store display. Furthermore, the price information can be identified via price tags or the Point-of-Sale (POS) system, while the underlying demand information is rather hidden. Even accessing its proxy—the historical sales—requires extra work from managers to retrieve and examine past sales records from the decision support system. Beyond reviewing historical sales figures, estimating how demand shifts with price changes from the figures is an intricate task that needs advanced cognitive processing and expertise from managers.
In a complex decision-making environment, decision-makers may be driven by salience bias to focus on more salient and easily accessible information, while ignoring implicit information that may be more relevant to the goal, leading to suboptimal decisions (Weinberg, 1975; Taylor and Thompson, 1982). Salience bias is commonly observed in various settings, such as physicians’ adoption of new treatments (Camacho et al., 2011), inventory replenishment decisions (Rudi and Drake, 2014), consumers’ decisions (Chetty et al., 2009; Bordalo et al., 2013), financial decisions (Bordalo et al., 2012; Bazley et al., 2021), and feedback in crowdsourcing contests (Lee et al., 2018). Under discretionary pricing, because the price factor is more accessible and conspicuous, managers might opt to increase product prices as a means to boost revenue, while disregarding or underestimating the indirect effect of price on revenue through demand.
We observe in the field experiment that managers tend to raise prices for high-priced items. This phenomenon is also more pronounced in low-competition stores and among less-experienced managers. To validate our field findings and explore behavioral explanations, we conducted three lab experiments. In the first study, we examine whether salience bias serves as one of the explanatory mechanisms for our field observations. By studying the interaction between the salience intervention and the demand sensitivity, we offer insights into the design of demand-information provisioning within a generic pricing framework. In the second study, we explore the influence of experiences on pricing decisions. Existing literature has shown that learning can mitigate behavioral biases over time (Bolton and Katok, 2008; Bostian et al., 2008). Consequently, we investigate whether repeated decision-making contributes to improved pricing decisions in order to corroborate our field results concerning differential pricing based on manager experience. The third study investigates whether participants are inclined to make price adjustments for high-priced products when presented with a long list of candidate products.
Study 1: Salience Bias
In this study, we investigate whether participants exhibit a similar upward pricing trend to what was observed in the field experiment, but in generic pricing scenarios with pricing discretion. We also examine whether salience bias can offer a behavioral explanation for this trend.
Task Design
The laboratory experiment is designed to simulate the pricing decisions that managers encountered in the field experiment. Under the revenue-sharing contract, store managers were motivated to set product prices that maximize the total revenue. However, managers did not have direct access to the demand functions that explicitly indicate how the product demand responds to price changes. Instead, they must infer the demand function through their interactions with customers and the decision support system.
To recreate the field environment in the lab, we required participants to make price decisions for four products, with the base average prices set at $4, $16, $32, and $48, respectively. We randomized the sequence of the four pricing tasks across participants. For each task, we also provided participants with the allowable price adjustment range, which is set to be
To incentivize participants to make optimal pricing decisions that maximize the total revenue, we offered all participants a base compensation of $0.4, with the potential to earn a bonus of up to $0.4. The bonus was determined based on how closely the realized revenue from the participant’s price choices matched the optimal revenue. Specifically, for each of the four products, we calculated a product-specific bonus as $0.1 multiplied by the fraction of the item’s realized revenue over the optimal revenue. The sum of these four product-specific bonuses constituted the total bonus for each participant. The lab experiment on average lasted
To examine salience bias as a behavioral mechanism, we employ a between-subjects design that varies the salience level of the underlying demand function information. This experimental design enables us to address two key questions: (a) whether salience bias is indeed a factor that affects pricing decisions, and (b) whether demand-relevant information can moderate the effect of salience bias. To address the second question, we draw inspiration from the field observations indicating the differential effect of price adjustment across varying competition levels. Therefore, in addition to the average price and demand information, we provide participants with two supplementary pieces of information that indicate the level of competition intensity, namely whether a product faces nearby competitors and the product-specific demand sensitivity. The nearby competitor attribute informs participants about the presence of nearby competitors within a 1-mile radius who sell the same product. Specifically, we use “yes” or “no” to indicate whether there are few or many alternative purchasing options. The demand sensitivity attribute describes the extent to which the product’s demand responds to price changes. We use “little” or “much” to indicate whether changes in product price have a minimal or substantial impact on product demand. Note that we randomized the values of the competition and demand sensitivity attributes both within and between subjects. This manipulation further introduced variations in the demand function for products at the same base average price level across different participants. To assist participants in interpreting these two additional demand attributes, we provide explanations regarding competitor presence and demand sensitivity directly beneath the attribute values as shown in Appendix EC.3.1.
Price adjustment scales across display treatments and demand information groups.
Price adjustment scales across display treatments and demand information groups.
Note. ***
We follow the literature to manipulate the relative salience level of price and demand information by designing how the nearby competitor and demand sensitivity information is presented to participants using two different arms: direct display and click-to-view (Chetty et al., 2009). Participants in the direct display group are not required to take further actions and can immediately access all price and demand information to make the pricing decision. In contrast, participants in the click-to-view group can only directly observe the average price and demand information, as well as the allowable price adjustment range. To access the additional nearby competitor and demand sensitivity attributes, participants in the click-to-view group are required to click the “view” buttons. In other words, the two additional pieces of demand-relevant information can be accessed but are not immediately visible to participants, mirroring the field setting where managers must exert effort to retrieve and comprehend past sales figures. To introduce a similar effort element through the button design, we included a waiting period after clicking to reveal the collapsed demand-relevant information. The duration of this waiting time is provided to the participants. Furthermore, between the nearby competitor and demand sensitivity attributes, participants are only allowed to view the value of one attribute at a time. This means that when participants click one of the “view” buttons, the other would automatically collapse, displaying at most one attribute’s value at any given time. The design replicates the switching costs that managers encounter in the field when transitioning between different types of information. From a pilot study, we observed that without the introduction of a waiting time, the average difference in completion time between the direct display group and the click-to-view group was
The last component of the experiment design is the timer setting. We integrated a countdown timer to reflect the time-constrained environment. To determine the appropriate countdown duration, we take into account the participants’ information retrieval and decision-making times through the same pilot study. The pilot experiment revealed that, on average, participants took 20 s to complete each pricing task without any waiting time. Given the design of an 8 s waiting time for each button (i.e., a total of 16 s), it should require
We conducted this first laboratory study on Prolific and recruited 200 participants to take part in our experiment. These participants were located in the United States and had completed 100 or more human intelligence taskswith an approval rate of 99%. We informed the participants that the experiment would last around 3 min, with an average compensation of $0.6, including the $0.4 participation fee. Participants were randomized to join one of the two treatment groups: direct display and click-to-view. Before the pricing tasks, participants were directed to first review the instructions outlining the study objective. The instructions also emphasize the revenue maximization goal and highlight the compensation formula to the participants. We applied predetermined exclusion criteria to filter out low-quality responses. Specifically, participants were excluded if they failed the filtering question or set prices outside of the allowable ranges. The filtering question required participants to choose the maximum number from a list of four numbers. Our final dataset includes responses from 190 subjects.
Results
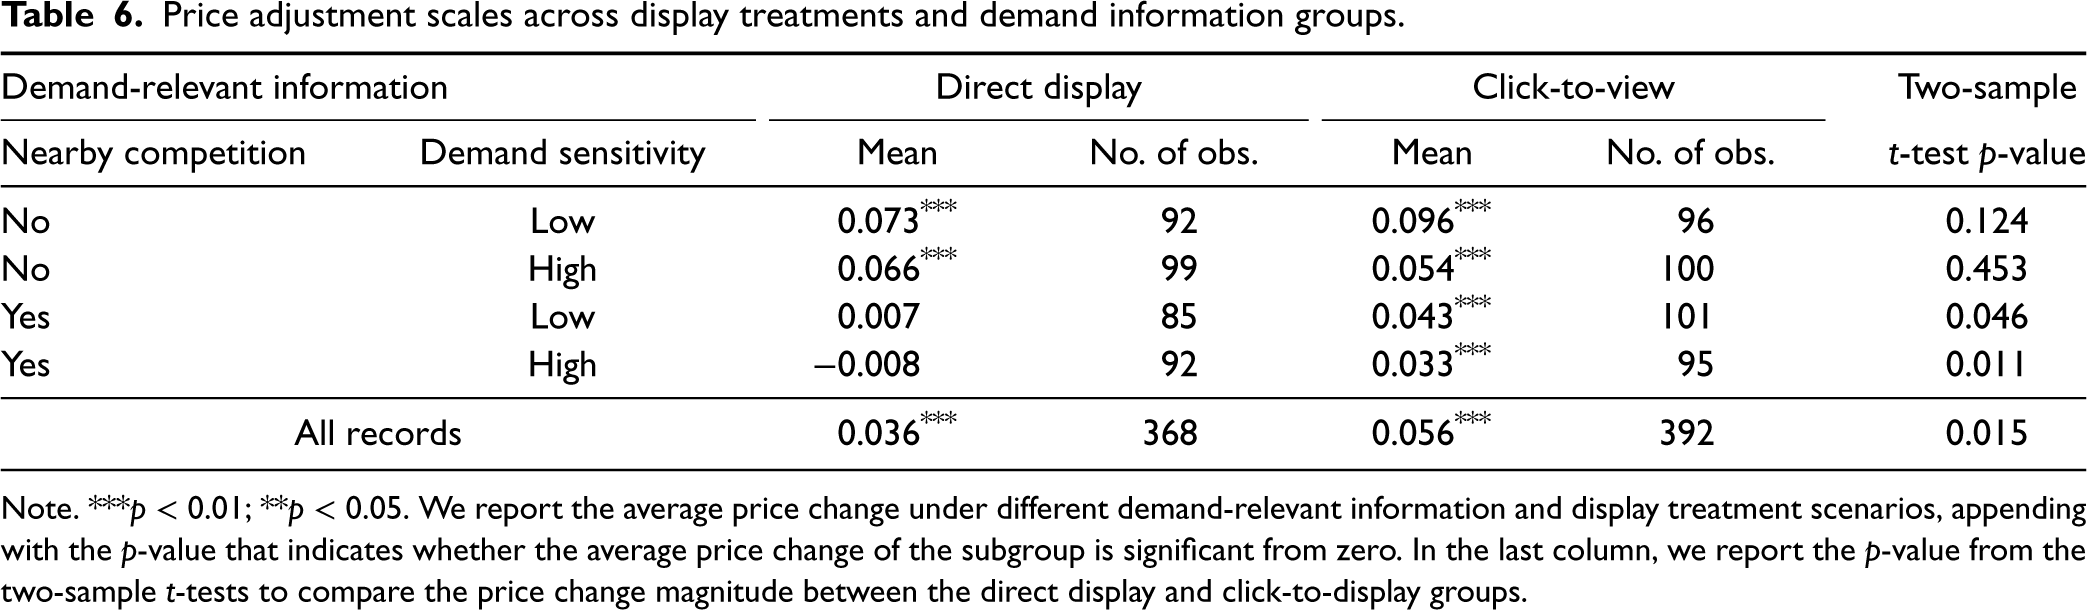
Table 6 reports the average price adjustment scale between the two display treatment groups across various demand information scenarios. The last row of the table demonstrates that, under both display settings, participants significantly increased product prices. Under the click-to-view setting, where competition and demand sensitivity are not readily accessible, participants adjusted prices by a significantly larger scale of 5.6%. This contrasts with a 3.6% increase in the direct display setting, where all price and demand information is directly accessible (5.6% vs. 3.6%,
The observed differences between this lab study and the field experiment may be attributed to variations in the experimental settings. In our field experiment, store managers had the authority to oversee pricing decisions for
The result of this first experiment provides evidence that participants are subject to salience bias. Participants in the click-to-view group face higher information acquisition costs, as they must exert effort to access the competition and demand sensitivity attributes. The click-to-view setup reduces the relative salience of demand-relevant information compared to the price information, leading the participants to magnify the upward pricing trend. In Appendix EC.4.3, we separated the click-to-view samples based on whether participants clicked the “view” buttons to access the two additional demand attributes to further examine the drivers of behavioral differences.
We further investigate how demand-relevant information affects pricing decisions and its role in moderating the bias effect. Within each display treatment group, Table 6 demonstrates that participants were inclined to set lower prices when the competition attributes indicate the presence of many nearby competitors. Specifically, under the direct display group, participants did not significantly alter the price. This observation aligns with our field findings, where store managers facing intense competition exhibited less upward pricing. Between the direct display and click-to-view groups, participants in the click-to-view group tended to increase product prices to a greater extent across most demand-relevant information scenarios. In particular, the difference in the price adjustment between the two display treatments amplifies when the competition attribute reveals nearby competition, while the impact of demand sensitivity is less significant. This finding suggests that while most people understand the impact of competitors on pricing decisions, demand sensitivity remains a challenging concept to comprehend, despite our provision of detailed notes explaining the meaning of the sensitivity attribute.
Study 2: Learning Effect
Task Design
Building upon our field observation that the manager’s experience may alleviate the upward pricing bias, we introduced a second experiment to examine the impact of learning and feedback on pricing decisions in the lab environment. We maintained the design of our first study and provided average price and demand information to all participants. However, we withheld access to information on competition and demand sensitivity attributes. Instead, we assigned participants the task of making repeated pricing decisions for the same product, relying on a real-time feedback system to facilitate learning about the demand function (Bolton and Katok, 2008). Specifically, after each round, participants could review the history of their prior pricing decisions and the associated realized demands (see Appendix EC.3.2 for the experiment interface). Participants were requested to make 20 rounds of repeated pricing decisions but were not informed of the total number of rounds (Schweitzer and Cachon, 2000). The 20-round design offers participants ample exploration opportunities while accommodating the potentially quick convergence when learning a deterministic demand function.
In practice, the extent to which we should be concerned about the bias-induced upward pricing trend is contingent upon the relative position of the underlying optimal price and the base average price. If the optimal price is lower than the average, an upward pricing trend could notably diminish revenue. Conversely, if the optimal price exceeds the average price, this upward trend could be less of an issue as it guides prices in the correct direction. To examine whether learning helps facilitate more rational decisions in these two contrasting scenarios, this second experiment incorporates both situations where we designed distinct demand functions, anchoring the optimal price at
Similar to the first study, participants are incentivized to set the product price with the aim of increasing total revenue. Participants received a base compensation of $0.6 for participating in the experiment, with the potential to earn a bonus of up to $1. After each round, we calculated the bonus as $0.05 multiplied by the fraction of the product’s realized revenue over the optimal revenue, and the sum of the 20-round bonuses constituted the total bonus. We provided the compensation description to participants on the experiment landing page.
We recruited 100 new participants from Prolific following a protocol similar to that in our first study. After excluding ineligible participants using the filtering question, we observed 45 participants in the lower-than-average optimal price group, while another 50 participants were assigned to the high-than-average optimal price group. On average each participant earned between $1.2 and $1.6, and the experiment session lasted
Results
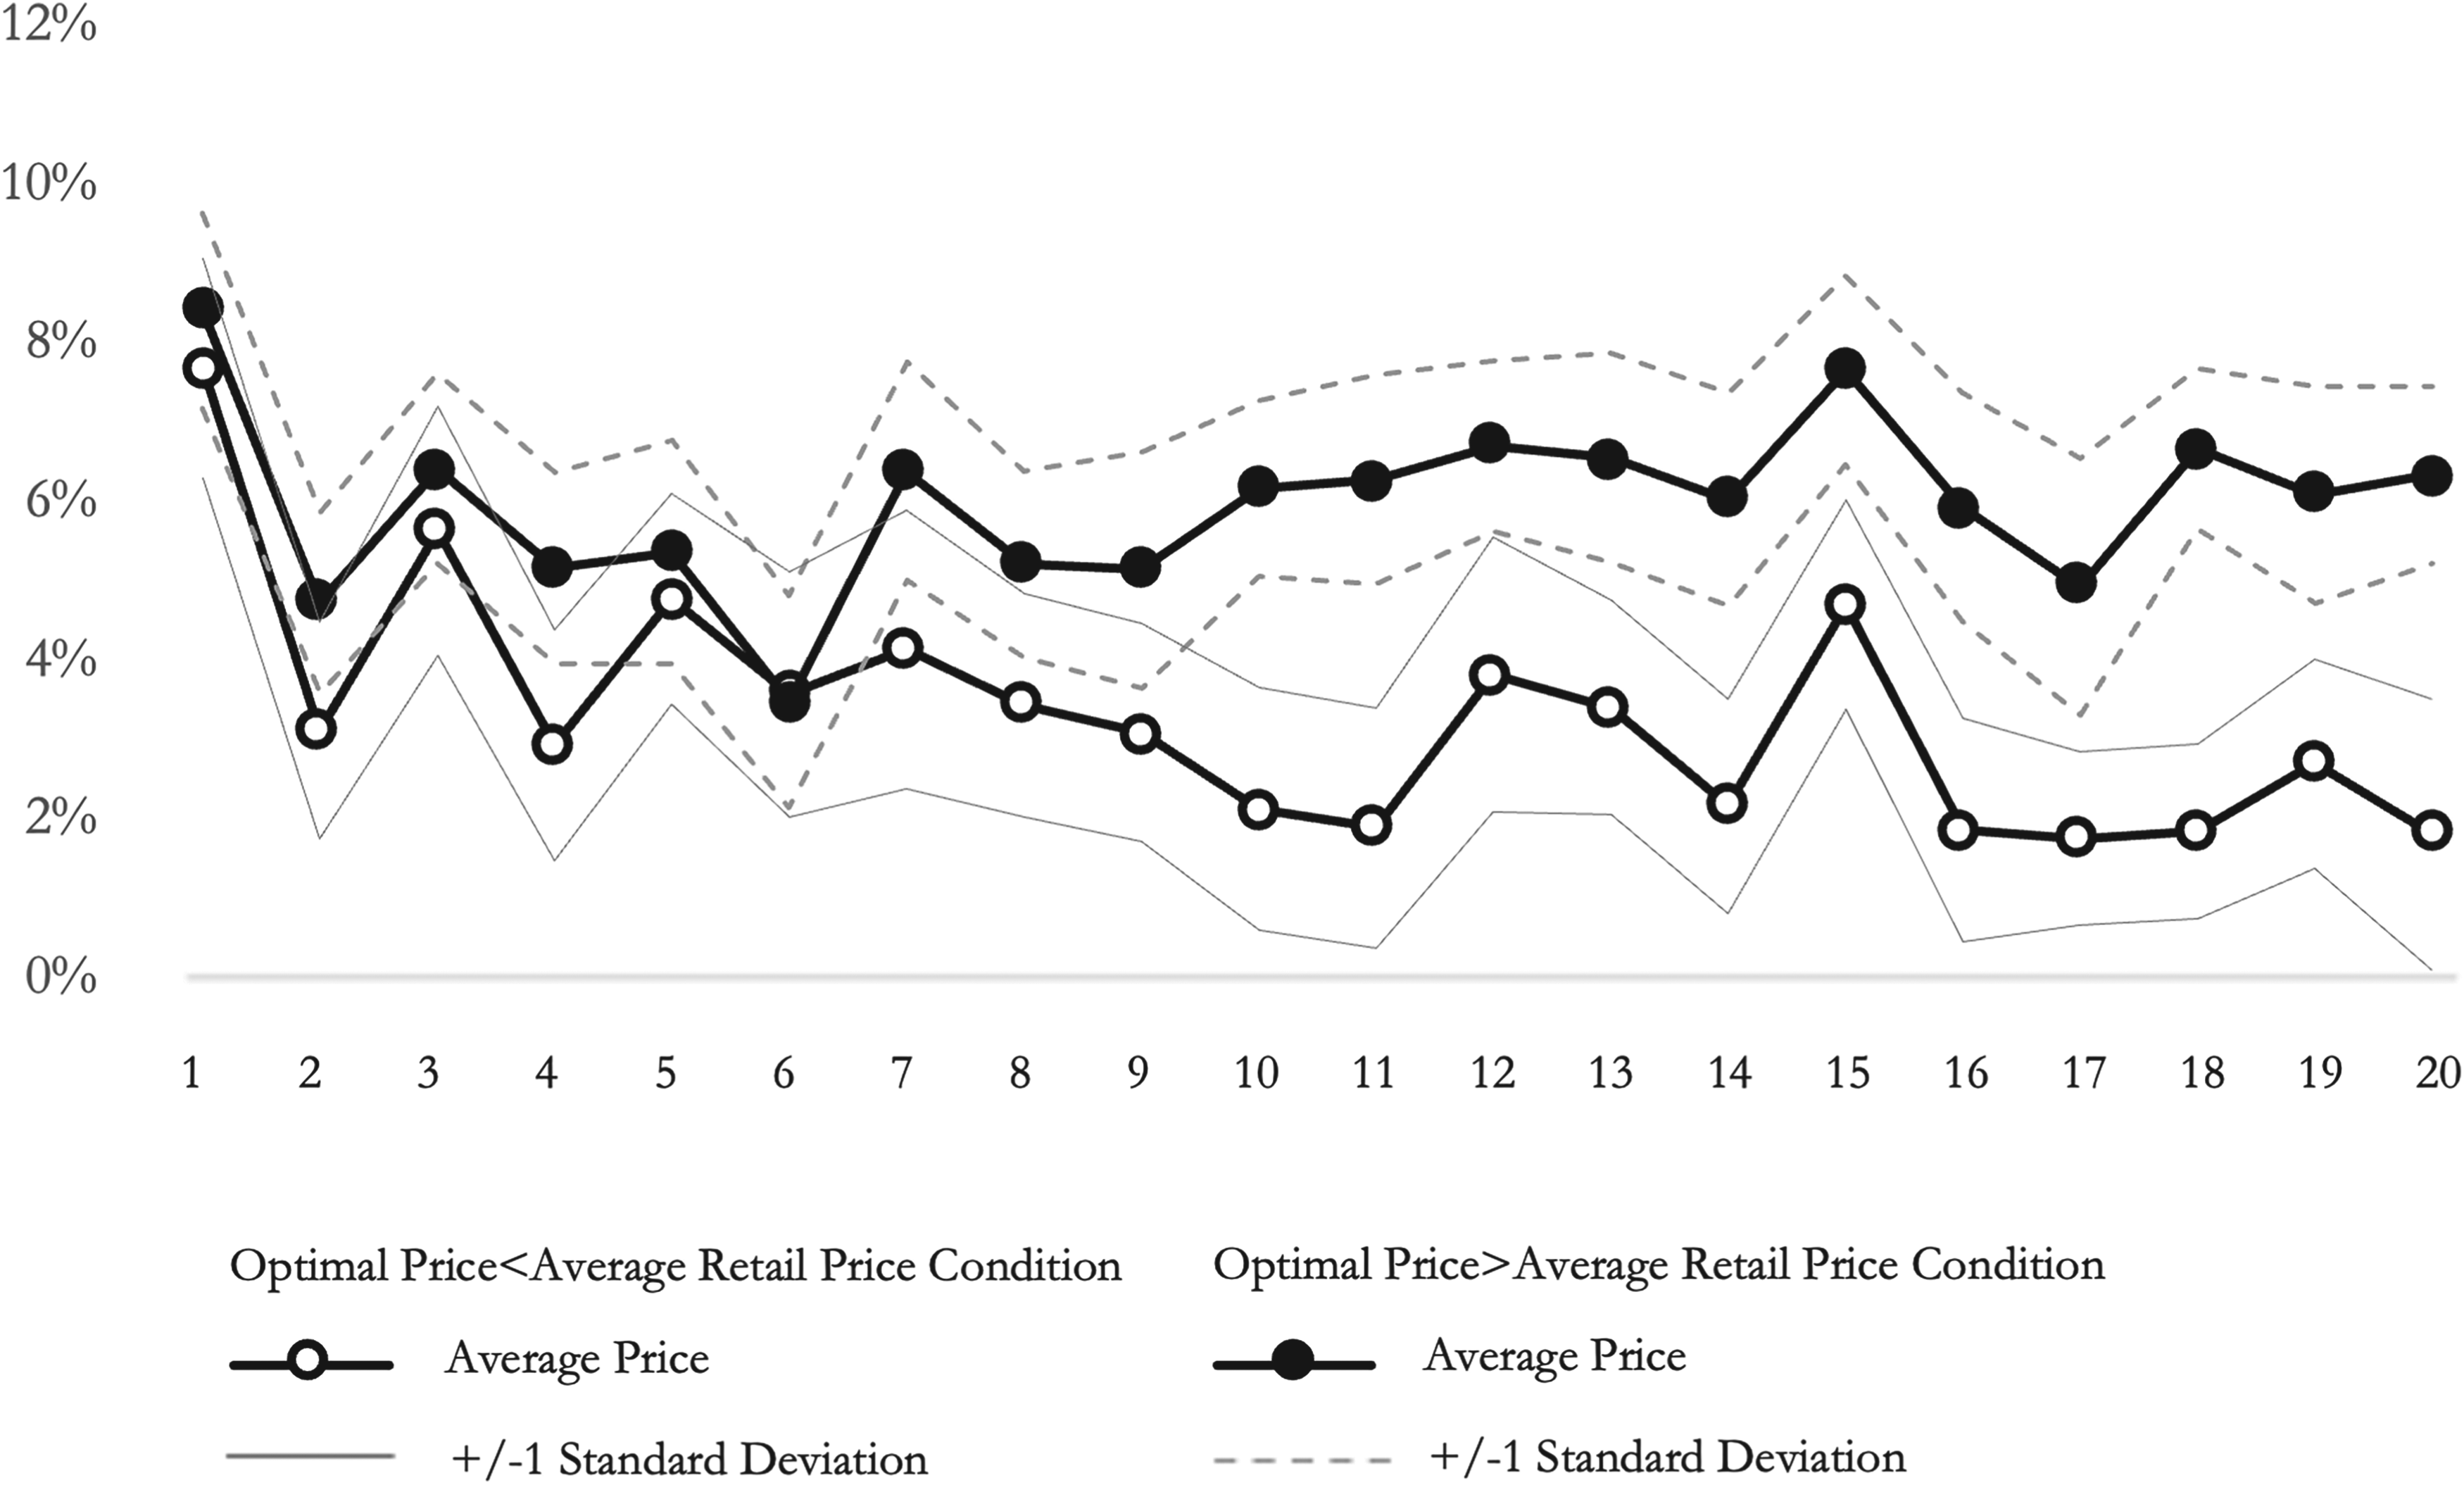
Figure 2 presents trend lines for the average price adjustments by the experiment round under two scenarios: when optimal prices are lower and higher than the average price. After the initial exploration stage, price adjustments converge toward the optimal price under both scenarios. The divergence in the price adjustments between the two groups becomes visually evident in the latter 10 rounds. A two-sample
Percentage of price adjustment by round.
For the lower-than-average optimal price group (represented by the open dot line), we observe that repeated pricing decisions can partially counteract the upward pricing bias. We apply individual fixed effects models and include the round number to estimate the coefficient for the per round price adjustment, with clustered standard errors at the participant level. We find a statistically significant average price decrease of 0.5% per round (
Task Design
We introduced the third experiment to validate our field observation where we only observed significant price adjustments for high-priced items. We designed the study to offer a list of six products to participants and request them to rank the products to learn their preferences for the price adjustment decisions. In this study, participants observed the baseline product information (i.e., average price and average demand) as well as the competitor and demand sensitivity attributes with the explanatory notes (i.e., if there are many nearby competitors and how much the product’s demand changes with price) for a total of six products. We randomly drew the display sequence between the six products. Similar to the previous two experiments, we designed the demand functions to calculate the participant bonus, but we did not explicitly share the functions with the participants. Appendix EC.3.3 demonstrates the experiment interface.
Study 3: Price adjustment preferences.
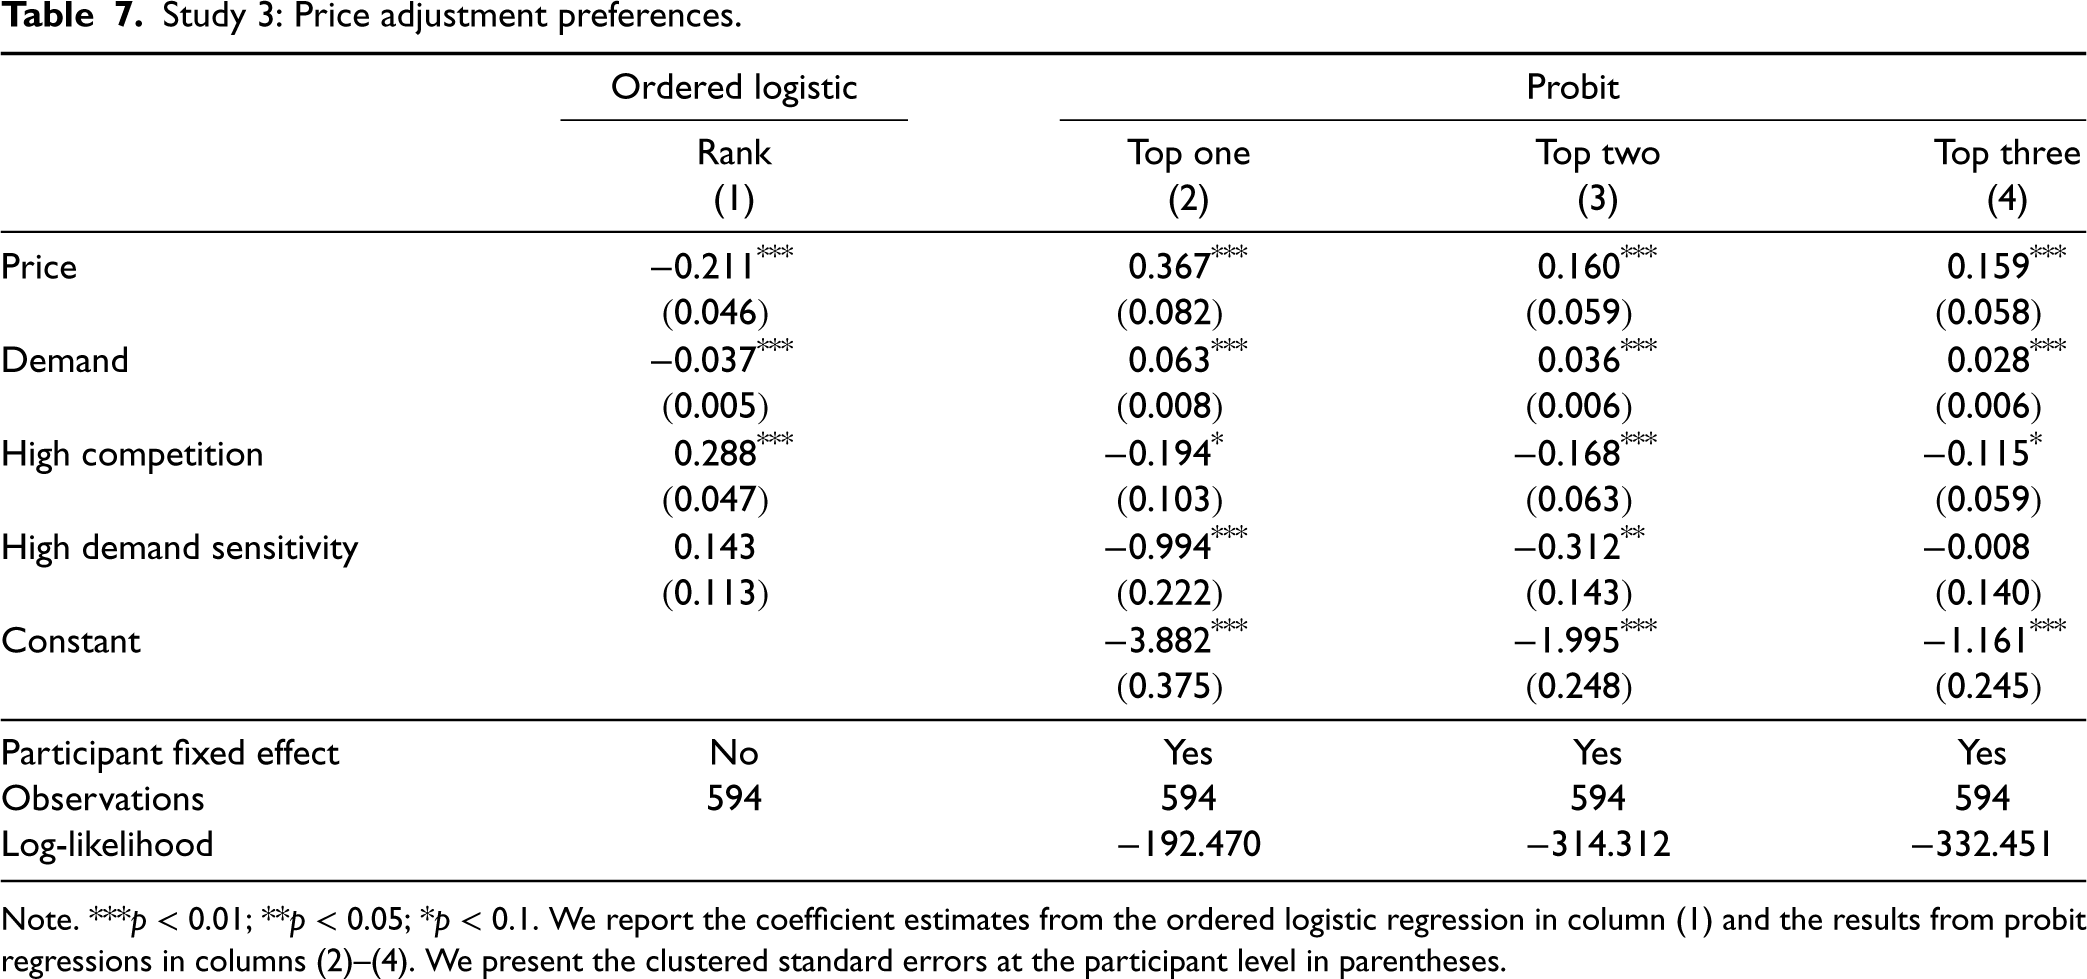
Study 3: Price adjustment preferences.
Note. ***
Each participant received a base compensation of $0.4 for participation, with a possible bonus up to $0.3. The bonus is determined according to the alignment between the price adjustment priorities chosen by the participants and the ranking from the potential revenue gains. In other words, we incentivized the participants to prioritize the price adjustment of products based on the magnitude of possible revenue boost. For example, suppose the three products in the store have current revenues of $1, $6, and $15, while the optimal revenues of the three products are $3, $10, and $18. Based on the potential revenue gains, the ranking of products should be product 2 (with a $4 potential), followed by product 3 (with a $3 potential) and product 1 (with a $2 potential). We then computed the correlation between the optimal product raking and the participant’s ranking to identify how closely the two sequences match each other. We multiplied the correlation by $0.3 to get the bonus value for each participant. The experiment on average lasted about 2 min, with each participant earning between $0.4 and $0.7. Using the same protocol as the previous two studies, in total we managed to recruit 99 eligible participants from Prolific.
We estimate an ordered logistic regression model that examines the preference of participant 
Table 7 presents the estimation results. We consistently observe across all models that products with higher base price levels receive significantly lower rankings and are more likely to be selected as participants’ top choices. The estimation results corroborate our field observation that, when given the discretion to alter prices for multiple products, managers tended to focus on adjusting prices for high-priced products. Although participants in the lab experiment also demonstrate a significant preference for adjusting prices of high-demand products, the estimated effect of demand is lower than that of price across all models, suggesting that the demand level is likely a less prominent decision factor. Moreover, we observe that participants are less inclined to consider adjusting product prices in the presence of nearby competition. The impact of nearby competition is also comparable in magnitude to that of price information. This aligns with our field observations and results from previous lab studies, indicating that decision-makers incorporate competition information into their pricing decisions. On the contrary, the effect of demand sensitivity is not as consistent. In columns (2) and (3), we identify that demand sensitivity is a significant decision factor when participants select their top one and top two products for price adjustments. However, the role of demand sensitivity does not hold when we study the generic product ranking.
Through a combination of field and lab experiments, this paper investigates the effectiveness of discretionary pricing and analyzes the underlying behavior mechanism that affects human pricing decisions. Given that the system information provided in our field setting—past average prices—is not construed as direct price recommendations for the field managers, our study aims to understand whether and to what extent human decision-makers can mitigate behavioral biases and leverage their local information advantage to formulate better pricing strategies. The field observations reveal that managers tend to raise prices for high-priced products, which leads to a significant decline in sales and revenue. Moreover, we find that price adjustment decisions are contingent on local competition levels and manager experience. We observe no significant price and sales performance changes in stores with high competition or experienced managers. Our follow-up lab experiment extends these field findings to more generalized discretionary pricing settings. We identify salience bias as a potential behavioral mechanism that contributes to the deviation from optimal pricing and explores bias mitigation methods. By manipulating the salience level of demand information relative to price information, the lab experiment reveals that making demand-relevant information more accessible can divert participants’ focus from the price factor and encourage them to delve deeper into the more intricate demand estimation problem.
While discretionary pricing, in theory, is often viewed as an effective strategy to enhance firm performance, we demonstrate that behavioral biases of decision-makers can be a threat that challenges its effectiveness. To address this, based on our field and lab observations, we offer managerial implications for pricing practices. First, firms should provide managers with systematic training to improve their understanding of demand sensitivity in order to enhance their abilities to account for the impact of demand on revenue. In addition, firms can collect and incorporate multiple pieces of information relevant to demand function estimation, especially information such as the extent of nearby competition that is straightforward for managers to comprehend, into the decision support systems. These approaches can mitigate the impact of behavioral biases and enable more effective integration of human overrides to pricing practices.
The limitations of our study suggest directions for future research. We focused on a four-month period following the experiment and observed that it takes about two months for managers to participate and actively engage in pricing decisions. Future studies could expand on our research to identify the trajectory of manager behavior over time and the prolonged impact of discretionary pricing on sales performance. Our lab experiment explores salience bias as one explanatory behavioral mechanism that leads to the upward pricing trend. However, since the purpose of the paper is not to identify all contributing mechanisms to the field observations, we acknowledge that there could be other behavioral drivers of the upward pricing trend worth exploring. Further research can investigate the effect of behavioral biases such as loss aversion and overconfidence bias. For instance, managers could exhibit loss aversion, which makes them hesitant to lower prices due to the fear of missing out on potential margins, despite the fact that price reductions can lead to increased sales and revenue. As a result, loss aversion can lead to price increases and prevent managers from adopting a more competitive pricing strategy (Donohue et al., 2019). Managers could also be affected by optimism bias. They might underestimate the negative impact of higher prices on customer demand and thus choose to increase prices regardless of potential significant demand loss (Schneider, 2001). Lastly, our field and lab observations suggest that managerial experience can reduce the influence of salience bias and promote more rational pricing decisions. Further research can expand along this dimension to develop learning and design feedback systems that alleviate biases in general discretionary settings.
Supplemental Material
sj-pdf-1-pao-10.1177_10591478241248747 - Supplemental material for Examining Behavioral Biases in Discretionary Pricing: Evidence from Field and Lab Experiments
Supplemental material, sj-pdf-1-pao-10.1177_10591478241248747 for Examining Behavioral Biases in Discretionary Pricing: Evidence from Field and Lab Experiments by Xinyu Liang, Yixin (Iris)Wang and Jun Li in Production and Operations Management
Footnotes
Declaration of Conflicting Interests
The authors declared no potential conflicts of interest with respect to the research, authorship, and/or publication of this article.
Funding
The authors received no financial support for the research, authorship, and/or publication of this article.
Notes
How to cite this article
Liang X, Wang Y and Li J (2024) Examining Behavioral Biases in Discretionary Pricing: Evidence from Field and Lab Experiments. Production and Operations Management 33(6): 1335–1353.
References
Supplementary Material
Please find the following supplemental material available below.
For Open Access articles published under a Creative Commons License, all supplemental material carries the same license as the article it is associated with.
For non-Open Access articles published, all supplemental material carries a non-exclusive license, and permission requests for re-use of supplemental material or any part of supplemental material shall be sent directly to the copyright owner as specified in the copyright notice associated with the article.