
Abstract
Self-driving vehicles have the potential to drastically reduce accidents caused by human errors, saving significant amounts of money in damages as well as human lives. However, public acceptance of the technology operating on public roads still needs to improve, as most Americans are uncomfortable sharing the road with a self-driving vehicle. The challenge for policymakers is to craft regulations that not only enhance the safety of self-driving technology but also foster public trust and acceptance. This study examines how specific policies—requiring visual cues to indicate when a vehicle is operating in self-driving mode and certification requirements for users—impact public acceptance of self-driving vehicles. To evaluate the impact of the policies, we theorize how policies may influence people's trust and how trust, in turn, may affect acceptance of the technology. Furthermore, we examine how these effects vary across political affiliations, as prior research suggests that Republicans and Democrats differ in their trust in government oversight and technological innovation. Our findings confirm that Republicans are generally less willing to share the road with self-driving vehicles than Democrats, largely due to lower trust in the government to regulate the technology effectively. We find that a visual cue policy increases trust in government but decreases trust in the technology, leading to increased acceptance among Republicans but a neutral or negative effect for Democrats. Conversely, a certification requirement increases trust in government and in other drivers, positively impacting acceptance for both Republicans and Democrats. Finally, additional analysis revealed that a combined policy implementing both measures proves to be the most effective at increasing overall public acceptance by strengthening trust across multiple dimensions. These insights provide valuable guidance for policymakers seeking to improve the integration of self-driving vehicles into public roadways.
Introduction
Human error is a factor in ninety-four percent of road accidents (Singh, 2015), resulting in the loss of over 40,000 human lives on American roads in 2021 alone (National Center for Statistics and Analysis, 2022). A study of 2010 crash data estimates that motor vehicle crashes cost $242 billion in economic activity, including $57.6 billion in lost workplace productivity and an additional $594 billion due to loss of life (Blincoe et al., 2015). Self-driving vehicles can drastically reduce accidents due to human errors and save human lives. By removing human errors, self-driving vehicles should significantly reduce the 6.3 million vehicle accidents annually in the US alone (Bertoncello and Wee, 2015).
Self-driving vehicles hold transformative potential beyond saving lives, such as enhancing quality of life by increasing mobility for seniors, people with disabilities, and underserved communities (NHTSA, n.d.). They could also reduce traffic delays, which in 2014 cost Americans 6.9 billion hours, impacting fuel use, emissions, and personal well-being (Schrank et al., 2015). Additional benefits include lower transportation costs, fewer medical expenses from reduced accidents, and minimized work disruptions (Coalition for Future Mobility, n.d.). Environmentally, self-driving vehicles may ease stop-and-go traffic, cutting fuel consumption and emissions (Stern et al., 2018), while their reduced parking needs could free up urban spaces for community use (Bertoncello and Wee, 2015).
Before these benefits can be realized, critical issues with self-driving technology must be addressed. For example, phantom braking—when a self-driving vehicle mistakenly brakes for harmless objects like shadows or plastic bags—can lead to rear-end collisions, as seen in recent challenges faced by Tesla (Lambert, 2022). Such issues receive extensive negative press; for instance, Tesla's fatal accident in 2016 and Uber's 2018 incident in Tempe, Arizona, both sparked widespread media attention, impacting public trust in the technology (Korosec, 2017; Wakabayashi, 2018). These incidents also contribute to negative perceptions on social media (Jefferson and McDonald, 2019).
Improving public perception and acceptance of self-driving technology is essential for its success. As Howard and Dai (2014) noted, public attitudes shape demand, regulatory policies, and infrastructure investments. The Institute of Electrical and Electronics Engineers highlights that the primary barrier to adoption is not technological but gaining public acceptance (Newcomb, 2012). Currently, public concerns about safety, control, security, and over-reliance on self-driving vehicles persist, with most Americans reluctant to ride in or share the road with them (Kim and Kelley-Baker, 2021; Rainie et al., 2022).
The reluctance to embrace the technology is problematic because most of the transformative benefits of self-driving vehicles will require widespread adoption by society (Becker and Axhausen, 2017; Howard and Dai, 2014). Getting to that point will be difficult because the transition will be gradual. The transition will require there to be a sufficient number of early adopters to begin using the technology and the general public (who are not using the technology) to be willing to share the road with self-driving vehicles, even when the technology has known limitations and is still improving. The public's acceptance is important because for the technology to improve, it will require the vehicles to be exposed to many different environments and situations (Hars, 2017), which will occur most effectively when the vehicles operate and learn in the real world as opposed to simulations (Mervis, 2017). While there has been an abundance of studies on the future adoption of self-driving vehicles by potential users (Acheampong and Cugurullo, 2019; Becker and Axhausen, 2017; Dixon et al., 2020), extant research has mostly overlooked the pressing issue of increasing the general public's (nonusers) acceptance of the technology being used on public roads. The distinction between acceptance and adoption is indeed subtle but significant. While adoption implies a personal readiness to use or purchase self-driving technology, acceptance refers to an individual's broader attitude towards the technology's presence in society, irrespective of personal usage.
For instance, an individual may have no intent to personally adopt a self-driving car, perhaps due to financial constraints or a lack of personal need. However, they may accept or even advocate for the technology's broader societal implementation due to its potential benefits. Conversely, individuals may be ready to adopt self-driving technology personally but still harbor concerns about broader societal implications. Therefore, understanding the public's acceptance of self-driving vehicles is crucial because public opinion can directly influence public policy (Burstein, 2003), ultimately affecting the technology's implementation, regardless of individual adoption decisions. Our study seeks to extend the existing research on adoption by examining the factors influencing public acceptance of self-driving vehicles, offering insights for policymakers and stakeholders in shaping the future landscape of autonomous vehicles.
Public perception of emerging technologies is complex and influenced by many factors (Boudet, 2019), including government regulations, which can significantly shape public opinion on self-driving technology (Slothuus and Bisgaard, 2021; Soroka and Wlezien, 2007). Understanding how regulations impact acceptance is essential as the technology rapidly advances, and many remain uncertain about it (Rainie et al., 2022). Effective regulations, such as strict safety standards and testing protocols, can address public concerns by ensuring technological reliability and mitigating risks related to over-reliance on automation (NHTSA, n.d.). However, if early regulations fail to boost acceptance, negative public opinion could pressure policymakers to restrict further development.
While public perception of emerging technologies is multifaceted and can be influenced by a myriad of factors (Boudet, 2019), we aim to explore how individuals’ acceptance is affected by proposed government regulations, as government regulations are one of the factors that can play a significant role in helping shape public opinion of self-driving technology (Slothuus and Bisgaard, 2021; Soroka and Wlezien, 2007). Understanding how and why proposed regulations influence people's acceptance is important because we are seeing rapid improvements in the technology at a time when most people are still unsure how they feel about it (Rainie et al., 2022). Meanwhile, government regulations are still catching up to the technology (NCSL, 2020). Government regulations have the potential to address and alleviate some of the technological concerns many have with self-driving vehicles (NHTSA, n.d.). For instance, strict testing protocols and safety standards enforced by regulations can help ensure the robustness of the technology, thus reducing malfunctions. Regulations can also stipulate design or operational guidelines to mitigate risks related to over-reliance on automation. However, should early regulations not improve the general acceptance of the technology, negative public opinion could put pressure on public policy to stifle further development rather than advance it.
In this paper, we explore how different governmental policies may affect people's acceptance of self-driving vehicles operating on public roads. We choose to focus on two potential policies to allow for a deeper dive into each policy's unique impacts. Specifically, we look at policies requiring vehicles to display visual cues when using self-driving technology and operators to obtain certification to operate the vehicles. These policies of interest are based on the tangible and immediate impact these policies can have on both public perception and the practical application of self-driving technology. Visual cues can help the public recognize and become more comfortable with autonomous vehicles on public roads. Certification programs can ensure a minimum standard of safety and performance, thereby instilling confidence that the technology will be used responsibly. Both policies have been discussed in the public discourse on self-driving vehicles (Rainie et al., 2022); thus, we deemed them significant and timely to investigate.
Further, these policies are natural extensions of policies relating to other vehicles (not self-driving) already in place and would address known concerns about self-driving vehicles. Licenses and special endorsements are already required for different vehicle types (e.g., motorcycles, double trailers, passenger vehicles), and certain vehicles display visual cues to signal different behaviors (e.g., hazard lights, turn signals, slow speeds, wide turn radius). Thus, logical extensions of these policies for self-driving vehicles are: (1) A requirement for vehicles to display a visual cue when using self-driving technology and (2) A requirement for drivers using self-driving technology to obtain a periodic certification that verifies they understand the capabilities and limitations of the technology. To better motivate these specific policies, we conducted a three-round Delphi study with police officers and injury lawyers to identify policies that can increase public acceptance of self-driving vehicles. These policies were the top choices that converged from the Delphi study. We provide additional details on this in the Methodology section of the paper.
A policy requiring a visual cue would have a similar purpose as a vehicle's hazard lights, alerting nearby drivers to exercise caution. Additionally, periodic certification would ensure that drivers understand the limitations of self-driving technology, addressing the risk that overestimating these capabilities poses to safety (Carsten and Martens, 2019). As vehicles become more automated, drivers often struggle to remain attentive, leading to inattention and distraction (Bainbridge, 1983). Current driver-assistance systems still require constant driver oversight. While steering, acceleration, and braking may be automatically controlled, the human driver is responsible for monitoring this automation and intervening when needed. Therefore, it is essential to ensure drivers fully understand these limitations.
To evaluate policy impact, we theorize how policies may influence trust, which in turn affects acceptance of the technology. Beyond trust in the technology itself, trust in the government agency regulating self-driving vehicles plays a key role (Dixon et al., 2020). Many fear that big-tech firms wield undue influence over policymakers, reducing public trust in effective regulation, especially given tech firms’ “fail early and fail fast” mentality, which is less acceptable in safety-critical contexts like self-driving vehicles. This distrust is heightened by significant lobbying, with Amazon and Facebook's 2020 contributions nearly doubling those of traditional big spenders like Exxon (Chung, 2021). When people perceive inadequate governmental response, their trust decreases (Petherick et al., 2020). New policies can enhance trust in regulatory agencies (Zhai et al., 2022). Additionally, a key concern is whether people understand the limitations of self-driving technology (Kim and Kelley-Baker, 2021), suggesting that trust in others’ responsible use may also be an important mediator.
Furthermore, ignoring potential heterogeneity among people may lead to faulty conclusions. Since our study examines the impact of governmental policies, we consider how sub-populations, divided by political orientation, may respond differently due to varying shifts in trust. Political affiliation often influences trust in institutions (Pew Research Center, 2022), openness to technological innovation (Drummond and Fischhoff, 2017; Edelman, 2022), and views on regulatory actions (Peng, 2020), all of which affect perceptions of self-driving technology. Thus, we theoretically explain and empirically capture how policies impact trust across various dimensions, which in turn influences their acceptance of the technology. This study makes five key contributions: (1) identifies specific policies for governing self-driving vehicles and their safety benefits; (2) demonstrates how these policies affect acceptance by influencing trust; (3) shows differential impacts of policies on heterogeneous sub-populations; (4) identifies which policies have the greatest positive effect across the general population; and (5) enriches the current stream of literature on self-driving vehicles that define acceptance only as an intention to use (Du et al., 2021; Koul and Eydgahi, 2018; Raue et al., 2019), by approaching acceptance as a willingness to allow the technology to be used by others.
Background
Current State and Regulations
While the term self-driving vehicle may have different meanings to different people, in this study, we use the term to refer to vehicles with higher levels of automation. As of 2025, most vehicles currently equipped with self-driving features, such as Tesla's Autopilot, do not fall into this category (The Tesla Team, 2024). While these systems are impressive and are helping familiarize people with the concept of self-driving vehicles while demonstrating the technology's potential, they are not classified as self-driving vehicles. Rather, these systems are classified as driver support features (SAE International, 2021).
Vehicles with higher levels of automation (known as automated driving features) became available to consumers in selected markets around the world in 2021 (Reuters Staff, 2021) and became available on a limited basis in the United States in 2024. These vehicles are capable of handling all driving tasks but still require the driver to remain engaged and attentive to resume control the moment driving conditions exceed the technology's capabilities. Vehicles that do not require drivers to remain engaged are currently in development and are being tested on a limited basis on public roads in the United States (Hawkins, 2020).
At the federal level, the first piece of major legislation dealing with the issue passed by the House of Representatives is the SELF DRIVE Act, H.R. 3388, passed in 2017 (2017b). In September 2017, the bill was introduced to the Senate as S.1885 - AV START Act and is still under review (2017a). While there are slight discrepancies in the specific requirements outlined in each bill (Eno Center for Transportation, 2017), the legislation in these acts requires manufacturers and developers to report safety reports to the National Highway Traffic Safety Administration (NHTSA) as well as the exemptions to existing safety standards for the purpose of testing and development granted to manufacturers and developers. Requirements to report to the NHTSA are outlined in a standing order issued in 2021 (NHTSA, 2021).
The 2021 standing order issued by NHTSA requires that any crashes involving vehicles using self-driving technology be reported. These reports (NHTSA, 2022b, 2022c) indicate that vehicles with higher levels of automation are more likely to sustain damage in the rear of the vehicle, while vehicles with lower levels of automation are more likely to sustain damage in the front of the vehicle. Unless vehicles were operating in reverse, this suggests that vehicles with higher automation are more prone to be struck by other objects. In a separate report issued by Waymo Inc. detailing safety performance data of their test vehicles covering 2019 and 2020, 17 of the 18 accidents reported in the timeframe involved another vehicle/object striking the Waymo vehicle (Schwall et al., 2020). This trend may indicate that autonomous vehicles behave in ways less predictable to other drivers.
As self-driving technology advances, new legislation will be needed to address the unique challenges of these vehicles on public roads (NCSL, 2020). Progress depends on NHTSA granting exemptions from standards designed for human-driven vehicles, such as those related to driver seats and steering wheels (NHTSA, 2022a; White and Shepardson, 2021). However, these exemptions face opposition from special interest groups and unions concerned about industry disruption (Shepardson, 2021), as well as potential public resistance.
Across the United States, eleven states have enacted laws specifically allowing for the testing and development of self-driving vehicles, but not commercial usage. Another nineteen states have statutes that permit the use of self-driving vehicles, but only after meeting a future standard that has yet to be established. Seventeen states have yet to introduce any statutes addressing self-driving vehicles. The remaining three states have very specific statutes limiting the use of self-driving vehicles (Maddaleni, 2024). Favorable legislation will be essential to allow for the continued development of the technology, making public perception a crucial factor in shaping regulatory outcomes (Burstein, 2003).
Acceptance and Trust
Technology acceptance has been studied for decades, from broader theories of diffusion of innovations (Rogers, 1995) to specific theories on technology acceptance (Davis, 1989; Venkatesh, 2000; Venkatesh et al., 2003). These theories suggest that people assess technology based on perceptions of its characteristics, forming attitudes that influence their intention to adopt it (Moore and Benbasat, 1991). User attributes like innovativeness (Agarwal and Prasad, 1998), mindfulness (Thatcher et al., 2018), and self-perceived knowledge (Aggarwal et al., 2015) also affect attitudes toward adoption. While these models have been used to theorize factors for user adoption of self-driving vehicles (Geldmacher et al., 2019; Kaur and Rampersad, 2018; Koul and Eydgahi, 2018), they do not address general public acceptance by nonusers.
Press coverage and accident statistics have strongly shaped public opinion of self-driving vehicles, often emphasizing failures (Ruffo, 2019; Wakabayashi, 2018). For instance, Tesla's 2016 fatal accident received widespread media attention, unlike the other 40,200 fatalities that year (Korosec, 2017). Articles highlighting higher accident rates for self-driving vehicles often lack context, as not all incidents are due to the technology itself (Law, 2021). The American Automobile Association (AAA) surveys public opinion annually. In 2021, their survey showed a meager 14% of drivers trusted riding in a self-driving car, with trust dropping to only 9% by 2023 (Kim and Kelley-Baker, 2021; Moye, 2023). A 2021 survey by AAA and Harvard's Belfer Center found that most US drivers are concerned about sharing the road with autonomous vehicles, citing safety, regulatory oversight, the need for public education, and uncertainty about identifying self-driving vehicles (Edmonds, 2021). These concerns confirm trust as a major barrier to public acceptance of self-driving technology (Dixon et al., 2020; Kaur and Rampersad, 2018).
It is clear that increasing the public's trust in the technology to operate should increase the public's acceptance of the technology. However, these surveys revealed that trust in the government regulation and in other people to use the technology responsibly are also factors. Trust in government regulation is essential for addressing public concerns over self-driving vehicles (Slothuus and Bisgaard, 2021). Effective oversight provides reassurance that potential risks are being managed and that the technology is being held to high safety standards. Regulatory frameworks, such as the crash reporting requirements mandated by NHTSA, help build public confidence by ensuring accountability and transparency (NHTSA, 2022b). The third dimension, trust in others to use the technology responsibly, is crucial for public acceptance (Kim and Kelley-Baker, 2021). This trust is particularly important given the potential for misuse or over-reliance on vehicle autonomy, which could lead to risky driving behaviors (Carsten and Martens, 2019; Casner and Hutchins, 2019). If individuals lack confidence in other drivers’ responsible use of autonomous vehicles, they may fear unpredictable interactions on the road.
Trust and Political Orientation
In considering the important role that different dimensions of trust play in technology acceptance, we recognize the effect that political affiliation has on trust. Political affiliation influences trust in institutions, openness to technology, and views on regulation, all factors closely tied to perceptions of self-driving technology. Republicans generally distrust government agencies and favor limited intervention (Pew Research Center, 2022), while Democrats tend to view technological advancements more positively (Drummond and Fischhoff, 2017; Gauchat, 2012). Studies have shown that Democrats are generally more open to new technologies with fewer fears of threats or loss (Jost et al., 2018), partly because conservatives tend to focus more on negative stimuli (Hibbing et al., 2014). Research also indicates that Democrats show a more positive response to self-driving vehicles, perceiving greater benefits and fewer concerns than Republicans (Mack et al., 2021; Peng, 2020).
While trust in government often depends on which party is in power (Keele, 2005), Democrats generally show higher confidence in the federal government than Republicans, regardless of the administration (Morgeson et al., 2022; Morisi et al., 2019). One 2022 study found that 60% of Democrats reported that they trust the federal government to do what is right, as compared to only 27% of Republicans (Hitlin and Shutava, 2022). A Pew Research Center (2022) survey had only 9% of Republicans indicating that they trusted the federal government to do what was right most of the time.
Trust in other members of society is often called social trust. While social trust is well-studied, most research finds no significant differences by political affiliation (Dinesen et al., 2020; Welch et al., 2005). One study found no partisan differences in social trust once other factors were controlled (Taylor et al., 2007). Therefore, in our consideration of trust, we do not anticipate Republicans and Democrats to differ significantly in their trust in others to use the technology.
Hypothesis Development
In this study, we consider different policies that the NHTSA could enact that would have practical value in promoting safety while increasing the public's acceptance of self-driving vehicles operating on public roads. In doing so, we consider what effects these policies would have on the different dimensions of trust and how these effects may differ for Republicans and Democrats. For each policy, we first discuss the practical benefits of the policy and then theorize on the effect of the policy on trust.
Hypothesis 1: Effect of Visual Cue Policy
As discussed in Section 2, autonomous vehicles are more often damaged in the rear, suggesting that another vehicle (presumably with a human driver) struck the self-driving vehicle. Waymo's safety reports support this, indicating that most incidents involve another object hitting the self-driving vehicle (Schwall et al., 2020). This pattern indicates that self-driving vehicles behave differently than expected by human drivers. This is unsurprising, as one of the major anticipated benefits of self-driving vehicles is that they will be safer, necessitating that they behave differently than human drivers typically would. Similarly, when automation was introduced to commercial airlines in the 1970s, pilots were often surprised by the decisions made by the complex automation systems (Casner and Hutchins, 2019).
If drivers could easily identify when a vehicle is using self-driving technology, they could adjust their driving accordingly. Therefore, the first policy we consider is a requirement for vehicles to display a visual cue when using self-driving technology. This policy could reduce collisions, as human drivers would be able to adapt their behavior and share in the decision-making process during contingencies. Research shows that having some control over the environment supports psychological well-being (Bandura et al., 1999). Current safety measures focus solely on the car's ability to make decisions, neglecting the control pedestrians and drivers may need in high-risk situations. A visible cue would give people more control in their interactions with self-driving vehicles, potentially increasing acceptance of the technology (Taylor and Todd, 1995). A visual cue can also help normalize sharing the road with self-driving vehicles. Currently, many drivers are unaware of how frequently they have safely shared the road with the technology. A 2021 poll showed that only 12% of respondents had noticed a self-driving vehicle in their community (Morning Consult, 2021). As a result, public attitudes are often shaped by high-profile negative incidents reported in the media.
Collectively, these reasons demonstrate that such a policy would be practical and, over time, would lead to many benefits for the public. Practical policies that yield positive outcomes generally boost public trust in regulatory bodies (Zhai et al., 2022). Thus, we expect this policy to increase trust in the NHTSA as the agency overseeing self-driving vehicles. However, we anticipate a greater trust increase among Republicans than Democrats, partly due to the concept of diminishing sensitivities (or returns) espoused by prospect theory (Kahneman and Tversky, 2013). This principle suggests that individuals with higher initial trust levels, like Democrats, experience smaller gains from additional positive outcomes (Benlian, 2013), as seen in contexts such as customer satisfaction (Mittal et al., 1998), trust in human and physical capital (Dearmon and Grier, 2011), and innovation (Molina-Morales et al., 2011). Furthermore, differing attitudes toward technology and regulation contribute to this disparity (Drummond and Fischhoff, 2017). Democrats, who typically advocate for stronger oversight, may find a single policy insufficient (Klein and Stern, 2004). Conversely, Republicans, who favor market-driven solutions and personal responsibility (Chu et al., 2021; Kannan et al., 2019), may see the visual cue policy as an effective safety measure without stifling innovation, resulting in a greater increase in trust among Republicans.
While the policy is expected to have a positive effect on trust in government, it may negatively impact trust in the technology itself. Requiring a visual cue could be seen as an admission that self-driving vehicles are less capable, akin to student drivers, acting as a warning label (Argo and Main, 2004). This may weaken drivers’ trust in the capabilities of the technology itself if it is necessary to warn others when it is in use (Poortinga and Pidgeon, 2004). This effect is likely stronger for Democrats, whose higher initial trust in the technology means the warning represents a more significant deviation and would thus have a larger negative impact on trust (Kahneman and Tversky, 2013). In contrast, Republicans, with lower initial trust, may view the warning as fitting their existing perceptions, resulting in a smaller impact.
Lastly, we do not expect the visual cue policy to significantly impact trust in others. Thus, our focus is on its effects on trust in government and technology. For Republicans, the policy is likely to increase trust in government more than it reduces trust in technology, resulting in a net positive effect. In contrast, for Democrats, we anticipate a smaller increase in trust in government and a larger decrease in trust in technology, leading to a net negative effect on acceptance.
Formally, we hypothesize the following:
Hypothesis 1a. The positive effect of a policy requiring a visual cue to indicate when a vehicle is using self-driving technology on trust in government will be moderated by political affiliation, such that the effect will be stronger for Republicans (including Republican leaners) than Democrats (including Democrat leaners).
Hypothesis 1b. The negative effect of a policy requiring a visual cue to indicate when a vehicle is using self-driving technology on trust in self-driving technology will be moderated by political affiliation, such that the effect will be stronger for Democrats (including Democrat leaners) than Republicans (including Republican leaners).
Hypothesis 1c. The positive effect of a policy requiring a visual cue to indicate when a vehicle is using self-driving technology on acceptance of self-driving vehicles will be moderated by political affiliation, such that the effect will be stronger for Republicans (including Republican leaners) than Democrats (including Democrat leaners).
Hypothesis 2: Effect of Certification
The second policy we propose is a requirement for drivers using self-driving technology to obtain periodic certification. Experts agree that the transition period to fully autonomous vehicles poses the greatest risk, as drivers must remain attentive and ready to reengage at any moment (Gain, 2017). Over-reliance on the technology or misunderstanding its limits can lead to accidents, especially since most self-driving features are reliable only under specific conditions (Biondi et al., 2018; Carsten and Martens, 2019; Mueller et al., 2021). Automation features have been shown to cause drivers to disengage and become more prone to distractions (Biondi et al., 2018). Understanding the capabilities and limitations of automated systems is crucial (Carsten and Martens, 2019), yet many drivers have an inaccurate perception of self-driving technology's limitations (Abraham et al., 2017; Mueller et al., 2021). Therefore, drivers using this technology should receive explicit instruction and training on the capabilities and limitations of the technology and the conditions in which they can be used appropriately (Casner and Hutchins, 2019; Mueller et al., 2021). Requiring a certification or endorsement would be a practical step to ensure drivers are prepared to operate these vehicles safely, and such a policy should evolve alongside advancements in self-driving technology.
In addition to the practical benefits of requiring a certification, this requirement should also increase acceptance of the technology by increasing trust. As argued with the visual cue policy, a practical policy with positive outcomes generally increases public trust in regulatory agencies like the NHTSA (Zhai et al., 2022). The increase would likely be greater for Republicans, who tend to have lower initial trust (Hitlin and Shutava, 2022), due to the principle of diminishing returns (Kahneman and Tversky, 2013). However, unlike the visual cue, this policy is not likely to affect trust in the technology itself. Instead, it should enhance trust in other users, addressing a major concern that people will not use the technology responsibly (Kim and Kelley-Baker, 2021). Some have argued that the biggest issue with self-driving vehicles is not the technology itself but, rather, the people using it (Kayes, 2022). A certification requirement would help ensure drivers understand when and how to use the technology, alleviating concerns and increasing trust that others will use the technology responsibly.
While we do not expect any significant variation in trust in other people based on political affiliation (Taylor et al., 2007), the theorized stronger effect on trust in government for Republicans than Democrats leads us to expect the policy to have a stronger positive effect on acceptance for Republicans than Democrats.
Formally, we hypothesize the following:
Hypothesis 2a. The positive effect of a policy requiring drivers using self-driving technology to get a periodic certification to operate self-driving vehicles on trust in government will be moderated by political affiliation, such that the effect will be higher for Republicans (including Republican leaners) than Democrats (including Democrat leaners).
Hypothesis 2b. The effect of a policy requiring drivers using self-driving technology to get a periodic certification to operate self-driving vehicles on trust in other people will be positive.
Hypothesis 2c. The positive effect of a policy requiring drivers using self-driving technology to get a periodic certification to operate self-driving vehicles on acceptance of self-driving vehicles will be moderated by political affiliation, such that the effect will be stronger for Republicans (including Republican leaners) than Democrats (including Democrat leaners).
We provide our proposed research model in Figure 1.
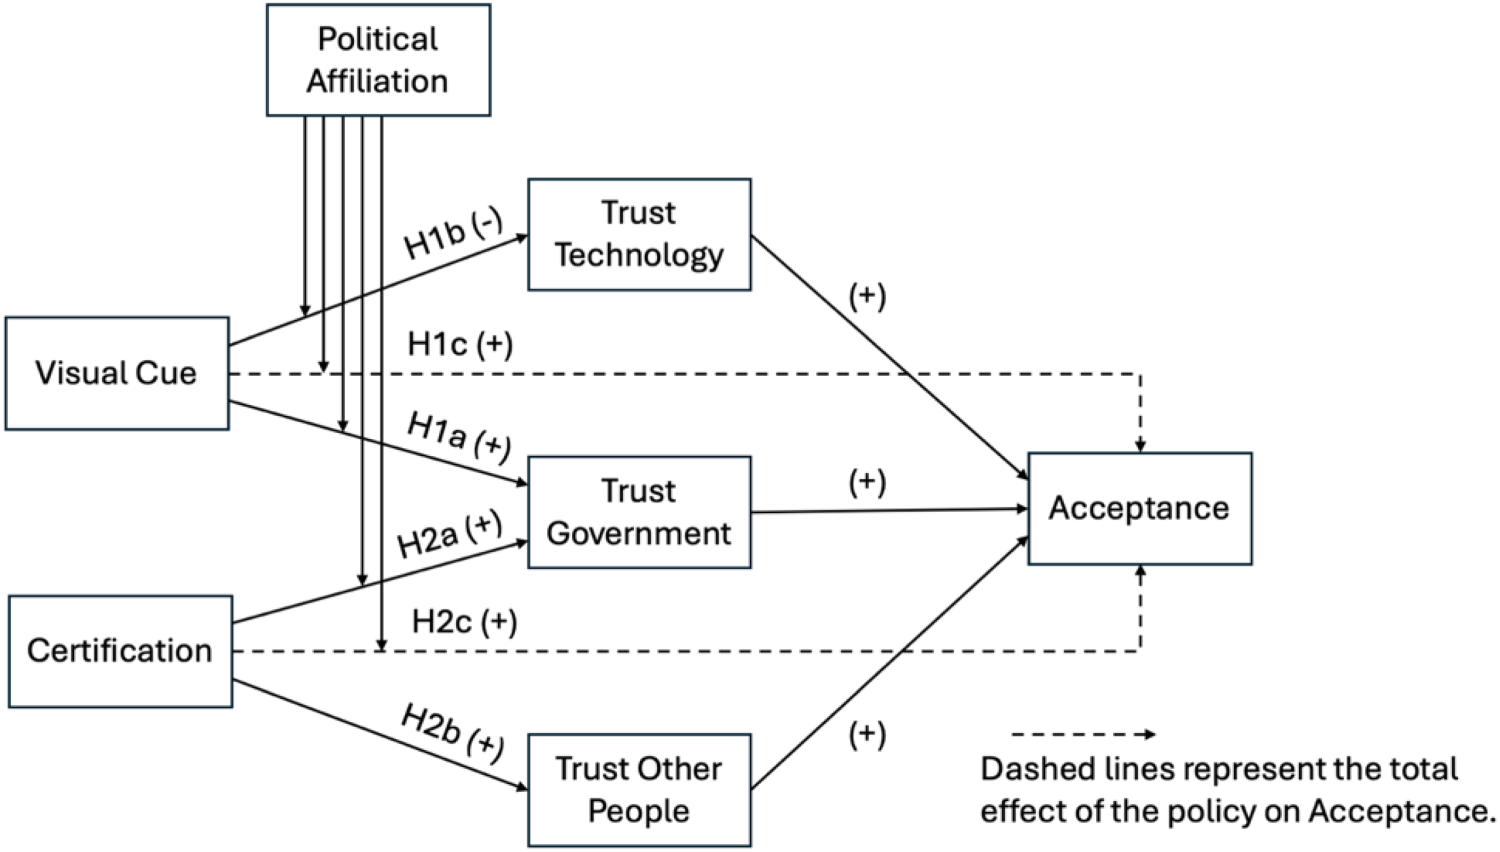
Proposed research model.
The policies chosen in this study were validated using a three-round Delphi study (Brancheau and Wetherbe, 1987; King et al., 2002; Wang et al., 2015). Our response set was limited to police officers (n = 19) and injury lawyers (n = 3). By using these two groups of experts involved in public safety issues, we are confident that the policies identified by this group reflect the concerns for safety at the societal level. In the first round, participants proposed policies that could be implemented to enhance the acceptance of autonomous vehicles within society. Each participant provided recommendations for one to three policies, resulting in a total of 51 responses. In these responses, nine unique policies were proposed. During the second round, we requested feedback from the same set of experts for their comfort level with allowing the use of self-driving technology (i) on public roads, (ii) within your city, and (iii) on freeways; if the policy was implemented. The 5-point Likert scale ranged from 1 as ‘very uncomfortable’ to 5 as ‘very comfortable.’ Fourteen experts submitted their responses. In the third round, we discussed the summarized results from the previous round with the participants. We asked if they wanted to revise their responses based on the discussion about other experts’ responses. Eleven participants were able to participate in this round, and we observed convergence in their opinions. Table 1 provides the distribution of the final scores received for the policies after the third round.
Distribution of final scores of Delphi study.
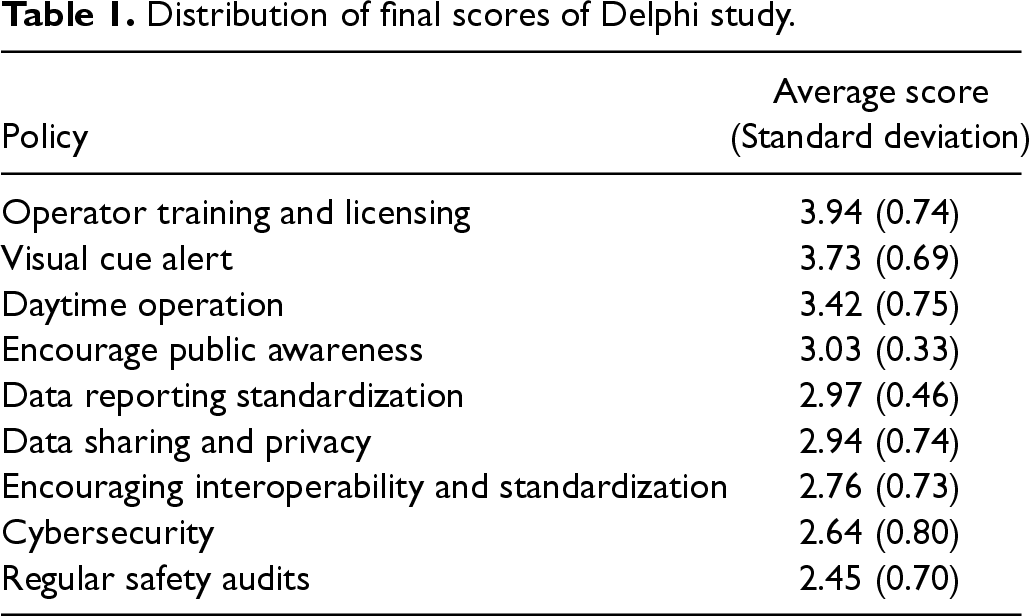
Distribution of final scores of Delphi study.
To test our hypotheses, we used a national survey company to collect data from a representative sample of the US adult population consisting of 1412 participants. A survey is an especially useful tool in this context as it provides an accessible and efficient means of obtaining insight into public attitudes and perceptions (Fowler, 2014), especially in the context of a relatively new technology like self-driving vehicles (Mack et al., 2021). Because our research questions focus on people's acceptance of self-driving vehicles being used on public roads, there is no direct user behavior to measure. Further, since researchers have not been able to collect data on user behavior relating to vehicles with higher levels of automation (because they are not yet commercially available), measuring attitudes and intentions using surveys has been the standard thus far in related studies (Mack et al., 2021).
Adults (aged 18 and older) living in the United States qualified for the study. The survey company recruited participants from a national pool to ensure a representative sample 1 of the United States was obtained. This ensured that the distribution of age, sex, and ethnicity of study participants was similar to that of the United States. We used a scenario-based, experimental survey to measure participants’ self-reported views and opinions on issues related to self-driving vehicles. We randomly assigned participants to one of four groups: control group, visual cue group, certification group, or combined group. We asked participants in the control group to respond to questions without considering any new proposed policies. We asked participants in the visual cue group to imagine the NHTSA had implemented a policy requiring vehicles to provide a visual cue when using self-driving technology when answering questions. Similarly, we asked participants in the certification group to provide responses after imagining a policy was implemented requiring drivers to obtain periodic certification to verify knowledge of how and when to use the technology. We performed a randomization check to ensure that there were no major differences in the participants among the different treatment conditions. This analysis is provided in Table A.2 in Appendix A of the online companion.
Finally, at the beginning of the survey, participants were presented with introductory information that outlined the current NHTSA guidelines and the specific manipulation treatments utilized in the study. Participants were then tasked with responding to two questions: one pertaining to their understanding of the current NHTSA guidelines and another regarding their comprehension of the manipulation treatments. These questions were asked to ensure that participants understood the design accurately. If any participants failed to answer either of these two questions correctly, their corresponding data records were removed from the analysis to ensure the integrity of the results. A total of 90 responses were removed, with 41 for the first question and 49 for the second question due to failure in the two screening questions. To assess whether the failure rates were statistically different across these treatment conditions, we conducted analyses of variance (ANOVA). The resulting p-values of 0.856 and 0.553 for treatment groups and political orientation, respectively, indicate that the failure rates were not significantly different across these categories. In other words, the failures in the two questions were evenly distributed among the treatment groups and political orientations, suggesting no systematic bias in the data removal process.
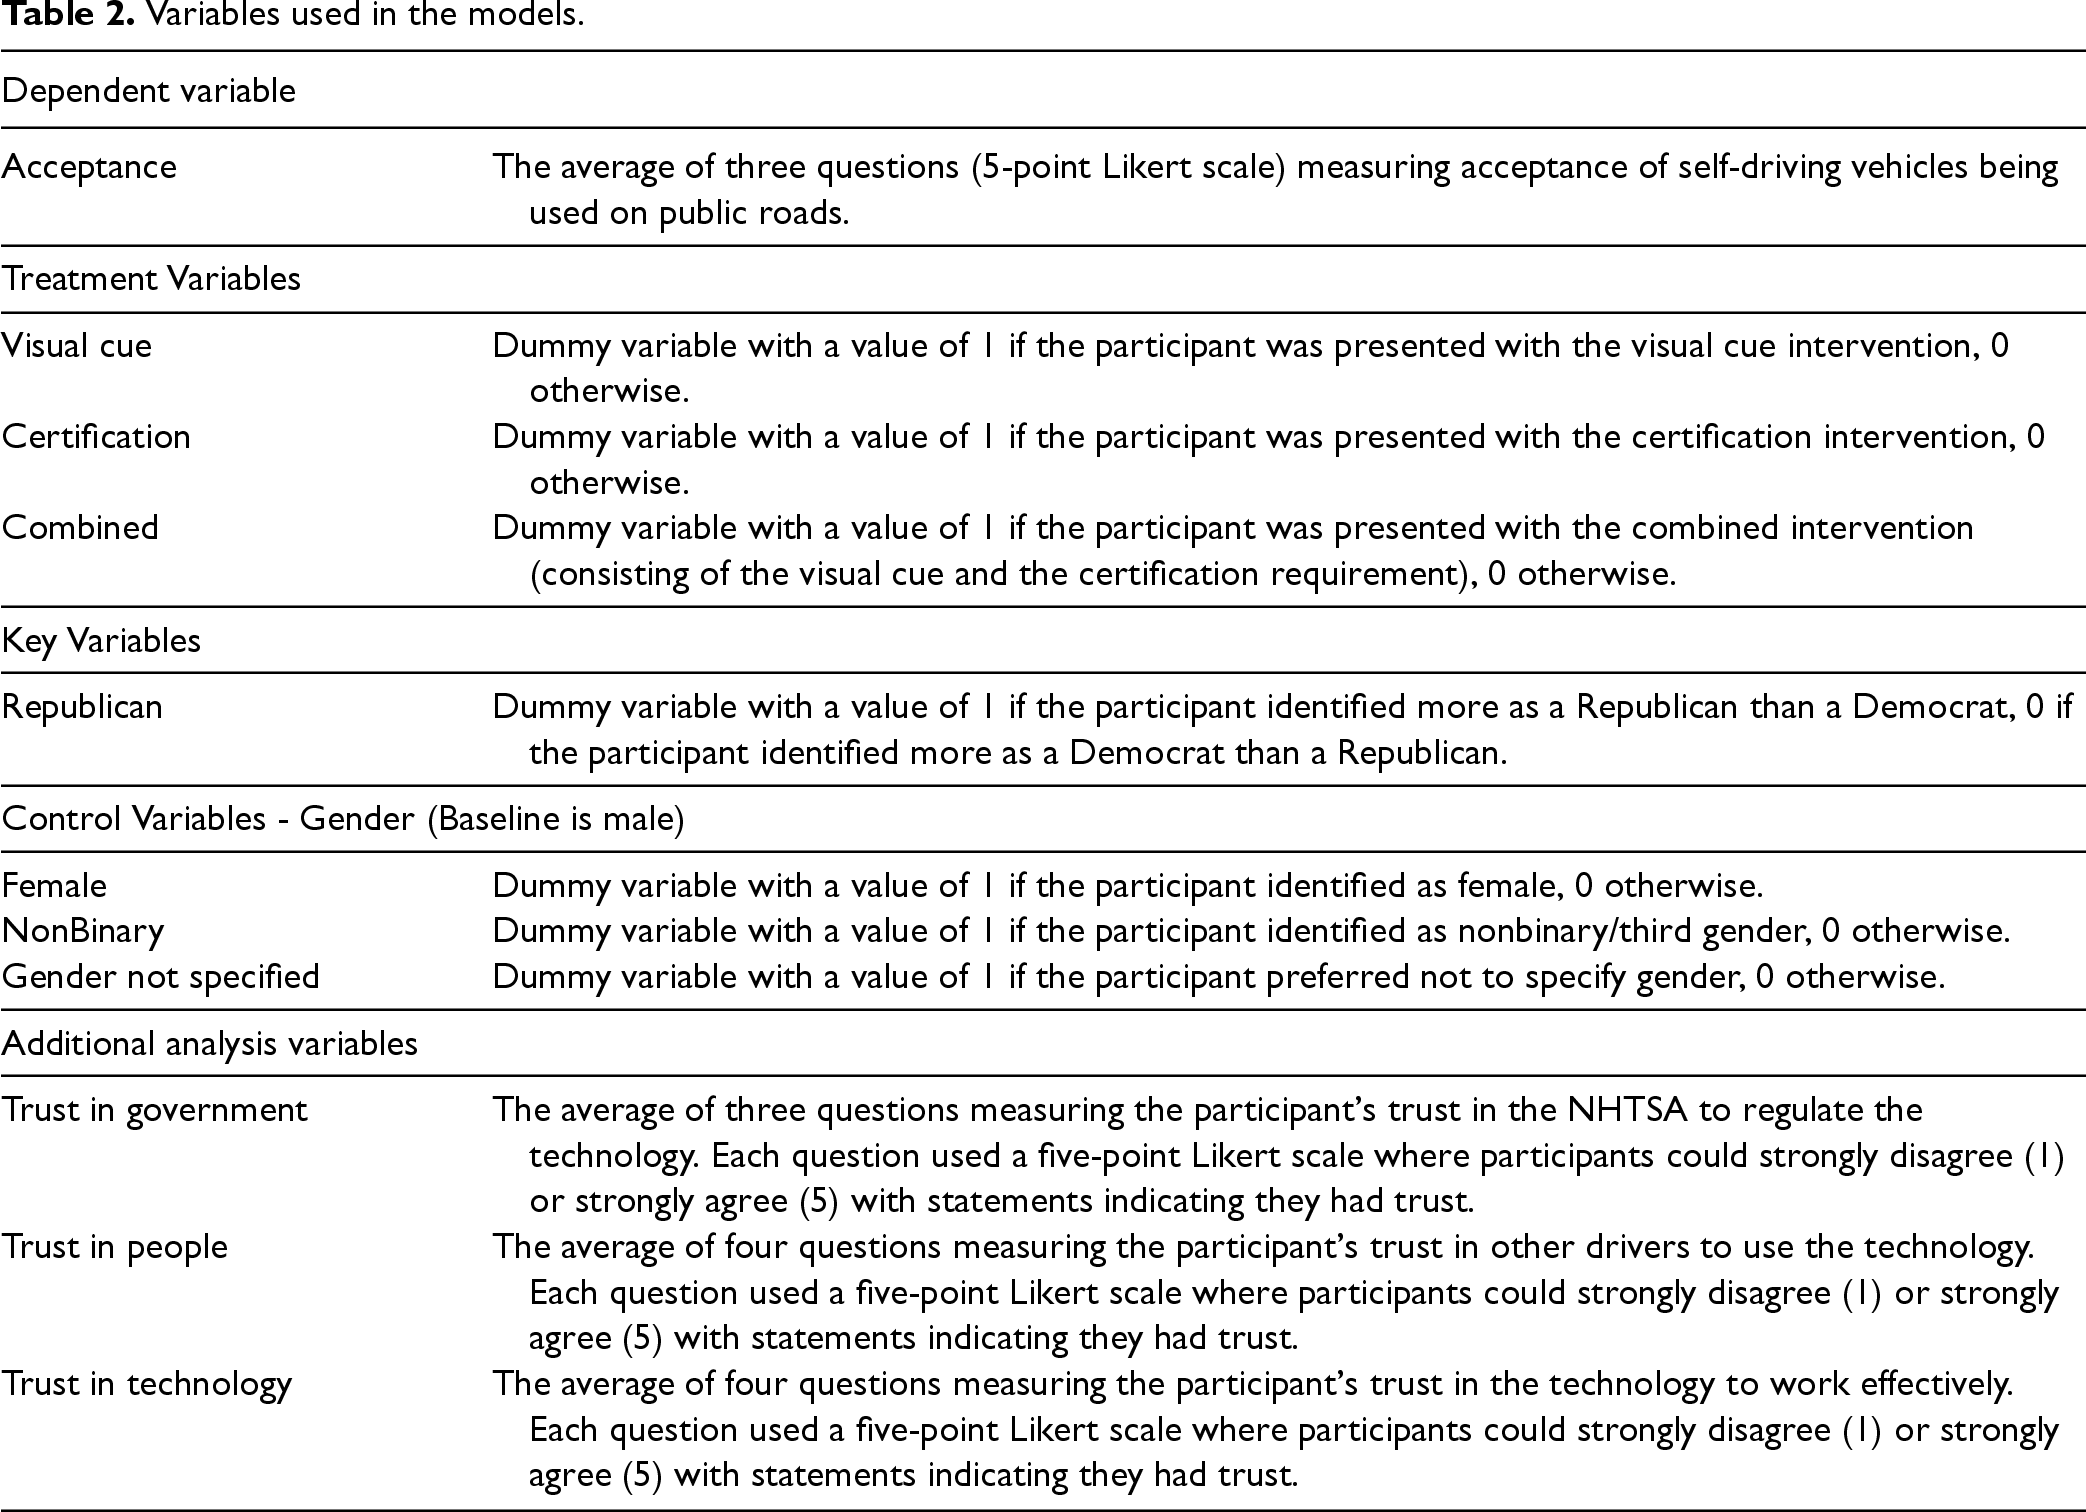
In this study, we used direct measures for the focal variables. For example, to measure their acceptance of the technology, we asked respondents how comfortable they are with allowing the use of self-driving technology on (1) public roads, (2) within their city, and (3) on freeways. They provided answers on a 5-point Likert scale ranging from very uncomfortable to very comfortable. In addition to answering questions about their acceptance of the technology, we asked participants about their trust in the NHTSA to regulate the technology, the technology to function correctly, and other drivers to understand how and when to use the technology. Within the survey, technical terms regarding specific SAE levels of automation were not used because the general public is not familiar with these nuanced levels of automation. This is consistent with other studies and surveys measuring the public's opinion of the technology (Hassol et al., 2019; Mack et al., 2021).
Variables used in the models.
Variables used in the models.
The survey used in the study used multiple questions to measure some of the constructs of interest. Specifically, we used three questions to measure the dependent variable, acceptance. Further, we used three questions to measure trust in government (specifically, the NHTSA) and four questions for trust in the technology and trust in other people. We used factor analysis to ensure that the measures had the proper validity. To check if factor analysis is appropriate, we used the Kaiser-Meyer-Olkin (KMO) measure of sampling adequacy and Bartlett's test of sphericity. The KMO is 0.914, and the chi-square statistic is 14,541.21 (p < 0.000), thus indicating that factor analysis is appropriate (Hair et al., 1998). Next, we performed principal components analysis to examine the factor loading of each indicator to ensure they load above 0.60 on their own construct and do not load above 0.40 on any other construct. Table 3 shows that all factor loadings are greater than 0.6.
Convergent and discriminant validity and composite reliability tests.
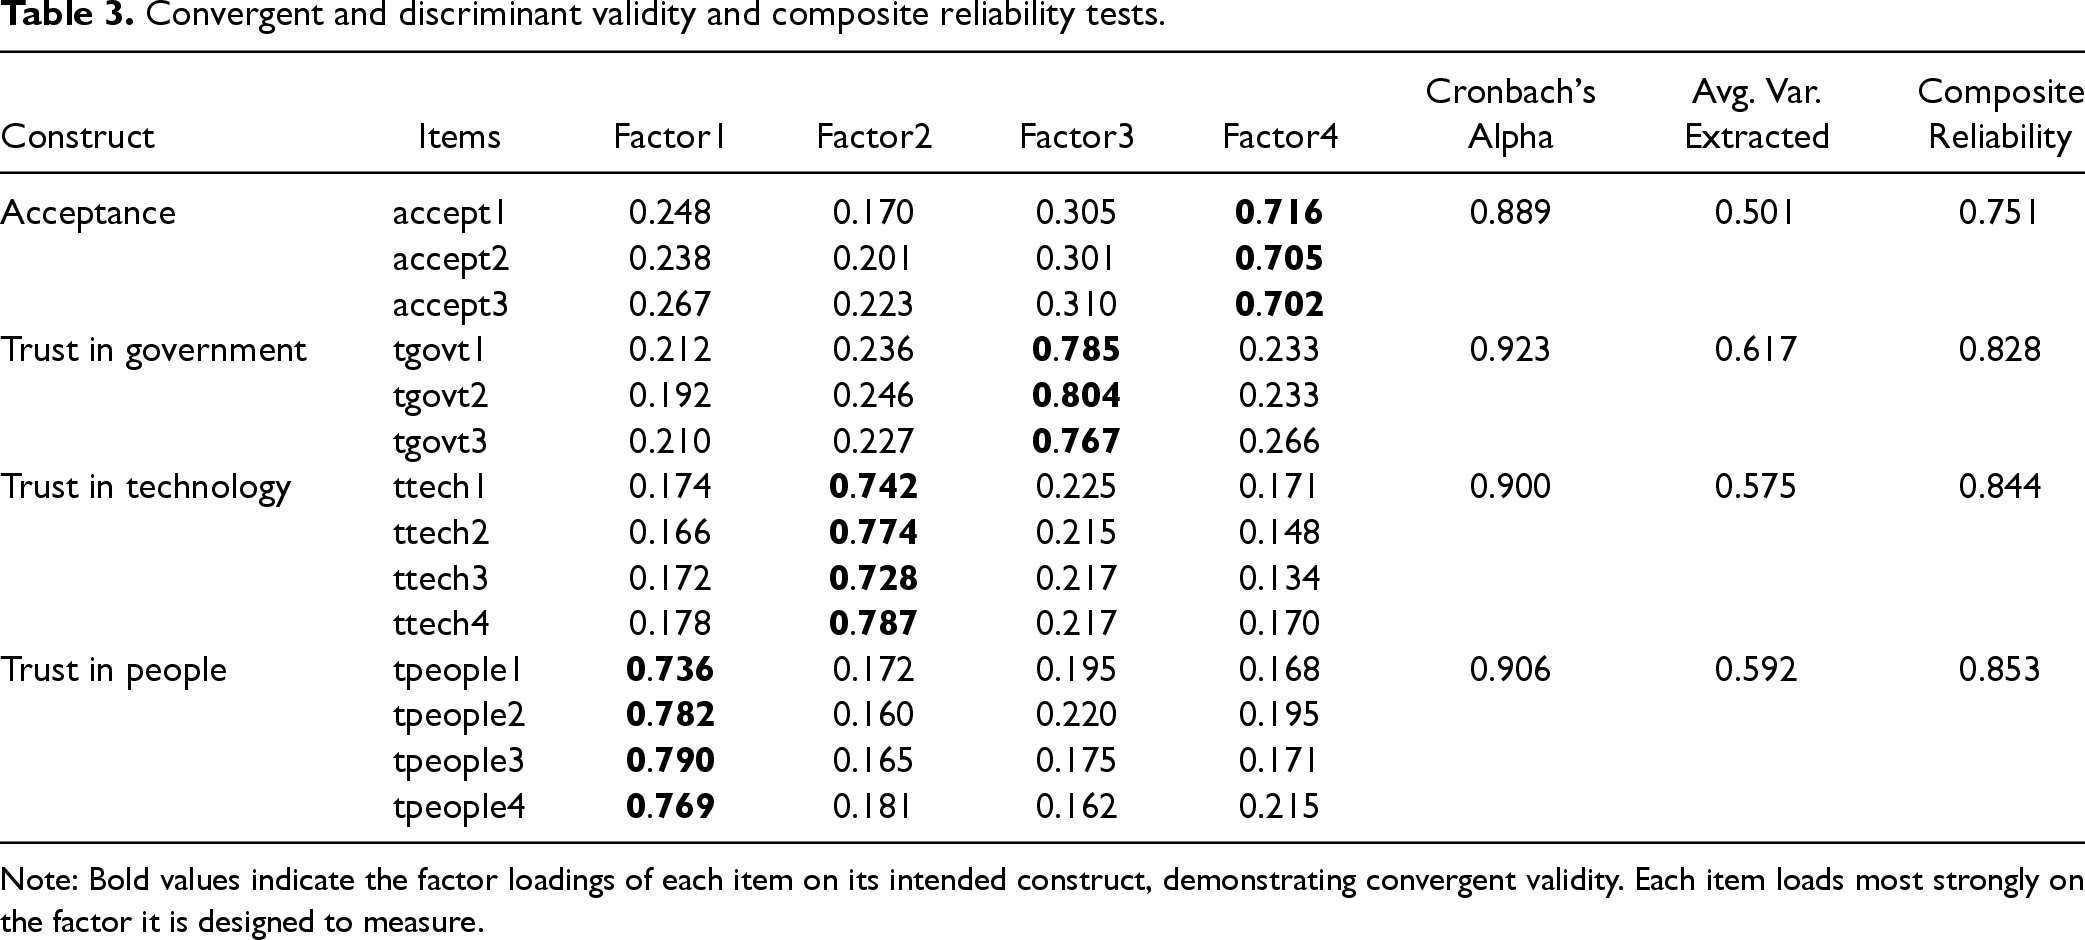
Convergent and discriminant validity and composite reliability tests.
Note: Bold values indicate the factor loadings of each item on its intended construct, demonstrating convergent validity. Each item loads most strongly on the factor it is designed to measure.
We also assessed the measures’ reliability using Cronbach's alpha and their internal consistency using composite reliability (Chin, 1998). Composite reliability is more robust than Cronbach's alpha because it weighs items differently depending on factor loading considerations (Agarwal and Karahanna, 2000). A Composite reliability value of 0.70 or higher is considered adequate (Fornell and Larcker, 1981). Table 2 shows that all composite reliability scores are greater than 0.70. Further, all Cronbach's alpha scores are also above 0.70, indicating high reliability and stability for the measurement items of each construct.
To establish convergent validity, we used the three standards recommended by Bagozzi and Yi, (1988): (1) all indicator factor loadings should exceed 0.5 (Hair et al., 1998); (2) Composite reliability should be above 0.7; and (3) the average variance extracted (AVE) of every construct should exceed 0.5 (Fornell and Larcker, 1981). As Table 3 shows, the indicator factor loading of every item in the measuring model of this study exceeded 0.7, and the items did not load on any other factor. The composite reliability of constructs ranged from 0.751 to 0.853. AVE ranged from 0.501 to 0.617, meeting all conditions for convergent validity.
Table 4 shows the matrix of correlation coefficients for all constructs in this research. Diagonal elements are the square roots of average variance extracted for the constructs. The correlation coefficients between any two constructs are smaller than the square root of the average variance extracted for the constructs. Constructs in the measurement model of this research are indeed different from one another, indicating that all constructs in this research carry sufficient discriminant validity. Therefore, the measurement model in this research shows satisfactory reliability, convergent validity, and discriminant validity (Hair et al., 2011).
Correlation matrix and average variance extracted.
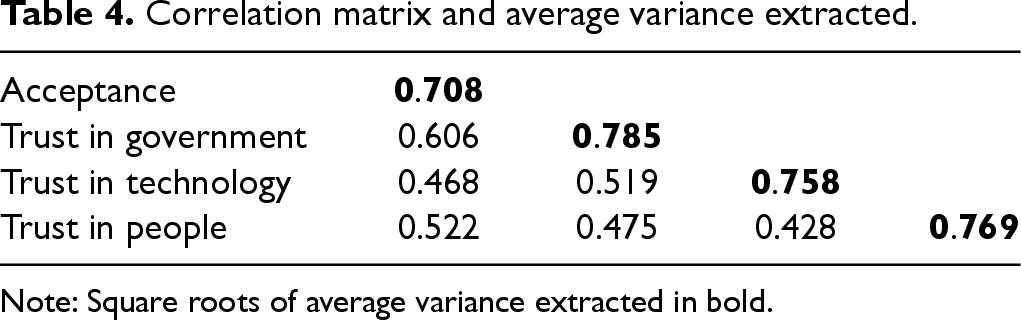
Note: Square roots of average variance extracted in bold.
We used OLS regression as it is well-suited to our research question and the nature of our data. It is particularly appropriate when studying linear relationships between variables, which is a primary focus of our analysis. Table 5 lists the means, standard deviations, and Pearson correlations among the focal variables used in the analyses. Some variables provided are not used directly in our hypothesis testing but are used in the Additional Analysis section.
Means, standard deviations, and Pearson’s correlations of focal variables.
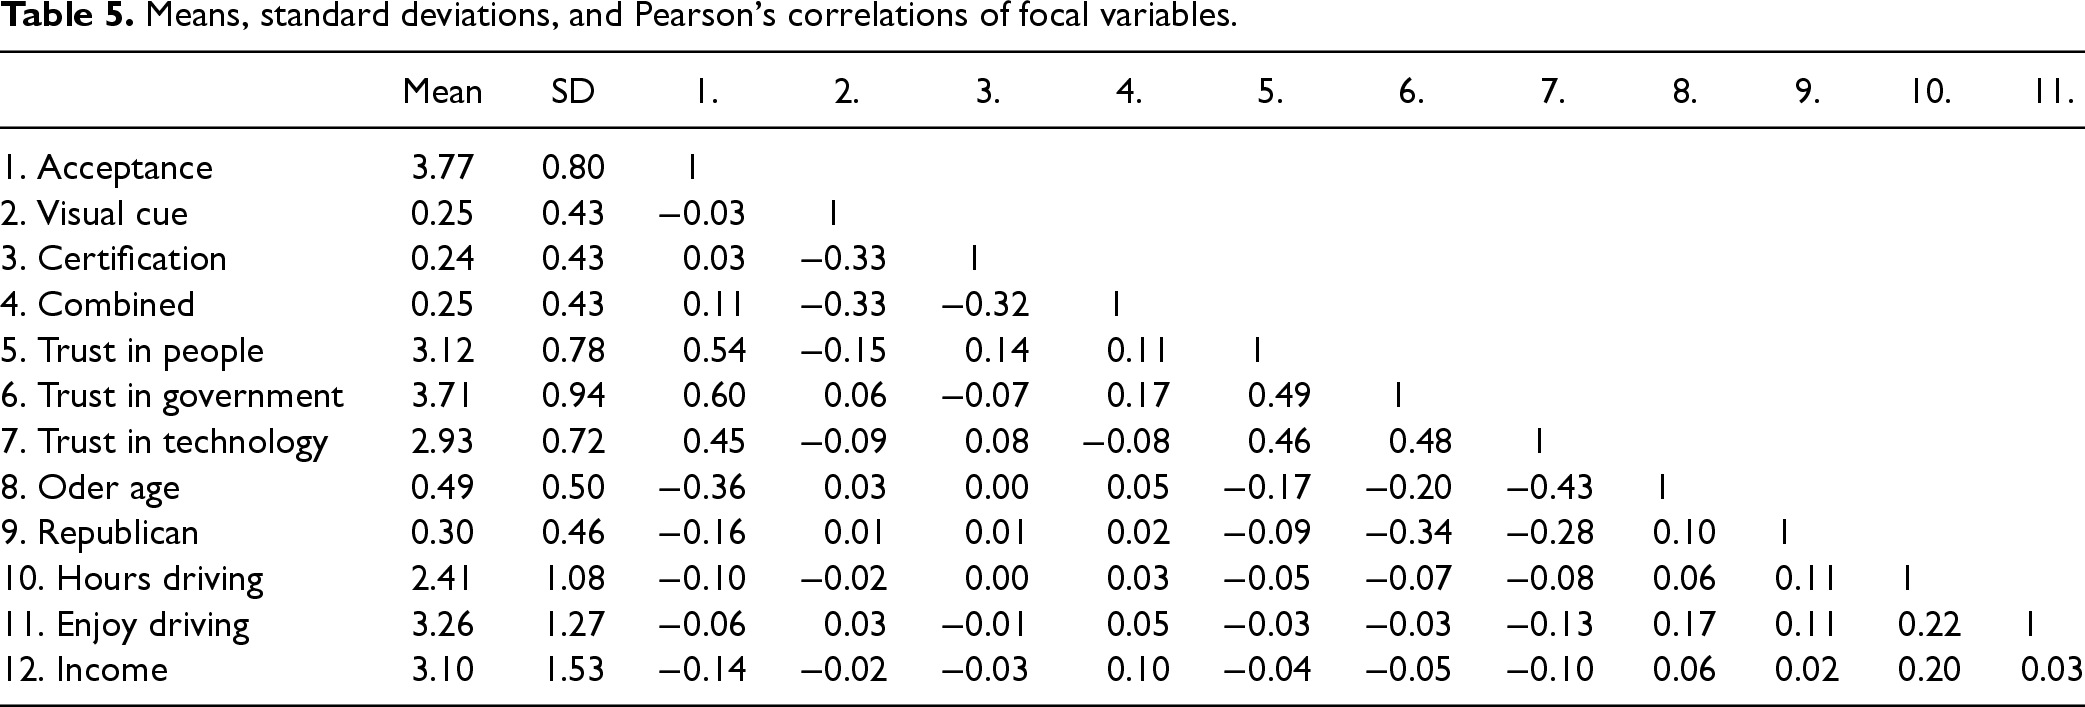
Means, standard deviations, and Pearson’s correlations of focal variables.
Additional summary statistics for the full sample, Republican subset, and Democrat subset are provided in Table A.3 in Appendix A of the online companion.
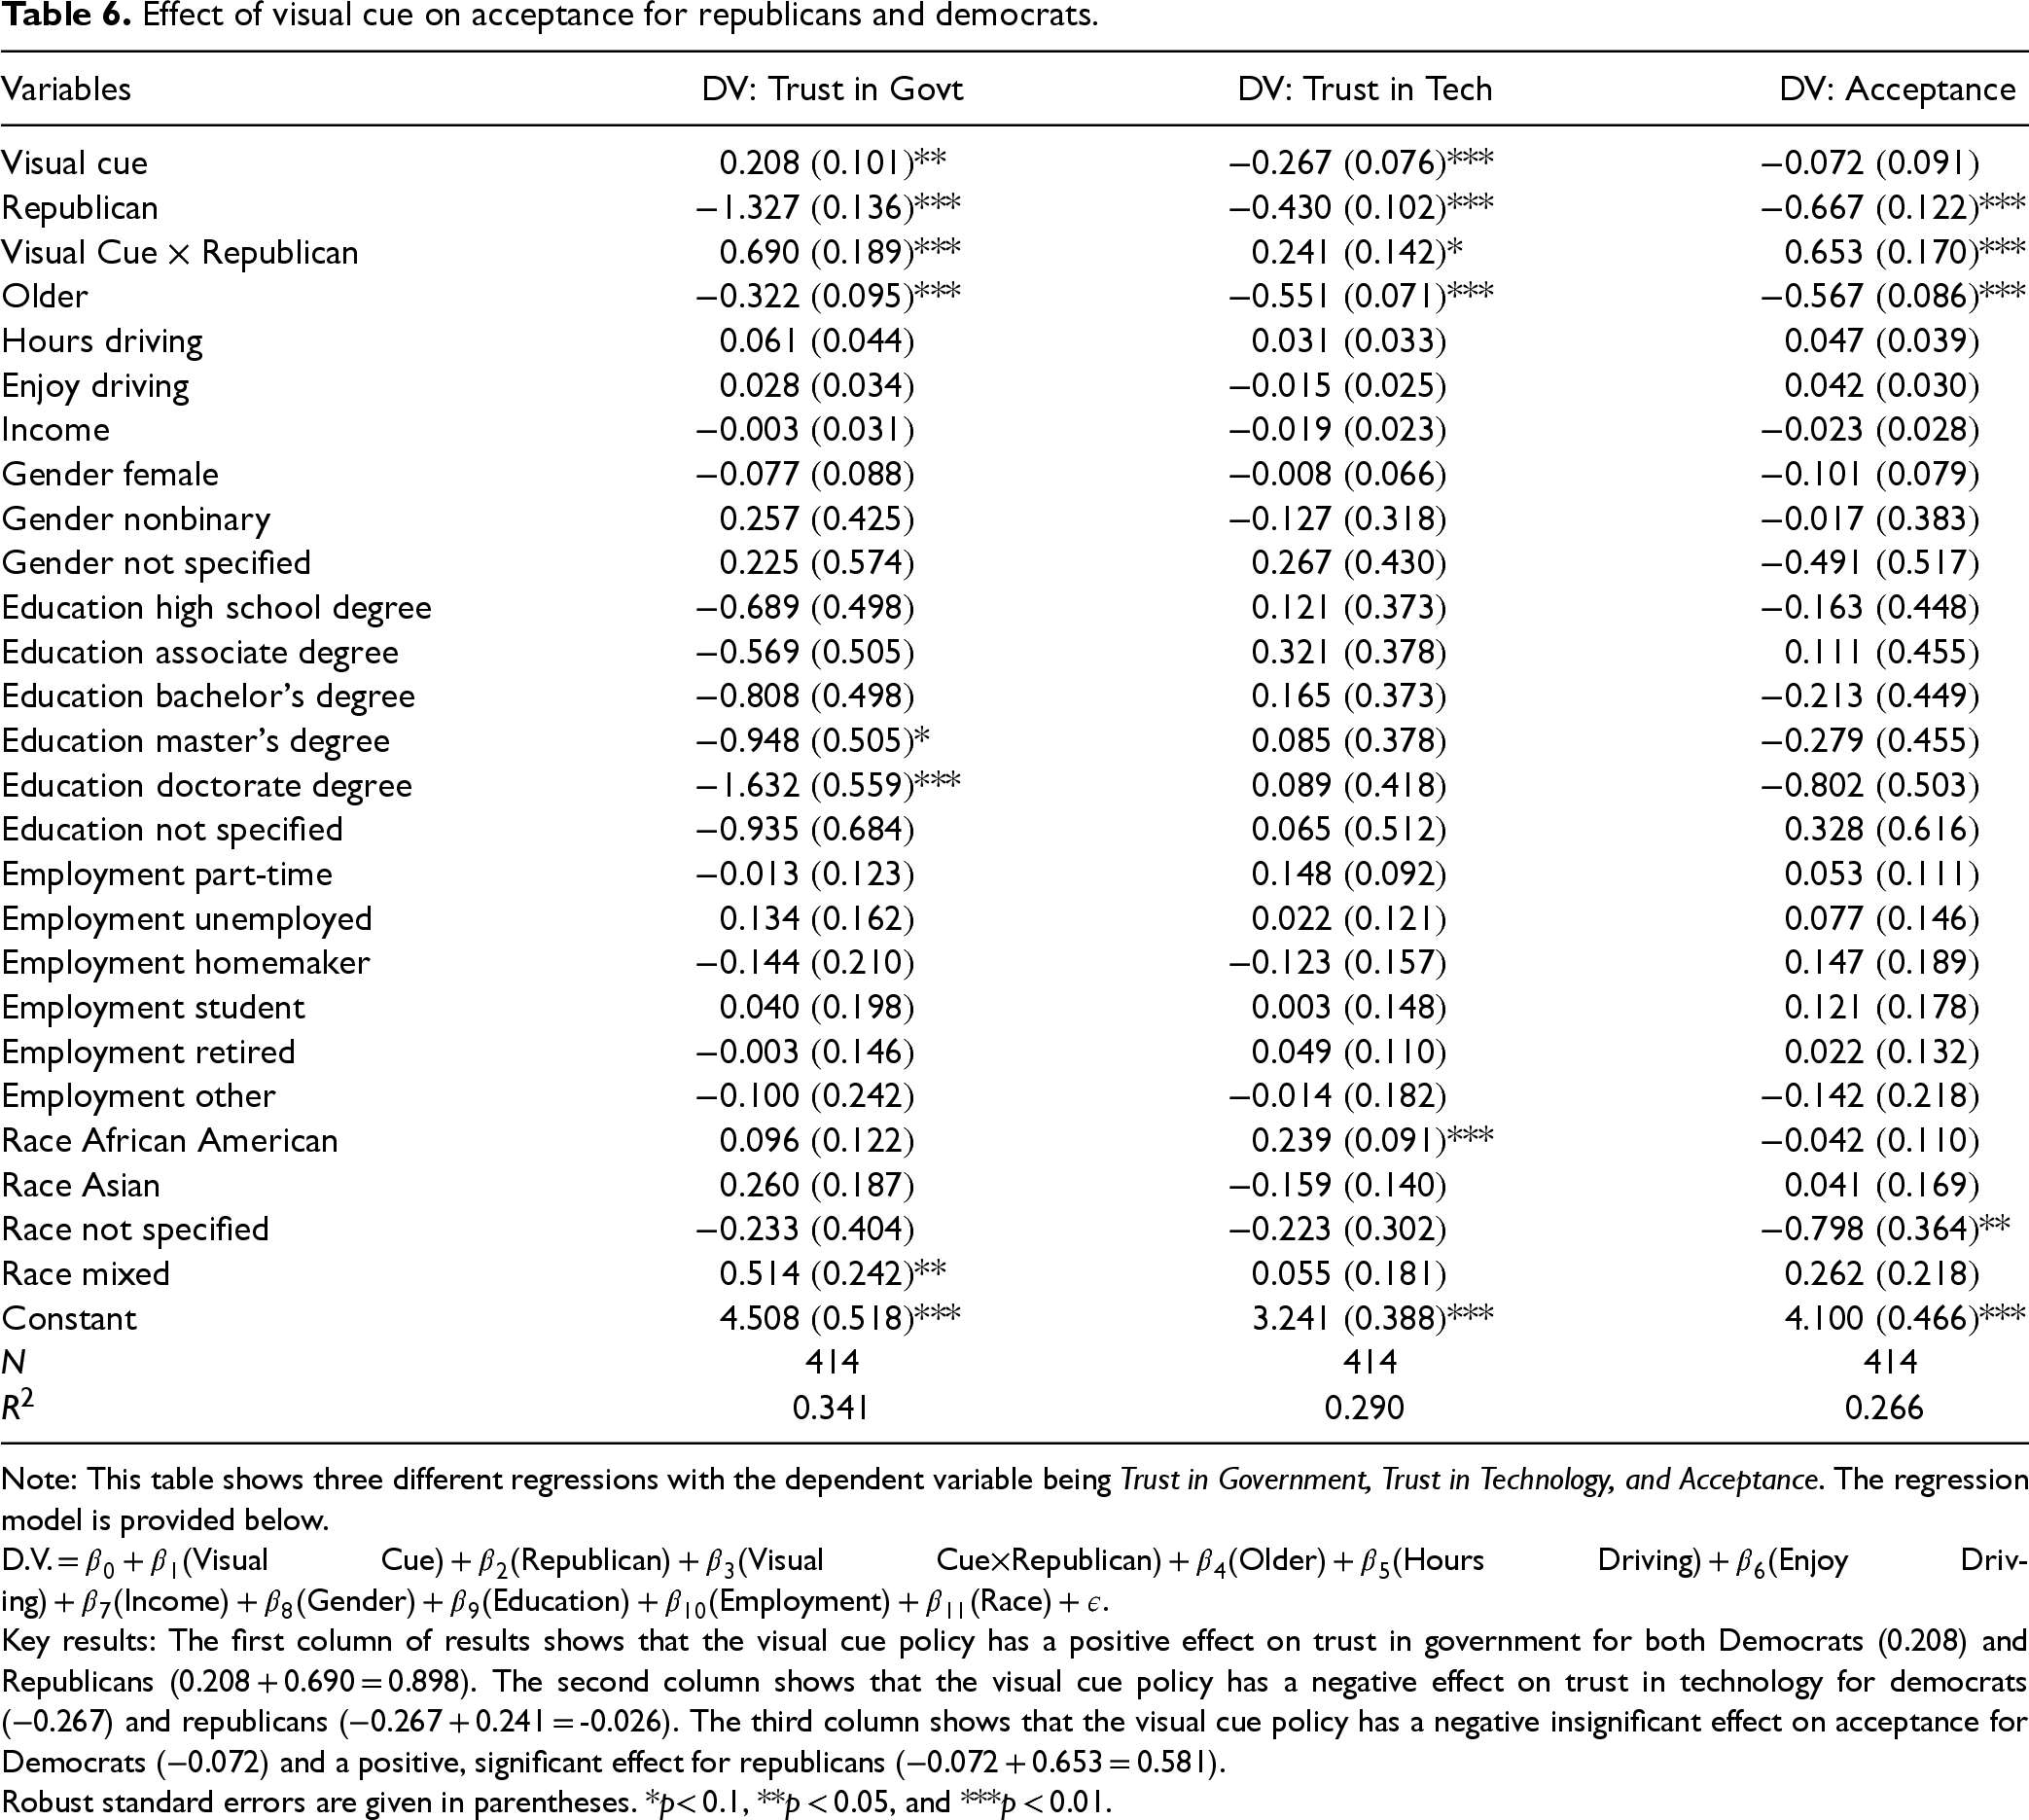
Hypothesis 1a is that a policy requiring a visual cue when a vehicle is using self-driving technology will have a positive effect on trust in government, with the effect being stronger for Republicans than Democrats. Table 6 shows the regression results with the two relevant dimensions of trust and acceptance as the dependent variables. The first column of results shows the regression coefficients for trust in government. For Democrats, we look at the main effect of Visual Cue to evaluate the impact of the policy. The coefficient of Visual Cue is 0.208, which is positive and significant (p = 0.04). To evaluate the effect for Republicans, we must calculate the combined coefficient by adding the main effect of the Visual Cue (0.208) and the interaction term for Visual Cue x Republican (0.690). This results in a combined coefficient of 0.898 (p < 0.001), which is positive and significant. These results provide support for Hypothesis 1a.
Effect of visual cue on acceptance for republicans and democrats.
Effect of visual cue on acceptance for republicans and democrats.
Note: This table shows three different regressions with the dependent variable being Trust in Government, Trust in Technology, and Acceptance. The regression model is provided below.
D.V. = β0 + β1(Visual Cue) + β2(Republican) + β3(Visual Cue×Republican) + β4(Older) + β5(Hours Driving) + β6(Enjoy Driving) + β7(Income) + β8(Gender) + β9(Education) + β10(Employment) + β11(Race) + ε.
Key results: The first column of results shows that the visual cue policy has a positive effect on trust in government for both Democrats (0.208) and Republicans (0.208 + 0.690 = 0.898). The second column shows that the visual cue policy has a negative effect on trust in technology for democrats (−0.267) and republicans (−0.267 + 0.241 = -0.026). The third column shows that the visual cue policy has a negative insignificant effect on acceptance for Democrats (−0.072) and a positive, significant effect for republicans (−0.072 + 0.653 = 0.581).
Robust standard errors are given in parentheses. *p< 0.1, **p < 0.05, and ***p < 0.01.
Hypothesis 1b is that the visual cue policy will have a negative effect on trust in technology, with the effect being stronger for Democrats than Republicans. The second column of results shows the regression coefficients for trust in technology. For Democrats, the coefficient for the visual cue policy is −0.267, which is negative and significant (p < 0.001). For Republicans, the combined coefficient (Visual Cue + Visual Cue x Republican) is −0.267 + 0.241 = −0.026 (p = 0.825), which is insignificant. This provides support for Hypothesis 1b.
Hypothesis 1c is that the visual cue policy will have an overall positive effect on the acceptance of self-driving technology, with the effect being stronger for Republicans than Democrats. The third column of results shows that for Democrats, the coefficient is −0.072 (p = 0.431), which is not significant. For Republicans, the combined coefficient is −0.072 + 0.653 = 0.581 (p < 0.001). These results show that there is no significant effect on acceptance for Democrats and a positive significant effect for Republicans, providing support for Hypothesis 1c.
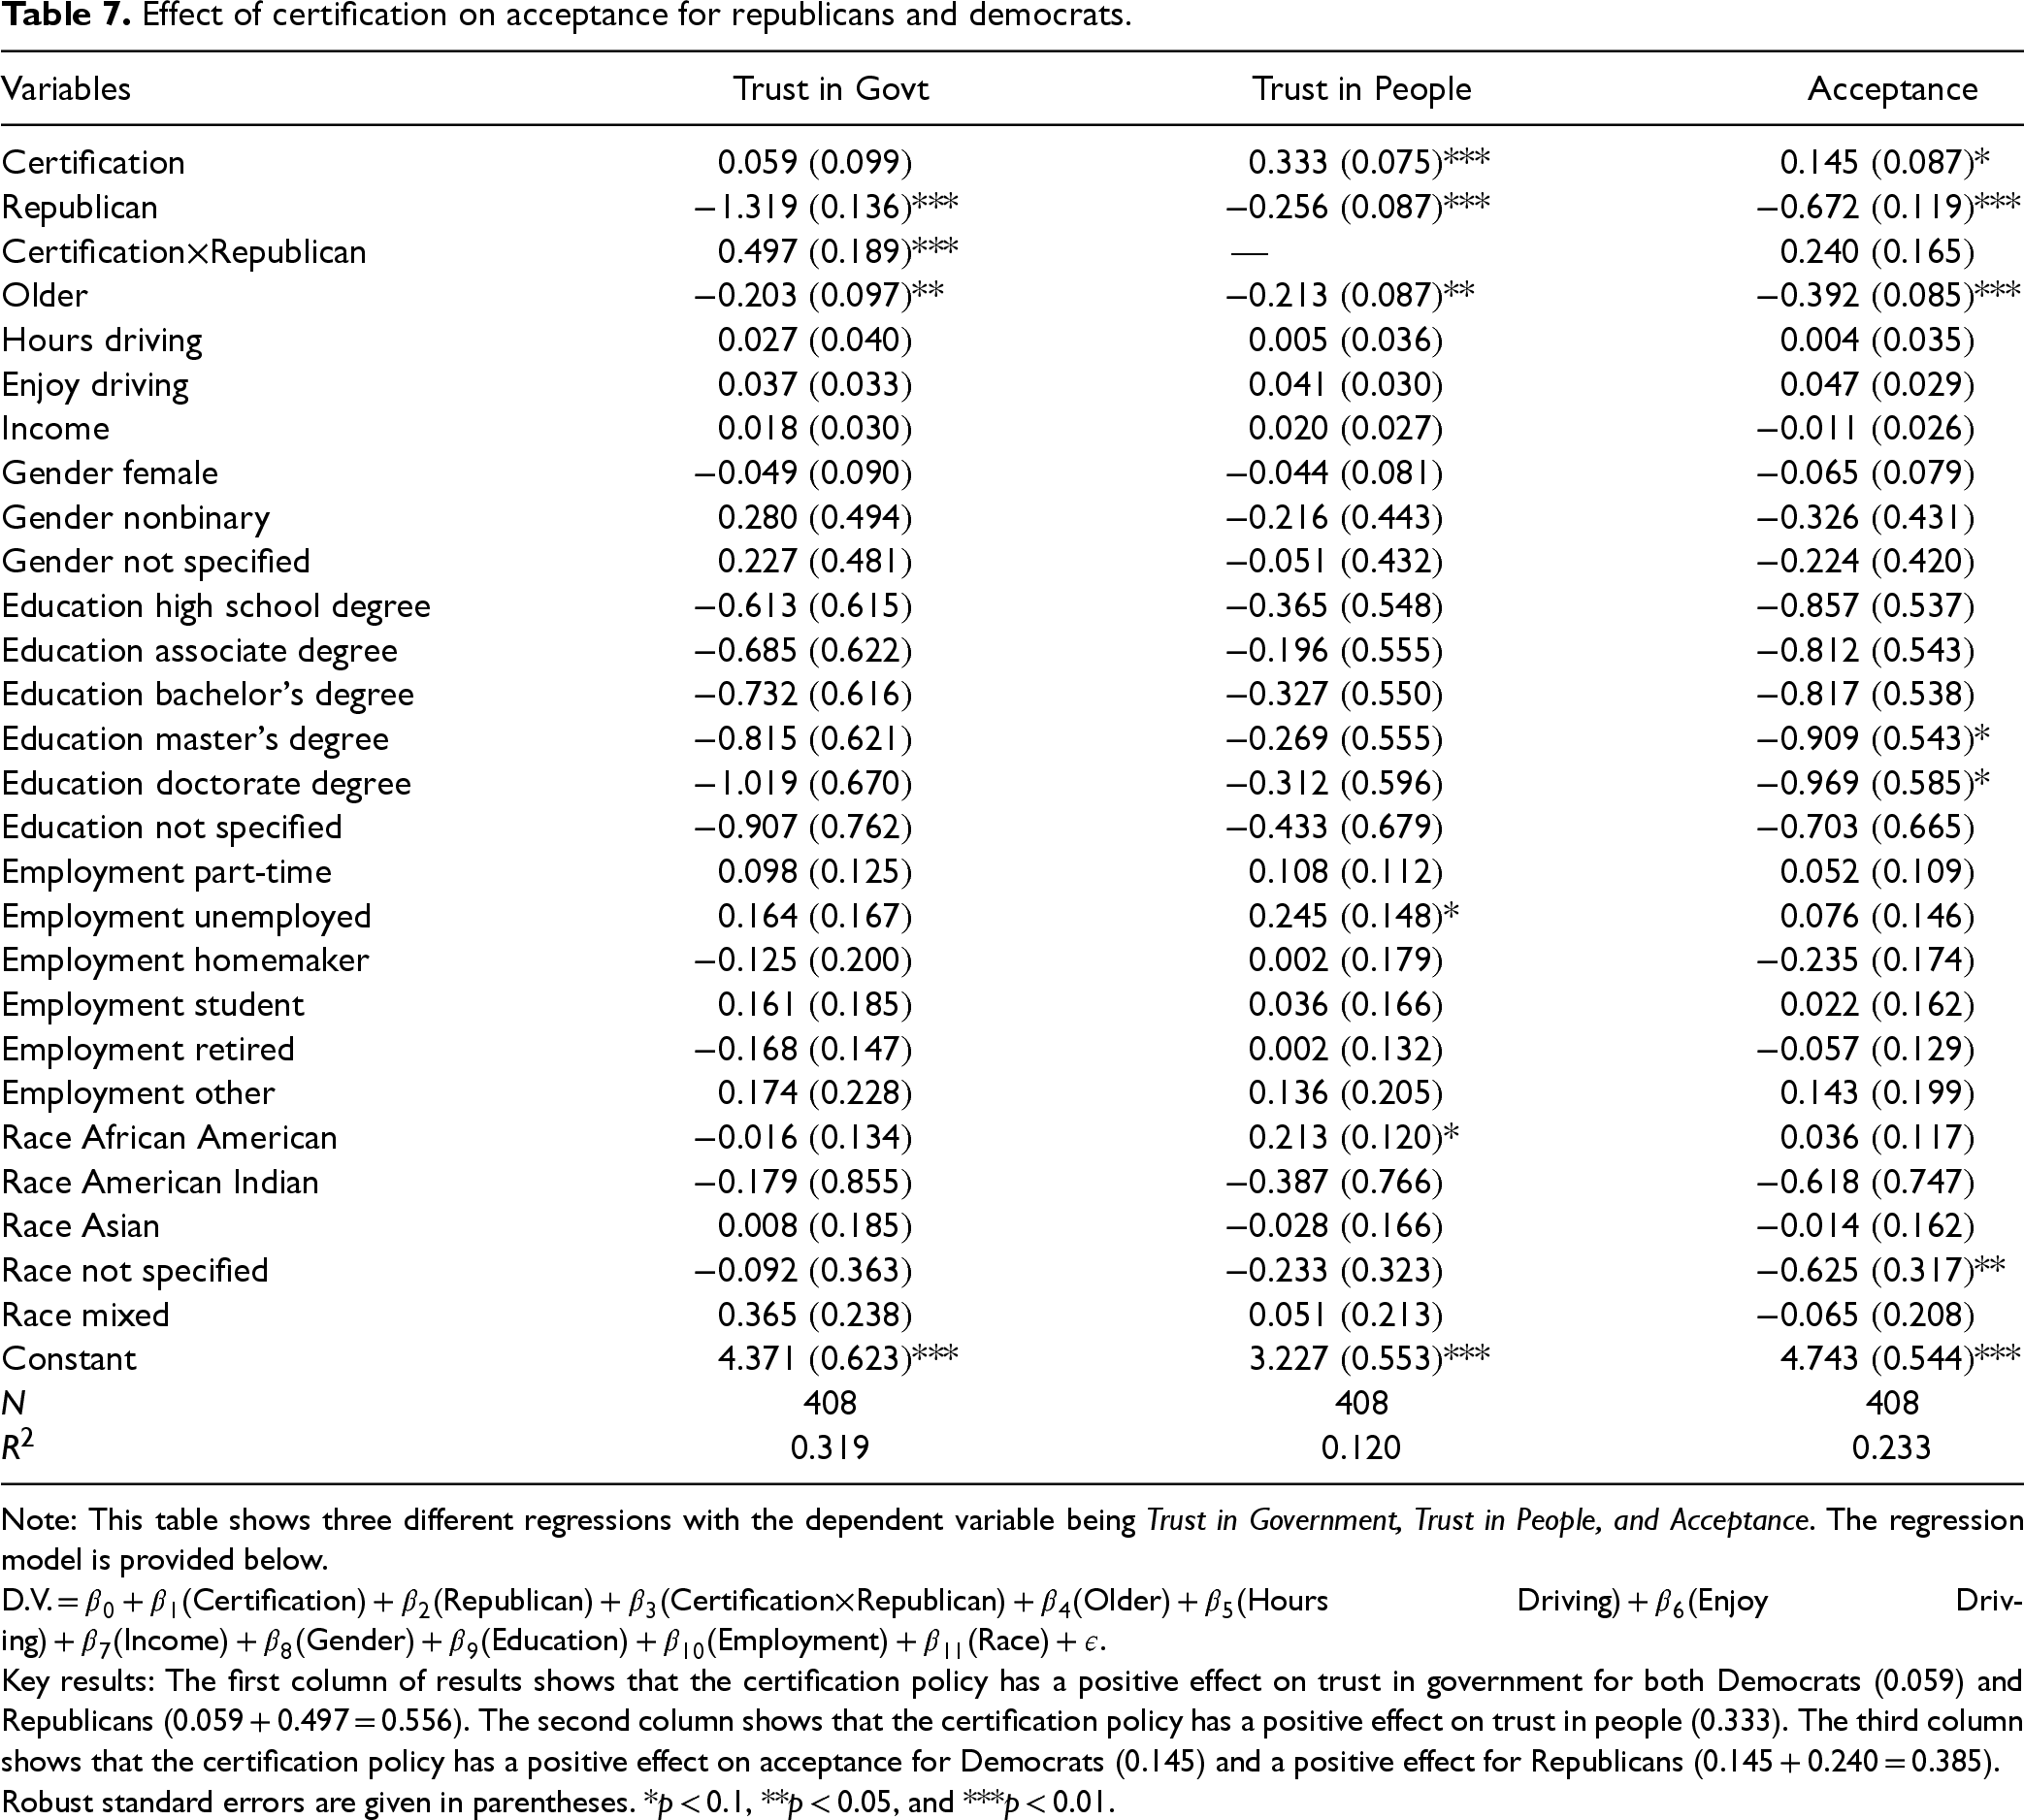
Hypothesis 2a is that a policy requiring drivers using self-driving technology to get a periodic certification will have a positive effect on trust in government, with the effect being stronger for Republicans than Democrats. Table 7 shows the regression results with the two relevant dimensions of trust and acceptance as the dependent variables. The first column of results shows the regression coefficients for trust in government. For Democrats, the coefficient of the certification policy is 0.059, which is insignificant (p = 0.550). For Republicans, the combined coefficient would be Certification + Certification x Republican, which is 0.059 + 0.497 = 0.556 (p < 0.001). These results provide support for Hypothesis 2a.
Effect of certification on acceptance for republicans and democrats.
Effect of certification on acceptance for republicans and democrats.
Note: This table shows three different regressions with the dependent variable being Trust in Government, Trust in People, and Acceptance. The regression model is provided below.
D.V. = β0 + β1(Certification) + β2(Republican) + β3(Certification×Republican) + β4(Older) + β5(Hours Driving) + β6(Enjoy Driving) + β7(Income) + β8(Gender) + β9(Education) + β10(Employment) + β11(Race) + ε.
Key results: The first column of results shows that the certification policy has a positive effect on trust in government for both Democrats (0.059) and Republicans (0.059 + 0.497 = 0.556). The second column shows that the certification policy has a positive effect on trust in people (0.333). The third column shows that the certification policy has a positive effect on acceptance for Democrats (0.145) and a positive effect for Republicans (0.145 + 0.240 = 0.385).
Robust standard errors are given in parentheses. *p < 0.1, **p < 0.05, and ***p < 0.01.
Hypothesis 2b is that the certification policy will have a positive effect on trust in other people. The second column of results shows the regression coefficients for trust in other people. The coefficient for the certification policy is 0.333, which is positive and significant (p < 0.001). This provides support for Hypothesis 2b.
Hypothesis 2c is that the certification policy will have an overall positive effect on the acceptance of self-driving technology, with the effect being stronger for Republicans than Democrats. The third column of results shows that for Democrats, the coefficient is 0.145, which is positive and significant (p = 0.096). For Republicans, the combined coefficient is 0.145 + 0.240 = 0.385 (p = 0.006). These results show that there is a positive effect for both Democrats and Republicans, but the effect is stronger for Republicans. This provides support for Hypothesis 2c.
We conducted additional analyses to test the robustness of our findings and to gain further insights. A comparison of baseline acceptance rates revealed that Republicans have a significantly lower baseline acceptance of self-driving vehicles than Democrats. Mediation analysis confirmed that trust in government, technology, and people mediates the effects of policies on acceptance. Robustness checks using different age cutoffs, alternative measures of political affiliation, and state-level fixed effects all reinforced the consistency of our results. We also evaluated two additional policies: a combined policy requiring both a visual cue and certification, and a policy limiting self-driving vehicle operation to daytime hours. The combined policy proved more effective for the general population than any policy in isolation, while the daytime hours policy yielded similar effects to the visual cue policy. The full details of these analyses are provided in Appendix C of the online companion.
Discussion
As companies develop self-driving technology, a key challenge they face is increasing public acceptance, which is crucial for securing favorable legislation to continue developing the technology (Kaur and Rampersad, 2018). While past studies have defined acceptance as one's intention to use technology (Davis, 1989; Venkatesh et al., 2003), in our research, acceptance has a broader social dimension. Rather than reflecting personal adoption, we investigate acceptance as it relates to the willingness to permit the technology's use by others on shared public roads. This distinction is essential, as acceptance requires public trust in the regulatory oversight and safe integration of the technology into society, even if individuals may not personally choose to use it.
Our analysis reveals that proposed policies impact trust and acceptance differently among Republicans and Democrats. The visual cue policy increases trust in government for both groups, with a stronger effect on Republicans, while it reduces trust in the technology, especially among Democrats. This leads to a positive effect on acceptance for Republicans but no significant effect for Democrats. A certification policy improves acceptance across both groups. Additional analysis (detailed in the online companion) indicates that Republicans exhibit lower baseline acceptance of self-driving technology compared to Democrats, primarily due to lower trust in the technology and its regulation. Mediation analysis reveals that the visual cue policy's effects are driven by trust in government and technology, while the certification policy's effects are mediated by trust in government and people. Notably, a combined policy incorporating both visual cues and certification is the most effective, enhancing acceptance through all three dimensions of trust: government, people, and technology. These findings underscore the importance of addressing multiple trust factors to increase public acceptance of self-driving technology.
From the control variables used, three results are worth noting. The negative coefficient of Older indicates that older participants are less likely to accept self-driving technology. This finding is consistent with extant literature on technology acceptance in general (Hauk et al., 2018) and self-driving vehicles in particular (Lee et al., 2017). Our results also show that gender has no significant impact on the acceptance of self-driving technology. In general, males have been found to have more liking towards adopting self-driving technology (Rainie et al., 2022). Though our results do not show significance, qualitatively, they show a similar effect. The negative coefficient of Gender Female indicates that females, compared to males, are less likely to accept self-driving technology. Lastly, our findings reveal a negative correlation between income and acceptance of self-driving technology, indicating that individuals with lower incomes tend to be more receptive to the idea of self-driving vehicles becoming a part of society. This finding contradicts the prevailing literature on individual adoption, which typically associates higher income levels with a greater willingness to own self-driving technology (Liu et al., 2019). However, when it comes to the broader societal acceptance of self-driving vehicles on our roads, our research suggests that higher-income individuals may be less inclined to support the integration of this technology into society. This implies that while they may be comfortable owning such vehicles themselves, they may have reservations about their widespread adoption by the general population. This finding may be worth exploring in future research.
In Appendix C of the online companion, we provide an interpretation of our results using the Net Promoter Score framework (Reichheld, 2003), which groups respondents into three categories: detractors, passives, and promoters. This analysis shows there is no clear winner between the two policies. If the NHTSA cares about increasing promoters, then the visual cue may be a better policy. However, if the priority is reducing detractors, then certification would be a better policy. These findings offer practical guidance and insights for policymakers looking to enact regulations dealing with this emerging technology. Governmental regulations can directly affect emerging technologies (Jiang et al., 2018; Wang et al., 2018), and the current hands-off approach has created concerns among the public (Dixon et al., 2020). High-profile failures, including fatal accidents, lead people to lose trust and develop a fear that the technology may not be safe (Kaur and Rampersad, 2018). Therefore, regulations should be practical and sensible, with clear safety benefits to raise acceptance and alleviate safety concerns. However, as we have shown, the same policy affects heterogeneous sub-populations differently. Therefore, a multi-faceted approach should be used to appeal to the largest group possible.
In this study, we also highlight an opportunity for information systems research to reconsider how technology acceptance is defined, particularly in controversial disruptive technologies. The prominent approach of defining acceptance as one's intention to use technology has produced many valuable insights (Davis, 1989; Venkatesh et al., 2003). However, as we have discussed in the context of self-driving vehicles, this definition may not be sufficient when the success of the technology relies not only on people's intention to use it but also on their acceptance of others using it as well. For instance, a similar context that may benefit from research using a modified definition of acceptance is that of drones. The use of drones, both recreationally and commercially, has increased dramatically over the last ten years and laws and regulations are still regularly being updated and created (NCSL, 2021). Issues relating to safety, privacy, and misuse cause many people to be cautious about the degree to which society embraces the new technology (Aydin, 2019; Clothier et al., 2015).
Future research that provides insights and guidance to policymakers as they develop regulations for the technology would benefit from defining acceptance in terms of accepting the use of the technology by others around them. Such research could further explore the complexities involved with political orientation and other factors that are often correlated. In our study, we have included several demographic control variables to help disentangle the effect of political ideology. Still, other variables are likely correlated with political ideology that were not captured in this study, and the interconnected nature of these factors introduces complexity in interpreting their effects. Longitudinal studies may provide additional insight into how opinions and trust levels change. Additionally, future studies may look to consider whether our findings would apply to emerging technologies that are much earlier in the process of development, such that the technology has not yet been deployed on any level, or when the use of the technology by one group of people does not directly affect those not using the technology. In these cases, the public may respond differently to government intervention.
We acknowledge that additional policies related to self-driving technology may also influence public acceptance. Future research could explore these policies to better understand their unique characteristics and impacts. Our study focused on societal and regulatory factors, such as political ideology and trust in government regulators, but did not address individual-level concerns like potential job displacement or confidence in personal driving skills, which could provide complementary insights. We selected trust as a mediator due to its strong theoretical foundation in the technology acceptance literature (Gefen et al., 2003; Komiak and Benbasat, 2006; Söllner et al., 2016). However, future research should consider examining other potential mediators and moderators to gain a more comprehensive understanding of how policies affect acceptance. For example, individual factors such as prior experience or familiarity with self-driving technology (Hőgye-Nagy et al., 2023) could moderate policy effects. Incorporating open-ended questions and qualitative data may help identify additional mediators and moderators to enhance this line of inquiry.
Further, when considering viable policies, it is important to consider that such policies may come with a cost to the operating expenses of car manufacturers. For instance, the requirement of providing a visual cue when the vehicle is using self-driving technology would necessitate a one-time change in the assembly line, likely resulting in a minor increase in the operational manufacturing costs of such vehicles. However, the exact cost and time required for this change would need to be assessed based on the specific manufacturing processes and the scale of production. Setting up a process for continuously updating training and informing drivers of new limitations would require a more consolidated effort from the legal team and the Department of Motor Vehicles. Establishing the legal process for continuous updates to license requirements would take time, likely longer than making changes to the assembly line. A comprehensive cost-factor analysis would require expertise from various domains, such as engineering, manufacturing, political science, and legal studies.
Conclusion
As we have shown, researchers, policymakers, and technology companies considering approaches to increase acceptance of a technology should be mindful of the differing effects a policy may have on heterogeneous sub-populations. Specifically, we have shown that political affiliation can be a significant predictor in determining the effect of a policy. Our findings highlight that trust is a significant factor in determining acceptance and that different policies can affect trust differently. Understanding trust as it pertains to artificial intelligence (AI) is important as the successful acceptance of AI technologies into society will rely on trust (Berente et al., 2021; Glikson and Woolley, 2020), as we are still learning in which environments AI can make better decisions than humans (Fu et al., 2021). In the case of self-driving vehicles, we show that trust is multi-dimensional with various entities in which trust must be placed for the technology to gain acceptance.
Supplemental Material
sj-docx-1-pao-10.1177_10591478251333725 - Supplemental material for Self-Driving Technology and Its Acceptance: Explaining Differences in Reactions of the Heterogeneous Population to Potential Policies
Supplemental material, sj-docx-1-pao-10.1177_10591478251333725 for Self-Driving Technology and Its Acceptance: Explaining Differences in Reactions of the Heterogeneous Population to Potential Policies by Nicholas Sullivan, Rohit Aggarwal, Promothesh Chatterjee and Vishal Midha in Production and Operations Management
Footnotes
Declaration of Conflicting Interests
The authors declared no potential conflicts of interest with respect to the research, authorship, and/or publication of this article.
Funding
The authors received no financial support for the research, authorship, and/or publication of this article.
Notes
How to cite this article
Sullivan N, Aggarwal R, Chatterjee P and Midha V (2025) Self-Driving Technology and Its Acceptance: Explaining Differences in Reactions of the Heterogeneous Population to Potential Policies. Production and Operations Management 34(11): 3457–3474.
References
Supplementary Material
Please find the following supplemental material available below.
For Open Access articles published under a Creative Commons License, all supplemental material carries the same license as the article it is associated with.
For non-Open Access articles published, all supplemental material carries a non-exclusive license, and permission requests for re-use of supplemental material or any part of supplemental material shall be sent directly to the copyright owner as specified in the copyright notice associated with the article.