
Abstract
The indirect productivity gains related to information technology (IT), known as IT externalities, in inter-firm contexts have been extensively studied. However, the impact of IT investments within a business unit (BU) of a multibusiness firm on the productivity of other BUs remains unclear. Additionally, the conditions that facilitate such intra-firm externalities are not well understood. Research on resource externalities within multibusiness firms typically focuses on capacity-sharing benefits, where unused capacity in one unit can be utilized by another. IT resources, however, often lack capacity-sharing potential due to their full utilization or contractual limitations. Despite this, IT resources can generate non-rivalrous intangibles, such as internally developed applications, expertise, and consulting know-how, which can be shared within the firm to create externalities. This study investigates whether IT centralization (ITC), as a vertical coordination mechanism, is effective in harnessing IT externality potential arising from IT portfolio similarities (ITPSs), a form of horizontal coordination, across BUs. Utilizing data from 8,374 unique units within 866 firms from 2005 to 2020, we find that BUs must meet two conditions—higher ITPS and higher levels of ITC—to realize greater intra-firm IT externality benefits. Furthermore, these benefits accrue from IT investments made by units with a sufficient number of IT employees. Interestingly, BUs with limited access to IT employees gain more from pooled IT investments. Our findings suggest that concurrent vertical and horizontal coordination, along with access to human talent for creating knowledge, code, and expertise from digital resources, are crucial for maximizing digital resource externalities.
Keywords
Introduction
Are there intra-firm cross-unit information technology (IT) externalities, and if so, how might these be harnessed? Multibusiness firms (MBFs) are organizations where a parent firm oversees operationally independent business units (BUs) in various geographies and industries. IT assets are the largest capital investment in most MBFs, making it crucial for leaders, particularly infrastructure and operations leaders, to create value from IT portfolios across BUs (e.g., Brooks et al., 2012; Silver et al., 2020). Existing research has shown the presence of resource externalities in inter-firm settings, such as in supply chain networks (e.g., Cheng and Nault, 2012; Li et al., 2023; Lin et al., 2014). Creating IT externalities among operationally independent BUs in an MBF is an actionable way for infrastructure and operations leaders to think about creating value from the seemingly disjointed IT investments in their diverse operations. That said, whether and how IT externalities manifest within intra-firm settings, particularly across autonomous BUs of MBFs, which may not be operationally interrelated like in the case of the supply chain, is not well understood. As such, the first research question (RQ1) we address is: Can a BU in an MBF benefit from externalities that emerge from IT investments in other independent BUs within the same firm?
Creating IT externalities in intra-firm contexts is different from the externalities that other non-IT resources may create. Generally, previous research has focused on capacity-sharing as a means of producing non-IT externalities in intra-firm contexts (Cui et al., 2023; Fang et al., 2023; Qi et al., 2019; Wang et al., 2021; White et al., 2011; Xie et al., 2021). This research highlights that the unused capacity of one resource in a unit can be used by another. With these non-IT resources that have unused capacities, horizontal variation—that is, resource portfolio dissimilarity, as opposed to horizontal coordination, that is, harmony across resources owned by different units—is desired because a unit needing a resource does not have to invest in it and can instead rely on the excess capacity of that resource at other units. In turn, vertical coordination—that is, control imposed by headquarters—ensures that such unused capacity is effectively discovered and shared. This dynamic highlights that when externalities emerge due to capacity-sharing of non-IT resources, vertical and horizontal coordination act as substitutes (i.e., higher levels of vertical coordination are needed when horizontal coordination across BUs in terms of resource types is low).
This substitution argument may not apply to externalities that emerge from IT resources. IT assets are rarely idle; servers, infrastructure, and network hardware are often bought or contracted at capacity. The pay-per-use models existing for software-as-a-service, and more broadly for cloud services, further tailor these assets to the particular operations of each BU, reducing the possibility of unused capacity. Against this backdrop, we ask the second research question (RQ2): Are vertical and horizontal means of coordination substitutes or complements when reaping externality benefits from IT investments in MBFs? This study proposes and empirically examines the complementary relationship between vertical and horizontal coordination when creating intra-firm value from IT resources.
We believe that this complementary relationship exists due to the unique characteristics of IT resources. Saunders and Brynjolfsson (2016) explain that tangible expenditures on IT assets—that is, purchased hardware, infrastructure, and network assets—are often accompanied by intangible value-creating byproducts, such as internally developed software, IT savoir-faire, and IT knowledge. These intangibles are artifacts (e.g., code and knowledge) that are non-rivalrous 1 and, thus, shareable. At the same time, these intangibles are asset-specific, meaning that they are applicable and operable on the IT portfolio assets of the originating BU. For example, internally developed software must be interoperable with and deployed on a particular set of IT infrastructure. In short, the presence of non-rivalrous intangibles, along with their IT-asset specificity, changes the nature of coordination needed to create IT externalities across BUs. In such cases, horizontal coordination is desirable and may need to be coupled with vertical coordination to help with the discovery and exchange of IT intangibles.
The arguments pertaining to this complementary relationship are grounded in the existing literature on vertical (Arya and Mittendorf, 2013; Davies and Joglekar, 2013; Fang et al., 2023; Li et al., 2023; Lin et al., 2014) and horizontal (Hu et al. 2022) coordination. More specifically, we hypothesize that IT externalities arise due to the similarity of IT portfolios that the focal BU and other BUs in the MBF own. This especially happens if the source of externality value is the sharing of a non-rivalrous intangible artifact, such as knowledge, which depends on overlaps and absorptive capacities (e.g., Ferdows, 2006; Setia and Patel, 2013). We suggest that such IT portfolio similarity (ITPS) is akin to a form of horizontal coordination. Second, the re-deployable intangibles in a BU with higher IT portfolio similarity to its pool are better discovered and exchanged when the BU's IT decisions are governed centrally—that is, when IT centralization (ITC) is high. We explain that ITC is a form of vertical coordination. In short, our theory suggests that horizontal coordination through ITPS is complemented by vertical, top-down coordination through ITC.
Using a unique dataset with longitudinal observations from 2005 to 2020 and built from multiple sources—CI Technology Database, SDC Platinum Mergers and Acquisitions, Lexis-Nexis corporate affiliation, and COMPUSTAT—we test our hypotheses using a sample of 103,392 unit-year observations across 8,374 unique units nested in 866 unique firms. The results indicate that a BU generally benefits from pools of IT investment made by other BUs within the same firm. In unfolding the moderating conditions, we discover that these BU-level benefits are greater when access to internal externality pools coincides with greater ITPS at the focal BU—a factor influencing access to the pools and greater ITC at the focal BU—a factor enabling access to externality pools to translate into realized benefits. These findings provide novel evidence about the presence of intra-firm IT externalities, especially in MBFs, and highlight the hitherto unknown complementary role that horizontal and vertical coordination play in creating these externalities.
Literature Background: Productivity, Externalities, and Coordination in Operations Networks
To explain the theoretical background of our work, we rely on a thematic analysis of operations management literature by Ba and Nault (2017), which offers a systematic view of existing and emerging themes in research at the intersection of the economics of information systems and the operational management of technology. Specifically, they identify three themes related to productivity, vertical integration, and platforms, with the productivity theme being closely related to our research question. Concepts related to vertical and horizontal coordination also become a pertinent part of our study.
The productivity stream focuses on understanding the role that IT resources play in increasing value added for firms. This stream has particularly emphasized efficiency, performance, and value creation in an intra-firm context. Work in this area highlights technology's role as a driver of efficiency, particularly in labor-intensive industries. For instance, Fung (2008) demonstrates how IT and process innovations can improve labor efficiency in the banking sector, leading to cost reductions that outweigh technology implementation expenses. Similarly, Napoleon and Gaimon (2004) show that substituting technology for labor, especially in structured service environments, can significantly enhance profit. Models for understanding technology's impact provide frameworks for analyzing and understanding the intricate relationship between technology and operational performance. Moving beyond the impact of IT on efficiency, Dutta et al. (2007) examine the use of radio frequency identification (RFID) technology in operations management, highlighting its potential for real-time data capture and improved decision-making. This stream has evolved to explore the impact of IT capabilities in creating value-added in organizational networks. For example, Wang et al. (2018) investigate the impact of IT capability on port performance, using ports as models of heterogeneous supply chains. Their study emphasizes the role of IT capability in reducing transaction costs within and between organizations.
Ba and Nault (2017) further highlight the importance of IT productivity externalities within the productivity theme, referring to these externalities as IT spillovers. This sub-stream examines productivity gains that business entities in a network accrue from other entities’ investments in IT resources. Ba and Nault (2017) identify four key studies that lie at the intersection of information systems and operations management. First, Tambe and Hitt (2013) examine the impact of IT labor movement across firms, which acts as a mechanism for creating productivity within a network of firms operating in the same geographical regions. Similarly, Chang and Gurbaxani (2012) examine the IT knowledge accrued from the IT services industry to its operating partners, exploring IT productivity externalities in industrial partnership networks. Focusing on supply chain networks, Cheng and Nault (2007) represent supplier IT spillovers as an unquantified improvement in the quality of goods exchanged. In a related study, Cheng and Nault (2012) examine the impact of IT investments made by downstream industries on their suppliers’ productivity, suggesting that these externalities arise from enhanced information sharing and coordination within the supply chain, though this coordination is not directly measured or observed. While this research advances our understanding of how externalities can emerge in operations networks, two areas remain relatively underdeveloped: (1) these studies, exclusively done in inter-firm contexts, have overlooked externalities that may emerge within networks of autonomous business units operating in the intra-firm setup of MBFs, and (2) the concept of coordination in creating externalities has, at best, been treated as an implicit assumption and lacks detailed examination or direct measurement.
The context of MBFs as an operations network of autonomous business units is well-suited to understanding how coordination relates to IT productivity externalities. This is because MBFs offer an organizational form that incorporates both vertical and horizontal approaches to coordination (Knott and Turner, 2019). The operations management literature offers a rich view of coordination in operations networks, which further informs our study. At its core, this literature focuses on two modes of coordination: (1) vertical, through the top-down control of a central actor, and (2) horizontal, through organic, flat cooperation across the entities comprising the network.
Broadly, coordination is examined in the context of a specific type of inter-firm operations network: supply chains (Bernstein and Federgruen, 2007; Chen et al., 2001). First, vertical coordination, wherein a firm takes control of the operations of other firms in the chain (both forward and backward), is shown to enhance profits for the coordinating firm (Lin et al., 2014), as well as contribute to a broader network effect, as reflected in the overall valuation of a supply chain (Davies and Joglekar, 2013). Introducing a more nuanced understanding, Shi et al. (2020) focus on contingencies that explain the profit-enhancing impacts of either vertical or horizontal coordination, indicating that a hybrid of both, while enhancing the overall profit in the supply chain, may harm the profitability of the firm responsible for coordination, suggesting partial substitution between the two. Likewise, Li et al. (2023) highlight the effectiveness of partial vertical coordination in increasing a manufacturer's profits in a supply chain.
In intra-firm operations networks, coordination is viewed as a form of organizational structure, with vertical coordination paralleling centralization and horizontal coordination paralleling the decentralization of operational management. Highlighting the benefits of horizontal coordination, Huang et al. (2010) show that this type of coordination increases production capacity for mass customization firms. Building on Huang et al. (2010), Besiou et al. (2014) show that while vertical coordination helps with cost efficiencies, horizontal coordination enables higher levels of service or product quality. Finally, Sting and Loch (2016) offer a novel view of these two modes of coordination, depicting them as partial substitutes—wherein tightening one approach and loosening the other best balances creativity and compatibility in operating units. These distinctions between vertical and horizontal coordination underscore the need to evaluate their roles in enhancing intra-firm productivity.
Table E1 in the E-Companion summarizes the existing operations management literature on coordination and positions our study within this framework. In sum, while existing work on coordination in operations networks has mostly considered sequential or interdependent operational networks like supply chains or manufacturing units, the concept of coordination has not yet been examined in the context of networks of autonomous business units, such as those within MBFs. These units do not form an operational chain but can still benefit from coordination to enhance each unit's performance. MBFs offer a unique context in which both horizontal and vertical coordination may coexist and interact. The interrelations among various coordination mechanisms in MBFs, especially as they relate to productivity externalities, are not yet clear, though.
Our focus on MBFs as a unique context for the coexistence of both vertical and horizontal coordination is grounded in organization configuration theory (Mintzberg, 1980), which recognizes the presence of various coordination modes, vertical and horizontal, within the same organizational structures. This is also supported by Chandler's (1962) foundational work on the multi-divisional (M-form) structure, which explains the co-presence of vertical and horizontal modes of coordination in M-form structures, a form closely associated with MBFs. He highlights how large, multi-business firms transitioned from centralized, functionally organized structures to more decentralized, divisionalized forms, where divisions (business units) operate independently but are coordinated vertically or horizontally depending on the need. This structure allows for a mix of horizontal and vertical coordination, balancing decision-making autonomy in divisions with centralized oversight and strategic control. In the operations literature, the coexistence of these two coordination modes and their interaction in influencing compatibility and creativity is recognized by Sting and Loch (2016). However, they did not investigate how the interaction between vertical and horizontal coordination impacts productivity externalities. This is the specific area where we aim to contribute.
Productivity Externalities within MBFs
The presence of cross-unit productivity economies is one of the incentives that encourage firms to diversify into various business lines (Chatterjee, 1986, 1992; Li and Greenwood, 2004). Therefore, realizing externality benefits—as a special form of cross-unit economies—is important for MBF executives. Intra-firm externalities in MBFs are theorized to exist when common inputs across various BUs of an MBF can be shared (e.g., Goold and Luchs, 1993). These externalities may exist because a BU can tap into the unused capacity of resources that another BU has invested in, consistent with the literature on resource pooling in operations management (e.g., Cui et al., 2023; Qi et al., 2019; Wang et al., 2021; White et al., 2011; Xie et al., 2021). However, another path exists where resources invested by other entities create externalities. If a resource enables the creation of valuable non-rivalrous artifacts, the resource is likely to create value beyond its boundaries—because the focal non-rivalrous artifacts could be utilized at a lower cost or even free of charge (Sakhartov and Folta, 2014; Zhou, 2011).
While IT resources may have some unused capacity that can be shared, they are often customized to the specific capacity requirements of the adopting unit, especially with newer pay-per-use models, such as those in software-as-a-service contracts. This reduces the likelihood of resource idleness, which is necessary for capacity sharing. Nonetheless, IT expenditures on balance sheets are often accompanied by intangibles such as internally developed applications, consulting savoir-faire, and technical expertise, which combine with these assets to create exceptional value (Saunders and Brynjolfsson, 2016). For instance, Brynjolfsson et al. (2002) estimated that every $1 expenditure in software assets is associated with $10 of market value, indicating a tenfold impact on bottom-line value. Saunders and Brynjolfsson (2016) attribute much of this impact to intangibles accompanying IT expenditures. This is unsurprising, as IT is shown to be a commodity resource with ever-decreasing costs (Bharadwaj, 2000). Thus, it must be the intangibles that drive its robust impact.
But can these intangibles, developed in investing BUs, spill over into other BUs? The answer largely depends on their nature. These intangibles may take the form of codified artifacts, such as software applications, and codifiable knowledge, such as technical expertise and consulting savoir-faire, all of which are non-rivalrous and thus re-deployable under certain conditions (Danneels, 2007). For instance, when a BU invests in an ERP system, both codified artifacts and knowledge have the potential to create value across other BUs in several ways:
Codified Artifacts: Developed applications are one example of these codified artifacts. For instance, a BU investing in an ERP system may develop custom reporting tools that aggregate data from various functions (e.g., finance, HR, and inventory) into interactive dashboards, enabling real-time performance tracking. This custom reporting module can be reused by multiple BUs. For example, another BU could use the same tool to analyze order history, while the procurement department might track supplier performance, benefiting from the same underlying technology.
Moreover, data and algorithms developed in one BU can be leveraged by others with minimal additional cost. For instance, a demand forecasting model built by a retail BU to predict customer demand patterns using historical sales and seasonality can be utilized by the manufacturing BU to optimize production schedules and inventory levels, enhancing supply chain efficiency. Similarly, a fraud detection algorithm developed by a banking BU to identify suspicious credit card transactions can be adapted by the insurance BU to detect anomalies in claims processing, reducing financial losses and improving security. Furthermore, supplier performance data maintained by a procurement BU for consumer goods, tracking metrics such as on-time delivery rates and quality scores, can be reused by an industrial goods BU to identify reliable suppliers, streamlining procurement processes without redundant evaluations.
Codifiable Knowledge: Implementing an information system typically requires standardizing business processes across departments, such as how inventory is tracked or how payroll is managed. The process knowledge gathered during this standardization effort is formalized in process documentation and training materials. This process optimization knowledge can then be applied at no additional cost to other BUs, such as in a newly acquired division. Best practices used in inventory management or financial reporting in one region can be adopted by other regions, ensuring consistency and efficiency across the organization.
Consulting Savoir-Faire: During the systems implementation process, the BU's IT and procurement teams develop deep expertise in selecting and negotiating with software vendors, understanding licensing models, and managing long-term IT procurement contracts. This expertise includes assessing vendor capabilities, aligning procurement strategies with long-term business goals, and ensuring compliance with corporate standards. This procurement expertise can assist other BUs in making similar IT investments. For instance, if another division plans to implement a CRM or HR management system, the procurement team's savoir-faire from an existing ERP project can help with vendor selection, contract negotiations, and ensuring alignment with the firm's overall IT strategy.
These examples illustrate how non-rivalrous intangibles, once developed in one BU, can create value across the organization. The creation of IT intangibles—codified artifacts, codifiable knowledge, and savoir-faire—is thus more likely to be a critical element in making IT resources a source of intra-firm externalities (Zhou, 2011). As investment in IT by a BU increases, it can expand its IT human resources, which can then innovate using infrastructural investments in technology to create new solutions, applications, knowledge, and savoir-faire. In other words, larger investments in IT assets in other BUs lead to the accumulation of talent that can generate complementary intangibles for IT assets in other BUs. Thus, investments in tangible IT resources can create intangible artifacts—in the form of expertise, codified tools, or consulting savoir-faire, which are non-rivalrous and can be re-deployed in other BUS, leading to productivity gains for other BUs. Accordingly, we hypothesize that:
H1: IT investments by other BUs in an MBF (presenting an internal pool of investment) are associated with higher performance at a focal BU (i.e., higher intra-firm externalities).
Conditions for Realizing IT Externalities
While the creation of non-rivalrous intangibles enables a focal BU to potentially benefit from the IT resources of other BUs within the MBF, two additional concepts help determine whether other BUs can optimally utilize these intangibles. Previous research on intra-firm externalities discusses the role of relatedness (e.g., St. John and Harrison, 1999; Tanriverdi and Venkatraman, 2005), a form of horizontal coordination that ensures resources such as knowledge, code, data, algorithms, and consulting savoir-faire can be effectively utilized and re-deployed in other BUs. Additionally, vertical coordination, which is discussed in the next section, facilitates the discovery and exchange of these related non-rivalrous intangibles.
The concept of relatedness is particularly relevant when considering non-rivalrous IT intangibles, such as knowledge, code, algorithms, and consulting savoir-faire, that could be leveraged across BUs. These intangibles are not unconditionally re-deployable elsewhere because they are developed within the specific technical context of the originating BU, making them asset-specific. In other words, these intangibles create the most value in other BUs when the receiving BU's technical assets align closely with those of the originating BU. For instance, code and applications are often developed within particular environments or platforms, and their effective redeployment in other BUs depends on compatibility between the originating and receiving BUs’ environments and platforms. Similarly, knowledge and consulting savoir-faire developed in one BU cannot be redeployed limitlessly, particularly if other BUs operate on a technological infrastructure that renders the knowledge or savoir-faire less applicable. As Liu et al. (2017) show theoretically, compatibility across IT resources is key to realizing value spillovers.
In short, two notable benefits arise when the IT resources of BUs redeploying intangibles are more similar to those of the originating BU: seamless integration and reduced redeployment time. First, IT similarity enables seamless integration of modular artifacts, such as code. For a BU to reuse IT innovations developed by another unit, its infrastructure must be compatible with the systems and platforms on which that code or other types of digital innovation (e.g., algorithms) was initially developed. If the infrastructure is too different, the digital artifact may not function correctly or may require significant modification, which would reduce the economic benefits of reusing the artifacts as-is, leading to an increase the complexity of implementation. Second, such similarity reduces deployment time, as a similar IT environment allows for quicker rollout of solutions developed in one BU to another without substantial adaptation or configuration.
We capture the relatedness of IT resources across BUs by examining the concept of
For instance, a BU investing in both cloud and in-memory analytics assets is more likely to reap knowledge externalities in managing its cloud assets from another BU with the same configuration (cloud + in-memory analytics) than from BUs that invest in the cloud alongside other unrelated assets. In sum, we conceptualize ITPS as a measure of the overlap between the IT portfolio of the focal BU and those of other BUs within the MBF. The extent to which a focal BU overlaps with other BUs in an MBF is an aggregate of its ITPS with each BU in the MBF. As a focal BU's aggregated ITPS increases, it is more likely to absorb non-rivalrous intangibles, such as knowledge, code, data, algorithms, and consulting savoir-faire related to IT investments made by other BUs. Therefore:
H2: IT investments by other BUs in an MBF (presenting an internal pool of investment) are further associated with higher performance at a focal BU (i.e., higher intra-firm externalities) when the unit has a higher level of ITPS with other units.
Based on existing literature (e.g., Zhou, 2011), effective vertical coordination is required to ensure that sharable and applicable knowledge about overlapping operational IT assets flows across related BUs. Vertical coordination is a top-down mechanism of control exerted by HQs over the BUs, while horizontal coordination involves flat coordination managed among BUs themselves with little or no HQ intervention (e.g., Zhou and Wan, 2017). We introduce IT centralization (ITC), defined as the extent to which a BU's IT governance is managed by HQs, as a concept representing vertical coordination in MBFs.
HQs play a crucial role in inter-unit operations, especially when conventions for discovery and exchange are needed to achieve benefits that span multiple BUs (Collis et al., 2007; Feldman, 2020). Facilitating exchanges across distributed BUs to harness externalities naturally aligns with HQ's responsibilities. We have argued that pools of IT investments by other BUs lead to a cumulation of non-rivalrous intangibles, which can be more readily re-deployable in units with high ITPS. However, the fact remains that these non-rivalrous intangibles, which have the potential to be re-deployed in units with high ITPS, need to be effectively discovered, identified, and exchanged across BUs—exchanges that do not happen organically.
General research on HQs in MBFs (e.g., Foss, 1997; Goold and Campbell, 1991; Nell and Ambos, 2013) explains that discovery and exchange do not occur without HQ engagement. Operations management research further echoes this point (Huang et al., 2010; Shi et al., 2020). Specifically, research suggests that HQs often introduce flexibility within the MBF. Flexibility can involve temporarily re-assigning talent from one BU to another, creating task forces that cross BU boundaries, and establishing reporting structures that extend beyond individual BU hierarchies. This flexibility aids in discovering shareable intangibles and allows for their exchange through talent movement. Additionally, HQs often adjust responsibilities, duties, and assignments within units, enhancing the likelihood of exchange between a focal BU and other centralized BUs. Consequently, as a BU's ITC increases, the intangibles created through IT investment pools in other BUs and made re-deployable by the BU's high ITPS are more effectively discovered and exchanged, leading to higher productivity gains for the focal BU.
As we explained, pools of IT investments in other BUs lead to the creation and accumulation of non-rivalrous intangibles that could be consumed in other BUs at little or no cost. Further, these non-rivalrous intangibles are asset-specific and can be best redeployed in a BU if the tangible assets of that BU match the tangible assets of the BUs originating the non-rivalrous intangibles, that is, if the BU has high ITPS with other BUs within the MBF. This means that as the ITPS of a BU increases, so does the presence of adaptable intangible digital resources outside the BU. That said, because BUs in MBFs are operationally independent and often function in different industries and regions, they often lack both visibility over other BUs and the means to identify the intangibles that could match their digital operations. As the ITPS for a BU increases, a matching task becomes more essential to be executed. This matching task includes (1) discovering the intangibles, such as codified artifacts and savoir-faire, that are adaptable to, and could be redeployed in, the focal BU, and (2) facilitating the flow and exchange of those intangibles into the focal BU (e.g., employee transfers). Because HQs have a bird's-eye view and are efficient in cross-unit discovery and exchange in MBFs, a BU's increase in ITC increases the involvement of HQs in the BU's digital governance and allows for driving more value from the BU's higher ITPS with other BUs.
In sum, the degree to which a BU in an MBF can accrue value from cross-BU IT investment pools, especially for those BUs that have a high likelihood of re-deploying intangibles from the pool (i.e., BUs with high ITPS), depends on the efficiency with which these re-deployable intangibles are discovered, accessed, and redistributed. Such efficiency is achievable through higher ITC. While ITPS ensures that IT intangibles across BUs are shareable and re-deployable, higher levels of ITC ensure that the shareable and re-deployable intangibles like code, data, algorithms, knowledge, and consulting savoir-faire are effectively found and distributed to those high-ITPS BUs. As such, we hypothesize that:
H3: IT investments by other BUs in an MBF (presenting an internal pool of investment) are further associated with higher performance at a focal BU (i.e., higher intra-firm externalities) that has higher ITPS with the focal BU when the focal BU is governed more centrally (i.e., have higher ITC).
Empirical Execution
To empirically evaluate our first hypothesis, we build on the literature examining IT externalities that adopt methods from production economics (e.g., Ba and Nault, 2017; Iyer et al., 2013; Karmarkar et al., 2015) to quantify the contribution of organizational inputs, including pools of IT investment by other BUs, to firm productivity (e.g., Tambe and Hitt, 2013). In this approach, models of productivity are augmented with input elements that capture the externality pools available to the firm. Following Draca et al. (2006) and Bharadwaj et al. (1999), we augment the standard production function model that links the log values of capital (K) and labor (L) to firm productivity by including the log value of computer investments (C), as well as the log value of intra-firm IT investment pools (IT_Pool) as inputs to production. Moreover, following recommendations by Brynjolfsson and Hitt (2003) and Tambe and Hitt (2013), we focus on value-added as the dependent variable. Therefore, we start by formulating the following regression form of the augmented production function as follows:
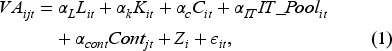
where the subscript ijt denotes the value of a variable for the ith BU in firm j at time t, and α coefficients signify the extent of the contribution of each input to the BU's output. Contjt captures firm-level time-variant controls, and Zi captures the impact of inputs that are unobserved and are time-invariant—these include BU-specific capabilities such as legacy knowledge and innovation that resides in the firm and help with productivity, and
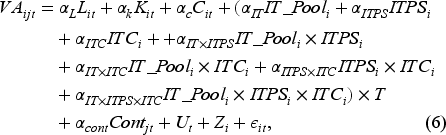
To equation (1), we then add ITPS, ITC, their interactions among themselves and with the IT pool, and a three-way interaction term of ITPS, ITC, and IT_pool as follows:
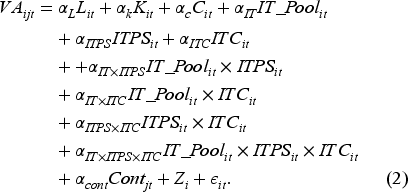
After estimation, αIT, αIT × ITPS , and αIT × ITPS × ITC are expected to be significant and positive per H1, H2, and H3, respectively.
We collected data from multiple sources to test our hypotheses. In line with other similar studies (e.g., Tambe and Hitt, 2013; Xue et al., 2008, 2011), CI Technology Database is our primary data source. We use the database for information related to IT assets and IT assets centralization within a BU. We have data for the period 2005–2020. The database is also used to collect information about BU characteristics and performance-related details (e.g., the BU's sales, revenue, and number of employees 2 ). We use the National Establishment Time-Series (NETS) Database to gather various variables at the BU level. Finally, we added firm-level controls for publicly traded firms with data available in COMPUSTAT. To confirm that the firms retained in our sample are indeed MBFs, we dropped observations where the firm did not have segment reports in COMPUSTAT (Morandi Stagni et al., 2020). Unfortunately, not all businesses from the CI Database can be matched with other sources of information. 3 Our initial matched sample constitutes 866 unique firms, 10,526 unique BUs that had reported independent sales and other financial amounts in the NETS database, and 128,962 unit-year observations. The BUs are active in manufacturing, utilities, wholesale trade, retailing, transportation, and warehousing. Aligned with our assumption that BUs of an MBF are geographically and industrially dispersed, on average, the BUs of an MBF in our sample show 614 miles of pairwise geographical distance and, on average, are dispersed across four to five different industries (three-digit SIC). From the initial sample of BUs, we dropped those that were identified as either headquarters or regional headquarters (1,814 units) and also dropped BUs that were located in the same city as another BU in the firm (338 units). The latter was done to ensure that externality benefits were not accrued due to simple colocation mechanisms. The final sample included 8,374 unique BUs and 103,392 unit-year observations.
Main Measures
The value of variables used in the regression equation (EQ 1), that is, value-added, capital (natural log of the dollar value of assets), and labor (natural log of total employees) for each BU is obtained from the CI Technology Database, complemented by a dataset that has further information at BU level (NETS; specifically, assets and value added). IT capital (natural log of BU's IT budget) is the BU-level IT budgetary investment provided by the CI Technology Database. To calculate
We base our main measure of
To operationalize
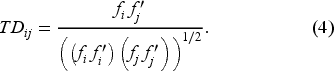
While Jaffe's measure is usually constructed by obtaining a firm's patent development in different technological areas, other studies have extended this measure beyond a firm's patent development activity. Specifically, Inkmann and Pohlmeier (1995) extended Jaffe's measure by introducing a Euclidean distance of technology vectors as a measure of the technological distance between two entities. The measure has been empirically used and tested with elements of the technological vectors not related to patent development (e.g., Kaiser, 2002; Rosenkopf and Almeida, 2003; Stuart and Podolny, 1996). Building on this measure, we measure the ITPS. Specifically, we model each BU's IT assets by a vector, with each element of the vector corresponding to a distinct IT asset. To identify the elements of this vector for year t, we utilize the Presence Install tables available in the CI Technology Database.
9
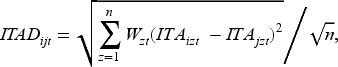
Table E3 in the E-Companion provides a list of IT assets (ITA) elements used to form a BU's vector of IT assets. In doing so, some elements are reported as 0/1 (1 indicating the presence/implementation of the element, such as the presence of ERP in the firm), whereas others are reported as continuous variables (i.e., count of the element, such as the total number of LAN switches). To form a vector consisting of comparable elements, we range-standardize the continuous elements because range-standardizing gives a 0–1 range to the said continuous variables. In the equations below, ITADij denotes the IT assets’ distance between BUs i and j, and n denotes the number of vector elements in a given year.
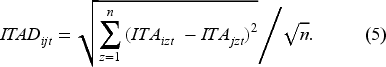
We use the one-average of all pairwise ITAD between the focal unit and other units in the firm as the measure of BU's ITPS. 10 Table 1 summarizes the mean, standard deviation, and correlations among the variables used in this study.
Correlation matrix.
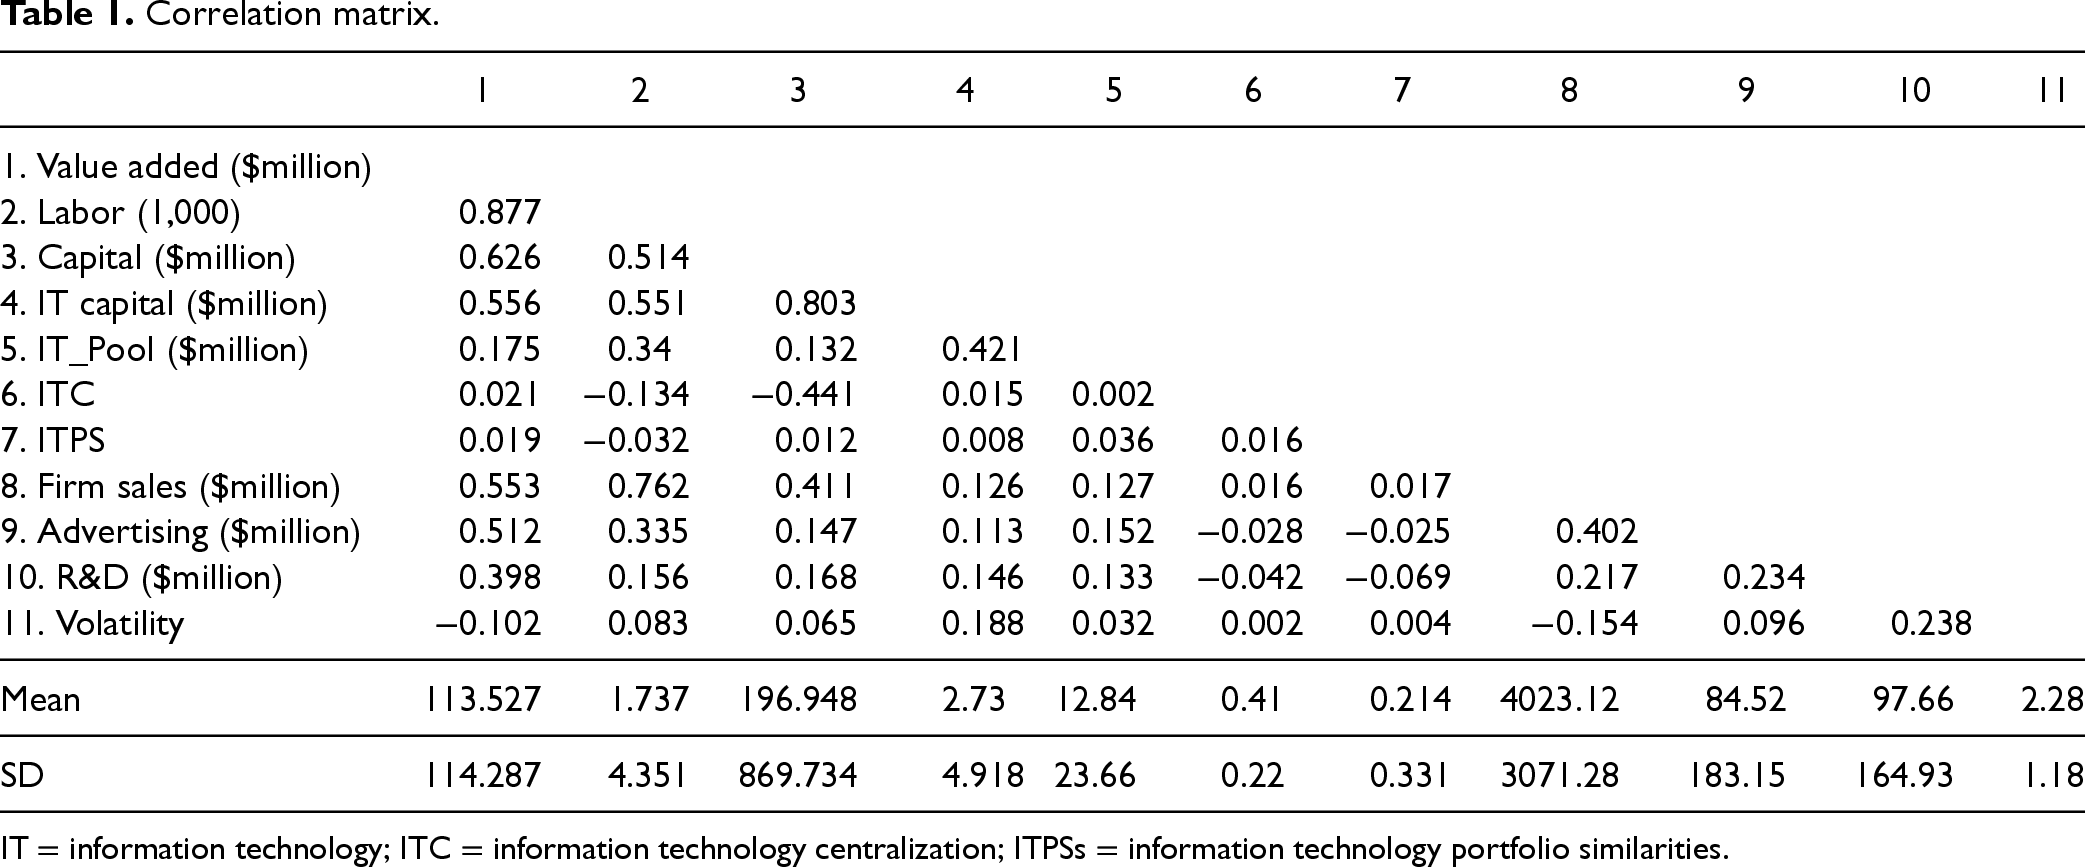
IT = information technology; ITC = information technology centralization; ITPSs = information technology portfolio similarities.
To account for firm and industry-level time-variant factors, we controlled for the following.
Model Specification and Analysis
In estimating equations (1) and (2), the period covered in our study (2005–2020) includes the time in which changes in general economic behavior and managerial decision-making happened due to the 2008 financial crisis (Reinhart and Rogoff, 2008). Since such changes likely influence decisions related to operational control in firms, we control for such unobserved effects by including year fixed-effects in the regression equations. Results of a Hausman test also indicate that the assumption that BU-level effects are adequately modeled by a random-effects model is significantly rejected (chi-squared = 318.36, p < 0.001). All models are run with a fixed-effects estimation to account for the impact of unobserved time-invariant BU-level characteristics. We standardize all continuous variables to reduce multicollinearity when testing interaction effects. Also, all the standard errors are clustered at the firm level.
We assume that IT_Pool, ITPS, and ITC, along with all the product terms, are endogenous. Following the previous literature, we adopt Hausman-type instruments (Aral et al., 2018; Ghose and Han, 2014; Mithas and Rust, 2016). Hausman-type instruments are constructed for a variable like the IT pool belonging to a firm by considering the average value of the IT Pools for all other firms in the same institutional context, often the same region and industry. The intuition behind these instruments is that while institutional influences can impact a firm's access to something like the IT pool, the average value of the IT pool does not impact focal-firm outcomes directly. Therefore, Hausman-type instruments meet the conditions of relevance to the endogenous variables and exclusion from the second stage of 2 stage-least-squares (2sls) estimations. For each focal BU in our sample, we construct a set of BUs (the peer set) that (1) are located within the same county as the focal BU and (2) are in the same three-digit SIC industry group as the BU. For instrumenting IT_Pool, we use
Main Results
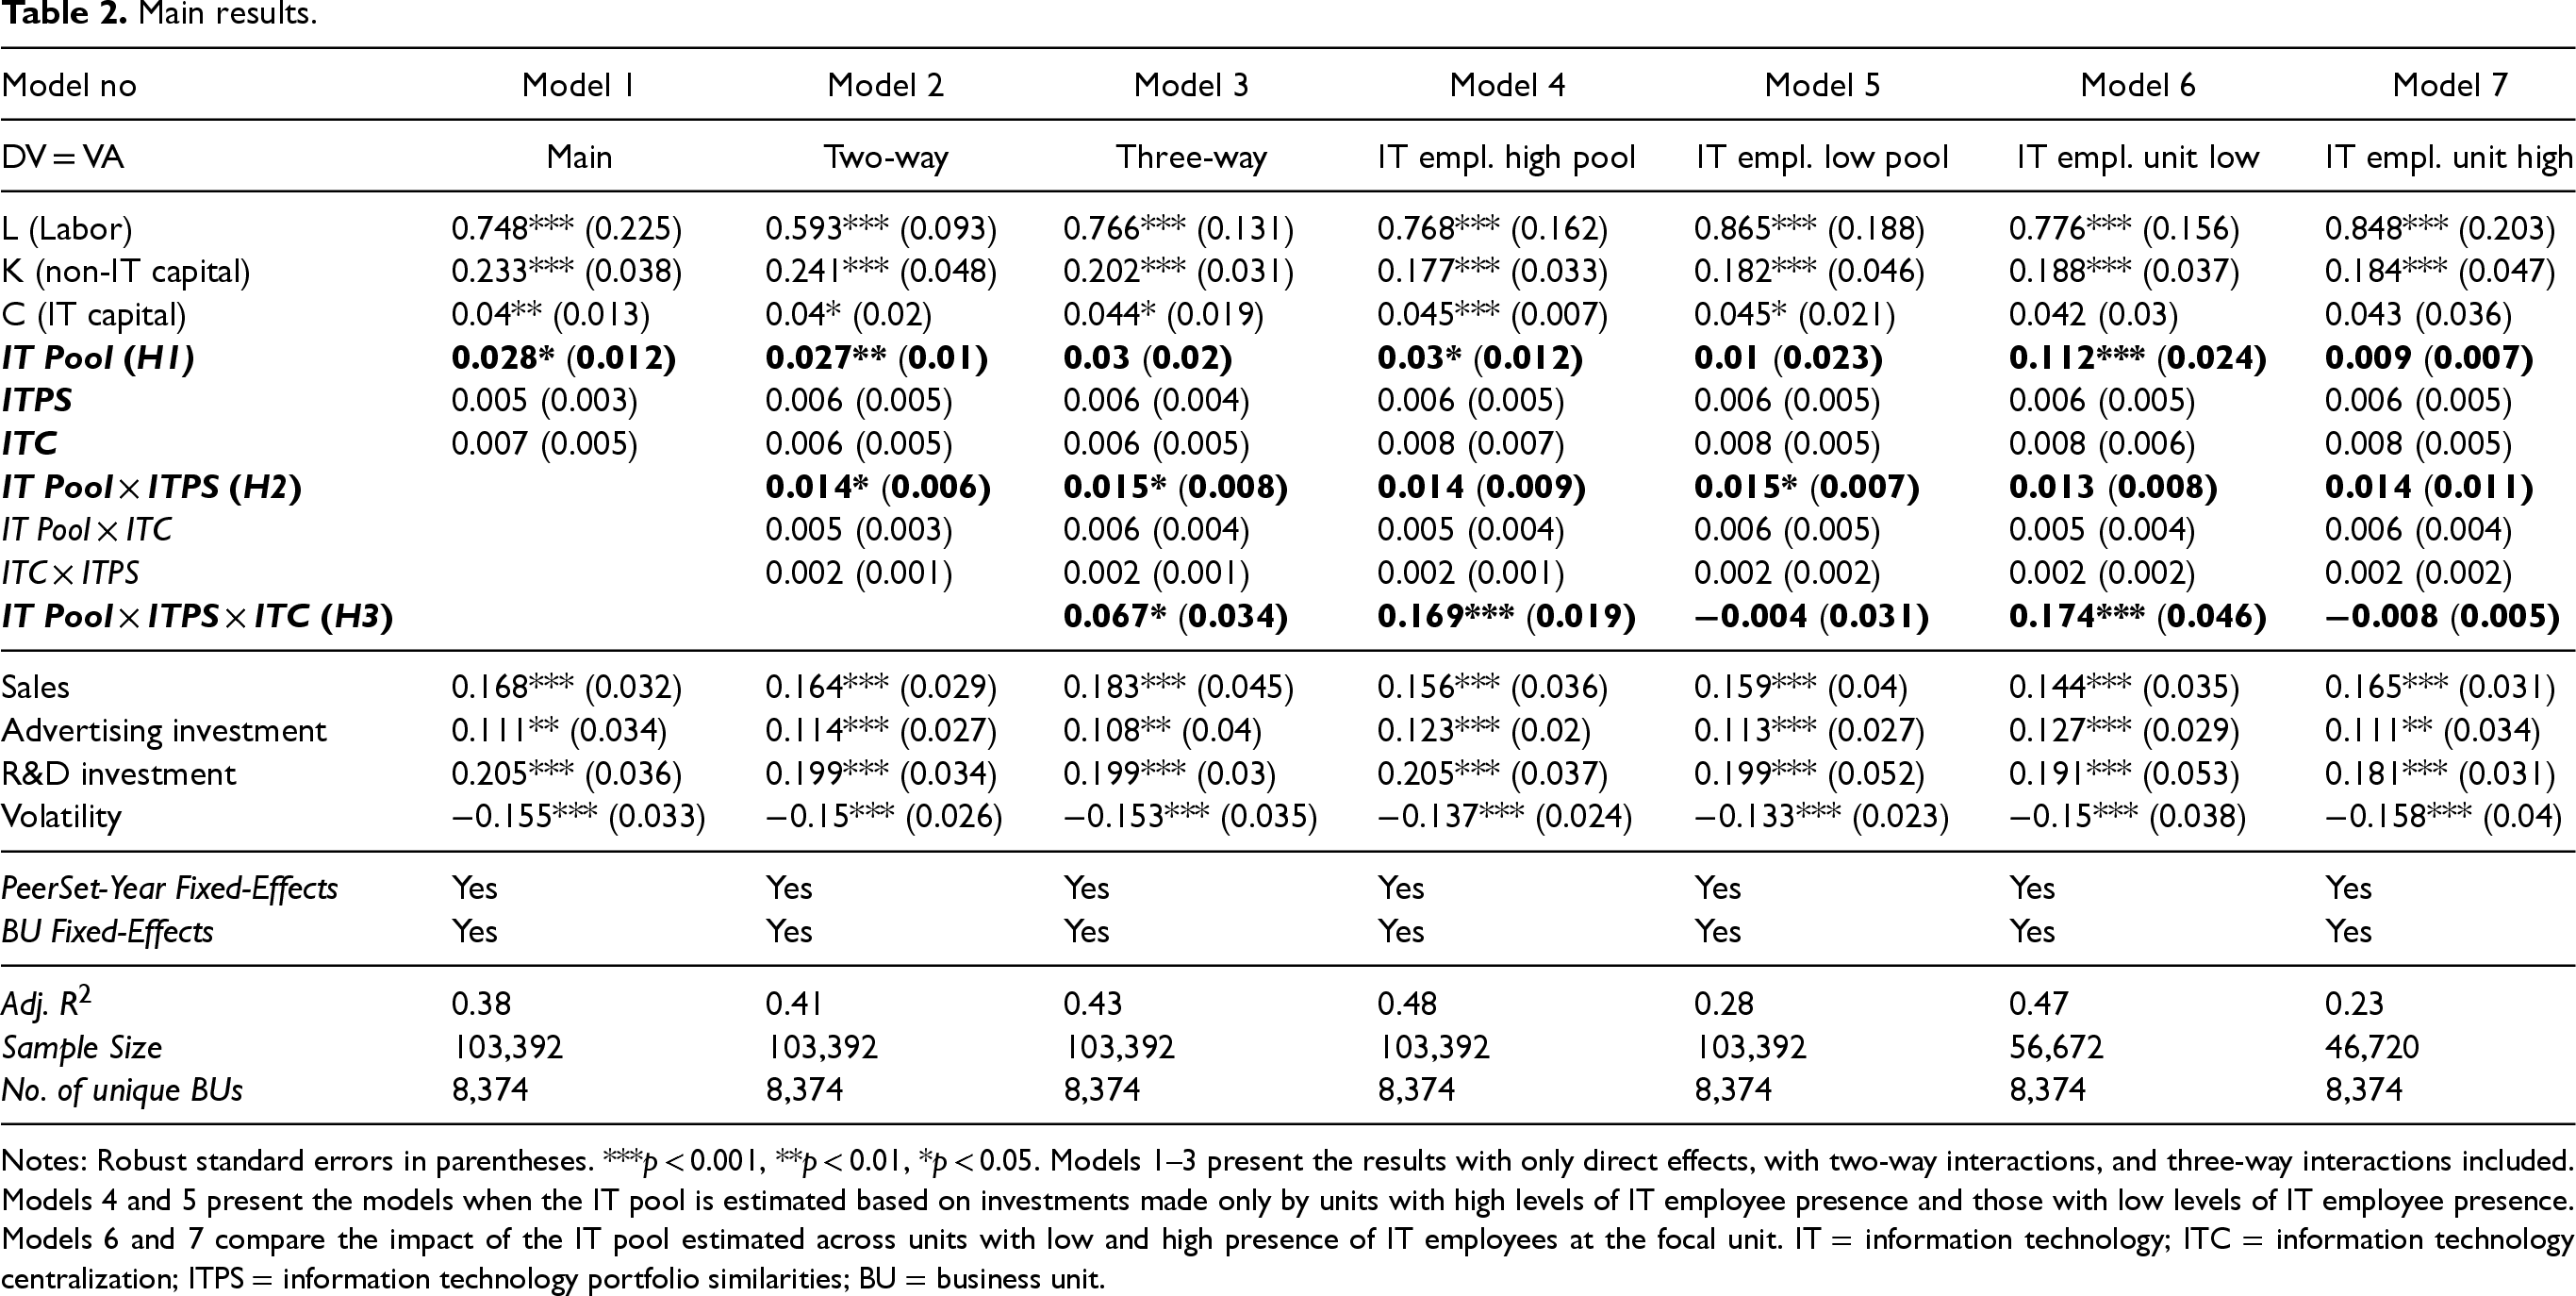
Table 2 presents the results of the 2sls fixed-effects models in a stepwise approach, first with only direct effects (Model 1), then by including the two-way interactions (Model 2), and finally by adding the three-way interaction (Model 3). The coefficient of IT_Pool in Model 1 is positive and significant (0.028, p < 0.05), supporting H1. This means that an otherwise average BU with higher-than-usual access to IT investments by other BUs within the MBF (one standard deviation above the mean) sees roughly a 3% increase in value added. This finding advances the existing work in operations management that focuses on performance implications of IT resources (e.g., Dutta et al., 2007; Wang et al., 2018), by revealing the hitherto not-studied externalities that IT resources create across independent business units of the same firm. Moreover, it adds to the work on IT externalities in an important inter-firm context in operations research (Cheng and Nault, 2007, 2012), that is, supply chains, and extends the benefits of these externalities to intra-firm settings in M-form MBFs that handle complex operations across industries and geographies. It also complements the analytically modeled theories of value spillover inside organizations with distributed operations (i.e., Liu et al., 2017) by providing supporting and augmenting empirical evidence, adding to these theories’ external validity.
Main results.
Main results.
Notes: Robust standard errors in parentheses. ***p < 0.001, **p < 0.01, *p < 0.05. Models 1–3 present the results with only direct effects, with two-way interactions, and three-way interactions included. Models 4 and 5 present the models when the IT pool is estimated based on investments made only by units with high levels of IT employee presence and those with low levels of IT employee presence. Models 6 and 7 compare the impact of the IT pool estimated across units with low and high presence of IT employees at the focal unit. IT = information technology; ITC = information technology centralization; ITPS = information technology portfolio similarities; BU = business unit.
However, the results from Models 2 and 3 reveal that the extent of IT externality benefit changes depending on the joint consideration of ITPS and ITC. First, Model 2 shows αIT × ITPS is positive and significant (0.014, p < 0.05), supporting H2 and indicating that higher levels of ITPS are associated with higher benefits from access to IT pools. More importantly, αIT × ITPS × ITC is also positive and significant (0.067, p < 0.05) in Model 3, supporting H3. This indicates that in a BU with higher-than-normal IT_Pool, ITC, and ITPS benefit from around 13% higher value-added, showing that a concurrent increase in ITC and ITPS is the best condition for reaping benefits from intra-firm IT pools. In sum, our models show evidence of value-added benefits from spillover pools, wherein the joint presence of vertical (ITC) and horizontal (ITPS) coordination strengthens the said benefit. This advances the ongoing discussion on joint consideration of the vertical and horizontal coordination (e.g., Huang et al., 2010; Sting and Loch, 2016) and further addresses the call for more research on the spillover theme identified by Ba and Nault (2017). Our work particularly adds to the work done by Sting and Loch (2016), who did a case study on substitutive interdependence between vertical and horizontal coordination when creativity and compatibility were considered as outcomes of coordination. We find evidence to the contrary of the suggested (Sting and Loch, 2016) substitutive relationship between the two said modes of coordination when productivity externalities are considered as the bottom-line outcome of the coordination in the MBF context. Our study also makes a methodological departure by relying on a panel data approach that considers the effectiveness of vertical and horizontal coordination in managing IT externalities.
So far, we have presented moderating evidence that suggests that IT_Pools, ITPS, and ITC are complements. In other words, the strength of the impact of IT_pools on productivity is higher when the BU benefits from higher ITPS and ITC. The existing literature on productivity complementarities (e.g., Aral et al., 2012; Brynjolfsson and Milgrom, 2012; Tambe et al., 2012) suggests that a more direct test of complementarities can be done by comparing the average productivity for BUs benefiting from the eight possible combinations of high (1) and low (0) values (median split) for IT_Pools, ITPS, and ITC, where the comparison block is the average productivity for units where the value all three variables is low. Panel 1 in Figure 1 shows the breakdown of these eight blocks and the coefficient of their block dummy in predicting productivity while all controls and fixed effects in main models are included. As it can be seen in Panel 1, the difference between average productivity of units with (1(IT_Pool), 1 (ITPS), and 1(ITC)) condition is significantly higher than that of (0,0,0) units (0.127, p < 0.01), while units with high IT_pool access and presence of high values of either ITPS (1, 1, 0) or ITC (1, 0, 1) also show superior productivity to the (0, 0, 0) units, albeit more moderately. Significant Pearson chi-squared statistics in both quadrants ITC = 0 and ITC = 1 suggest that managers in MBFs already select higher ITPS for units with access to higher IT_Pool access.
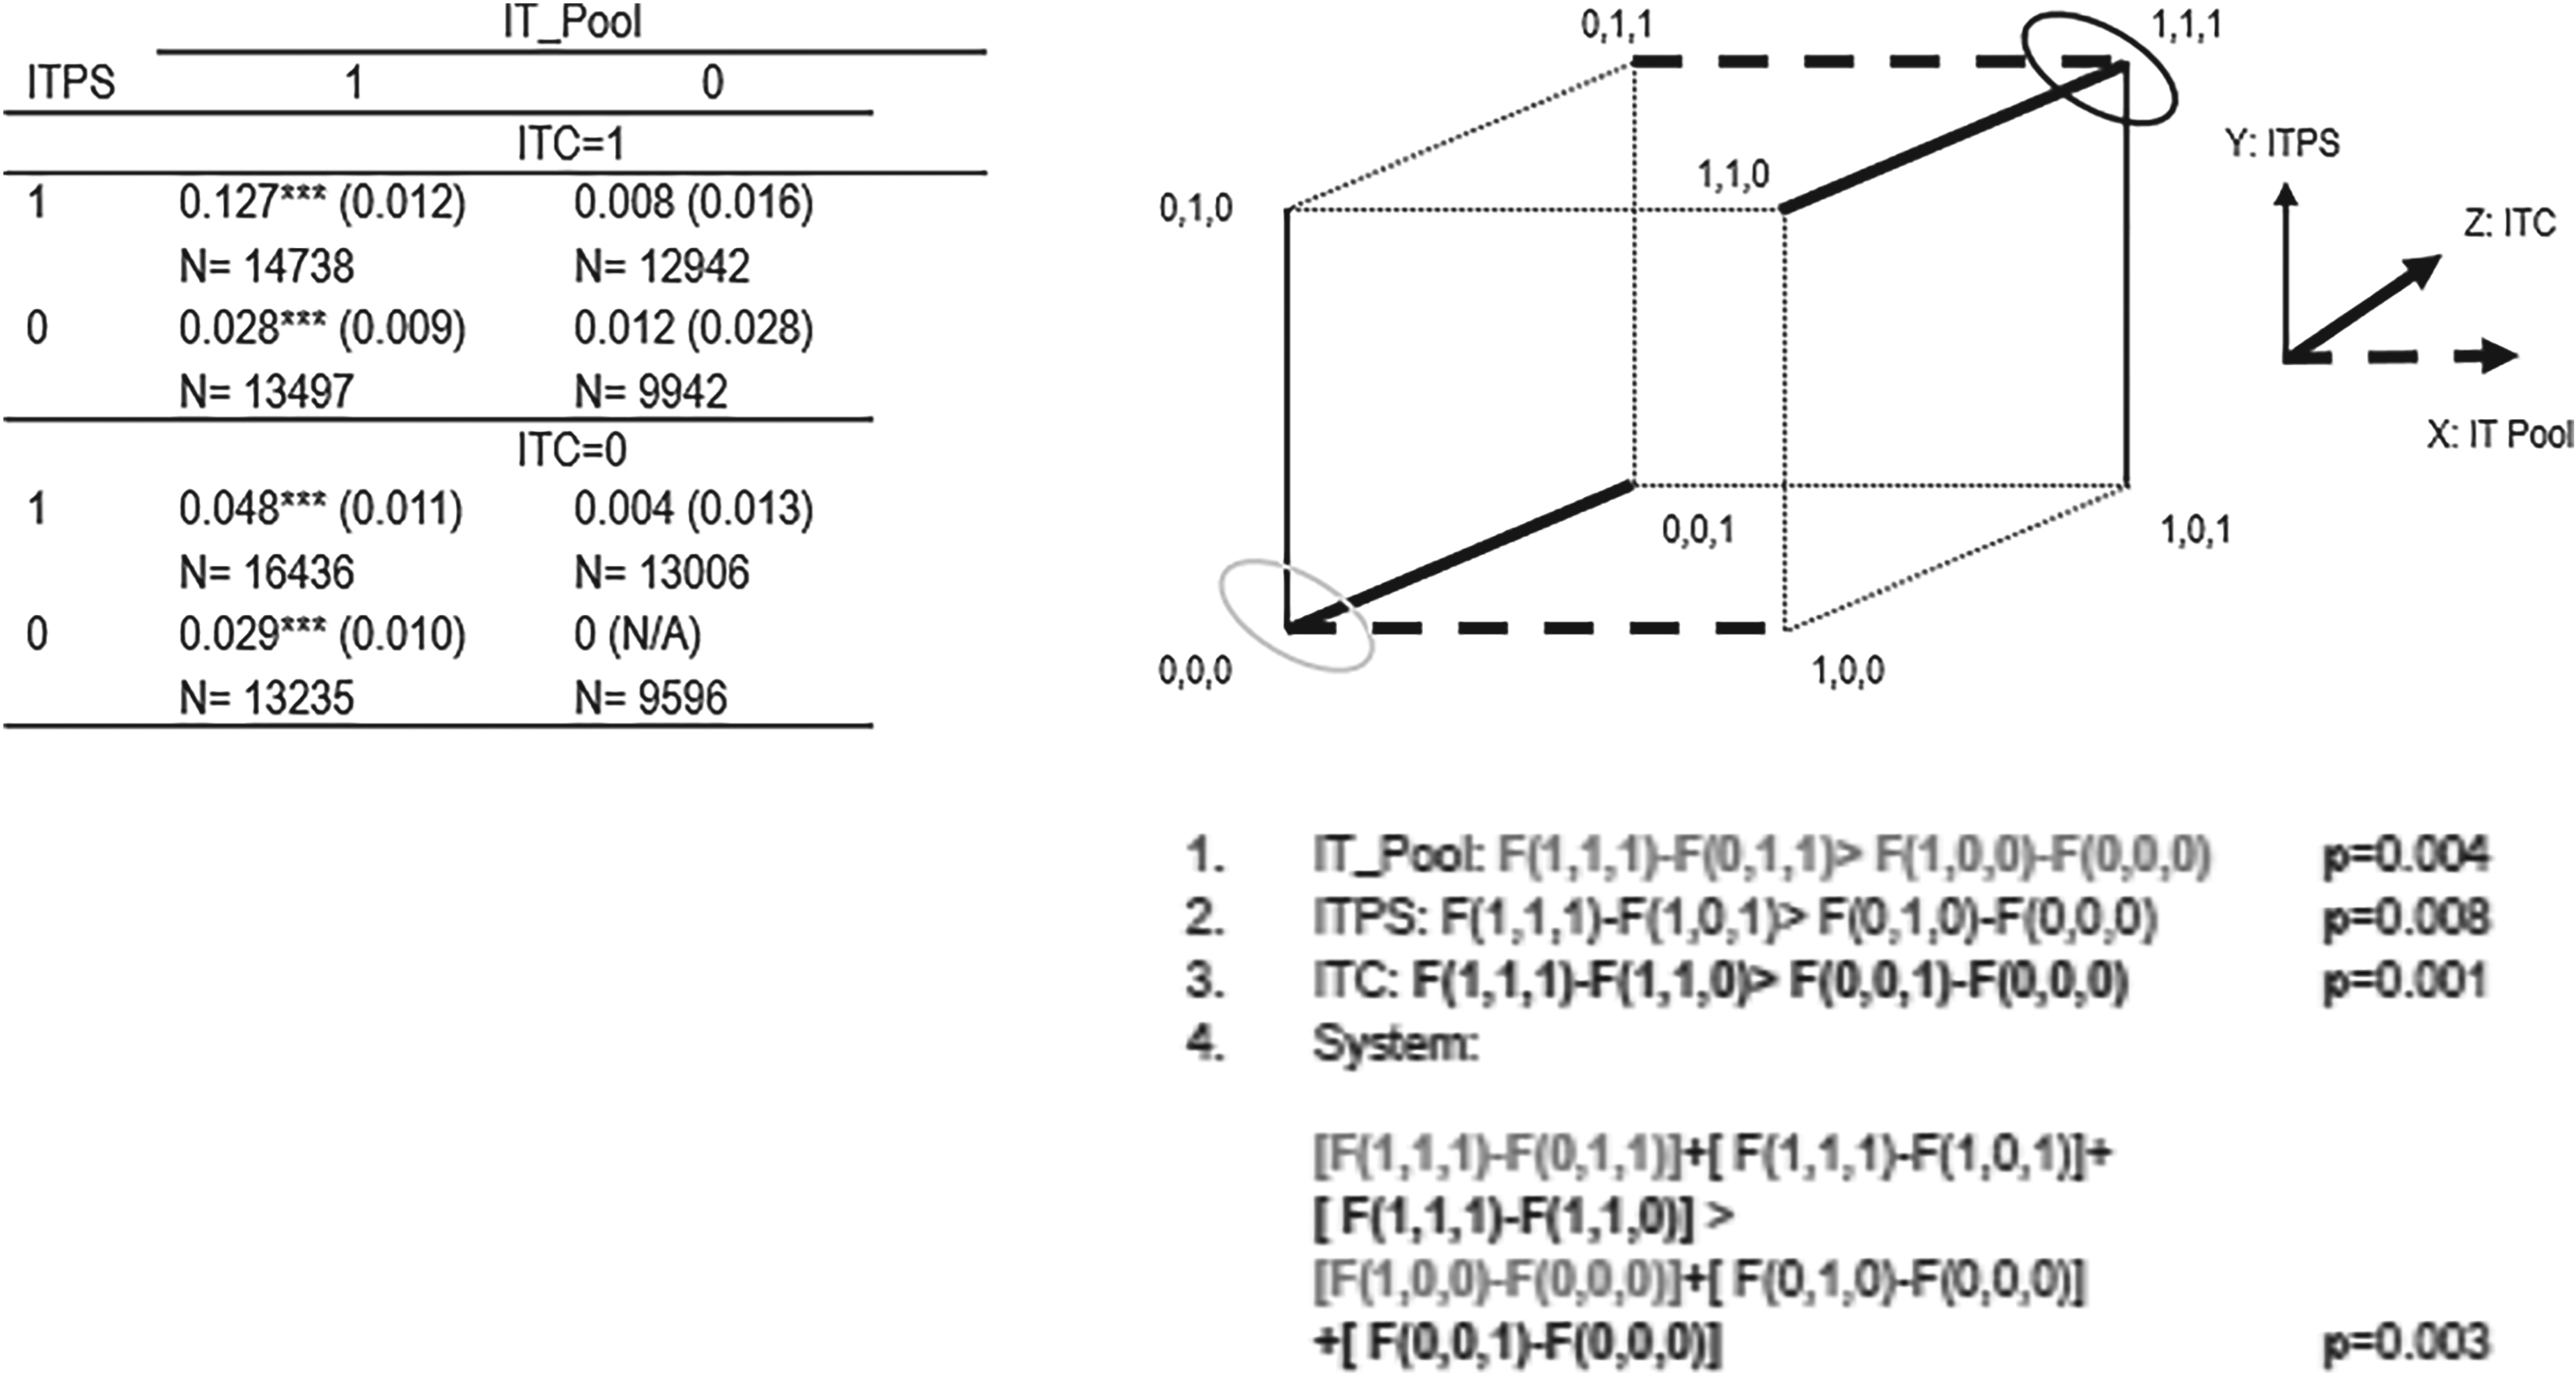
Panel 1 shows the complementarity comparisons in eight blocks, and Panel 2 shows the cube view of complementarities.
Panel 2 provides more insights by comparing the average productivity differences between accessing higher values in one factor when the other two factors are also high versus when accessing the focal factor happens when the other two are low (comparisons 1–3). Moreover, a system comparison provides insights into when the significance of all three comparisons is evaluated simultaneously. In all four comparisons, the null hypothesis of equality is rejected at p < 0.01, providing further evidence that IT_Pools, ITPS, and ITC form a system of complementing factors that, when implemented together, result in higher levels of productivity.
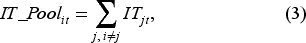
While the co-presence of the vertical and horizontal coordination is the key condition in turning access to pools of IT investment into an increase in value-added, our theory posits that the value from IT pools accrues due to non-rivalrous intangibles created by other BUs. In an ideal setup where the flow of intangibles among units is visible, one can directly test whether or not it is indeed the flow of non-rivalrous intangibles that made intra-firm IT externalities possible. However, the exchange of intangibles is hard to track, especially at the intra-firm level. That said, we can benefit from the fact that IT intangibles are created by IT personnel who utilize IT commodities to develop digital solutions or insights. CI Database reports the number of IT employees in each BU. We take advantage of this information and, in a subsequent analysis, create two IT pools for each BU. One pool consists of the sum of investments for units with an above-average number of IT employees (average based on IT employees of BUs within the MBF in that particular year) and one for those below average. We then estimate EQ 2 based on the pools of low and high IT_Employee BUs. Model 4 in Table 2 presents the estimates for high_IT_Employee pools, and Model 5 reports the estimates for low_IT_Employee pools. If knowledge, code, and savoir-faire, which are created by human technical factors, are not indeed a part of why IT pools create externalities, the estimates between Models 4 and 5 should not be different. However, as presented in Table 1, both the coefficient of direct impact of IT_Pool (0.027, p < 0.05 for high_IT_Employee pools vs. 0.01, p > 0.05 for low_IT_Employee pools) and its interaction with ITPS and ITC (0.169, p < 0.001 for high_IT_Employee pools; vs. −0.004, p > 0.05 for low_IT_Employee pools) are significantly different. It is also noteworthy to point out that the coefficient estimate of the three-way interaction in Model 4 is also significantly larger than that estimated in Model 3, further indicating that the impact of IT pools under high ITPS and ITC is mostly driven by pools belonging to BUs with a sizable IT employee presence. As such, we cannot refute the fact that the presence of IT intangibles is an important underlying condition in driving intra-firm IT externality benefits.
Finally, if the increase in IT investments by BUs and increase in access to IT talent is in part responsible for accrued externality benefits, it then makes more sense if the observed impacts from pools of IT investments from BUs with a high number of IT employees should be more impactful for BUs that themselves have a below-average presence of IT employees. The intuition is that IT intangibles generated by employees of external units are likely to be more distinct and thereby valuable for the focal BU when the focal BU is low on its stock of IT employees. Models 6 and 7 in Table 2 present the estimates of the impact of high_IT_employee pools on BUs with below- and above-average numbers of IT employees. The coefficient of direct impact of IT_Pool (0.009, p > 0.05 for high_IT_Employee BU; vs. 0.112, p < 0.001 for low_IT_Employee BUs) and its interaction with ITPS and ITC (−0.008, p > 0.05 for high_IT_Employee BUs; vs. 0.174, p < 0.001 for low_IT_Employee BUS) are significantly different and indicate that the benefits from high_IT_employee pools are mostly accrued at BUs that are, themselves, among low_IT_Employee units. Table E5 in the E-Companion presents the results of the same analyses with the direct-effects-only and two-way interaction effects-only models.
These findings highlight the role of IT talent in enabling intra-firm IT externalities. IT resources have lower direct sharing capacities but have the possibility of being subjected to the creation of non-rivalrous intangibles such as code, knowledge, and savoir-faire by IT talent. This finding adds to the existing literature that has examined capacity-sharing as a means of producing externalities in intra-firm contexts (Cui et al., 2023; Fang et al., 2023; Qi et al., 2019; Wang et al., 2021; White et al., 2011; Xie et al., 2021) but has overlooked the creation of externalities through the generative talent that produces non-rivalrous intangibles.
Robustness Tests
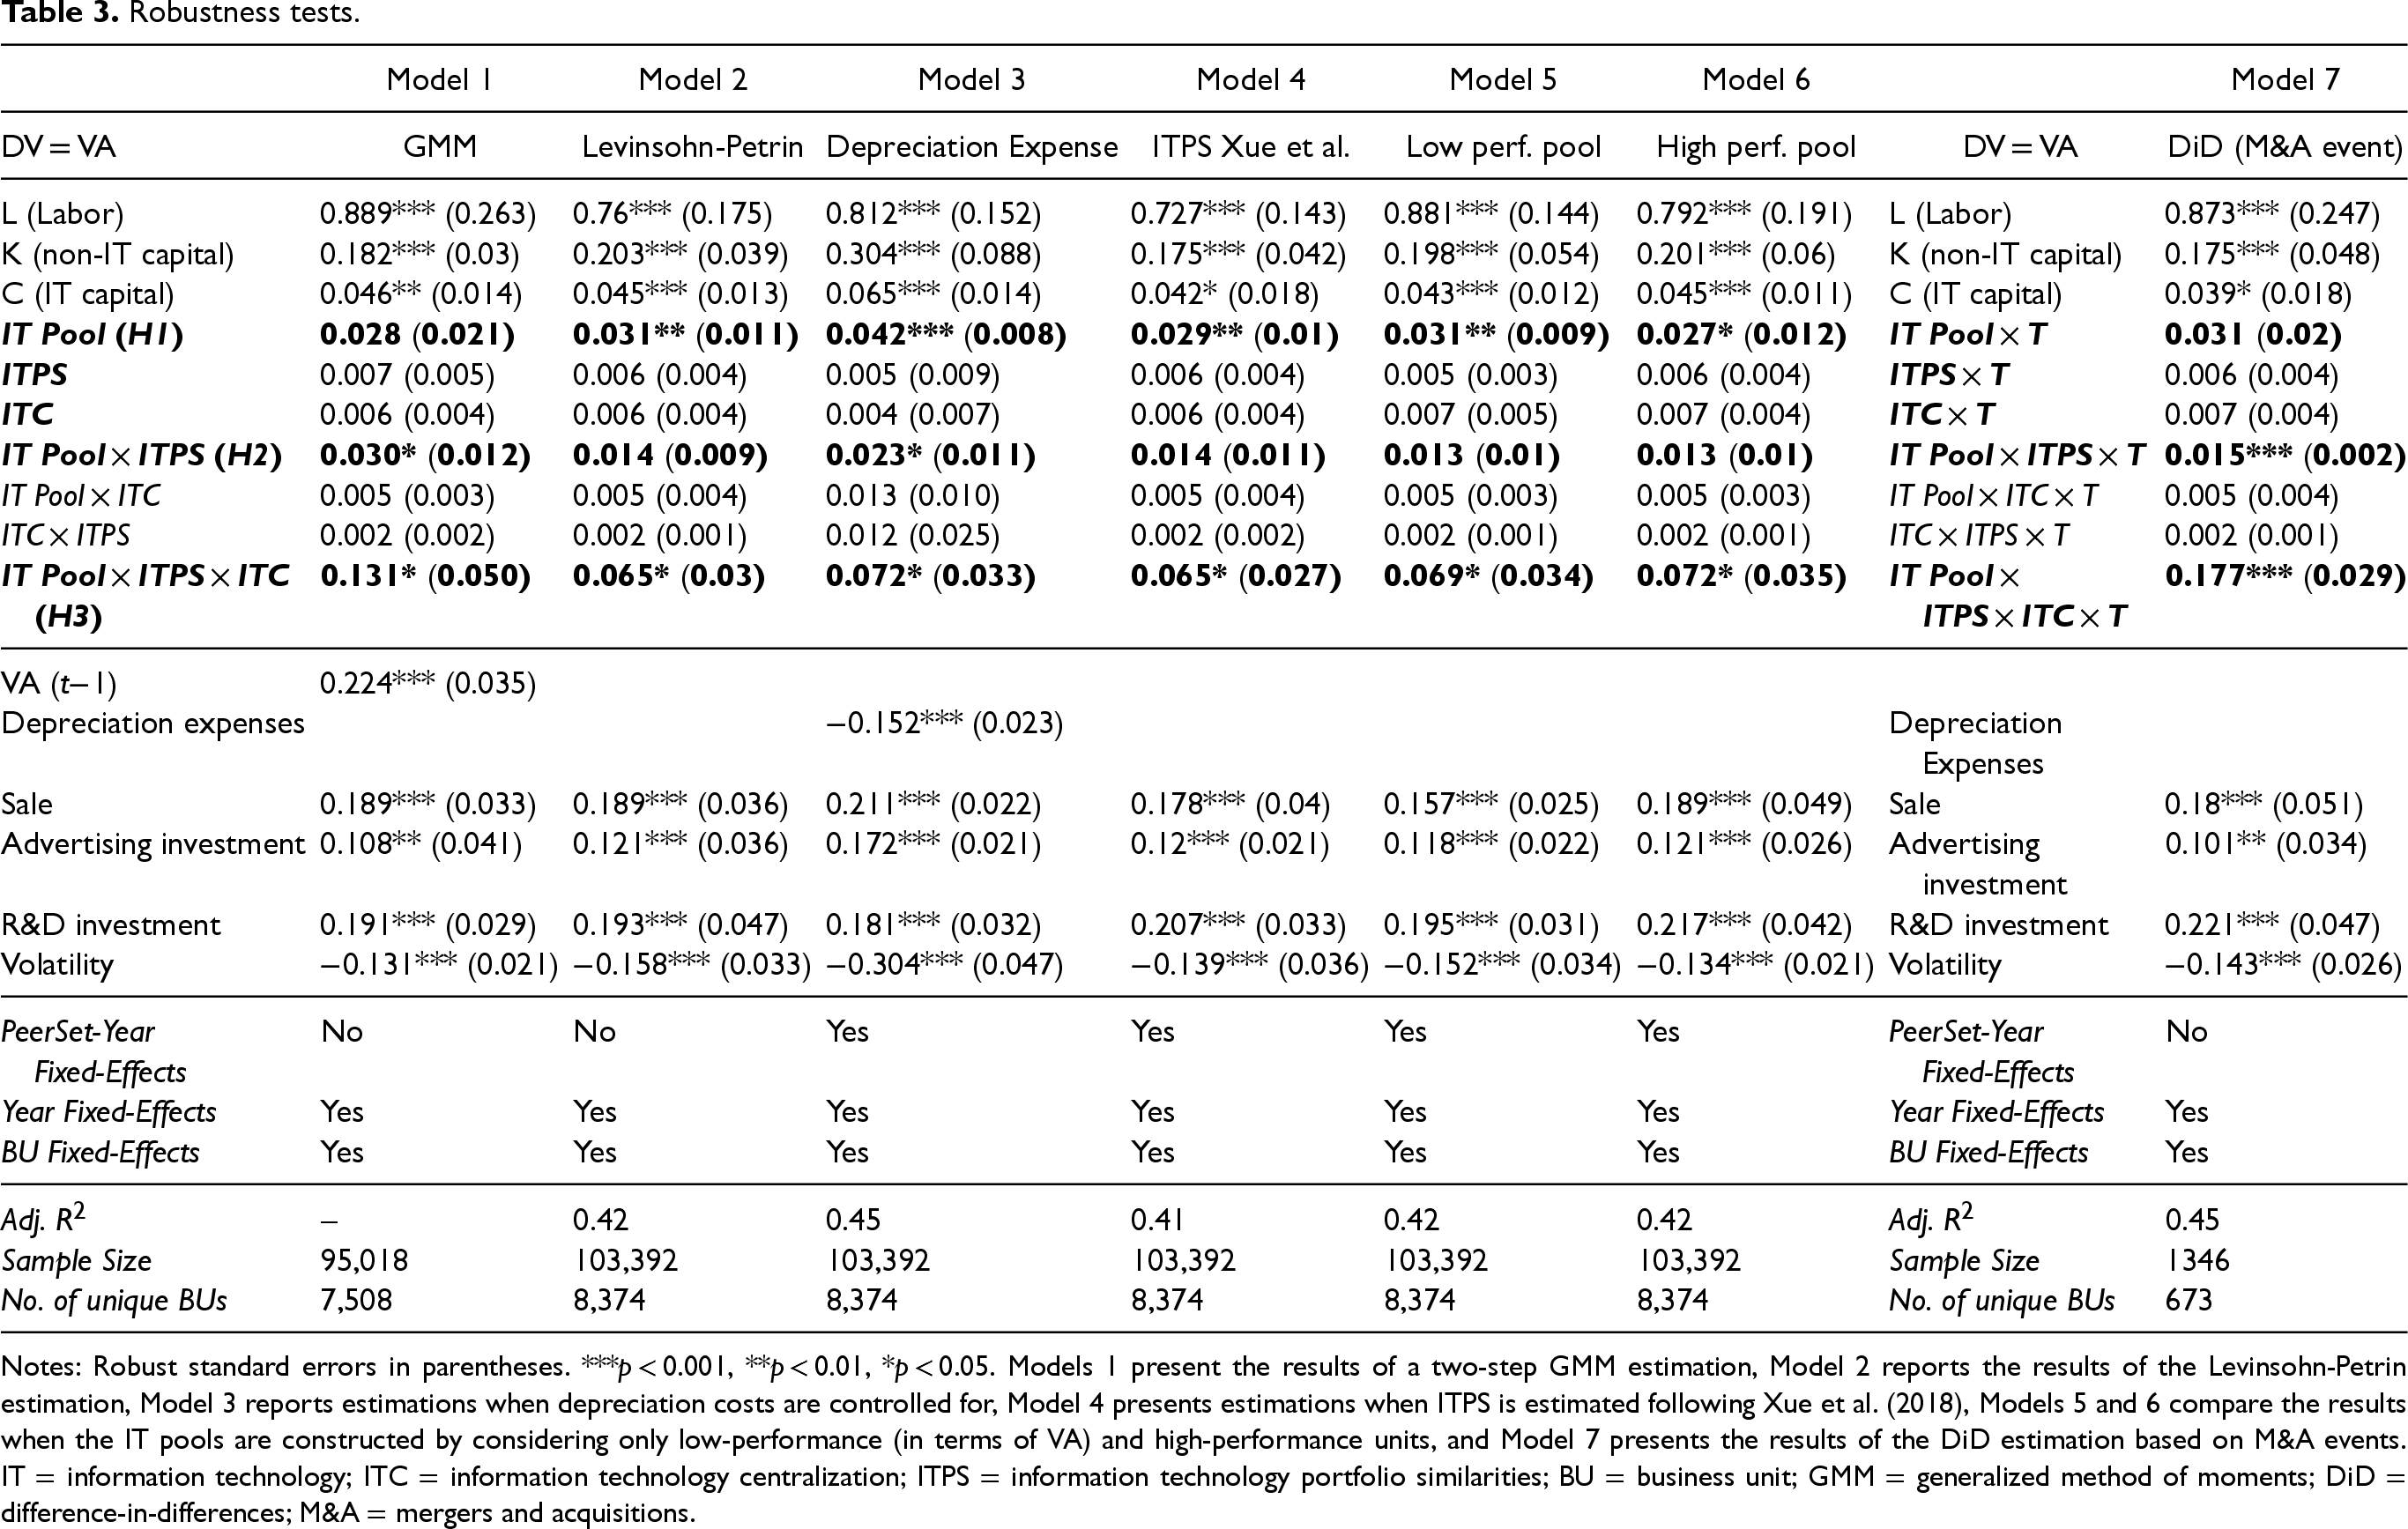
The main results remained robust when testing our model under alternative specifications, measurements, and sampling strategies. Table 3 also includes the findings of these alternative estimations. Model 1 in Table 3 shows the estimation results with a dynamic panel specification (by including the lagged value of VA as an additional covariate) following the suggestions of Arellano and Bond (1991). This specification is suitable for unbalanced short panels, such as the ones like our panel, and is used as a robustness check in previous IT externality studies (e.g., Tambe and Hitt, 2013) in addressing concerns about the dynamic impact of an outcome variable such as VA and possible threats of endogeneity in a production-function specification. 11 Since it is likely that a time-variant unobserved variable at time t is correlated with the level of variables in round t−2 and before (i.e., the instruments) if the error terms are serially correlated (in such cases, lags deeper than two should be used in instrumenting), we checked for this possibility first. The value of the AR(2) z-test is 0.67, which fails to reject the null hypothesis that error terms are not auto-correlated. Further, the difference-in-Hansen test statistics (chi2) of the exogeneity of instruments indicate the null hypothesis of exogeneity of the collection of the instruments cannot be rejected (p = 0.206). In addition to the IS literature (e.g., Bardhan et al., 2013; Tambe and Hitt, 2013), this method is frequently used in other premier management outlets (e.g., Germann et al., 2015; Josephson et al., 2019; Kübler et al., 2018) for similar robustness check purposes. Model 2 confirms the robustness of our findings to this specification. It is noteworthy that the coefficient estimate sizes in this alternative instrumental approach remain very close to those rendered through a 2sls estimate relying on Hausman-type instruments. Instrumental approaches have their own limitations. However, it is unlikely that in the presence of estimate bias, two different instrumental approaches cause the same extent of coefficient bias and in the same direction. As such, the fact that the estimates from the AB-GMM approach converge in size and direction with those of the main analysis further allows us to verify that the estimated coefficients are not subject to large biases. Model 3 in Table 3 tests the robustness of our findings to the inclusion of asset depreciation costs (Rai et al., 2015), retrieved from NETS, and shows that key coefficient estimates remain comparably similar in terms of effect size and significance.
Robustness tests.
Robustness tests.
Notes: Robust standard errors in parentheses. ***p < 0.001, **p < 0.01, *p < 0.05. Models 1 present the results of a two-step GMM estimation, Model 2 reports the results of the Levinsohn-Petrin estimation, Model 3 reports estimations when depreciation costs are controlled for, Model 4 presents estimations when ITPS is estimated following Xue et al. (2018), Models 5 and 6 compare the results when the IT pools are constructed by considering only low-performance (in terms of VA) and high-performance units, and Model 7 presents the results of the DiD estimation based on M&A events. IT = information technology; ITC = information technology centralization; ITPS = information technology portfolio similarities; BU = business unit; GMM = generalized method of moments; DiD = difference-in-differences; M&A = mergers and acquisitions.
In addition, we also estimated our model using a Levinsohn-Petrin (2003) estimation that uses changes in materials inputs to account for the unobserved short-run productivity shocks. When these shocks are unaccounted for, the estimates from fixed-effects and OLS will be biased. Levinsohn-Petrin's approach uses the increase (decrease) in intermediate inputs as proxies for positive (negative) shocks. Also, Levinsohn-Petrin's estimations use bootstrapping to estimate the standard error to reduce complexities in deriving an analytical covariance matrix. Model 2 in Table 3 reports the results of this estimation. The results show a similar pattern compared to the main estimation.
Moreover, Model 4 in Table 3 presents the results of a specification when ITPS is determined based on a more nuanced treatment of IT assets. As Xue et al. (2018) note, not all IT assets in the portfolio of a BU are similar in their frequency of usage. Therefore, a variant of ITPS, which is based on the weight of IT assets in estimating ITAD, could be used:
Finally, it is conceivable to assume that the estimates of IT_Pool suffer from an upward bias in cases where knowledge is BUs with superior performance that happens to also have higher investment in IT that drives the observed increase in VA for the focal BU. If that is the case, the effects are not due to IT externalities. If this alternative explanation is correct, the estimates of IT_Pool coefficients for the pool of BUs with low VA should be significantly lower than the IT_Pool estimates for the pool of BUs in high performance. To test this issue, Models 5 and 6 in Table 3 present the results with measures of IT_Pool that only consider BUs with low and high VA (based on a median split), respectively. The coefficient estimates of the three-way interaction for the pool of BUs with low VA are slightly lower compared to the estimate for a pool of BUs with high VA (0.069 and 0.072, respectively), but in both cases, IT_Pool and the three-way interaction coefficient estimates remain positive and significant.
While our main identification strategy is utilizing existing instrumental approaches, we have also pursued an event-based design. Specifically, we focus on mergers and acquisitions (M&A) events, in which certain units previously belonging to a separate firm become part of the focal MBF. In such cases, it is reasonable to assume that the composition of the IT assets portfolio and the extent of IT investment prior to the M&A event (t−1) for the acquired/merged units are independent of unobserved heterogeneity that impacts value added at a focal BU at the time (t). Because it is possible that M&As are happening for operational reasons, a selection issue is a likely concern. Therefore, we specifically focus on M&As with non-operational purposes, following Lee et al. (2022). SDC platinum has a purpose code where the operational versus non-operational purposes of M&A can be identified. The non-operational reasons are often finance-related, such as increasing cash flow or increasing shareholder value. We found 82 of such events impacting 673 BUs. We construct IT_Pool based on the pool of investments made by the acquired/merged units only, and ITPS is also estimated by comparing the IT assets portfolios of the focal unit at (t−1) with those of acquired/merged units at (t−1). We also consider the lagged value of ITC (t−1) for the focal BU. A difference-in-differences specification is then defined using the following equation:
In summary, our findings indicate that a BU of an MBF can accrue intra-firm externality benefits in the form of value-added when two conditions are met: (a) its operational IT assets overlap with those of other units (high ITPS), and (b) IT decisions at the focal BU are governed centrally (ITC). Specifically, we find that vertical coordination through centralizing decisions is essential to benefit from the similarity between IT portfolios, which represents a form of horizontal coordination.
Moreover, our findings show that the value-added benefits are particularly enhanced when the pool of IT investments is supplied by units with a higher number of IT employees, and these benefits accrue the most in units that underinvest in IT labor. This latter finding further supports the idea that intra-firm benefits from IT investment pools are enabled through non-rivalrous IT intangibles—such as knowledge, code, and consulting savoir-faire—that are produced by talent interacting with and innovating upon IT investments.
Overall, the results underscore the complementarity of vertical and horizontal coordination when achieving synergetic benefits from intra-firm resources that produce non-rivalrous byproducts.
Contributions
Our study makes a few notable contributions to the existing literature on operations management. First, we highlight the productivity impacts of IT centralization on obtaining an important source of benefit from IT expenditures across multiple BUs, that is, externality benefits. This finding extends the pioneering work on network gains, which had found risk pooling (Kulkarni et al., 2004), innovating (Sting and Loch, 2016), and capacity sharing (Cui et al., 2023; Qi et al., 2019; Wang et al., 2021; White et al., 2011; Xie et al., 2021) impacts in multi-production networks. We add to this literature by highlighting the productivity externalities of resources, especially by considering a group of resources, digital ones, with highly non-rivalrous intangibles associated with them. The below quote from our interview operations managers of interMBF, a major international MBF, further explains that the non-rivalrous intangibles generated by IT talent might indeed characterize the way that IT resources create externalities in an MBF setting:
It is possible that we have had instances of capacity sharing, where we have hosted something on another unit's server, quite possible, but I am not sure that's a regular occurrence because if it is, the unit gets those proprietary resources, say more server space, the next year. What is more likely to happen, and because you are asking where value comes from, is that the units can tap on each other's expertise to develop or innovate a piece of software that is quite useful. When we were at the beginning of developing applications with our IoT platform, it was the sharing of ideas that led to elevated value. I remember that our auto branch had figured out a personal driving pattern detection software that was quite popular with our automobile production partners, yet the same idea transferred to the appliances domain and created a slew of patents and popular products. Both branches obviously were part of our IoT initiative, but what I am saying is that innovations built on the same piece of technology and turned into features and products are key in creating value.
While the capacity sharing of resources, that is, using the idle capacity of resources in one BU in another, is one mechanism to create value, we focus on IT resources that create external value within firm units through their associated intangibles. This is a notable addition to the literature because capacity sharing works best when one unit can utilize the unused capacity of a resource that it does not possess itself—as the focal unit can reap value from it without paying the fixed and/or variable costs for the resource. As such, the known capacity-sharing economies accrue when the units are distinct in the resources they own. In sharp contrast, we find that the similarity of IT assets is an essential element in reaping value from IT investments of other units. Moreover, we find that the benefit from IT investment pools does not accrue from pools of BUs without enough IT employees. Taken together, this makes a marked departure from the literature: that resource synergies can also occur through non-rivalrous intangibles created around a resource, and in such cases, resource overlap, as opposed to resource distinction, is desired. We provide evidence that the externality benefits are created by investing BUs that have access to high levels of IT employees—especially because IT employees are generative of non-rivalrous intangibles such as internally developed software, technical expertise, and consulting savoir-faire.
Second, by studying modes of operational control over IT and showing their impact, this study extends previous research studying the coordination types. Previous literature has mostly either focused on horizontal (e.g., Hu et al., 2022) or vertical coordination (Arya and Mittendorf, 2013; Davies and Joglekar, 2013; Fang et al., 2023; Li et al., 2023; Lin et al., 2014). Relatively sparse research that considers them together has found the two forms of coordination to be substitutes (Huang et al., 2010; Sting and Loch, 2016). We extend this literature by finding that a form of horizontal coordination, that is, enabled through ITPS, along with vertical coordination, that is, ITC, acts as complements to realize productivity gains from resources with a high possibility of creating non-rivalrous intangible byproducts. This contrasting finding may be explained by the fact that we focus on productivity gains through pools of investment in a resource with associated intangibles. Under such conditions, a tight coupling between horizontal and vertical coordination is needed. Horizontal coordination is needed because intangibles created in one unit need to be applicable and re-deployed in another. As our findings show, such a possibility of re-deploying intangibles does not happen in the absence of vertical coordination. According to the literature in operation management documents (Huang et al., 2010; Shi et al., 2020), headquarters have detecting and orchestrating capabilities without which identifying and channeling non-rivalrous intangibles might not be practically optimal.
Third, our work extends the broader research on IT externalities in inter-firm contexts (e.g., Tambe and Hitt, 2013) and not only finds evidence of these externalities in within-firm setups but also provides evidence of how such intra-firm externalities are enabled: (1) inputs generative of associated intangibles, that is, IT human talent, are key in creating those externalities, and (2) BUs that are poor in access to such talent reap the highest levels of benefit from IT investment pools within MBFs.
Implications for Practice
In addition to its theoretical contributions, this study offers actionable guidance for operations practitioners, specifically infrastructure and operations leaders responsible for managing technical infrastructure, optimizing costs, and ensuring operational harmony across business units. Our work targets maximizing the value derived from IT investments in MBFs by identifying the conditions and strategies that increase externalities. Realizing these externalities ensures that intangibles such as code, knowledge, and consulting savoir-faire, once developed in one unit, can be leveraged at reduced cost across other units.
By following this framework, infrastructure and operations leaders can strategically harness network externalities, ensuring IT resources are shared and optimized across BUs to lower costs and increase value from IT investments. This structured approach enables efficient IT management by focusing on synergy and resource pooling, allowing knowledge, technology, and expertise to benefit multiple units, ultimately providing a competitive advantage across the MBF.
Limitations
Although we study a wide range of organizations, increasing the generalizability of our findings, more research is needed to test the robustness of our findings in firms that are not publicly traded. Moreover, our implicit assumption is that overlapping units with shared governance have enough contact to facilitate exchanges that lead to the transfer of non-rivalrous intangibles. While our study takes a macro approach that intends to provide population-average evidence about the presence of intra-firm externalities in MBFs and explain the macro-level role of ITC in facilitating those externality benefits, unfolding the details of exchanges enacted by ITC in overlapping units falls outside the scope of our study. Internal transfers, serving on cross-unit task forces, and inter-unit missions are examples of such exchanges. While these exchanges are hard to discover in archival data collection approaches, even in the now-available online resumes of employees working in these units, alternative design methods such as case studies and ethnographic experiments can provide further insights about organizational micro-mechanisms that enhance intra-firm externalities in MBFs. Further, our data includes limitations that did not allow us to directly observe the possibility of using unused capacities across the BUs, the business relatedness or alignment across BUs, and brand-level relatedness.
Supplemental Material
sj-pdf-1-pao-10.1177_10591478251369600 - Supplemental material for Reaping IT Externality Benefits Across Business Units in Multibusiness Firms
Supplemental material, sj-pdf-1-pao-10.1177_10591478251369600 for Reaping IT Externality Benefits Across Business Units in Multibusiness Firms by Taha Havakhor, Mohammad Saifur Rahman and Pankaj Setia in Production and Operations Management
Footnotes
Declaration of Conflicting Interests
The authors declared no potential conflicts of interest with respect to the research, authorship, and/or publication of this article.
Funding
The authors received no financial support for the research, authorship, and/or publication of this article.
Notes
How to cite this article
Havakhor T, Rahman MS and Setia P (2026) Reaping IT Externality Benefits Across Business Units in Multibusiness Firms. Production and Operations Management 35(1): 147–166.
References
Supplementary Material
Please find the following supplemental material available below.
For Open Access articles published under a Creative Commons License, all supplemental material carries the same license as the article it is associated with.
For non-Open Access articles published, all supplemental material carries a non-exclusive license, and permission requests for re-use of supplemental material or any part of supplemental material shall be sent directly to the copyright owner as specified in the copyright notice associated with the article.