
Abstract
Agrochemical companies operate multi-echelon, long-lead-time supply chains to serve seasonal and uncertain demand for crop protection products from farmers around the globe. To match supply and demand in this challenging setting, alignment of the sales and supply chain functions is crucial. We investigate this alignment task, building on a case study. At the case company, cross-functional coordination is achieved through annual sales and operations planning (S&OP) budget meetings. In the budgeting process, sales and supply chain organizations agree on a set of supply volume guarantees to align commercial and production plans. The guarantees must respect a maximum allowable inventory investment imposed by the business unit head. Our work focuses on the choice of these volume guarantees. Specifically, we support the S&OP negotiation process by developing an optimization-based budget planning model. Importantly, the model reflects differences in the decision-making scope and power of the relevant actors. Moreover, it captures the available flexibility of future plan adjustments by means of an affinely adjustable robust optimization approach. We evaluate the performance of our model against relevant benchmarks in two numerical studies, based on synthetic and real-world data. We also study the structure of the obtained solution. We find that optimizing the volume guarantees can substantially reduce lost margins, relative to uniform guarantees. For our real-world data set, our approach saves up to 32% relative to a current practice benchmark.
Introduction
A company’s success depends on the efficient and effective collaboration of its individual functions, such as sales, marketing, production, finance and supply chain. However, cross-functional alignment is often hampered by opposing incentives, asymmetric information and distributed decision-making power (Romano, 2003; Tuomikangas and Kaipia, 2014). Sales and operations planning (S&OP) meetings are a means of coordination that many companies have put in place to align their mid-term commercial aspirations with given operational constraints (Oliva and Watson, 2011; Thomé et al., 2012). Although a substantial amount of literature has been published on various aspects of S&OP, such as its procedural setup and empirical effectiveness (Tuomikangas and Kaipia, 2014), research on analytical models that support S&OP decision-making is limited (Pereira et al., 2020). Moreover, many analytical contributions assume, at least implicitly, a single, central decision-maker, optimizing a single objective function. By doing so, they ignore the very reason for establishing an S&OP process, namely, conflicting incentives as well as differences in information availability and decision-making power. Consequently, such model formulations face two major challenges that limit their value in practice. First, asymmetric and incomplete information hinders appropriate model parameterization. Second, any globally optimized solution that conflicts with the incentives of strong decision-makers will likely be blocked and thus not be implementable.
In this article, we consider a real-world S&OP problem from the agrochemical industry that is characterized by the above-mentioned incentive, information, and decision-making power challenges. The case company operates a global, multi-echelon, capacitated, long-lead-time supply chain to serve the seasonal and uncertain demand for agrochemical products. To align the commercial plan of the sales organization with the production and distribution plan of the supply chain, both functions agree on a set of supply volume guarantees. The guarantees must respect a maximum allowable inventory investment constraint imposed by the business unit head to steer working capital and cash flow requirements. At present, the volume guarantees at the case company result from an unstructured and iterative negotiation process, which employs rather simple allocation strategies. We propose an alternative optimization-based approach to determine these guarantees. By closely reflecting the existing power and incentive structure at the case company, we ensure that the identified solution is implementable in practice.
Our paper is rooted in the S&OP literature. Our main contributions are fourfold. First, we provide insights into a real-life S&OP problem in the agrochemical industry. We discuss the actors involved, their roles, incentives, and decision power, as well as the coordination mechanism that is currently in place at the case company. We point out that the setting is at odds with common assumptions in the literature concerning differences in power, information availability, and objectives between key stakeholders. We argue that these observations extend beyond our specific case and call for a critical reflection on how to model S&OP decisions.
Second, we disentangle the elements of a currently unstructured negotiation process governing the interplay between sales, production, and distribution. We derive a conceptual model of this process, thereby enhancing transparency and providing a basis for a formal mathematical model.
Third, we formulate an advanced optimization model that captures core S&OP elements in their organizational context. We propose to reflect the distribution of decision-making power within the case company through a nested optimization model. The inner problem captures the task of the supply chain department to supply volumes to the sales department while guaranteeing robust adherence to an exogenous maximum inventory investment target introduced by the business unit head under uncertain market demands. We argue that adjustable robust optimization is a well-suited methodology for this task. The outer problem represents the decision of the sales department. The task of the sales department is to pick a volume plan which minimizes expected lost margin and is suppliable under the maximum inventory investment constraint managed by the supply chain department. To accurately reflect the different decision scopes of both departments, we therefore nest a robust minimization problem (supply chain department) as a constraint in an expected value minimization problem (sales department). This distinguishes our work methodologically from the existing S&OP literature. While the details of S&OP differ between companies, we believe that the arguments for our methodological choice apply more broadly and may help to add realism to the modeling of S&OP in general.
Fourth, we test our model numerically, and compare it against relevant benchmarks relying on simpler heuristics. Using a controlled synthetic data set, we identify key performance drivers. We then calibrate the observed effects on the basis of a real-world data set from the case company.
The remainder of this article is structured as follows. In the next section, we provide an overview of the related literature. In Section 3, we present relevant aspects of agrochemical supply chains, as well as the budget planning problem within the case company’s S&OP process. We develop our analytical model formulation in Section 4. In Sections 5 and 6, we assess the performance of our approach based on synthetic and real-world data from the case company, respectively. We conclude our work by discussing limitations and opportunities for future research in Section 7.
Literature review
The concept of S&OP has received substantial attention since its emergence in the 1980s (Wallace and Stahl, 2008). Although S&OP cannot dispel cross-functional conflicts, its goals are to establish a temporal consensus on mid-term priorities based on overarching strategic plans and to obtain a single and aligned tactical plan, balancing the sales aspirations of the commercial functions with the supply and distribution capabilities of operations (Goh and Eldridge, 2019). We contribute to the S&OP literature by providing practical insights into processes and coordination mechanisms used to facilitate S&OP at a multinational agrochemical company.
As opposed to the rich research streams covering the procedural setup and the empirical analyses of S&OP (Grimson and Pyke, 2007; Gunasekaran et al., 2001; Kristensen and Jonsson, 2018), the literature on analytical models to guide S&OP decisions is sparse. Moreover, these works mostly focus on extending traditional production planning problems with selective decisions of a single additional function. We refer the reader to Pereira et al. (2020) for a comprehensive overview. Only a few authors have proposed holistic model formulations that fully integrate the supply and sales decisions commonly addressed by S&OP. In the majority of the existing contributions, optimal solutions are obtained by consolidating the performance trade-offs of different cross-functional decisions into a single, integrated objective function of a central decision-maker.
In this vein, Nemati and Alavidoost (2019) provide a fuzzy mixed-integer program (MIP) to jointly optimize purchasing, production, distribution, and sales planning at an Iranian fast-moving consumer goods company. Susarla and Karimi (2018) combine procurement, multi-echelon production and distribution planning, and cross-market sales. They develop a deterministic MIP formulation to optimize the total profits of a multinational pharmaceutical supply chain. Based on a case study from an oriented strand board company in Canada, Feng et al. (2008) present an MIP capturing decisions of sales, production, distribution, and procurement in a deterministic make-to-order environment, which they later extend to the stochastic case (Feng et al., 2013). Bajgiran et al. (2016) provide a deterministic MIP to support the S&OP problem of a Canadian lumber supply chain that demands joint optimization of harvesting, procurement, production, inventory, transportation, and sales activities. Motivated by the planning problem of an automotive company, Torabi and Hassini (2009) capture procurement, production, distribution, and sales decisions in a single, integrated fuzzy goal programming formulation. For a comprehensive value-based view on S&OP models, Hahn and Kuhn (2011) combine the physical product flow driven by overtime, production, transportation, and marketing campaign plans with the financial perspective of associated cash flows, financing costs, and constraints in a deterministic linear program (LP).
Assuming that all cross-functional decisions can be jointly optimized through a single global objective function does not capture the reality of distributed decision-making power and conflicting cross-functional incentives. These are the core arguments for the importance and establishment of S&OP, however (Oliva and Watson, 2011). Very few authors explicitly address distributed, asymmetric decision-making in their model formulations (Rius-Sorolla et al., 2020). Hu et al. (2011) model conflicting incentives and the distributed decision-making power of production and sales departments through Nash and Stackelberg games and assess its implications on the outcomes of a generic tactical production and distribution planning problem. Based on a case study from the semiconductor industry, Karabuk and Wu (2003) propose a capacity planning model under distributed decision-making that incorporates information asymmetry and conflicting incentives of manufacturing, marketing, and the divisional head in a stochastic program (SP). To capture the impact of distributed tactical decision-making under conflicting objectives, Hjaila et al. (2017) integrate game-theoretical concepts in a mathematical programming formulation to determine production, distribution, and sales plans for an energy production and chemical manufacturing supply chain. Our paper contributes to the latter research stream on S&OP models that explicitly reflect distributed decision-making and commonly perceived organizational behavior in their model formulations.
Scholars have studied various supply chain planning problems in the agrochemical industry, both in the crop protection and in the seeds business. Bassett and Gardner (2010) discuss the network design, as well as monthly production and shipping problem of an agrochemical supply chain. The authors propose an integrated mixed-integer linear program to optimize total profitability and apply it to a single product of Dow AgroSciences. Naraghi and Jiang (2023) address a production and distribution planning problem of an agrochemical active ingredient under uncertain demand. The authors develop a stochastic mixed-integer nonlinear programming model to minimize total supply costs and expected lost demand. Motivated by the inventory management of crop protection products characterized by highly seasonal and uncertain demand, Schlapp et al. (2022) examine how firms should determine both inventory quantity and timing to maximize expected profits. Their work introduces a time dimension to the classical newsvendor problem. Bansal and Nagarajan (2017) address the production planning problem of a seeds supplier facing limited raw material availability and uncertain production yields. The authors analyze the option of investing in an additional production location that serves as a backup in the case of low production yield. Also in the seeds business, Bansal and Dyer (2020) develop an optimization approach for an inventory planning problem for a product portfolio in a newsvendor-like environment with demand substitution. Comhaire and Papier (2015) study the seed production network of Syngenta subject to supply- and demand-side uncertainties. The authors propose a simulation tool to improve the expected profit of the firm. Our study contributes to the literature on agrochemical supply chain planning by providing a real-world case study of the S&OP process of a multinational agrochemical supplier.
Based on the research collaboration, we propose a decision-support model for S&OP in the agrochemical industry. At the case company, supply and sales plans must be aligned with an overarching maximum allowable inventory investment through a shared budget plan that consists of a set of volume guarantees to be supplied by the supply chain organization to the sales regions. The agreed volume guarantees must comply with the maximum allowable inventory investment even under uncertain demand. We ensure this requirement by choosing a robust optimization formulation for modeling the multi-stage production of agrochemical products. We refer to Ben-Tal et al. (2009b), Bertsimas et al. (2011), and Gorissen et al. (2015) for an overview of robust optimization. This modeling approach distinguishes our work methodologically from that in the existing literature. To appropriately capture the existing flexibility to adjust decisions over time in response to revealed uncertainties and thus to avoid overly conservative assessments of worst-case performance through a traditional static model, we use an affinely adjustable robust optimization (AARO) formulation based on Ben et al. (2004). Over the last two decades, AARO approaches have been applied to various operations research problems, such as robust inventory management in multi-stage supply chains (Ben-Tal et al., 2009a; Kim and Chung, 2017), strategic network planning (Ning and You, 2017), and cross-organizational coordination (Ben-Tal et al., 2005). For an overview on adjustable robust optimization, see Yanıkoğlu et al. (2019).
Problem description
Farmers use crop protection products (CPPs) to safeguard production yields by preventing crop damage through weeds (herbicides), insects (insecticides), or fungi (fungicides) on their fields (Agovino et al., 2019; Oerke and Dehne, 2004). As both the research and production processes of agrochemicals are capital intensive, the global market of CPPs is served by a small number of multinational organizations operating global supply networks.
Similar to pharmaceuticals (Shah, 2004), CPPs rely on active ingredients (AIs) to provide the desired crop protection effects. AIs are synthesized in large-scale reactors and typically produced at global production sites. While this exploits economies of scale and makes complex chemical production economically viable, it also renders the supply chain less responsive. Capacity and therefore AI volumes are inflexible. Moreover, the lead times to the next production step, referred to as formulation, are long. In the formulation stage, AIs are blended with several formulants (inert ingredients) and processed into the final bulk product, which is then filled, packaged, and labeled in compliance with local regulations into a marketable sales article (Gehen et al., 2019). In contrast to AI production, the formulation and subsequent tasks are conducted in regionally distributed sites from where the final products are sold through one or multiple distribution layers to farmers (Fritz and Hausen, 2009).
The demand for CPPs is both highly seasonal and uncertain. To successfully meet this demand with the above-described long lead time and capacitated supply chain, thorough cross-functional coordination is crucial. This is commonly achieved through S&OP. At the case company, S&OP processes are composed of a cascade of meetings held regularly throughout the year at different hierarchical levels with various regional and product portfolio scopes.
Most prominently and to provide all lower-level S&OP activities with an overarching directive, an annual budget meeting is hosted by the business unit (BU) head, together with the senior management of the relevant functions, namely, sales and supply chain. As an integral part of the process, a budget plan is developed to coordinate the commercial ambitions of the sales department (SD) with the supply capability of the supply chain department (SCD) for the upcoming seasons. The alignment is complicated by several distinct functional business challenges, both on the demand and the supply side.
On the demand side, the application of CPPs by farmers is limited to only a few weeks per year. It is affected by various hard-to-predict factors, such as local weather conditions driving the disease pressure on the fields, fluctuating prices for agricultural commodities, and the sales activities of competitors. Due to this high demand seasonality and uncertainty, the SD is enticed to adjust sales plans dynamically in response to current but volatile regional market conditions.
On the supply side, the constrained production capacity as well as the long production and distribution lead times demand pre-production and inventory build-up prior to the selling season. This limits the SCD’s ability to react and adjust to changing in-season sales plans (Affonso et al., 2008; Lahloua et al., 2018).
Acknowledging both perspectives, the SD and the SCD, therefore, agree during the budgeting process on a set of monthly volume guarantees to be supplied over the next two years. These guarantees serve as tactical guardrails within which sales teams can structure their marketing activities across the product portfolio, and the supply chain can detail production and distribution planning (Romano, 2003; Thomé et al., 2012).
Prior to any budget discussions on how to allocate guarantees across the product portfolio, the BU head imposes a maximum allowable inventory investment target. This target serves two purposes. First, it can be used to actively control the ‘‘operating mode” of the organization. The chosen target level impacts the trade-off between high inventory investment associated with high volume guarantees and the risk of lost margins. Second, it is a means to introduce aspects to the budgeting process that are neither directly SD- nor SCD-related. Such factors include the current competitive situation of the global crop protection market, strategic growth aspirations and/or potential working capital and cash flow requirements imposed by the board of directors.
To understand the role and incentives of the SD during the budgeting process, we highlight the implemented key performance indicators (KPIs) and the associated compensation schemes for sales managers. On the organizational level, the performance of the overall SD is predominantly measured based on the generated revenue and, most importantly, the associated contribution margin. To align the efforts of individual sales managers with the SD target, their compensation packages strongly depend on their individual contribution to those KPIs. Therefore, the SD has an incentive to capture as much of the seasonal and uncertain customer demand as possible. Consequently, it is in the SD’s interest to strategically request volume guarantees that minimize the risk of lost margins, irrespective of other related costs caused by producing and stocking the requested quantities. The ability of noncommercial functions, such as the SCD, to challenge communicated sales aspirations is limited. The SCD does not have detailed information on local market conditions or on the overall competitive environment, nor does it have direct access to customers. This puts the SD in a stronger position to influence the outcome of the budgeting process.
Expectations toward the SCD are twofold. First, it needs to secure the supply of the volume guarantees agreed on during the budgeting process. Second, it needs to ensure that the maximum allowable inventory investment set by the BU head is not violated. One particular challenge is that the required inventory depends not only on the tactical supply plan but also on the available flexibility to adjust this plan over time in response to observed sales. Both requirements are reflected in the compensation scheme of the SCD at the case company. Supply chain managers receive a lump sum bonus payment at the end of the business year if the total inventory investment did not exceed the defined target and if the agreed volume guarantees were reliably supplied to the SD. Note that while the sales managers’ compensation depends proportionally on generated contribution margin, the SCD receives a lump sum bonus for satisfying supply and inventory-related conditions. Our modeling approach presented in the next section reflects this difference in compensation between the SD and the SCD.
It is noteworthy that the BU head at the case company opted not to design a mechanism that aligns the incentives of the SD and the SCD to jointly minimize expected lost margin while adhering to the inventory investment target. Instead, the case company operationalized both performance targets separately by incentivizing the SD to focus on margin optimization and the SCD to prioritize inventory control. This strategy diverges from a mechanism design approach, which would seek to align agent incentives with the overall objectives of the firm (Groves and Loeb, 1979). Discussions with the case company revealed that incorporating conflicting incentives in the S&OP process is viewed as desirable and is intended to foster accountability within each department’s span of control. The S&OP process is thereby conceptualized as an arena in which interdepartmental conflicts can be constructively negotiated, particularly prior to and during the budget meeting. As the alignment process is iterative, unstructured and highly nontrivial, analytical support can help to guide the discussions and to limit the risk of subpar supply guarantees.
Based on the above characteristics, the goal of the budget planning process can be formulated as follows:
Given the set of potential volume guarantees that the supply chain organization can offer while respecting the inventory ceiling, select the guarantee set that minimizes the expected lost margin over the planning horizon, given uncertain sales.
Figure 1 visualizes this process with notation to be introduced in Section 4.
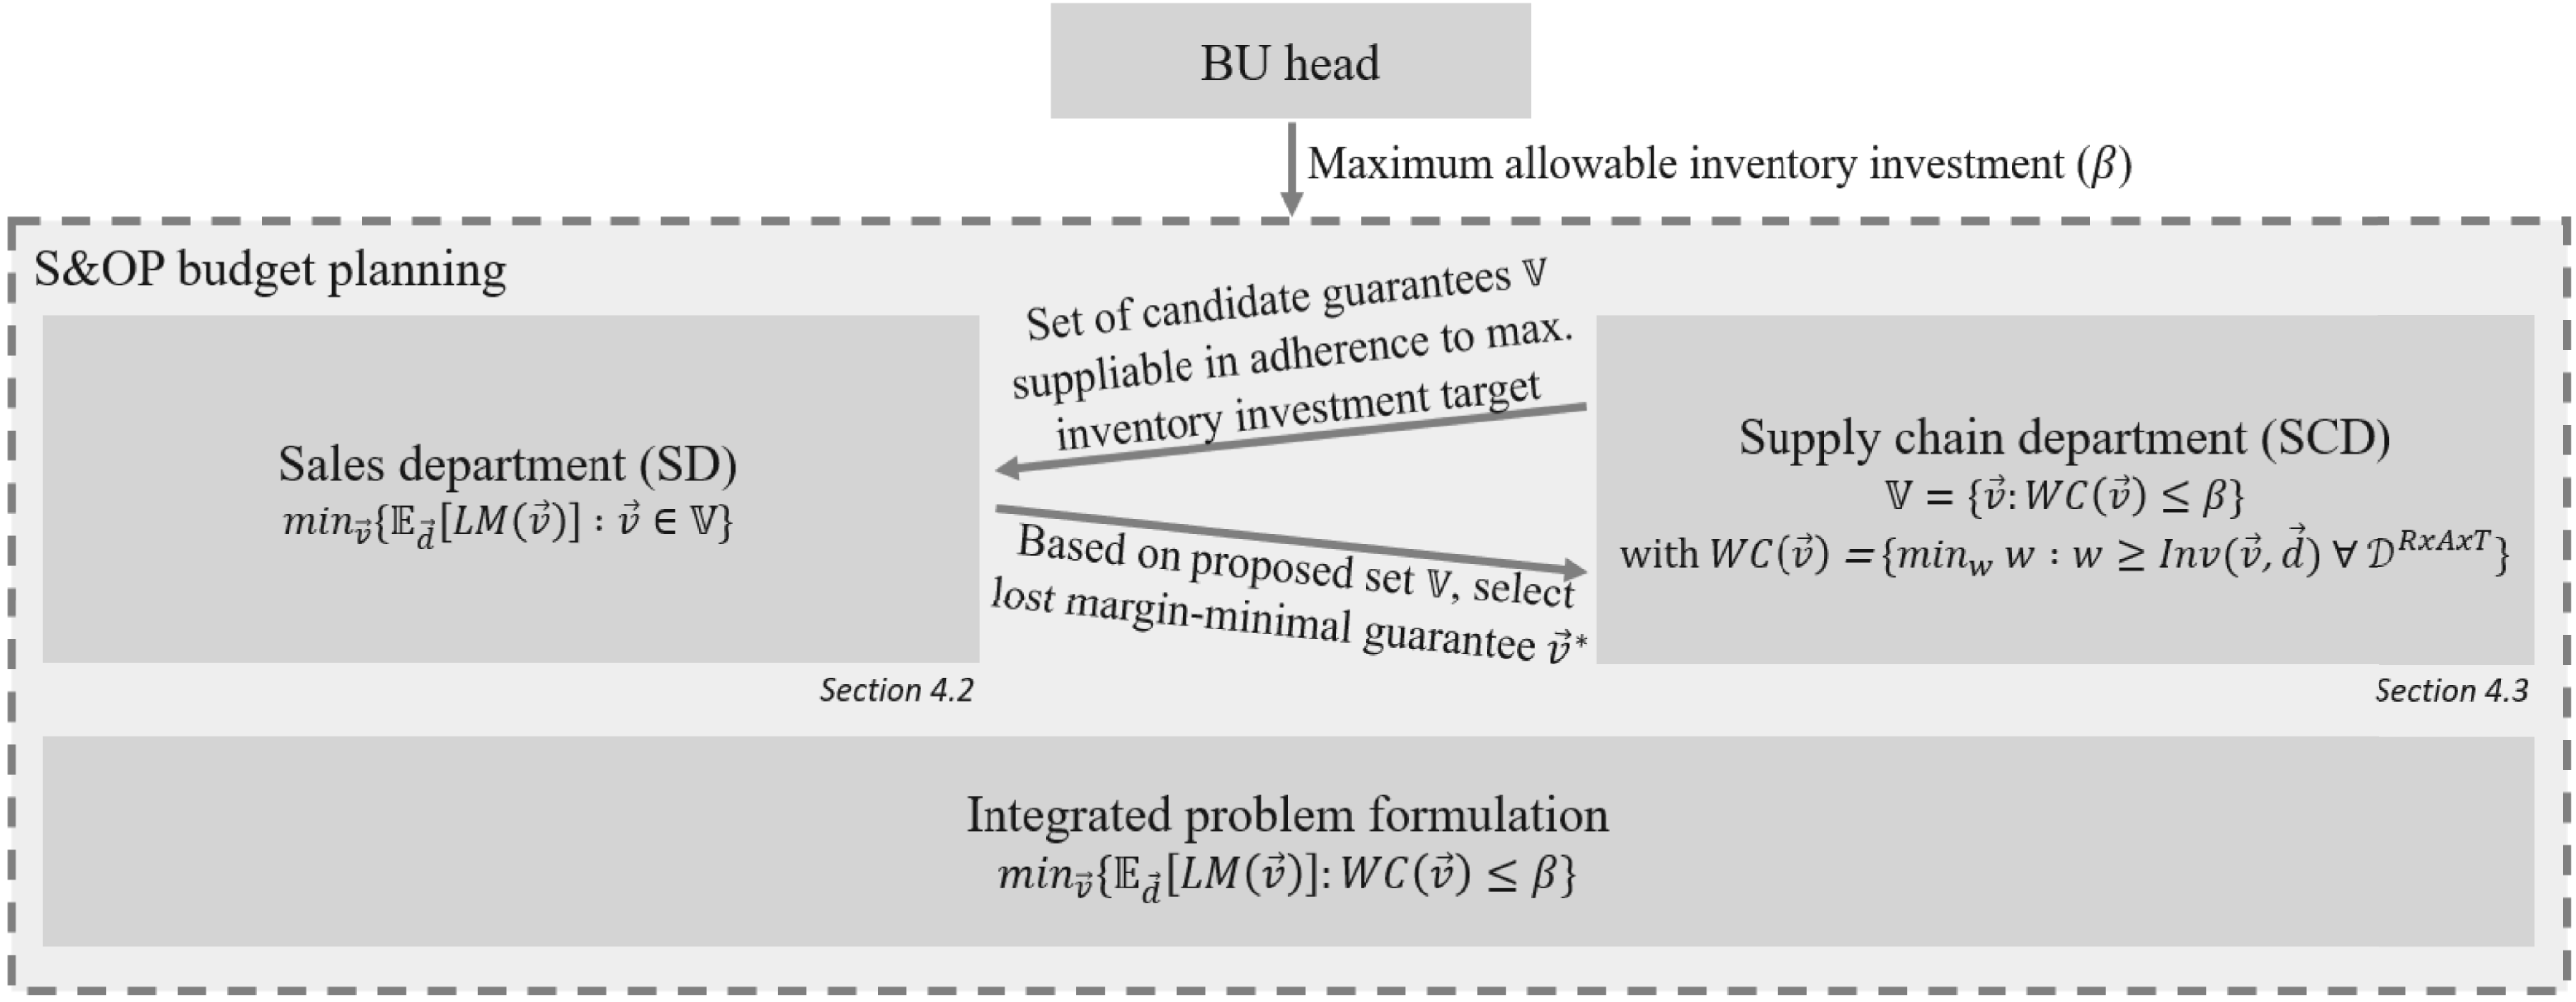
Overview of proposed sales and operations planning (S&OP) budget planning model subject to asymmetric decision-making power.
In this section, we propose a model of the outlined budget planning problem that considers the highlighted asymmetries in incentives and decision-making power between the SD and the SCD. The proposed model framework captures the power of the SD to choose a set of margin-oriented supply volumes as well as the SCD’s task to assess feasibility with respect to both capacities and the admissible inventory investment ceiling. While capacity feasibility is a deterministic constraint, inventory levels result from uncertain demand, and adherence to the imposed ceiling has to be guaranteed for any realization. We model this guarantee as a robust, that is, worst-case oriented, inventory investment minimization problem which the SCD has to solve to assess feasibility of a given set of supply volume guarantees. We then model the interaction between the SD and the SCD during the budgeting process by nesting the robust optimization subproblem faced by the SCD as a constraint in the expected lost margin minimization problem solved by the SD (see problem (3) to (6)). We formalize this modeling framework in Subsection 4.1. In Subsections 4.2 and 4.3, we then specify in detail how to model the expected value minimization problem of the SD and the worst-case problem faced by the SCD, respectively.
S&OP budget planning model
To coordinate mid-term sales and production plans, the SD and the SCD agree on a set of monthly AI volume guarantees to meet uncertain customer demand


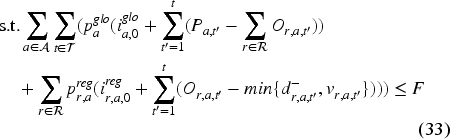
As discussed in the previous section, the SD chooses the feasible volume guarantee set that minimizes the expected lost margins. Using the above notation, we can therefore formalize the considered S&OP budget planning problem as follows (comp. Figure 1):


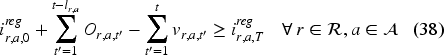
To decide which of the feasible volume guarantees (
While the SD focuses on minimizing the expected total lost margin, the SCD is responsible for assessing whether a given set of volume guarantees is compatible with the imposed maximum allowable inventory investment. For this assessment, the SCD solves the subproblem (5) and (6) of the budget planning problem.
Any given volume guarantee can be realized via various supply plans with different associated inventory investments. In Subsection 4.3.1, we first present a deterministic supply chain model to minimize the total inventory investment linked to the supply of a given set of volume guarantees
In reality, customer demand is, however, uncertain. To ensure that the volume guarantees can be supplied in adherence to the imposed inventory budget under any realization of market demand, the SCD must identify a tactical production and distribution plan that minimizes the associated worst-case total inventory investment. We model this planning task as an RO problem in Subsection 4.3.2 and extend it to an AARO formulation in Subsection 4.3.3 to account for existing SC flexibilities. For an overview of techniques available for formulating and solving robust models, we refer to Ben-Tal et al. (2009b).
Deterministic supply chain model
We model the global AI production and the subsequent regional distribution over the next
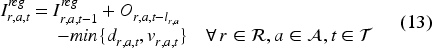
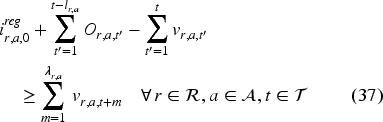
To ensure sufficient time for regional formulation, filling, packaging and distribution, the SCD steers regional AI availability through minimum stock level requirements. Therefore, the regional inventory of AI
Finally, the SD fulfills regional market demands up to the monthly volume guarantee aligned with the SCD during budgeting. We summarize the presented supply chain setup in Figure 2.
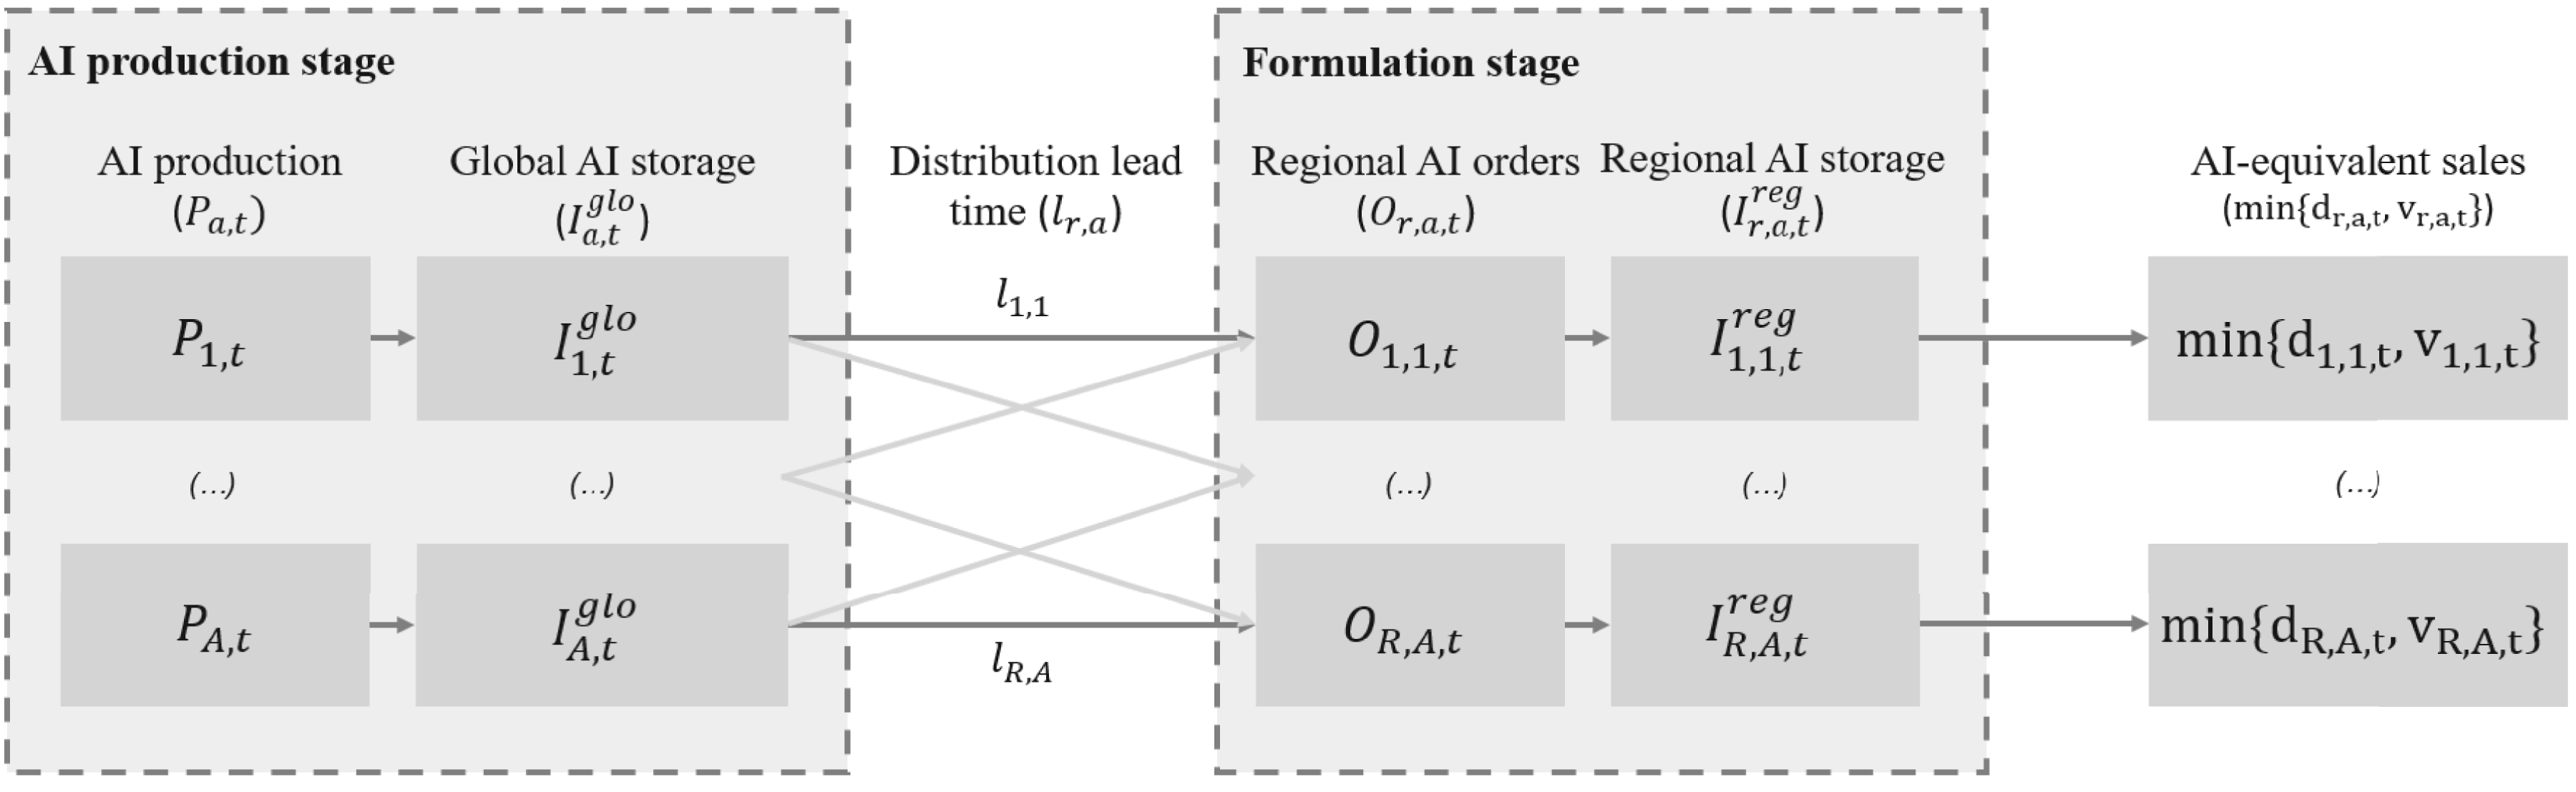
Schematic overview of the modeled agrochemical supply chain.
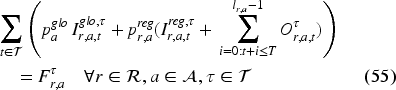
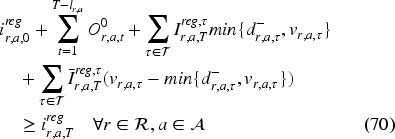
Based on the described supply chain setup, the following deterministic linear program can be formulated to determine the minimal total inventory investment (
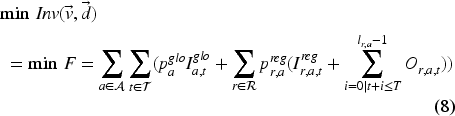


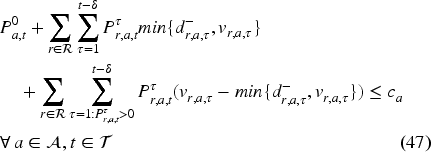
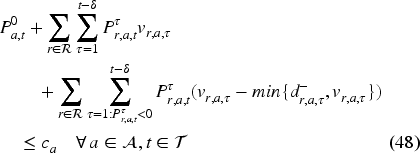
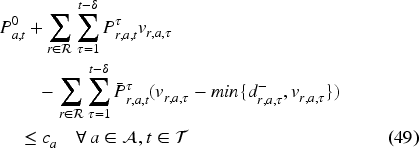
By minimizing the objective function (8), we obtain the minimal total inventory investment linked to the supply of the volume guarantee
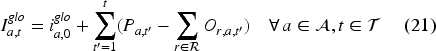
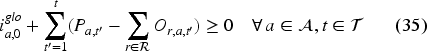
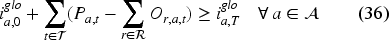
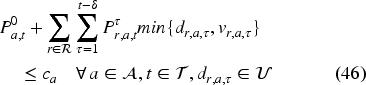
Constraints (9) through (12) reflect the global production level. Constraints (9) ensure that AI production does not exceed capacity for any AI and period. Constraints (10) and (11) capture the inventory balance at central AI production sites, given available starting inventories of
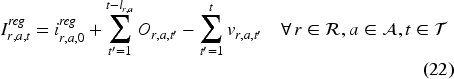
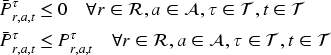
At the regional level, constraints (13) and (14) capture regional stock levels while considering regional starting inventories of
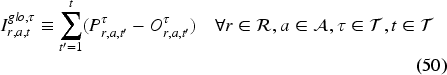
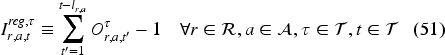
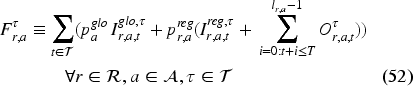
As stated in Section 4.1, customer demand is uncertain. To ensure adherence to the inventory target even under uncertain demands, we reformulate the presented deterministic supply chain model into a robust optimization problem to determine the worst-case inventory investment linked to a given set of volume guarantees (
To this end, we define the uncertainty set of demand

Recall that we assume that the SD will not request volumes exceeding the upper bound of the uncertain demand distribution, that is,
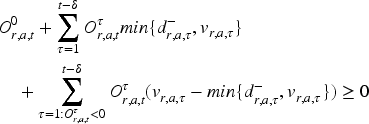
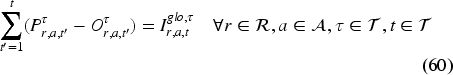
To robustify the inventory balance equality constraints (10), (11), (13), and (14), we eliminate the inventory state variables
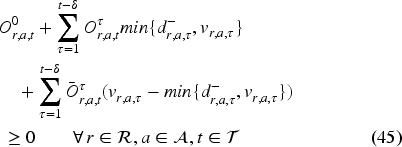
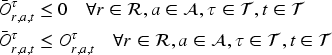
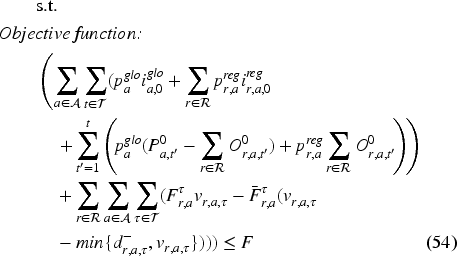
Using these ingredients, we then formulate the following robust linear program to obtain the minimum worst-case total inventory investment (

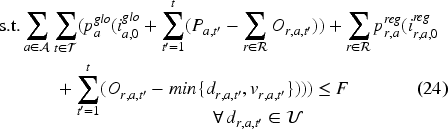


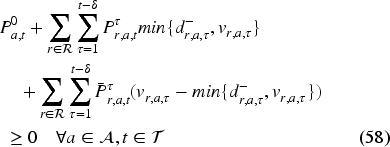
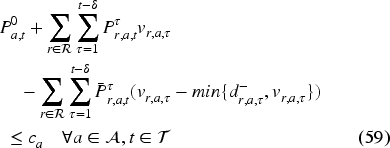
In this approach, the introduction of demand uncertainty leads to a semi-infinite problem that is computationally intractable. However, we can reformulate the above model as a computationally tractable one by replacing the for all (
In addition, we use
We obtain the following tractable reformulation:


The presented robust supply chain model assumes that all decisions required to secure the supply guarantees are static, that is, here-and-now decisions that must be fixed during the budgeting process, prior to any realization of demand uncertainty. In reality, the supply processes can commonly be adjusted, to some degree, in response to market signals that materialize as the planning horizon elapses. Ignoring this flexibility may lead to an overly conservative worst-case assessment in a robust optimization formulation (Ben et al., 2004). For the budgeting problem at hand, this translates into overstated worst-case inventories and thus into under-utilizing the allowable inventory investment budget, at the expense of avoidable lost margins.
Anticipating and appropriately capturing the ability of the supply chain organization to adapt its supply plan in response to observed market signals is therefore crucial for realistically assessing worst-case inventories of potential sets of volume guarantees. One way to capture the dynamic nature of supply chain decisions is to reformulate the static robust model as a stochastic dynamic program (SDP) with a min-max-structured objective function. Solving an SDP recursively for the
As an alternative approach to incorporating dynamic decisions into robust optimization, Ben et al. (2004) introduce the concept of adjustable robust optimization (ARO). Here, decision variables are not defined as static here-and-now decisions but as decision policies contingent on realized uncertainties while still providing the same robust guarantees. Ben et al. (2004) show that while solutions determined through an ARO can be substantially less conservative than their static counterparts, determining general decision policies is again computationally intractable. This challenges the applicability of the concept to real-world problems. The authors, therefore, suggest approximating decision policies through affine functions of the realized uncertainties. Similar affine approximation strategies are also applied to other modeling techniques used for uncertain multi-stage problems to address the ‘‘curse of dimensionality.” Chen (2007) and Chen et al. (2008) use affine decision rules to formulate a tractable multi-period stochastic program, de Farias and Van Roy (2003) use a linear approximation of the cost-to-go function for an approximate dynamic programming approach, and Shapiro (2011) discusses the conceptual link between adjustable robust optimization, dynamic, and stochastic programming in general.
In an inventory planning context, treating decisions as contingent on demand realizations is intuitively appealing. For example, under a simple base-stock policy with backordering, replenishment orders equal demand—a special case of an affine function of demand. The AARO approach generalizes this policy by allowing other affine functions. If unmet demand is lost, rather than backordered, replenishment orders under a base-stock policy are equal to and thus an affine function of realized sales, rather than demand.
To apply AARO to our worst-case inventory assessment problem, we replace the decision variables in the static RO model (23)–(31) by decision policies. Since in our setting unmet demand is lost, we consider policies that are affine functions of realized sales (
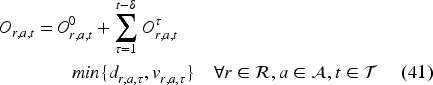
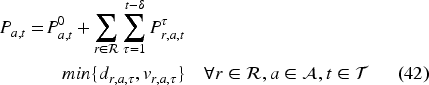
As pointed out previously, the AARO formulation (41) is more general since it allows more general affine dependencies. However, note that while we allow production quantities to depend on sales in all regions, we consider ordering decisions to depend on sales in that same region only. Finally, we use the parameter
By replacing the ordering and production variables in (23)–(31) using the affine expressions (41) and (42), we obtain an AARO formulation of the worst-case inventory investment assessment problem that factors in the SCD’s ability to adjust planned production and order quantities as actual sales unfold over time. However, as for the initial static RO, the formulation obtained in this way is computationally intractable. Yet we can again rewrite the model in a tractable form by identifying the most constraining demand realizations in each of the constraints.
In the following, we first illustrate this reformulation for individual constraints, before providing the full tractable AARO model. We closely follow the approach of Ben et al. (2004).
Consider the robust non-negativity constraints (31) of the ordering decisions for all regions, AIs and months. Using (41), we obtain the affinely adjustable version (43) of these constraints. Which demand scenario is the most constraining depends on the sign of
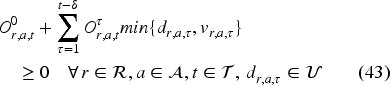


We can use a similar approach to reformulate


Through the presented AARO model, the SCD can obtain an assessment of worst-case inventories of a given set of volume guarantees that considers uncertainty and, in contrast to static RO, the existing flexibility for adjusting relevant decisions over time. As illustrated in Figure 1, the SCD’s assessment serves as subproblem (5) and (6) of the budget planning problem.
Our goal in this section is to gain insights into the performance and solution structure of our proposed modeling approach. To this end, we use a synthetic data set which allows us to systematically vary the input parameters.
Study setup and benchmark strategies
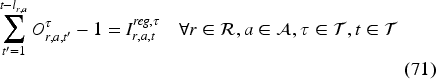
We assess the performance of the guarantees (
Under a
The
In addition, we compare the performance of the proposed AARO-based budget planning model (
In our numerical study, we consider 18 AIs supplied to three sales regions, leading to 18
In smaller prestudies, we have identified the supply and demand parameters most relevant to the overall problem results, namely, distribution lead time, regional cost of goods, product margins, and level of demand uncertainty. For each of these, we define two sets of relatively homogeneous versus markedly heterogeneous parameter values (see Table 1). For a given scenario, we then parameterize each of the 54 regional AI value chains through a different combination of the 3
Sets of values of relevant supply and demand parameters used to construct different benchmark portfolios with a low or high degree of parameter diversity.
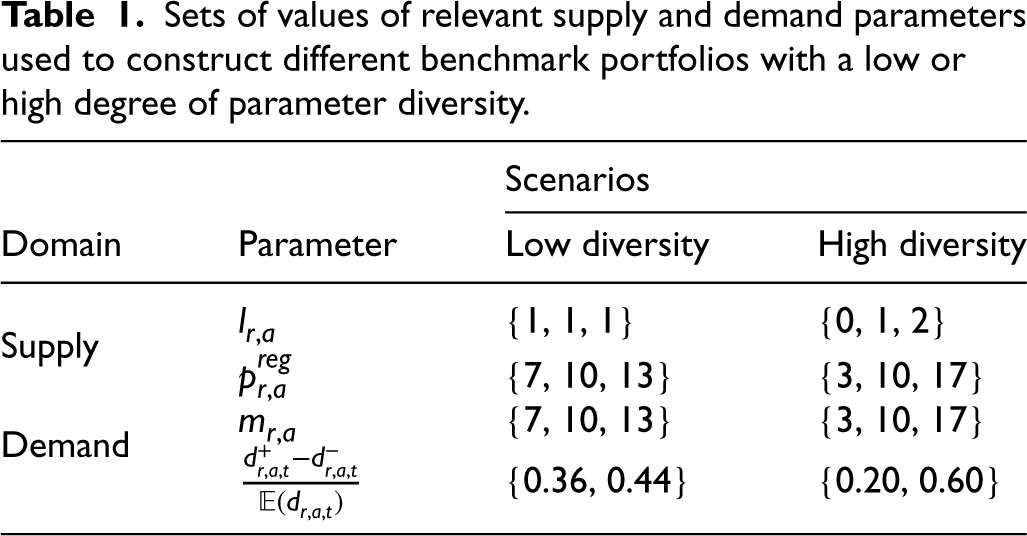
Sets of values of relevant supply and demand parameters used to construct different benchmark portfolios with a low or high degree of parameter diversity.
For simplicity and transparency, we keep the other parameters constant across all portfolios and set them to realistic levels observed in the industry, relative to the other parameters:
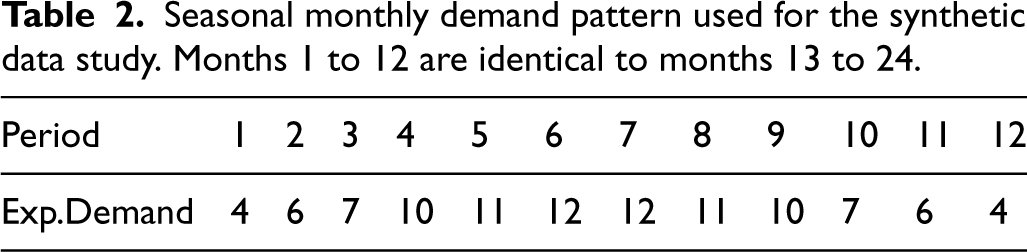
Similarly, we consider a single monthly demand pattern that follows a typical seasonal cycle commonly observed at the case company and shown in Table 2. Forecast errors are sampled from a normal, zero-mean symmetrically cropped distribution with a standard deviation such that
Seasonal monthly demand pattern used for the synthetic data study. Months 1 to 12 are identical to months 13 to 24.
For each of the four scenarios, we derive the expected lost-margin-minimal guarantees according to the proposed budget planning model.
As the budget planning problem (3)–(6) is structurally complex, we cannot solve it exactly. Instead, we derive the guarantees for 
Finally, we account for a business rule at the case company which requires that at least the certain component of uncertain regional AI sales must be supplied. We therefore require
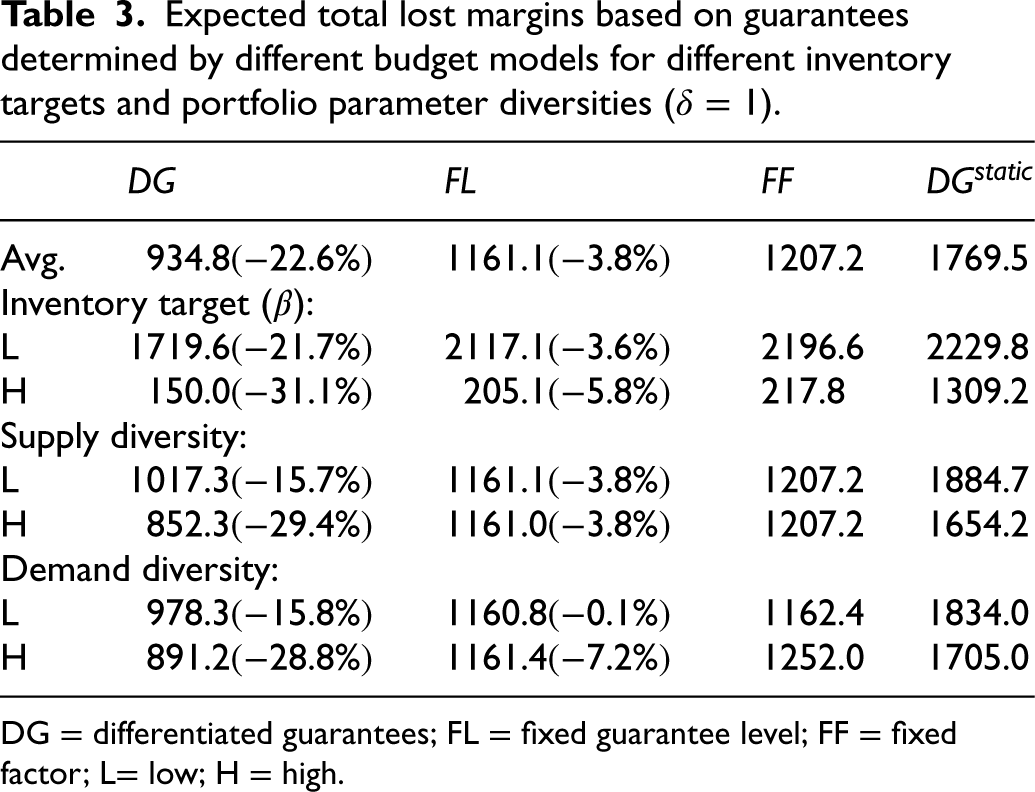
We now present the core results of our numerical study, which concern the performance of our proposed S&OP support model. To this end, we report the expected lost margins associated with the set of volume guarantees determined by our proposed model and compare them with the solutions of the benchmark strategies on the set of scenarios defined in Section 5.1. In addition to the overall results, we analyze their sensitivity along three dimensions: (1) the level of the inventory investment budget and the level of diversity in the relevant, (2) supply, and (3) demand parameters within the AI portfolio. Table 3 summarizes the results. The percentage values in parentheses indicate the relative difference to the results obtained with the
Expected total lost margins based on guarantees determined by different budget models for different inventory targets and portfolio parameter diversities (
).
Expected total lost margins based on guarantees determined by different budget models for different inventory targets and portfolio parameter diversities (
DG = differentiated guarantees; FL = fixed guarantee level; FF = fixed factor; L= low; H = high.
Across all considered portfolios and inventory investment budgets, the
The results also underline that it is important for the inventory assessment of supply guarantees to factor in inherent sources of flexibility, that is, capabilities of the SCD to adjust supply decisions in response to updated demand information. Ignoring the option value of such flexibilities leads to unnecessarily low supply guarantees caused by an overly conservative assessment of worst-case inventories. Due to the observed clear performance benefit of the adjustable model formulation relative to the static one, we henceforth exclude
Naturally, the aforementioned effects depend on key problem parameters. We observe the following relationships. We find that the reduction of expected lost margins from
As for the degree of diversity in the relevant supply and demand parameters, we observe that the relative benefit of the proposed
In summary, these results highlight the relevance of supporting the S&OP decision-making process on volume guarantees by a systematic model. The size and complexity of the problem prohibit a manual solution, and resorting to simplistic heuristics is not effective. In addition, differentiating supply guarantees based on relevant supply and demand characteristics is especially important if the underlying product portfolio is strongly heterogeneous.
Besides the performance analysis, we investigate the structure of the solution. To isolate the key drivers for differentiation in the resulting regional AI supply guarantees, we apply our model to the portfolio with high supply and demand parameter diversity and derive the optimal sets of guarantees for low and high inventory targets. To simplify the comparison of different regional AI volume guarantees, we translate the derived guarantee levels (
To determine the impact and relative importance of problem parameters both individually and interactively for the derived volume guarantees, we ran a linear regression analysis. The problem parameters
Standardized regression coefficients of the linear regression analysis examining the influence of problem parameters on the expected service levels based on guarantees determined through
under a low and high inventory target (
).
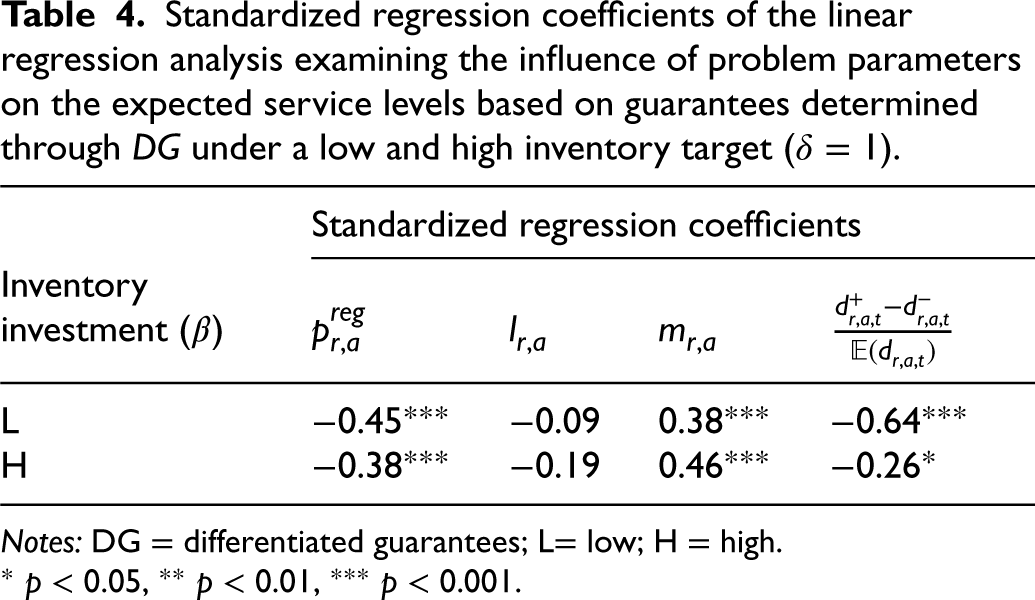
Standardized regression coefficients of the linear regression analysis examining the influence of problem parameters on the expected service levels based on guarantees determined through
Notes: DG = differentiated guarantees; L= low; H = high.
We observe that our AARO model proposes higher service levels for regional AI supply chains with low inventory costs, high margins, and low levels of uncertainty, while the lead time coefficients are negative but not statistically significant.
None of these directional effects are surprising as such. What nevertheless renders the solution complex is the difference in effect strengths and their dependence on
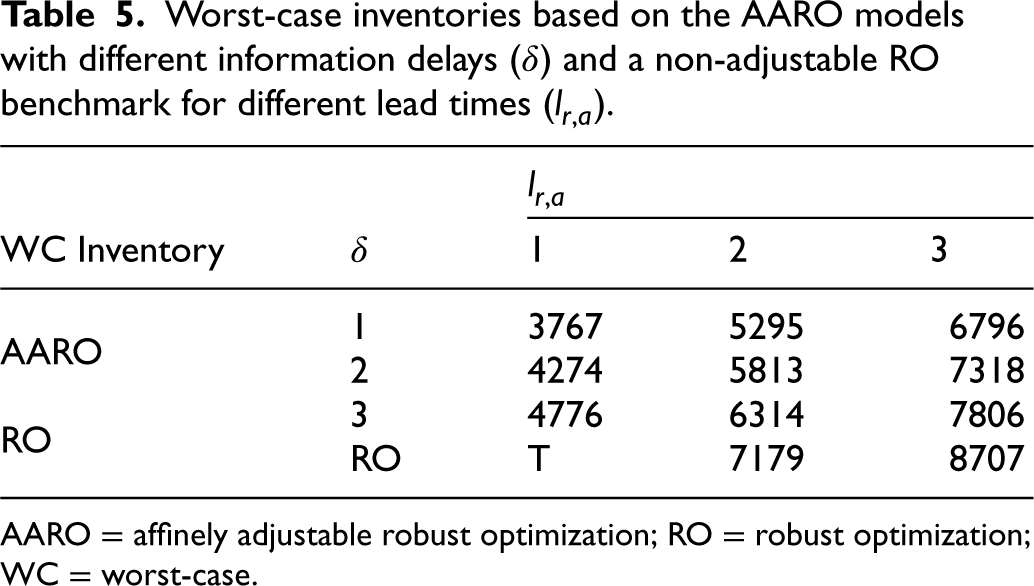
In the previous sections, we analyzed the performance of the proposed budget planning model with respect to expected lost margins and expected service levels, for a given inventory investment target. In the following, we assess drivers of the worst-case inventory investment associated with a given set of volume guarantees. In particular, we investigate how the inventory investment depends on the level of supply chain responsiveness. We express supply chain responsiveness by two factors, namely, the information delay (
We analyze the changes in the worst-case inventory investment as we vary both factors between 1 and 3 months. Table 5 shows the worst-case inventories if the supply of the upper bound of the uncertain demand distribution is guaranteed (
Worst-case inventories based on the AARO models with different information delays (
) and a non-adjustable RO benchmark for different lead times (
).
Worst-case inventories based on the AARO models with different information delays (
AARO = affinely adjustable robust optimization; RO = robust optimization; WC = worst-case.
From Table 5, we find that while both forms of delays increase the required worst-case inventory investments, the overall impact of distribution lead times is higher. Compared to a worst-case inventory investment of 3767 for an information delay and lead time of one month, worst-case inventories increase by 80% to 6796 when raising the distribution lead time to 3 months. In contrast, an information delay increase to 3 months lets the inventory investment grow by only 27% to 4776. The strong impact of distribution lead times on inventory levels can be explained by two reasons. First, an increase in transit times directly causes an increase in in-transit stocks. Second, regional orders need to be placed increasingly in advance of the peak sales months, which limits in-season order adjustment flexibility.
Despite its strong impact, reducing transportation times usually comes at a significant cost. It requires either a shift in the mode of transport from ship or truck to air freight or a redesign of the company’s production network. Neither may be economically feasible or achievable in the short run. A reduction in information lead times across and within functions, on the other hand, may be achievable by highlighting the value of introducing collaborative processes and information systems to support information sharing and a rapid adjustment of production and distribution decisions throughout the organization in response to recent market signals (Lapide, 2004).
Another important observation from Table 5 is that it is crucial for an appropriate inventory investment assessment to capture the existing level of supply chain flexibility. For a distribution lead time of one month, a static RO overstates the worst-case inventory investment derived by a corresponding AARO with an information delay of one month by 91% (7179 vs. 3767). Incorporating the ability of the supply chain to adjust decisions over time, in response to unfolding uncertainties is thus key to avoiding an overly conservative allocation of volume guarantees and to preventing unnecessary lost margins.
The qualitative conclusions concerning the impact of information and material flow delays on inventory remain valid for portfolios with less heterogeneous problem parameters.
In this section, we complement the general findings from the synthetic data analysis by quantifying the improvement potential of our proposed model in a real-world context.
Data collection and scope of analysis
For the performance assessment of the proposed approach in practice, we use real-world data to derive volume guarantees for the 15 most business-relevant AIs of the case company. Each of the AIs is centrally synthesized and stored before being distributed and sold in up to four regions. For each of the AIs, we collect the relevant production capacity, distribution lead times, inventory costs at global and regional storage facilities, and the relevant AI-equivalent sales forecasts for the next 24 months. Moreover, we assess demand uncertainty based on historical forecast errors. To obtain robust distributional information under limited data availability per AI, we pool historical forecast errors of similar AIs within the company’s portfolio, that is, AIs of the same product type with similar sales patterns sold in the same region. We assume that the distribution of relative forecast errors is constant over time and obtain the box uncertainty set based on the distributional bounds. For the assessment of the expected lost margins for a given volume guarantee, we sample from the pooled distribution. To protect the confidentiality interests of the case company, we anonymize the input data and normalize the presented model outputs.
Performance analysis of allocation strategies
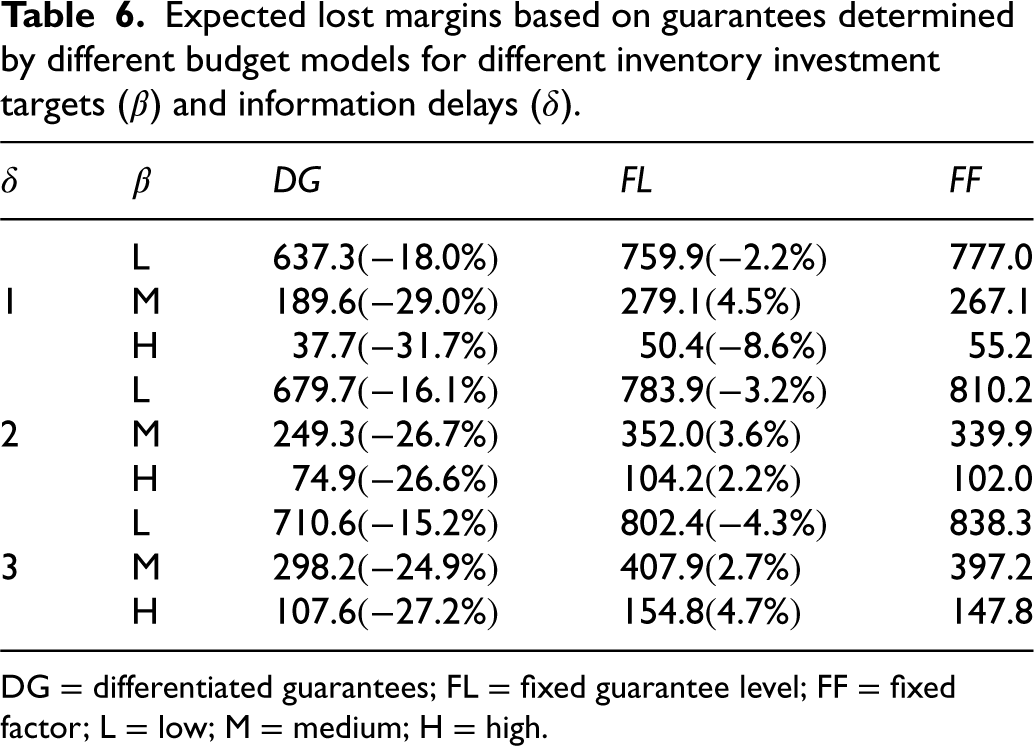
In Table 6, we compare the resulting expected total lost margin for volume guarantees derived through
Expected lost margins based on guarantees determined by different budget models for different inventory investment targets (
) and information delays (
).
Expected lost margins based on guarantees determined by different budget models for different inventory investment targets (
DG = differentiated guarantees; FL = fixed guarantee level; FF = fixed factor; L = low; M = medium; H = high.
Considering the reduction potential of the expected lost margin in absolute terms, we observe that it is the largest for tight inventory investment limits. This highlights the importance of agreeing on differentiated volume guarantees during the budgeting process. An increase in the information delay has a negative effect on the lost margin reduction potential, as expected. However, differentiated guarantees remain highly superior to undifferentiated guarantees.
The comparison of the relative performance of the benchmark strategies
Overall, the numerical results obtained for the real-world data of the case company’s budget planning problem demonstrate a considerable improvement potential of our proposed model over the current planning practice.
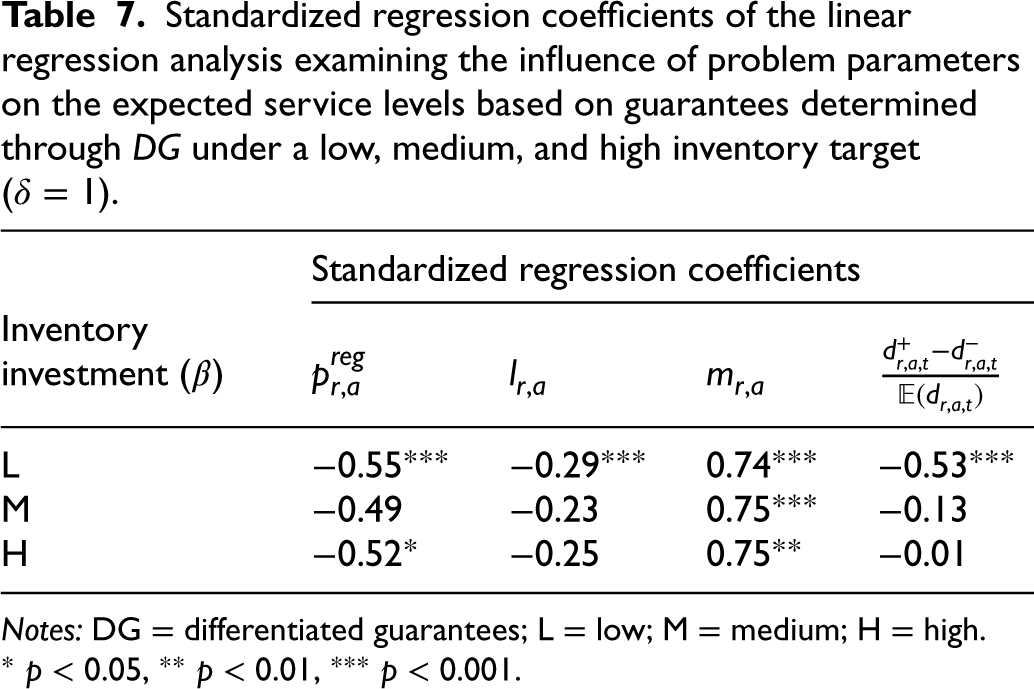
In this section, we investigate what factors drive the guarantee allocation for the given real-world data. To this end and in line with the analysis conducted in Section 5.3, Table 7 displays the resulting standardized regression coefficients from the linear regression of the expected service levels of volume guarantees determined by
Standardized regression coefficients of the linear regression analysis examining the influence of problem parameters on the expected service levels based on guarantees determined through
under a low, medium, and high inventory target (
).
Standardized regression coefficients of the linear regression analysis examining the influence of problem parameters on the expected service levels based on guarantees determined through
Notes: DG = differentiated guarantees; L = low; M = medium; H = high.
The signs of all regression coefficients are identical to those in the synthetic data study. This is directionally consistent with the intuition that the AARO-based budget process prioritizes regional AI supply chains with low inventory costs, short lead times, high margins, and low levels of uncertainty. In addition, an increasing allowable inventory investment again reduces the relative importance of demand uncertainty as a differentiating factor. Different from the synthetic data study, the relative importance of the other three considered factors remains rather stable across different inventory investment levels, with their ranking corresponding to that under high inventory allowance in the synthetic study. We attribute the observed differences between the results of both numerical studies to structural differences in the underlying data sets. Recall that the synthetic data set uses a full factorial combination of the problem parameters listed in Table 1. This implies that parameter values are uncorrelated. In the real-world data, in contrast, we found the regional cost of goods and product margin to be positively correlated, which leads to a stable importance of both parameters across the three studied inventory investment levels. Furthermore, the variance in distribution lead times of regional AI supply chains is higher in the real-world data than in the synthetic data set, which makes it a statistically significant factor, at least in scenarios with low inventory investment targets.
All in all, the changes in the relative importance of the different market characteristics underscore the complexity of the budget planning problem and the need for a systematic case-by-case analysis. Simple fixed priority rules are clearly insufficient.
In this article, we addressed the cross-functional decision problem faced by an agrochemical supplier as part of the annual budget planning cycle. Through the budgeting process, sales and supply chain activities are aligned by agreeing on a set of volume guarantees to be supplied throughout the planning horizon while adhering to a maximum allowable inventory investment imposed by the business unit head. We developed an optimization-based decision-support tool to obtain these volume guarantees. A key contribution of our model formulation is that it captures the conflicting incentives and asymmetric decision-making power of the parties involved.
In two numerical studies based on synthetic as well as real-world data, we analyzed key drivers for the obtained solutions, and we explored the performance of our proposed model compared to that of the simple heuristics currently in place at the case company. We found that a considerable lost margin reduction can be achieved by allocating more volume guarantees toward AIs suppliable under low lead times and with low per unit inventory costs, high per unit margins, and low demand uncertainty. For the real-world data set, the achievable expected lost margin reduction amounts to 32%.
Our work provides several insights that extend beyond the specific setting of the case company and provide guidance to practitioners. The conducted solution-structure analysis uncovers complex interaction effects among problem parameters and resulting S&OP decisions, highlighting the importance of deploying advanced decision-support tools rather than relying on simple, single-parameter heuristics. While the existing literature does offer decision-support models for S&OP, most formulations assume a centralized decision-maker optimizing a single objective function. Such formulations ignore real-world complexities arising from conflicting incentives, asymmetric information, and distributed decision-making authority. In fact, the case company has previously attempted to develop a monolithic optimization model that maximizes the firm’s total profit through a single objective function to support S&OP decision-making. Discussions with the management team have, however, revealed that attempts to implement the budget plan proposed by the developed model led to substantial challenges, particularly from the SD, and ultimately to a failure to utilize the tool.
These observations underline the importance of starting any research project with a careful analysis of the decision-making environment. If changing the incentive landscape and resolving existing conflicts between actors is not within the scope of the research initiative, we suggest explicitly capturing existing incentive conflicts and differences in decision scopes when designing a decision-support tool to ensure that adoption is not blocked by key decision-makers.
In addition, our analysis highlights the critical importance of acknowledging future decision flexibility in a medium-term budget planning process. By comparing models based on static RO and AARO, we quantify the value of the real option to adjust production volumes based on observed sales. Our analysis shows that this option value is substantial, which underlines the importance of having processes and information systems in place that ensure the rapid availability of the latest market information to decision-makers. These findings offer two key takeaways for practitioners: First, treating budget plans as a static, here-and-now decision is insufficient. Instead, planners must carefully assess available flexibilities to adjust plans in response to new information revealed in the future. Second, those real options must not only be identified, but also incorporated into today’s decision-making, a complex task that must be supported by advanced decision-support tools.
Our work provides several insights that extend beyond the specific setting of the case company and provide guidance to practitioners. First, appropriately aligning sales and operations planning in complex production systems is a challenging task. Competition for resources across product portfolios, between markets, and over time result in complex interdependencies, which simplistic heuristics cannot handle. Mathematical optimization models hold great potential in this setting and may allow S&OP teams to identify plans that substantially outperform those from a purely manual negotiation process.
Second, to be meaningful, such models must appropriately reflect the underlying managerial setting. Importantly, this encompasses not only the specifications of the production system and market expectations, but also the structure of the decision process. In modeling terms, this concerns the definition of the objective function. While from a theoretical perspective it may seem intuitive to maximize expected profits, the actual interaction between the S&OP stakeholders may be different, due to asymmetric distribution of information and decision power. Ignoring this reality is likely to result in plans that stakeholders do not accept and thus not implement. One might argue that the actual decision process should be adjusted to match the theoretical objective. However, achieving this change is a very different task.
Third, the agreements derived in S&OP rely on anticipated production plans. Actual production plans may still be adjusted, within the boundaries of the S&OP agreements, as new information becomes available. In the case of high uncertainties, this flexibility may result in a substantial option value. It is important to take this option value into account in S&OP, not only to project expected performance but also to identify the best performing plan. While assessing the value of flexibility complicates the mathematical analysis, computationally feasible methods are available, such as AARO which we used in our study.
Our work opens several opportunities for future research. First, the goal of this paper was to provide an analytic representation of the coordination mechanism used to align functions within the current organizational setup at the case company. We have not aimed at changing this setup but rather at supporting the currently unstructured negotiation process through a formal decision-making approach. Therefore, we have not investigated the optimality of the current coordination scheme and its implications for overall organizational performance. Such an analysis would be highly worthwhile, as would be a discussion of potential coordination schemes for alternative KPIs.
Second, we focused exclusively on the coordination across business functions and assumed that sales and supply chain can each be modeled as a single, global actor. In reality, competing objectives also exist within a function. Extending the proposed model in this respect would be another interesting route for further analysis.
Third, for the sake of focus, we have considered production capacities and inventory investment budget as the only factors that constrain the sales department in minimizing expected lost margins. In practice, strategic considerations imply additional constraints. These include, for example, allocating higher volumes to emerging but currently less profitable markets to foster growth, or introducing minimum supply levels for selected active ingredients to defend market share against substitute products of competitors. Future research could explore how such strategic constraints can be systematically integrated into the model and how they change the results. This would allow for a deeper analysis of the trade-off between short-term profit optimization and long-term strategic goals.
Supplemental Material
sj-pdf-1-pao-10.1177_10591478261457704 - Supplemental material for Decision support for sales and operations planning under asymmetric power: A case study from the agrochemical industry
Supplemental material, sj-pdf-1-pao-10.1177_10591478261457704 for Decision support for sales and operations planning under asymmetric power: A case study from the agrochemical industry by Christoph Löffel, Moritz Fleischmann, Tobias Hausen and Steffen Thomas Klosterhalfen in Production and Operations Management
Footnotes
Funding
The authors received no financial support for the research, authorship, and/or publication of this article.
Declaration of conflicting interests
The authors declared no potential conflicts of interest with respect to the research, authorship, and/or publication of this article.
1.
Note that although the case of multiple production facilities per AI could be covered by the model through the introduction of an additional decision variable index, we directly present the single AI facility model that applies to the setting of the case company.
How to cite this article
Löffel C, Fleischmann M, Hausen T and Klosterhalfen S, (2026) Decision support for sales and operations planning under asymmetric power: A case study from the agrochemical industry. Production and Operations Management x(x): 1–19.
References
Supplementary Material
Please find the following supplemental material available below.
For Open Access articles published under a Creative Commons License, all supplemental material carries the same license as the article it is associated with.
For non-Open Access articles published, all supplemental material carries a non-exclusive license, and permission requests for re-use of supplemental material or any part of supplemental material shall be sent directly to the copyright owner as specified in the copyright notice associated with the article.