






Abstract
Omni-channel retailers typically face high return rates, particularly in their online channel. This paper examines how these returns can be converted into exchanges by leveraging omni-channel capabilities. We do so in the context of a fast-fashion retailer running integrated physical store and online channels. Our unit of analysis is a return journey, which starts with an initial online purchase, proceeds with a return, and then potentially continues with subsequent exchanges and returns, replacing the original purchase. Using a random forest with instrumental variables, we study whether store visits for pick-up or return of the initial purchase influence a consumer’s likelihood to make an exchange, thereby generating revenue for the retailer. We explore the heterogeneous effect of these store visits across different customer profiles based on the recency-frequency-monetary value (RFM) framework. Our results indicate that store visits for pick-up or return increase the likelihood of an exchange, with a more pronounced effect among less valuable customers. Follow-up analyses suggest that this effect is driven by the customers’ ability to reduce product uncertainty through in-store inspection. Additionally, a store visit decreases the likelihood of a return (consistent with previous literature) and increases the likelihood of keeping an exchange purchase when it has been made. Our findings thus underscore the critical role of physical stores for online shoppers in finding the right product and, consequently, for retailers to convert returns into exchanges.
Introduction
“The future of returns is an exchange opportunity,” announces (Happy Returns, 2020), predicting that retailers will increasingly focus on their exchanges rather than solely tracking their return rates. Happy Returns is not alone in highlighting the power of converting returns into valuable exchanges. Deloitte (2019) emphasizes that “every return can be leveraged as an opportunity for a customer to replace the item.” Hence, every product return is an occasion to “make it stick” via an exchange (Deloitte, 2019).
Samorani et al. (2019) illustrate the power of exchanges in a pure brick-and-mortar setting: they report that 38.7% of the returned products at an electronics retailer were replaced with a new purchase in the same category. The potential for product exchanges in online retail, however, is less obvious. Exchange opportunities might be even greater given that return rates can be up to three times higher in online stores compared to physical ones (Appriss Retail, 2024; ECR, 2018; Forbes, 2023; Shopify, 2023). Supporting this idea, the post-purchase customer experience platform Narvar reports that 41% of U.S. online shoppers exchanged the latest item they returned (Narvar, 2018). Yet the higher return rate in e-commerce stems in part from shoppers ordering multiple versions of a product—such as different sizes or colors—with the intention of keeping only one. These planned returns may, at the same time, limit the opportunities for exchanges in online settings.
Beyond these pure-play operations, many retailers adopt an omni-channel strategy with integrated store and online channels (Verhoef et al., 2015), enabling consumers to seamlessly move between channels for their purchases, pick-ups, returns, and exchanges. An important opportunity for omni-channel retailers might lie in encouraging exchanges of online purchases post-return by leveraging in-store experiences. Consumers highly value such store experiences for returns of online purchases (Chintagunta et al., 2012; Herhausen et al., 2015): while 17% of consumers would not even buy online without the option to return to the store (Narvar, 2018), over half prefer to return an online purchase to a physical store (UPS, 2017). Prior research has demonstrated that store interactions can lower return rates (Bell et al., 2018; Bell et al., 2020), but it remains unclear if such store interactions can also be leveraged to facilitate exchanges after a return has occurred.
Ertekin (2018) highlights this specific research gap and calls for research on “how an in-store return experience influences the exchange and repurchase behavior of these online customers.” Rooderkerk et al. (2022) reiterates the need for more work on omni-channel return management, and Robertson et al. (2020) lists the research question “What are the best practices to encourage exchanges instead of returns?” as a critical research direction. Our goal is to address this research gap and study if and when store visits encourage converting a return into an exchange that sticks.
To conduct this research, we partnered with a large Dutch fashion retailer that operates both physical stores and an online channel. We adopt a journey-based approach to model consumers’ exchange behavior following an initial online purchase and return, similar to Samorani et al. (2019). Each return journey starts with an initial online purchase and its return, and then, potentially, continues with a series of exchanges and returns replacing the initial purchase. At the end of the journey, the consumer decides whether or not to keep the exchange product. Throughout this process, consumers can move between channels as they shop, return, or exchange products, depending on their preferences as well as the retailer’s fulfillment and return policies.
This modeling approach enables us to analyze different stages in the return journey. We do not only model the customer’s exchange decision, but also whether the initial purchase is returned and whether an exchange purchase is eventually kept. To estimate the effect of a store visit on these decisions, we distinguish between journeys with and without store visits before the respective decision has been made. We estimate a generalized random forest (Athey et al., 2019; Biewen and Kugler, 2021) and use the distance between the customer location and the nearest two stores to instrument for a store visit (Coibion et al., 2021). Building on the recency-frequency-monetary value (RFM) framework, a widely established approach for customer valuation (see, e.g., Fader et al., 2005), we estimate heterogeneous effects of a store visit for respective decisions and test whether the response to a store visit varies between customers with different RFM profiles.
Our analysis leads to the following insights. First, we confirm earlier findings in the literature that store interactions lead to lower return rates for online purchases (Bell et al., 2018, 2020). While fewer returns is a desirable outcome, our main goal is to understand whether store visits encourage exchanges beyond reducing returns. We demonstrate that store visits for pick-up or return of an initial online purchase indeed make subsequent exchanges more likely, and that the effect of a store visit is especially pronounced among the lower-valued customers (i.e., those with less recent, less frequent, and a lower valued purchase history). Follow-up analyses suggest that converting returns to exchanges depends on the customers’ ability to inspect alternatives in person, an opportunity that is particularly relevant for lower-valued customers who tend to be less familiar with the store. When they are exposed to wider in-store alternatives, their likelihood of exchanging rises.
The conversion of a return to exchange is an important step; yet, a retailer’s revenue hinges on whether an exchanged item is eventually kept by the consumers. Hence, the ultimate question is whether store visits eventually lead to an exchange that turns into revenue. Our findings confirm that, beyond facilitating exchanges, store visits also increase the likelihood that an exchanged item will be kept.
Our findings have important implications for how retailers can leverage their omni-channel capabilities to benefit from the opportunities provided by returns, especially based on the customers’ RFM profiles. First, by encouraging consumers to engage with physical stores, retailers can reduce returns, indicating the importance of such interactions in fostering a sense of satisfaction or resolving issues. Moreover, these interactions promote a preference for exchanges rather than outright returns, which can be beneficial for both retailers and consumers alike. Ultimately, engaging in in-store interactions significantly enhances the likelihood of customers keeping the exchanged product, which not only meets customers’ needs more effectively but also boosts retailer revenue. Second, pick-up-in-store and return-to-store services should not only be seen as an operational improvement, but also as a means for customer development. Third, given the role of physical in-store inspection, revenue recovery depends on offering a broad assortment in the stores.
The remainder of the paper is organized as follows. Section 2 summarizes the relevant literature and outlines the positioning and contribution of our research. Section 3 describes the construction of return journeys and reports model-free evidence on the importance of store visits for exchange purchases. Section 4 discusses the random forest and our econometric approach. Section 5 elaborates on the heterogeneous effects of store interactions on the exchange decision. Section 6 further explores these effects on return and keep decisions. Section 7 presents a set of robustness checks. Section 8 discusses the study’s implications in practice and research and concludes the paper.
Literature review
Our research connects three literature streams: post-return opportunities in retail, the role of in-store services in omni-channel retailing, and customer management using RFM profiling. Below, we position our study within these areas, highlighting our key contributions.
Our contribution lies in extending this sequential analysis to an omni-channel context, where purchases, pickups, returns, and exchanges can occur across different channels. We specifically quantify how store visits during return journeys of online purchases can facilitate the conversion of returns into exchanges, thus bridging a critical gap in omni-channel return management.
Unlike prior studies focusing on single omni-channel services (e.g., pickup-in-store), we analyze various store interactions within return journeys. Additionally, we propose a distinct performance metric—the conversion of returns into exchanges—rather than traditional measures like total sales or return volume. Our analysis at the return-journey level, going beyond prior studies even at the consumer level (Bell et al., 2020; Song et al., 2020), provides novel insights into how online-offline interactions shape immediate customer decisions post-return.
Empirical setting
We obtained transaction data from a Dutch omni-channel fashion retailer. While the retailer offers clothing for women, men, and children, it is mainly targeted at women. 1 We have 7 months of data, from August 2018 to March 2019. We use the first 2 months of data only to operationalize the customer experience variables (see Section 3.2), and we use the remaining period for analysis. During our observation period, the retailer operated 213 physical stores across the Netherlands alongside its online channel.
As is common for online purchases, the return rate is quite high in our setting: 30.68% of the online purchases at the retailer have been returned—in stark contrast to the 3% reported by Dzyabura et al. (2023) in physical stores. In addition, only 15.30% of the returned items have been exchanged in our case, lower than the 38.7% exchange rate reported by Samorani et al. (2019) for brick-and-mortar settings. Given these striking differences between physical and online channels, store interactions might be an important opportunity to convert returns of online purchases into exchanges. In our analysis, we use the transaction data of customers with known customer profiles to construct return journeys. These data constitute more than 99% of the transactions, covering 153,275 purchases and 47,021 associated returns made by 35,760 unique consumers.
Return journeys
A return journey is a series of purchase and return transactions. While each return journey contains at least an initial online purchase and its return, some journeys continue with subsequent exchanges and returns. Each journey ends with either a no-keep decision (the customer does not keep any product) or a keep decision (the customer keeps an exchanged product). Throughout the return journey, the customer may visit the store for several reasons. Specifically, an online purchase may be picked up, returned, or exchanged during a store visit. For example, a customer who buys a skirt online receives it at home and then decides to return it to the store a few days later.
Following Samorani et al. (2019) and Shang et al. (2019), we operationalize exchanges as purchases by the same customer from the same category, in any channel, within a certain time window after the purchase date of the returned product (see Table 1 for examples of exchanges within a product category). 2 For in-store returns, we look for exchange purchases between the purchase date and one week following the exact return date. For online returns, however, no exact return date is tracked by our partner retailer, and we rely on the retailer’s returns policy to determine the time window for exchanges. Online purchases can be returned up to two weeks after the delivery date, which is, at most, three days after the order date. Hence, we consider a time frame of 24 days—that is, three delivery days, two return weeks, and one extra week—to look for exchange purchases. This procedure allows us to consider exchange purchases that may occur before the original purchase is returned—due to its convenience, it is especially common to make an online exchange purchase before returning. Exchange purchases might, in turn, be followed by successive returns and exchanges, which are tracked by using the same rules successively.
Examples of exchanges within product categories.

Examples of exchanges within product categories.
Following the above rules, 3 we reconstructed 45,675 return journeys, which may include multiple purchases and returns, by 13,697 unique customers in 21 product categories. Out of all the return journeys, 3,032 (6.64%) include a store interaction before the exchange decision. Most return journeys end either right after the first return (84.70%) or right after the first exchange purchase (12.54%), while journeys longer than two exchange purchases are exceptional (0.16%). Supplemental Appendix A provides a step-by-step overview of raw transaction data to the journey-based samples.
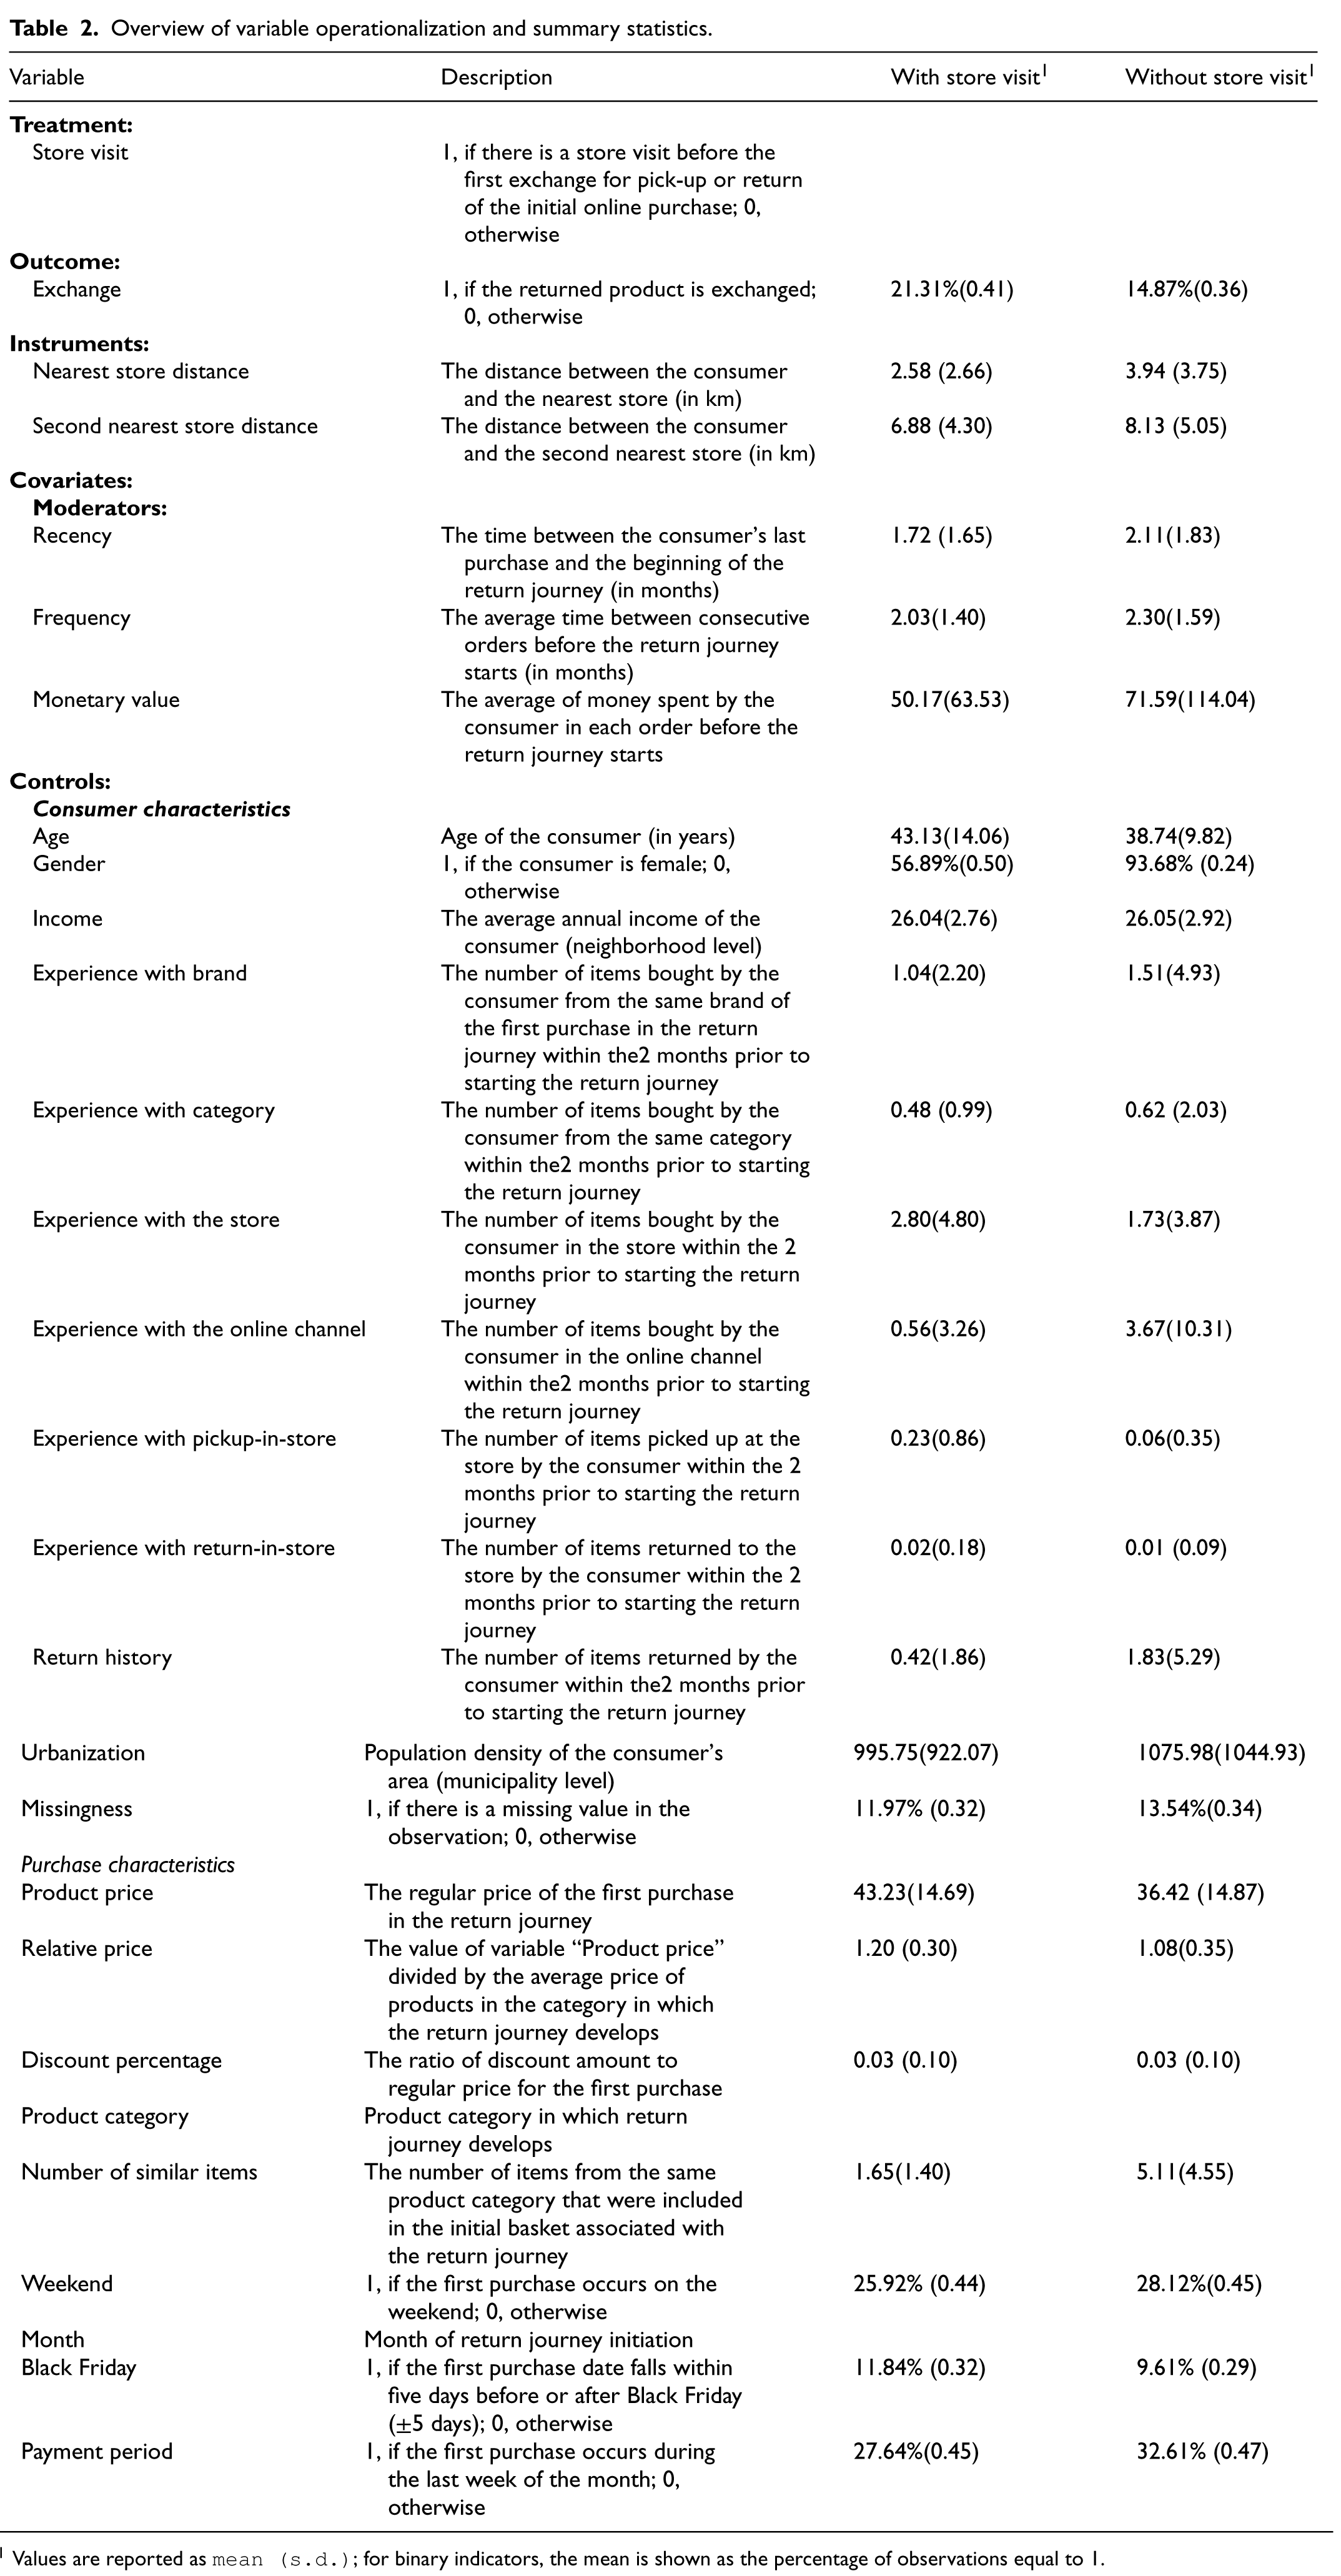
We describe all variables below and provide summary statistics in Table 2, which presents a comprehensive overview of each variable, its operationalization, and the corresponding means and standard deviations for return journeys with and without a store visit for pick-up or return of the initial online purchase.
Overview of variable operationalization and summary statistics.
Overview of variable operationalization and summary statistics.
1 Values are reported as
A first descriptive look at the data already hints that customers who visit a store to pick up or return an online purchase are more likely to exchange it later on. As indicated in Table 2, exchanges are much more common in journeys with a store visit (21.31%) than in journeys without (14.87%, difference = 6.44%,
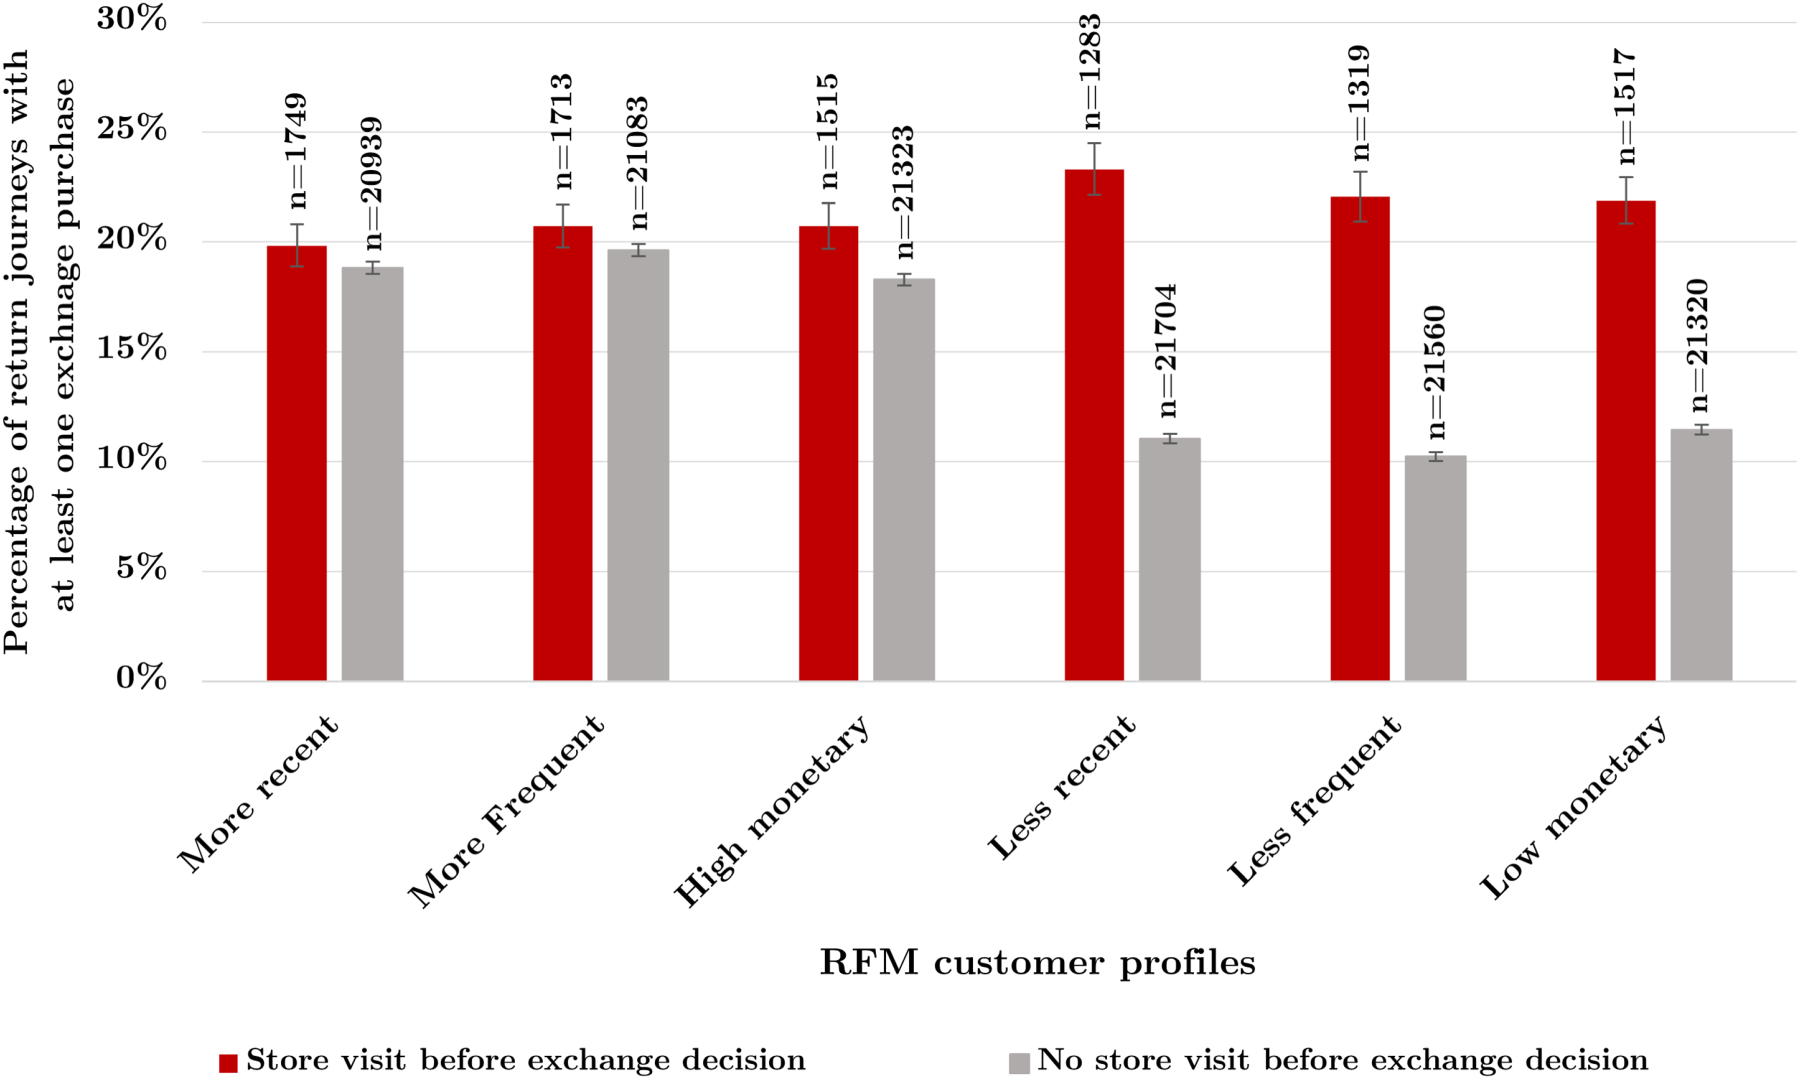
Share of return journeys with an exchange purchase, by RFM customer profile. Error bars indicate
However, Figure 1 does not capture the full picture of the effect of such store visits on product exchanges. Because store visits are customer-initiated, there might be self-selection (Verhoef et al., 2022). A customer might visit the store because they already intend to make an exchange purchase or simply because they are frequent in-store shoppers, making exchanges more likely due to the prior intent or past experience rather than due to the store visit itself. To address such potential endogeneity, we include several control variables that might affect both decisions to visit the store and to exchange, including prior experience with the retailer (see Table 2). Nonetheless, unobserved confounders might remain. We therefore use an IVs approach to identify the causal effect of such store interactions on the exchange decision, as we describe next.
Following the potential outcomes framework (Imbens and Rubin, 2015; Rubin, 1974), we define the causal effect of a store visit as the difference in the probability that a return is exchanged when the customer did versus did not visit the store in the return journey prior to their exchange decision. Hence, for each journey 
To estimate the heterogeneous treatment effect
In our setting, the GRF algorithm grows a set of
The algorithm then constructs a local neighborhood around the covariate vector 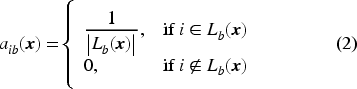
Averaging these weights across all fitted trees yields the forest-based weight 
The treatment effect is estimated using a forest-weighted two-stage least squares approach, as we describe next.
To estimate the conditional local average treatment effects, following Athey et al. (2019), we adopt the structural model below, which relates the exchange outcome 
The instrumental forest is designed for settings like ours, where the treatment might be endogenous and its causal effect heterogeneous. Following Coibion et al. (2021), we use the distance to the nearest store as an instrument for a store visit. This instrument is relevant because customers who live closer to a store are more likely to visit the store, as illustrated in Figure 2(a). The percentage of journeys with a store visit exceeds 25% for customers living within one kilometer of a store. This percentage gradually decreases as the distance gets longer, dropping below 5% for customers who live more than 20 kilometers away from a store, indicating that store distance is a strong instrument for store visits. In addition, we include the distance to the second nearest store as a second instrument. As Figure 2(b) shows, we find a similar pattern for the percentage of journeys with a store visit considering consumers’ distance to their second closest store. The two instruments have a correlation of 0.664, indicating that the distance to the second nearest store offers additional exogenous variation beyond what is already captured in the distance to the nearest store.
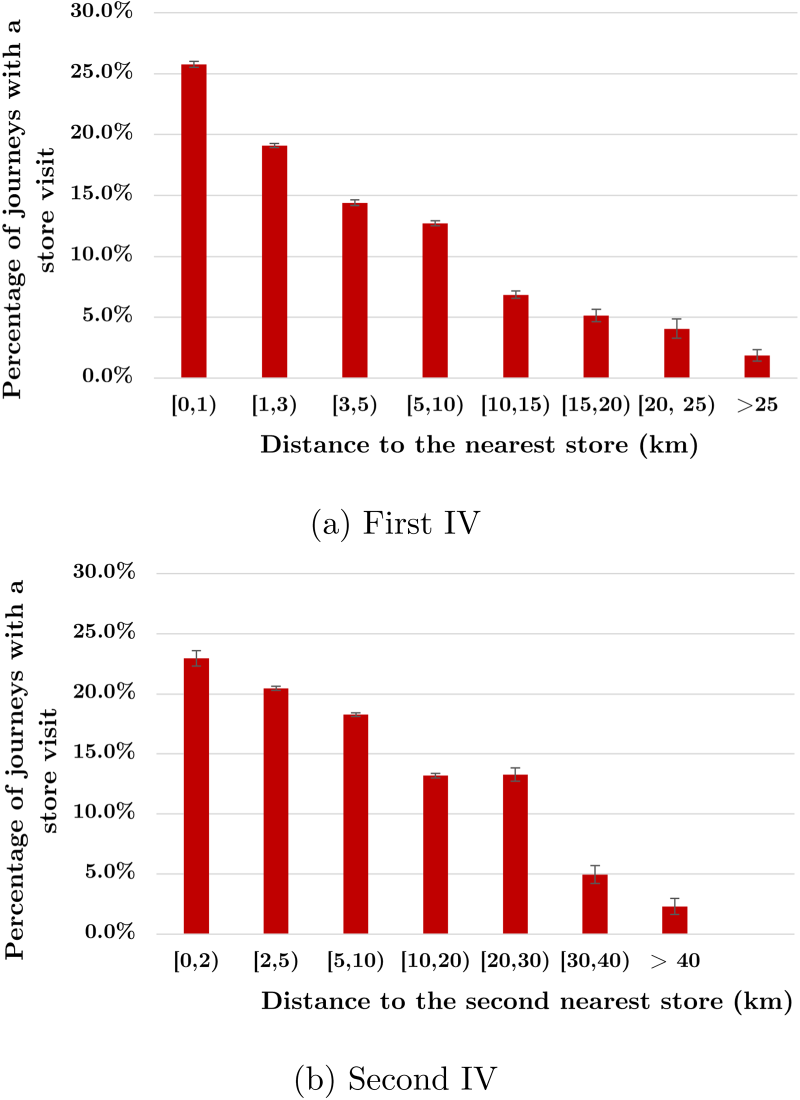
Relevance criterion for the IVs. Error bars indicate
Apart from correlating with store visits (instrument relevance), identification using the instrumental forest also relies on the assumptions of exclusion and partial monotonicity (Angrist and Pischke, 2009). First, exclusion implies that the instruments do not affect the customer’s decision to make an exchange purchase other than via a store visit. As this cannot be formally tested, we argue why the distance instruments meet the exclusion restriction conceptually. It seems improbable that people would move close to a store because of an exchange purchase that they would like to make, making it unlikely that distance to the nearest or second nearest store would increase the probability of purchasing an exchange independently of store visits, especially in a context like ours, where stores have high density and are located in urban as well as rural districts. In addition, while our study may have unobserved confounders, it is unlikely that these confounders are correlated with distance to the store. For instance, when a customer decides to return an item (e.g., a pair of jeans) and really needs a new one, they are more likely to make an exchange purchase, and we do not observe such latent needs. However, it is improbable that these needs are correlated with the distance to the store. This lack of correlation assures that the IVs remain valid. Second, partial monotonicity implies that, holding the distance to the nearest (second-nearest) store fixed, a decrease in the distance to the second-nearest (nearest) store weakly increases the likelihood that a customer visits the store (Mogstad et al., 2021), which seems plausible.
To provide more formal evidence that the instruments meet the relevance criterion and exclusion restriction, we perform further diagnostic tests. First, to formally test instrument strength, we estimate the first stage equation of a classic 2SLS approach. That is, we regress the treatment variable (store visit) on both instruments as well as covariates described in Table 2 and perform an
We estimate the instrumental forest using the R package developed by Biewen and Kugler (2021), which extends the implementation of Athey et al. (2019) to allow for multiple instruments. As recommended by Athey et al. (2019), the estimation is performed on centered variables
In this section, we present the results obtained from our instrumental forest approach. Figure 3 plots the estimated conditional local average treatment effects of a store visit on exchange probability in a return journey, both overall and across different customer profiles. For ease of presentation, we use median splits of the recency, frequency, and monetary value moderators to show the heterogeneity in the estimated effects. The standard errors are obtained following Chernozhukov et al. (2018).
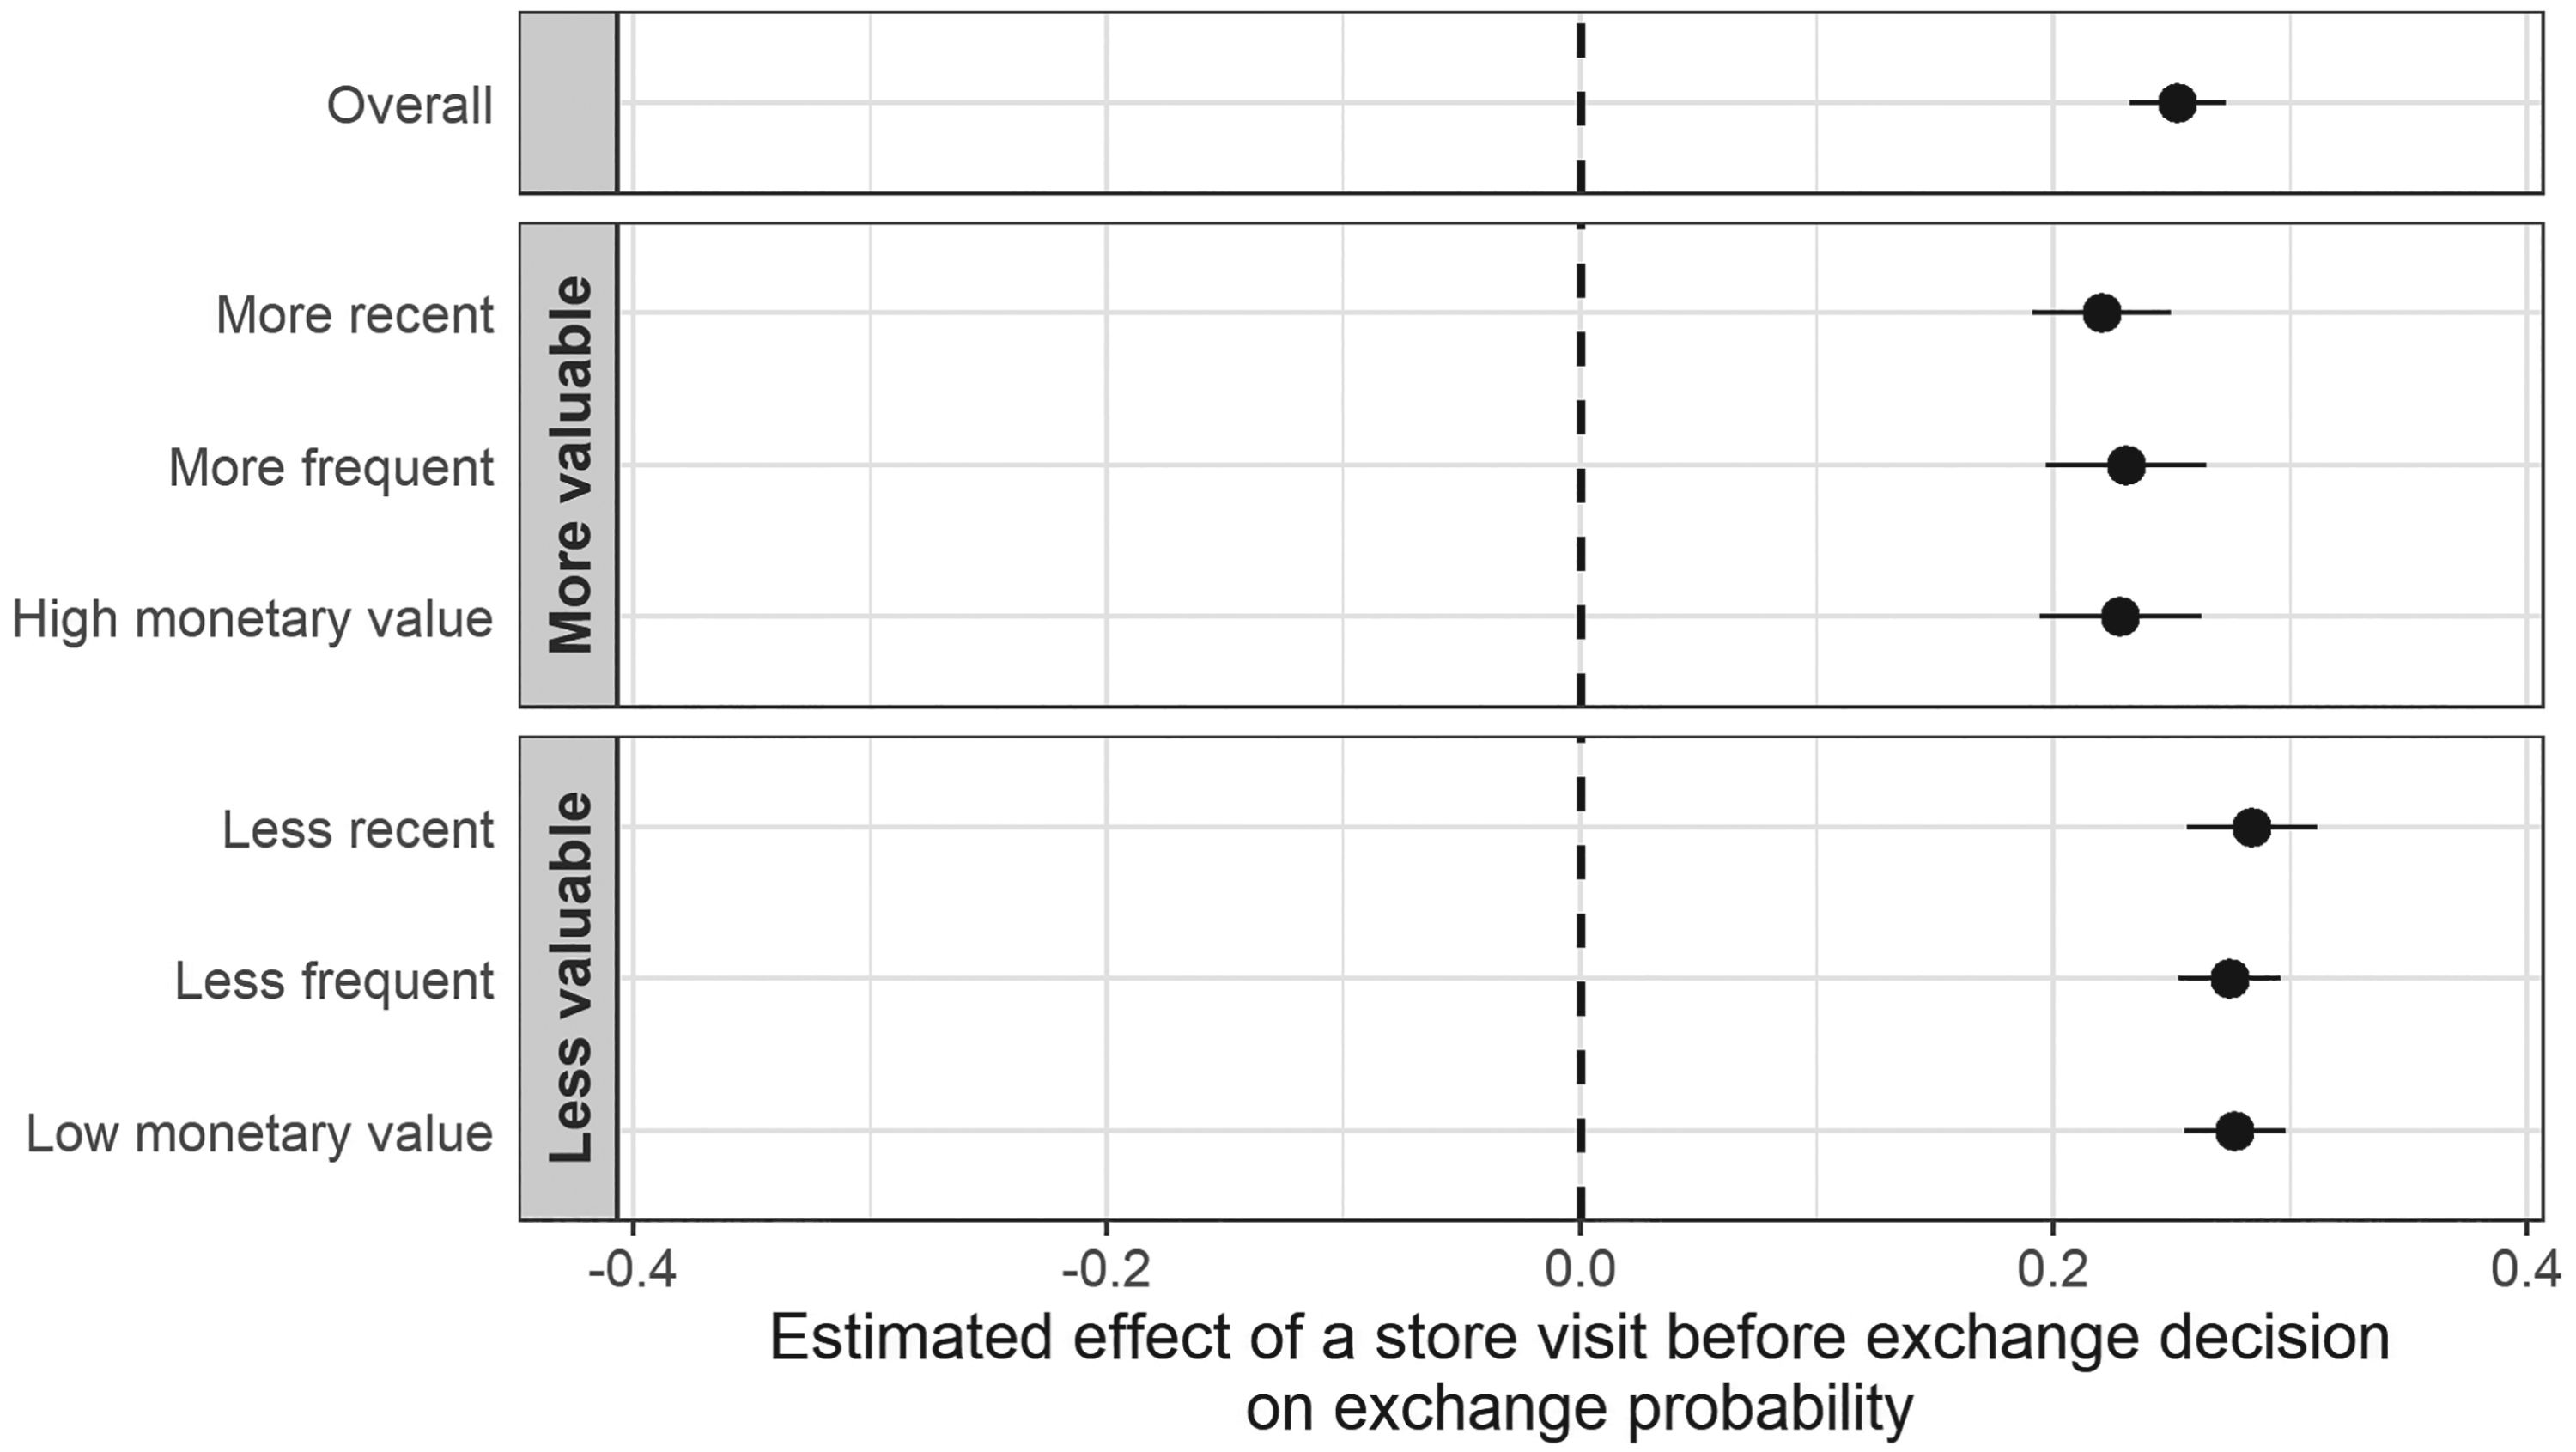
Estimated effect of a store visit on exchange probability (point estimates with 95% confidence intervals across RFM customer profiles).
Figure 3 shows that a store visit for pick-up or return of the initial purchase in a return journey increases the likelihood that the customer will purchase an exchange (
Our analysis shows that when a customer visits the store to pick up or return an online purchase, they are more likely to exchange it. This section probes why that is the case. Unlike online interactions, in-store visits allow customers to physically inspect potential purchases, which is an important added value of the store (Zhang et al., 2022), especially in the fashion industry (Sachdeva and Goel, 2015). Physical inspection helps reduce uncertainty and allows customers to more easily find an exchange product, which may contribute to the observed store-visit effect. However, visiting the store also requires a costly effort to make the trip (Bell et al., 1998; Briesch et al., 2009), which consumers may perceive as a sunk cost once incurred. They might feel compelled to justify this cost and “make the trip worthwhile” by completing an exchange that fulfills their initial need.
To explore the role of physical inspection in driving the store-visit effect, we leverage variation in assortment sizes across product categories and stores. If physical inspection is a key driver, we would expect the effect to be stronger for categories and stores that offer a greater variety of unique products, where consumers are more likely to find a suitable replacement by physically examining a wider range of alternatives. First, Figure 4 documents how the exchange likelihood differs across product categories with at least 100 return journeys in each journey type (with and without a store visit before the exchange decision),
5
arranged from the narrowest to broadest category. Notably, the magnitude of the store-visit uplift is not uniform across categories. It is the largest in broad categories such as Tops & T-shirts, and smallest in narrow ones such as Shoes, providing evidence in favor of the inspection mechanism. A complementary regression-slope difference test reinforces this interpretation. Estimating identical regression models of exchange separately for journeys with and without store visits, while including all controls in Table 2, reveals a steeper slope on category breadth when a store visit occurs (difference in coefficients = 0.010,
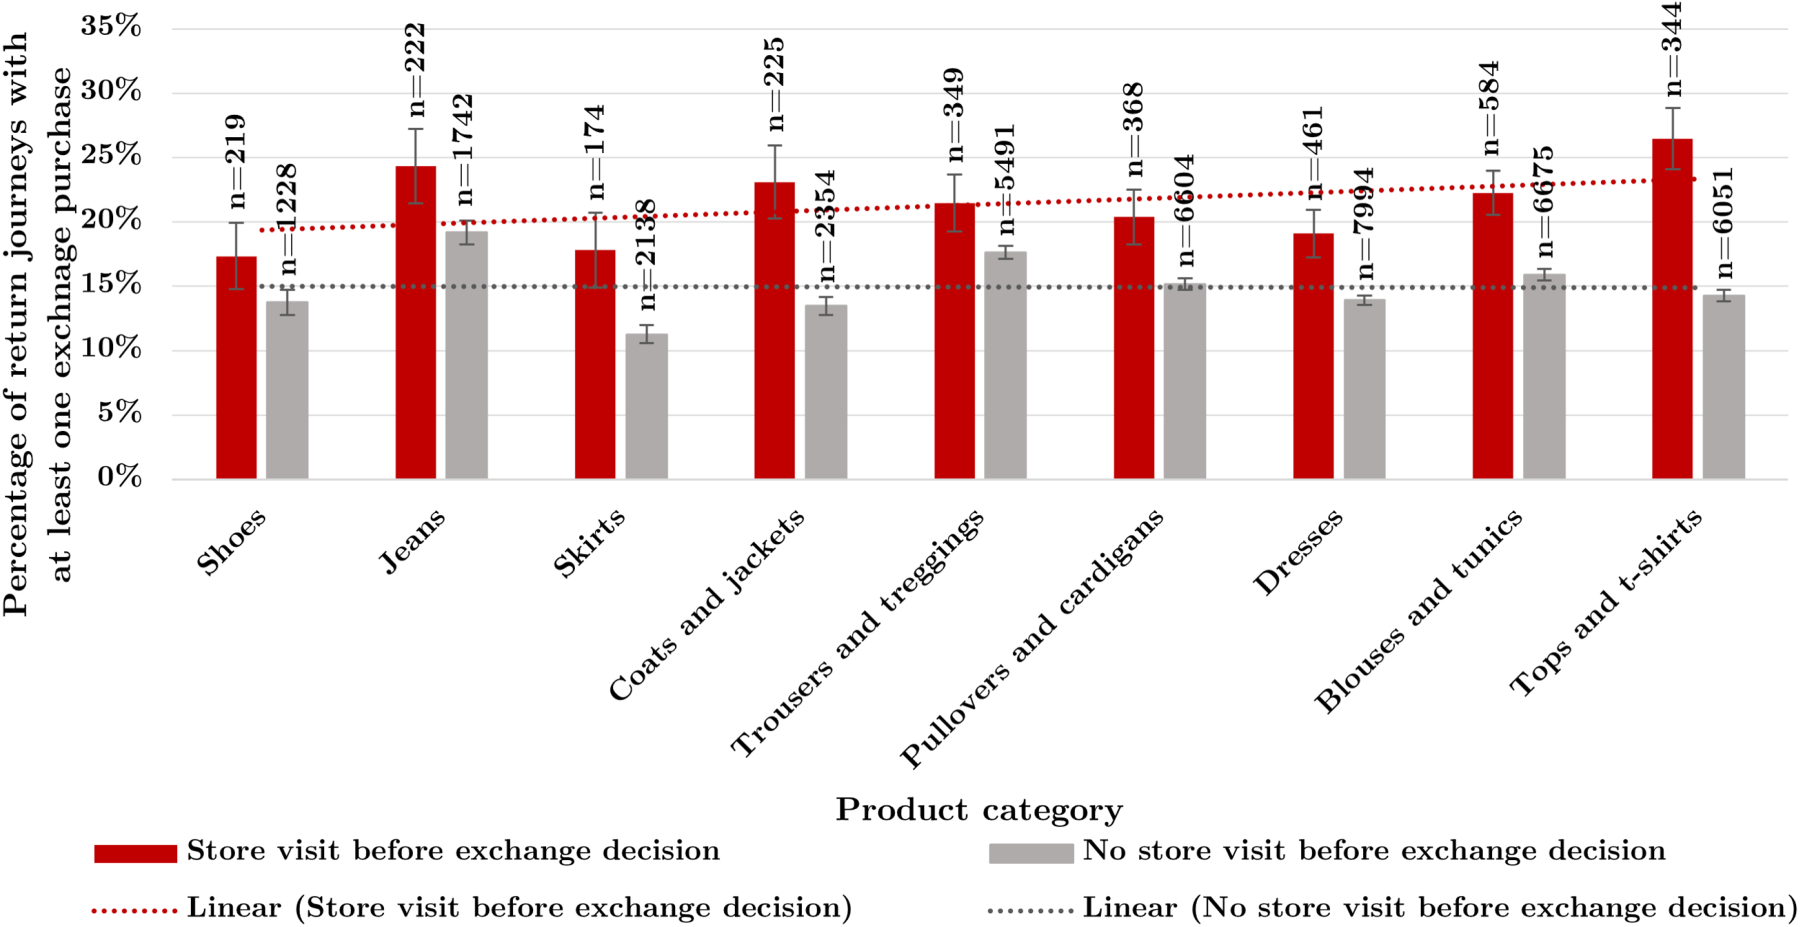
Share of return journeys that include an exchange purchase, by product category. Error bars indicate
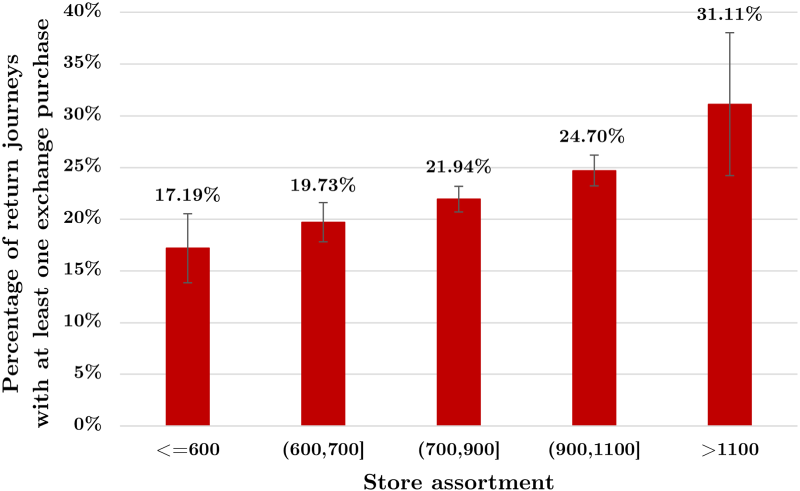
Share of return journeys that include an exchange purchase, by store assortment. Error bars indicate
To examine the role of sunk costs of making a shopping trip in driving the store-visit effect, we exploit variation in such costs due to travel distance. If the sunk-cost mechanism is at play, we would expect to see a higher exchange likelihood on trips with longer travel distances: the longer the trip, the higher the associated cost (Briesch et al., 2009), and therefore the stronger the psychological pressure to justify the effort by leaving with an exchange. Figure 6 displays exchange rates for trips of varying distances between the store and the customer’s home. The exchange rate remains relatively flat across store distances and even declines beyond 20 km (exchange probability = 15.6%), providing evidence against the sunk-cost mechanism. A regression of exchange on distance to the return store, including all controls in Table 2, yields no significant effect (
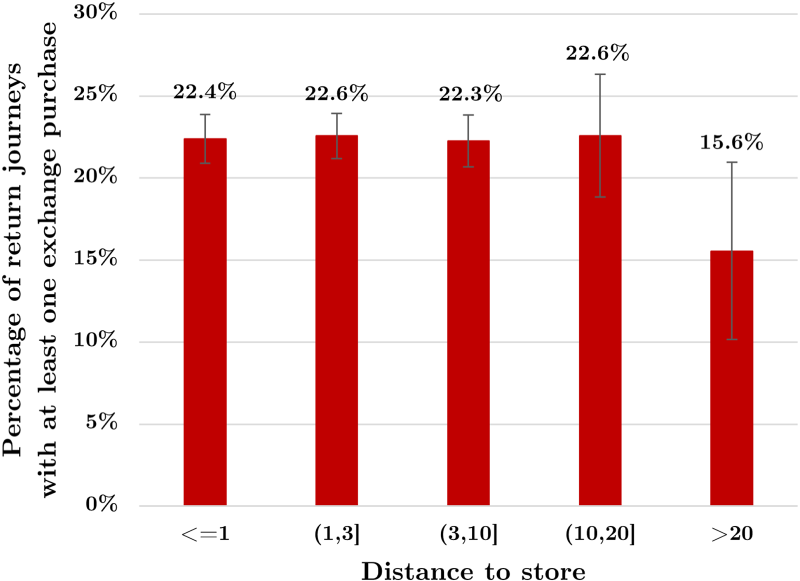
Share of return journeys that include an exchange purchase, by traveled distance to store. Error bars indicate
Together, these findings suggest that the store-visit effect is explained by the opportunity for physical inspection rather than sunk costs associated with the trip. While exchange is significantly more likely in stores with broader assortments, this is not the case for longer travel distances, offering little support for the notion that consumers feel compelled to justify trip costs. Instead, the ability to evaluate a wider range of products in person appears central to facilitating exchange purchases. Importantly, this aligns with the moderation effects in Figure 3. Store visits have the greatest impact on less valuable customers, likely because they are less familiar with the retailer’s assortment and benefit more from a tactile, in-person experience.
The results in Section 5 demonstrate that store visits for pick-up or return of an online purchase increase the likelihood that a return is exchanged. This is a desirable outcome and the main focus of our study. However, to gauge the benefit of store visits across the entire return journey, we also need to understand (i) whether store visits make returns less likely in the first place, and (ii) if the exchanges are eventually kept by the consumers, leading to retained revenue at the retailer. In the following, we explain our analyses and results regarding these two additional outcomes.
The impact of a store visit on the return decision
If store visits increase the exchange probability but also increase the return probability, the benefit of a store visit remains unclear. To test the effect of a store visit on the return probability, we extend our data set to include online purchases both with and without returns. We now use the return decision as the outcome variable, indicating whether the customer decides to return the initial online purchase. Consistent with the journey perspective, the store visit treatment can also change along the journey. As the return decision is earlier in the journey, we consider store visits only in the pre-return phase. Specifically, the treatment variable now indicates whether the customer visited the store before the return decision, which can only happen in the purchase phase, that is, if the customer picked up their online purchase in the store.
The percentages of online purchases followed by at least one return for journeys with and without store visits are 12.92% and 34.73%, respectively. This discrepancy (difference = 21.81%,
The overall effect of a store visit (during the purchase phase) on the subsequent return probability, along with the heterogeneity in this effect across RFM profiles, is depicted in Figure 7. The results indicate that a store visit for picking up an online purchase lowers the customer’s tendency to return (
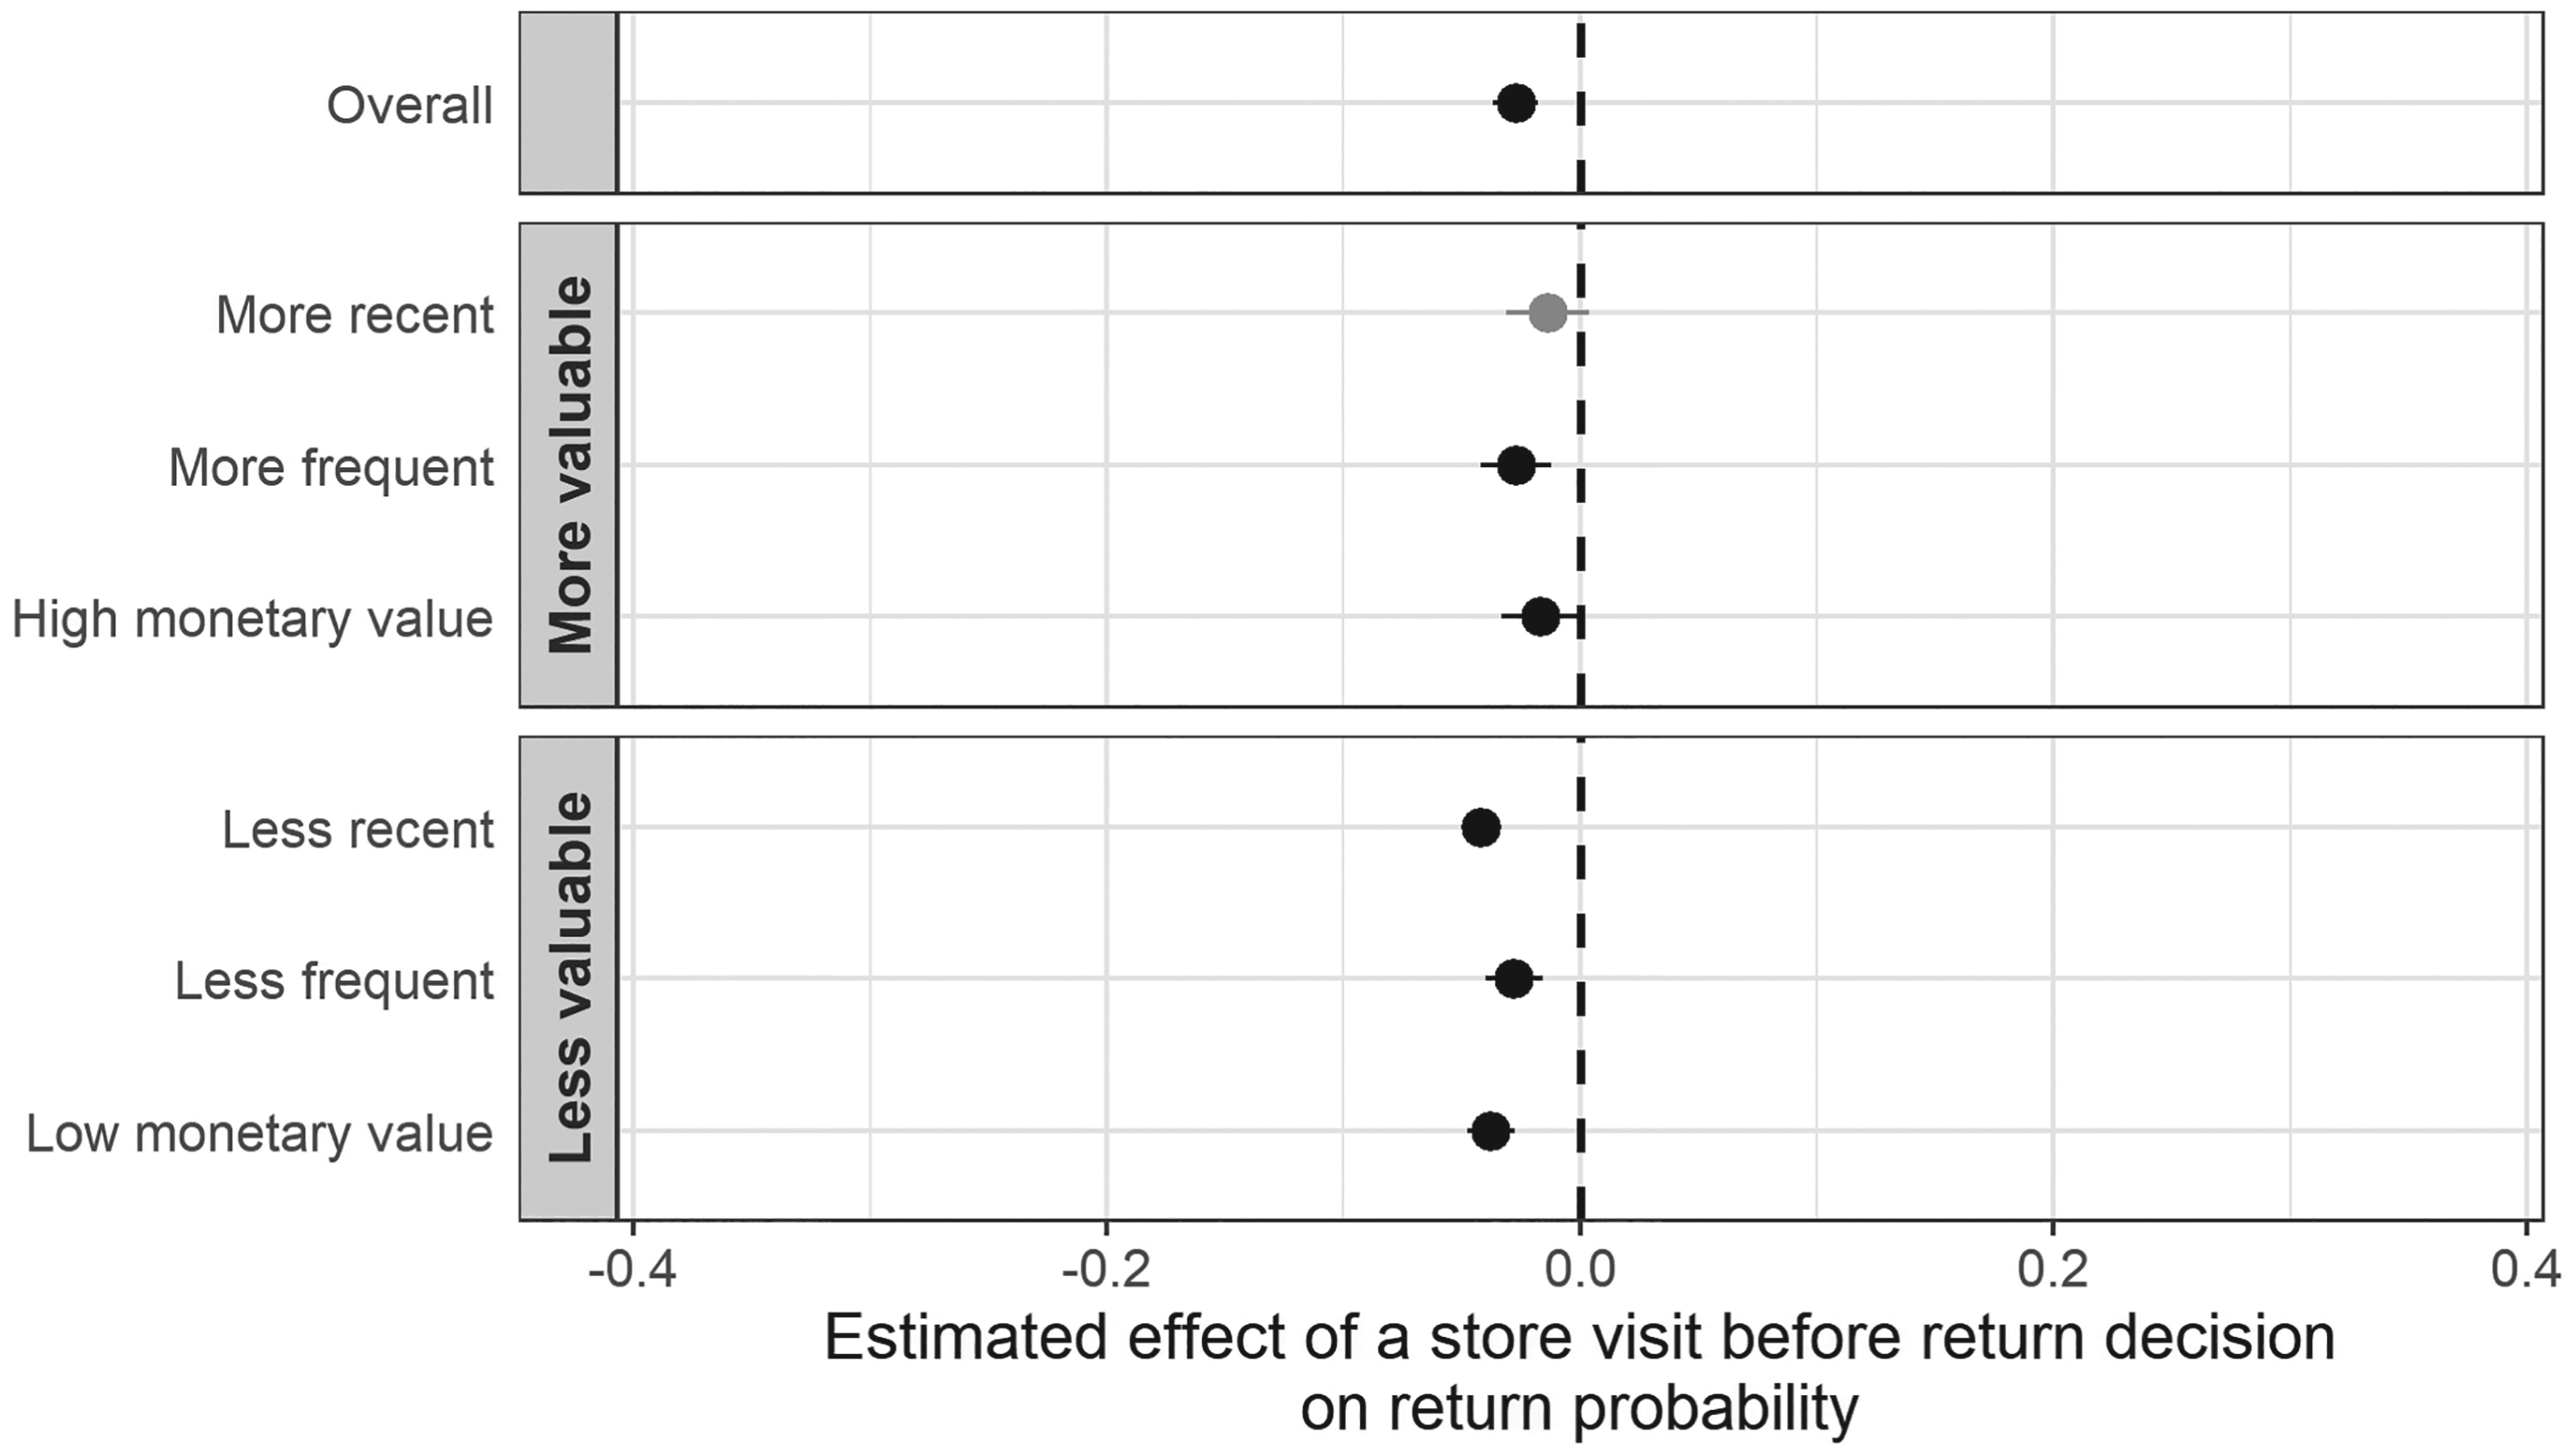
Estimated effect of a store visit on return probability (point estimates with 95% confidence intervals across RFM customer profiles).
After the exchange, the customer decides whether to keep the exchanged item or to, again, return it. If the customer returns the new product, they may purchase another exchange or leave the retailer empty-handed. The return journey may continue with multiple returns and exchanges until the customer decides to keep her last exchange purchase or leave without any purchase. To evaluate the effect of store visits on consumer decisions to keep their last exchange purchase, we restrict our analysis to the return journeys with at least one exchange, consisting of 6,989 return journeys. We introduce a new outcome, the keep decision, which is conditional on an exchange and indicates whether the customer keeps the exchange purchase at the end of the journey or leaves the retailer empty-handed. Consistent with the journey perspective, the treatment variable at this stage of the journey indicates whether a store visit occurred throughout the entire return journey. Such store visits could have happened for pickup, return, and/or exchange.
Comparing the percentage of return journeys ending with a keep decision for those with and without store visits shows a strong disparity. Journeys with a store visit have a much higher keep rate (92.26%) than online-only journeys (79.87%) (difference = 12.39%,
The overall effect of store visits on the keep probability, as well as the heterogeneity in this effect across different RFM customer profiles, is illustrated in Figure 8. The findings indicate that engaging with the physical store throughout a return journey increases a consumer’s propensity to keep an exchanged item (
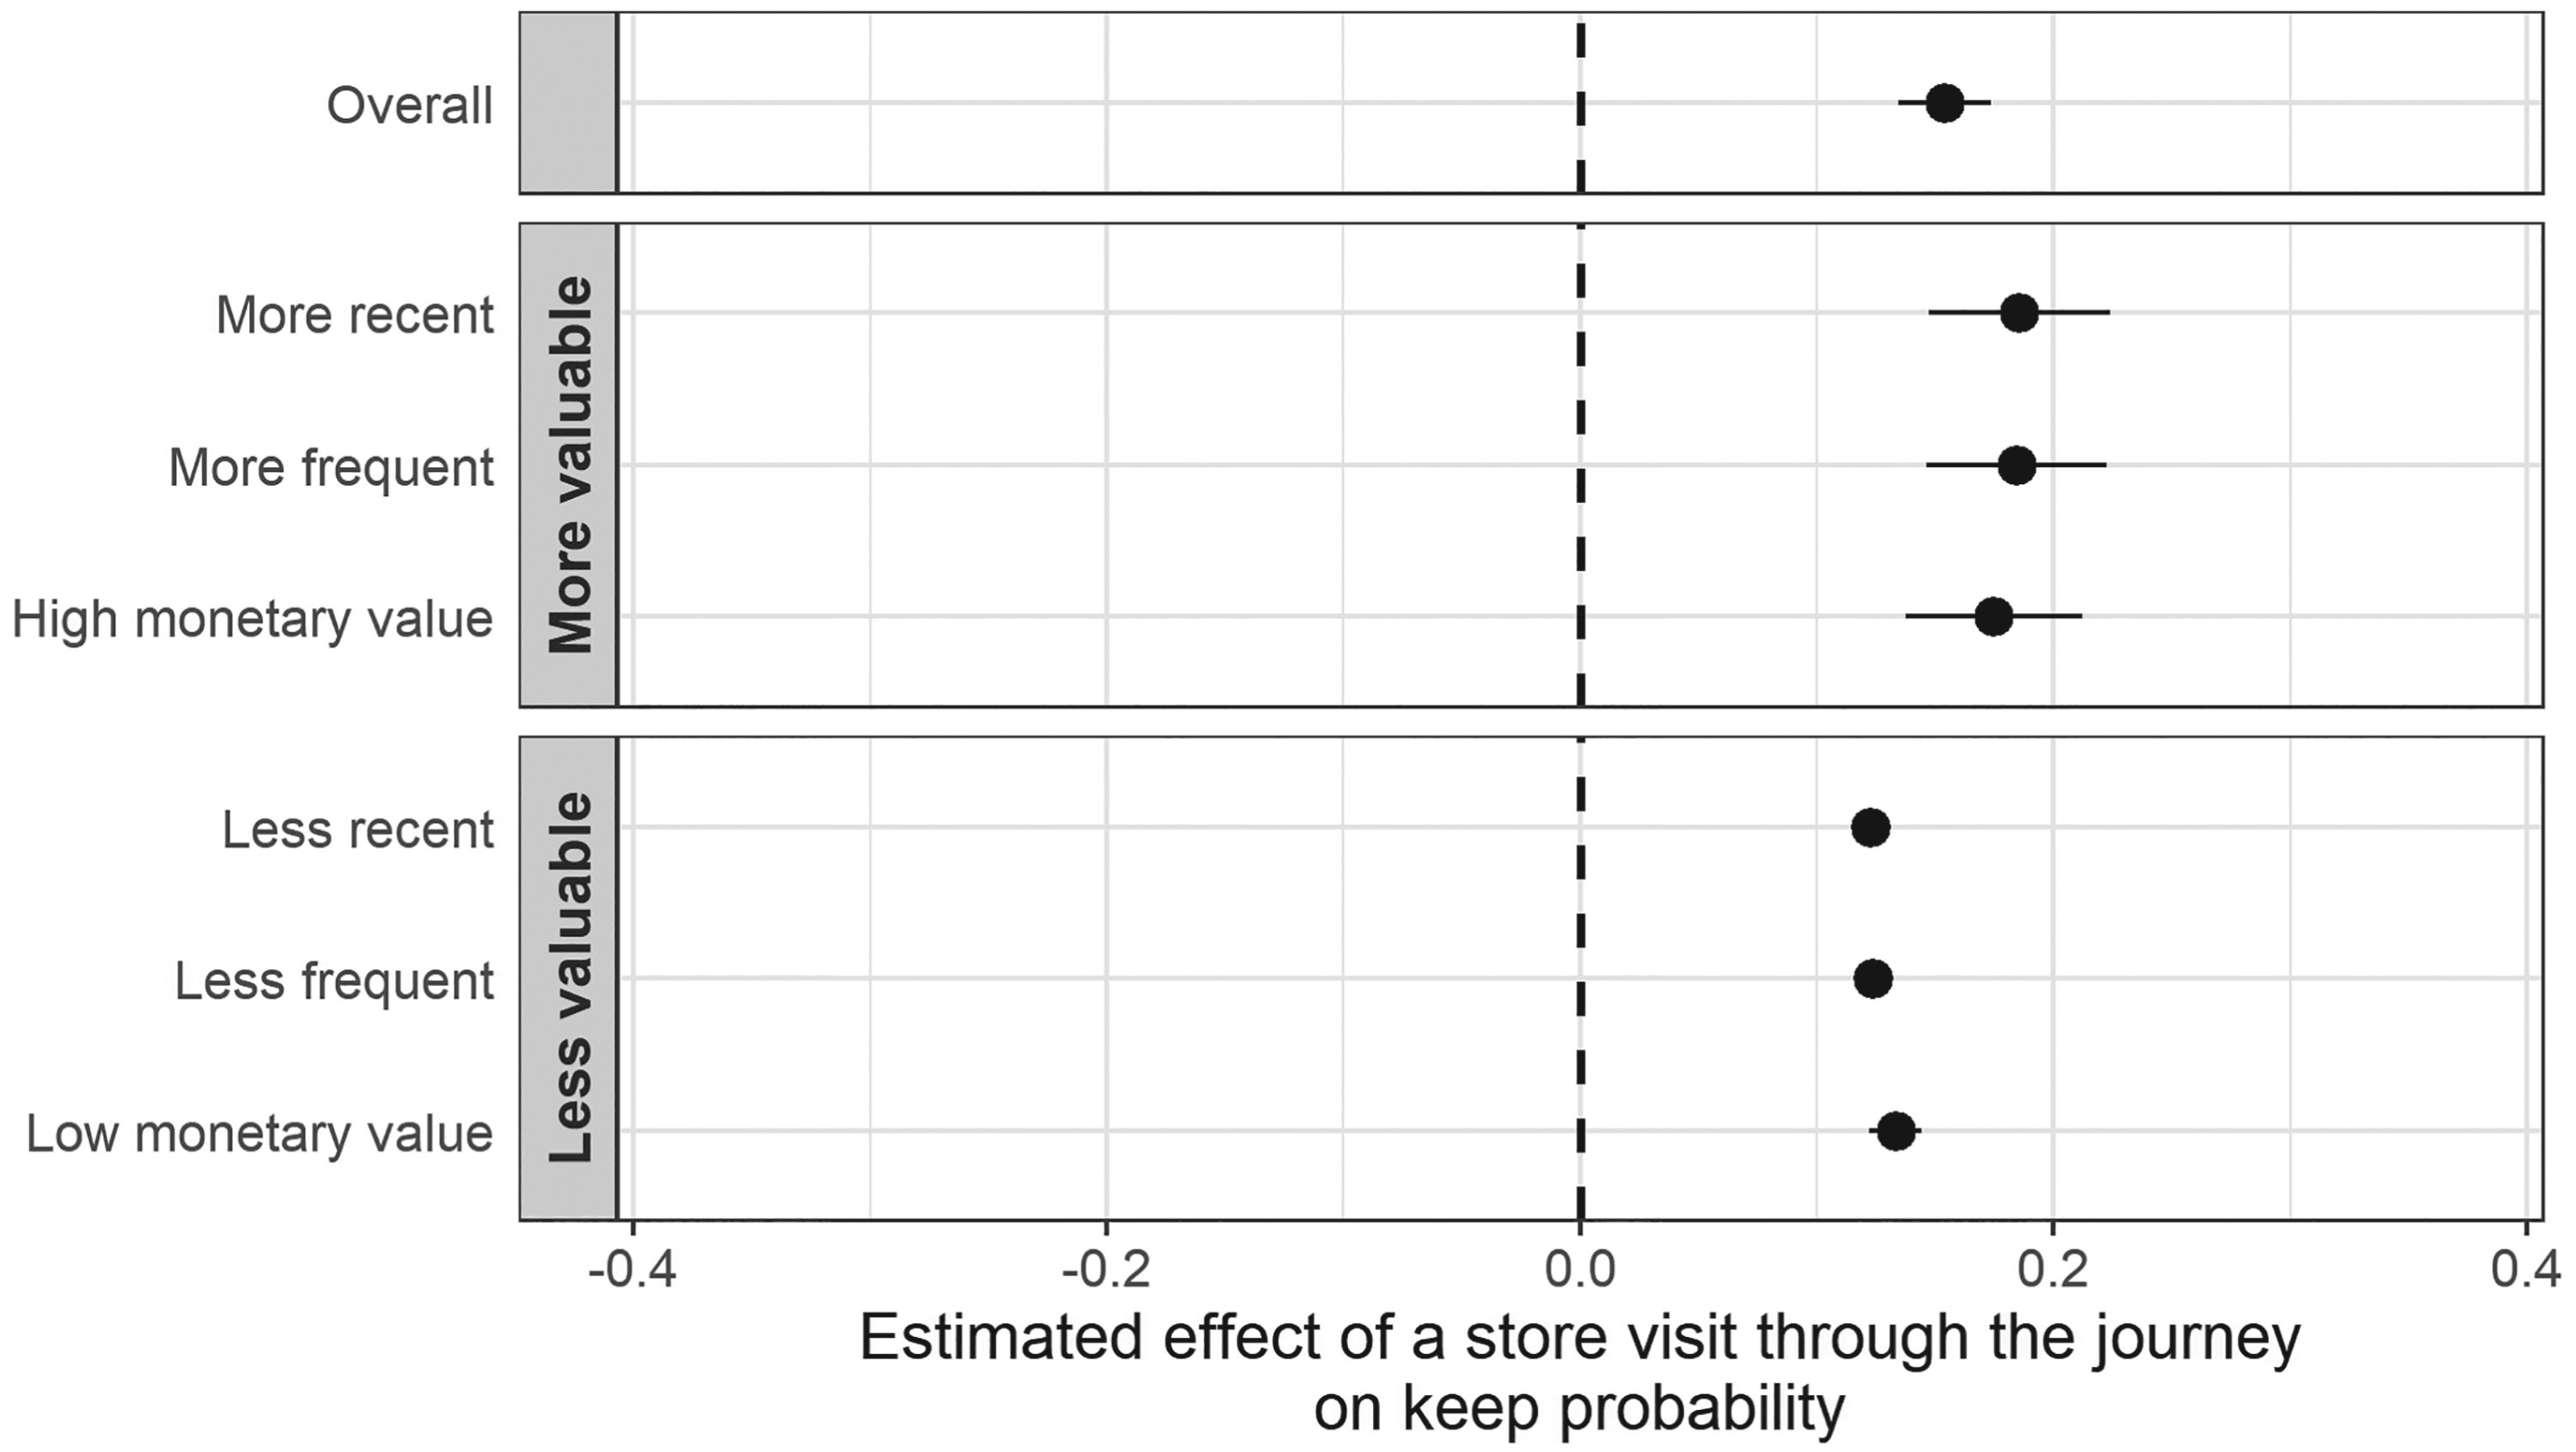
Estimated effect of a store visit on keep probability (point estimates with 95% confidence intervals across RFM customer profiles).
Identification of the store visit effect using the instrumental forest estimator relies on the exclusion and partial monotonicity assumptions (Section 4.2). To assess robustness, we compare our results to instrument-free identification using matching (Section 7.1). We also assess robustness with respect to alternative exchange operationalizations, choices in variable operationalization, other instrument-free methods, sample selection, and alternative samples in Section 7.2.
Comparison to matching-based estimation
Matching-based estimators do not rely on an instrument, and they compare treated and control journeys in a globally balanced sample. To isolate whether differences from the instrumental-forest results stem from local versus global estimation or from instrument use, we compare three approaches. First, the instrumental forest used in our main analysis identifies a conditional local average treatment effect (CLATE): the effect of visiting the store for pick-up or return on the exchange probability for customers whose store-visit behavior is affected by store proximity, conditional on the covariates. Second, the matching estimator identifies an average treatment effect on the treated (ATET): the effect for customers who actually visit the store before the first exchange. Third, we include two-stage least squares (2SLS) on the same matched sample using the same two distance-based instruments, which identifies the unconditional local average treatment effect on the treated population. We use coarsened exact matching (CEM; Iacus et al., 2012) as our primary matching approach using all covariates listed in Table 2. Instrument relevance in the matched sample is supported by the first stage
All three approaches find a positive effect of a store visit for pick-up or return on the exchange probability, both overall and across the RFM customer profiles (Table 3). At the same time, the estimates differ in magnitude and precision. While the CEM-IV estimate for the exchange outcome is somewhat larger, the non-IV CEM estimate is substantially smaller. This suggests that the main source of the gap between the instrumental forest and matching is the use of instruments rather than the local-versus-global estimation strategy, consistent with the idea that the effect is stronger for customers whose store-visit behavior is affected by store proximity. The CEM-IV estimates are, however, substantially less precise than the instrumental forest estimates, which is expected given the efficiency of the random forest approach (Athey et al., 2019).
Comparison of the estimated effect of a store visit across estimators.
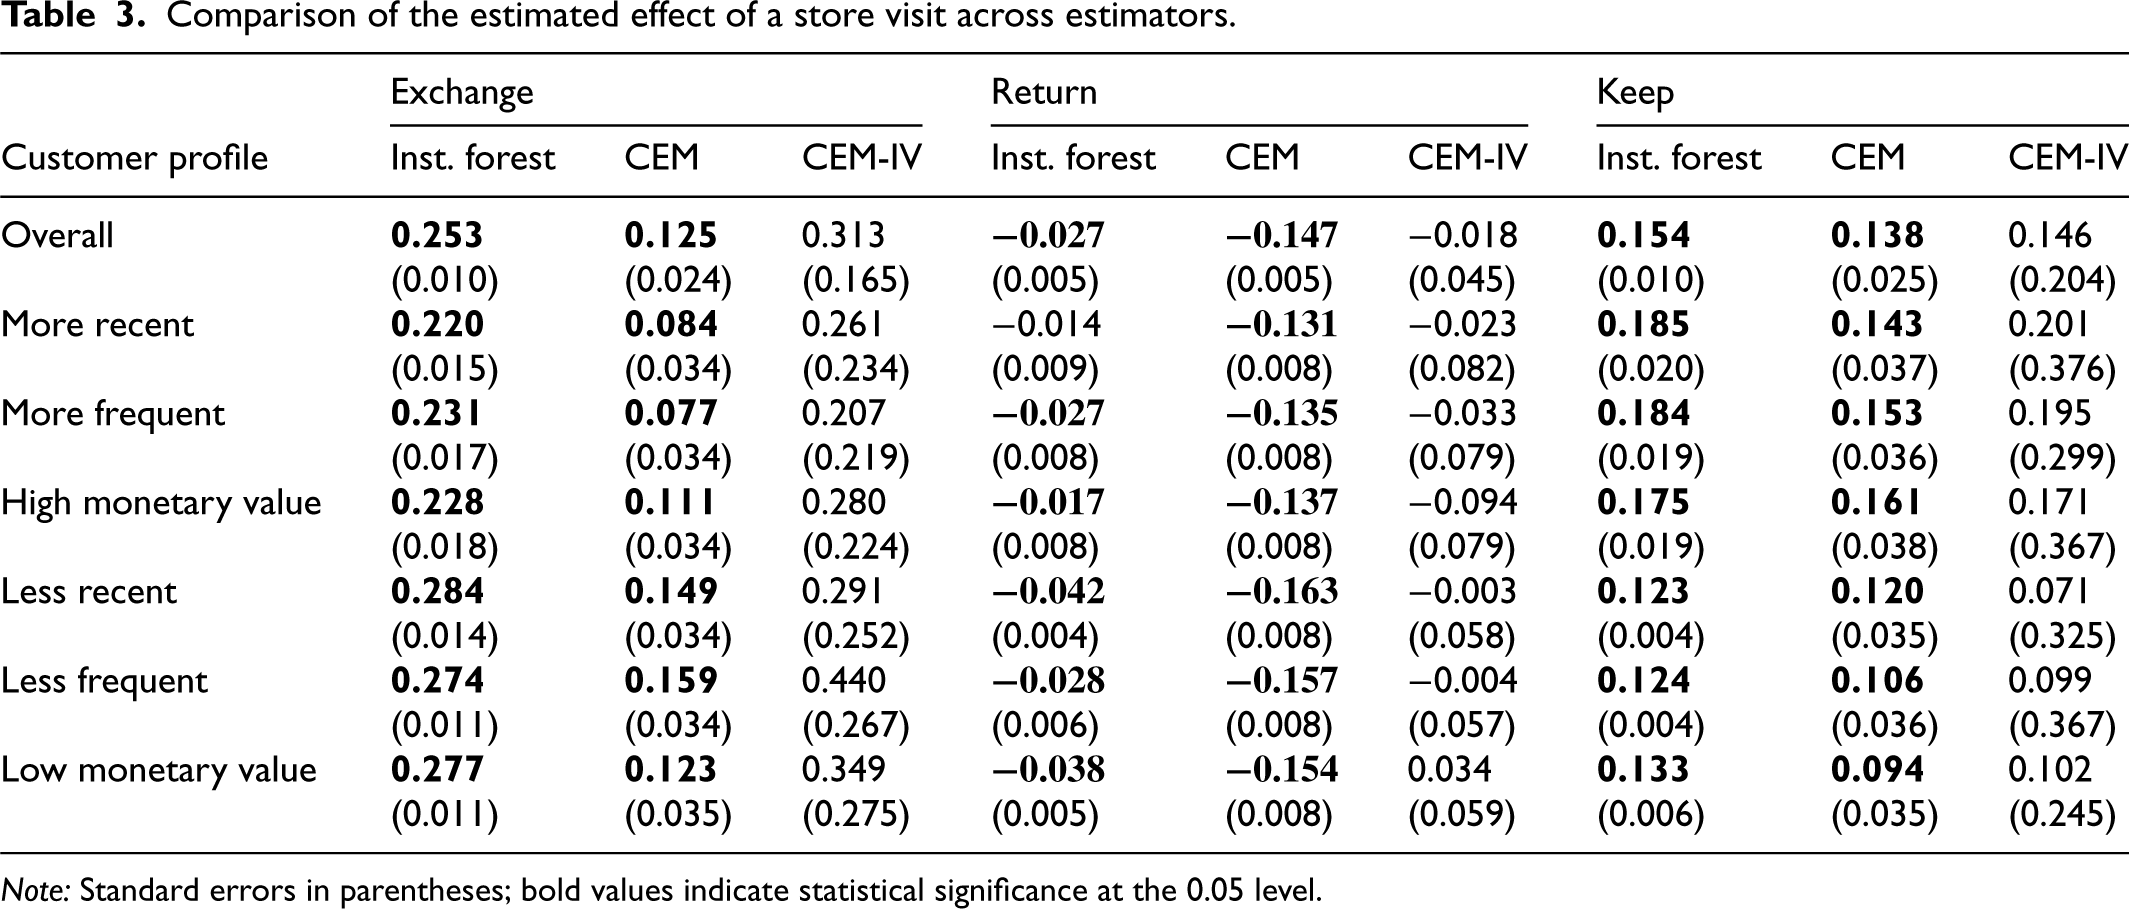
Comparison of the estimated effect of a store visit across estimators.
Note: Standard errors in parentheses; bold values indicate statistical significance at the 0.05 level.
To further verify the robustness of our findings, we perform additional robustness checks: (i) three alternative exchange operationalizations, (ii) alternative operationalizations of treatment, control, and moderator variables, (iii) three additional instrument-free causal-inference methods, (iv) an explicit correction for potential sample selection bias, and (v) different samples to rule out the role of bracketing behavior and differences across store departments. All details and results are presented in Supplemental Appendix D, with Table 4 providing an overview. Most notably, the IV-free methods lead to substantially lower effect estimates compared to the instrumental forest results in Table 3, with the exact magnitude depending on the estimand, target population, and identification assumptions. For the instrumental forest, exclusion fails if store placement is correlated with latent demand for the retailer or local exchange propensity, while partial monotonicity fails if store proximity makes some customers less likely to visit. The matching estimators rely on conditional independence (Angrist and Pischke, 2009), an assumption that fails if customers intending to exchange are more likely to return in-store, conditional on observables, with PSM and IPTW (unlike CEM) also requiring a correctly specified propensity score model. The SORE estimator, in turn, depends on the assumption that the underlying odds-ratio function adequately captures regressor-error dependence (Qian et al., 2026). Taken together, despite differences in identification strategy, target population, and estimation approach, all three estimators support the qualitative conclusion that store visits for pick-up or return of an online purchase facilitate subsequent exchanges, with stronger effects among less valuable customers.
Summary of additional robustness analyses.
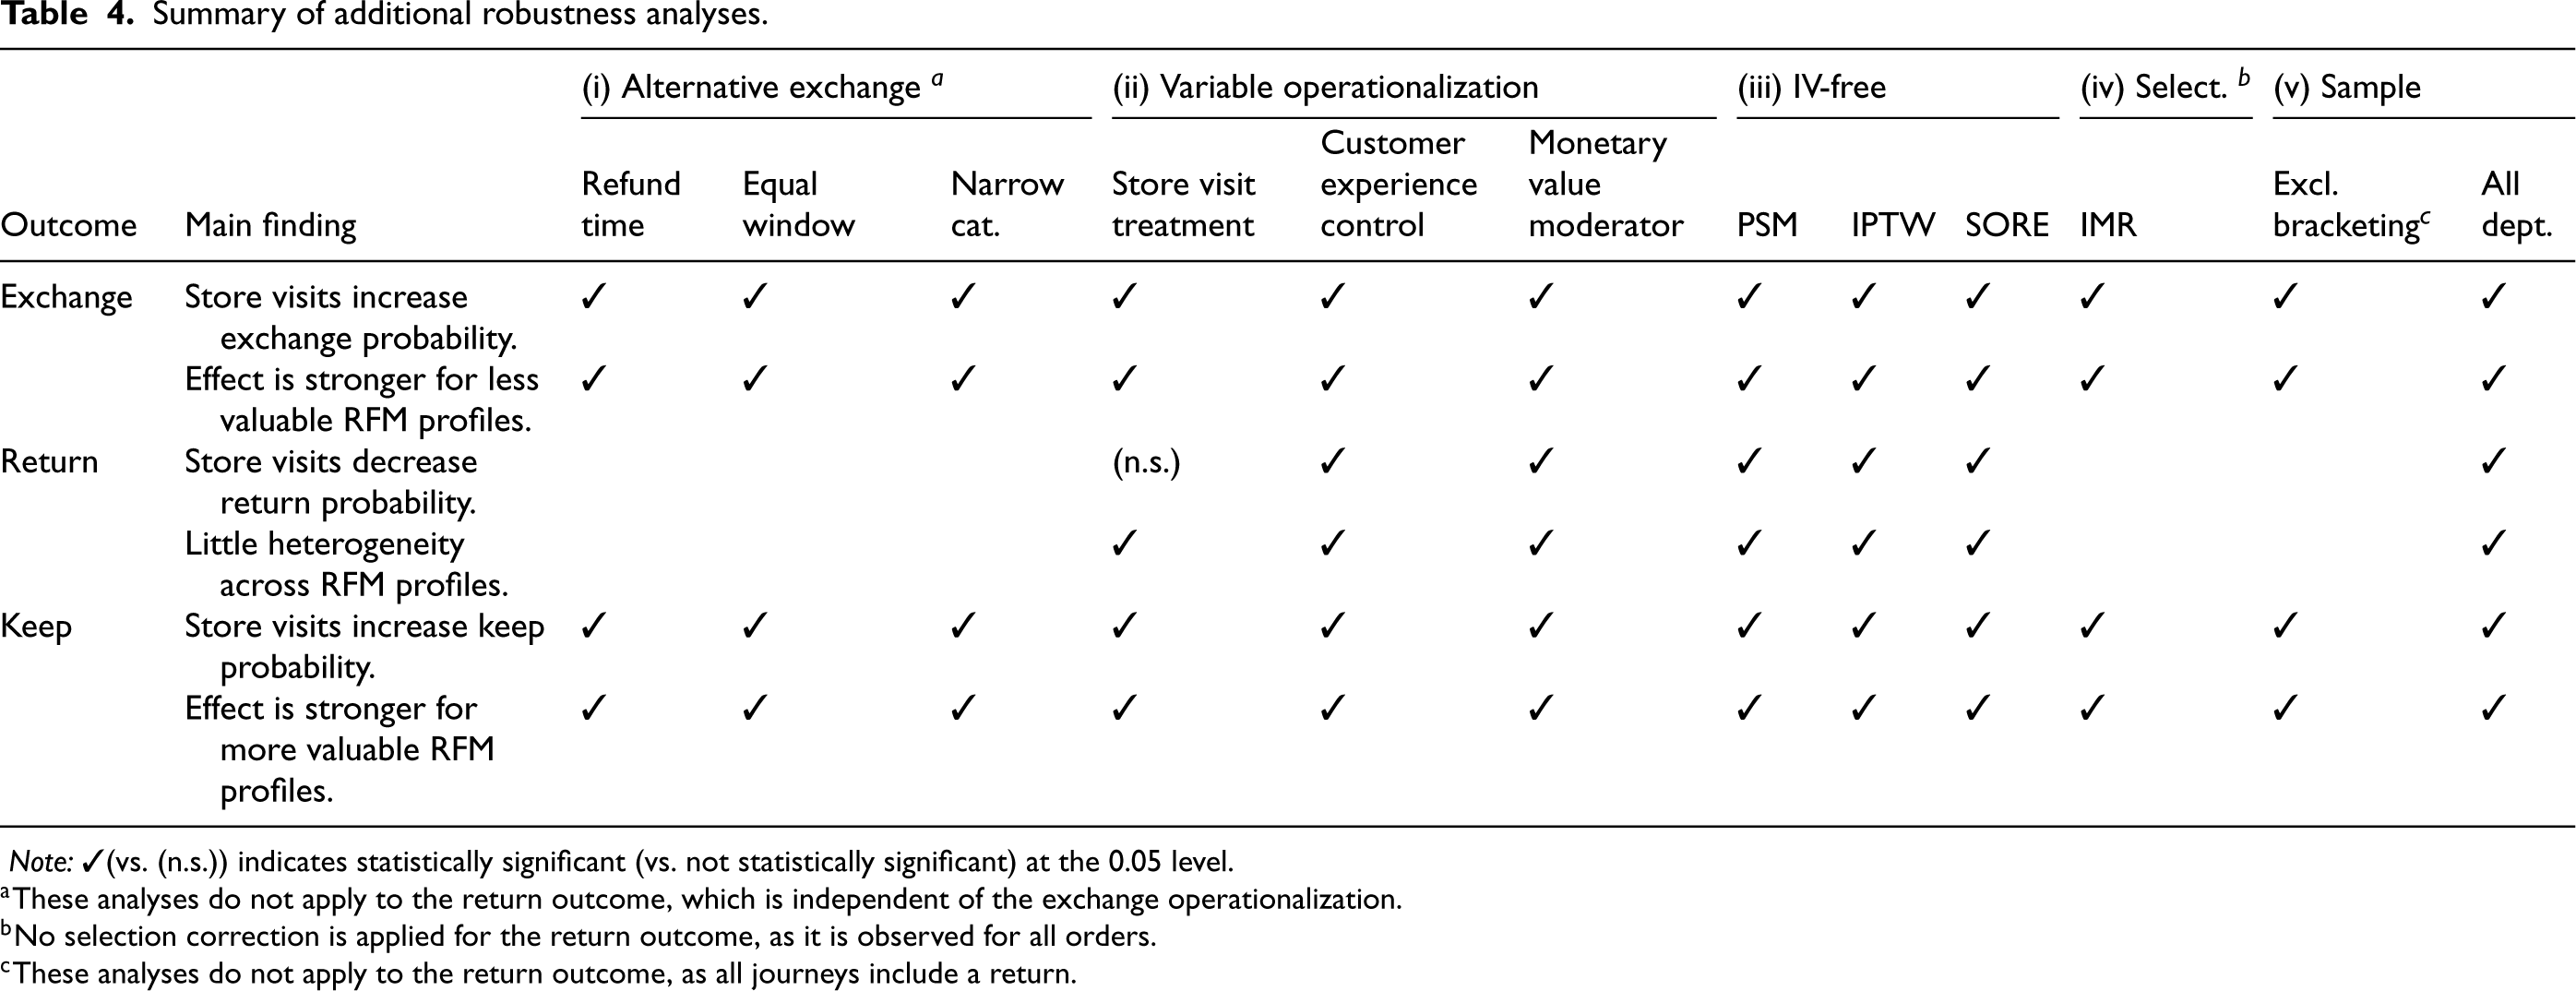
Summary of additional robustness analyses.
Note: ✓(vs. (n.s.)) indicates statistically significant (vs. not statistically significant) at the 0.05 level.
A common view on returns is that they should be avoided (De et al., 2013; Ertekin et al., 2020; Rao et al., 2014). In this study, we focus instead on how retailers can use their omni-channel capabilities to convert returns to exchanges. For consumers, exchanges help them find the right product to satisfy their needs. For retailers, exchanges facilitate retaining revenue from returns. Thus, exchange management is gaining interest in the retail industry (Deloitte, 2019).
To date, research on exchange management has focused on traditional physical stores. Yet, retailers are increasingly adopting omni-channel strategies, enabling consumers to seamlessly switch between the store and online channels for their purchases, returns, and exchanges (Trenz et al., 2020). Recently, Trenz et al. (2020) showed that the benefits of omni-channel integration are most apparent in the post-purchase phase (e.g., for convenience and reduced purchase risk). Our study complements this finding by documenting the benefits of the physical store in encouraging exchanges. This illustrates the immediate revenue opportunities following returns (Ertekin, 2018) via leveraging omni-channel capabilities.
Our research first validates previous insights on the important role of the physical store channel in mitigating the returns of online purchases (Bell et al., 2018, 2020), thereby enhancing operational efficiency. This finding further supports the notion that omni-channel interactions can improve operational and service efficiencies (Bell et al., 2018; Gallino et al., 2017; Zhang et al., 2019b). Beyond reducing returns, our study demonstrates the power of the store for encouraging exchanges once returns have occurred. The positive effects of visiting the store are especially pronounced for low-value customer profiles, suggesting that store visits may be useful for customer development. Incentivizing these customers to visit the store to pick up online purchases or return them may help convert returns into exchanges and hence support the customer relationship. This is less the case for more mature customers, that is, those with high-value profiles, who are less responsive to marketing actions aimed at steering channel choice (Valentini et al., 2011), and, as our results show, for whom store visits are less effective at stimulating exchange purchases. Furthermore, store visits substantially increase the likelihood that customers will keep the exchanged product. Interestingly, this positive effect is stronger for more valuable customers who, given their greater familiarity with the retailer and its assortment, might be more likely to make a better-informed exchange choice. As store visits simultaneously reduce returns and increase exchanges, consumers will find products that better meet their needs, ultimately reducing waste. Finally, by encouraging exchanges, store interactions enhance retailer revenue, offering a new perspective that, at the same time, corroborates previous findings on the importance of physical experiences in the store channel (Bell et al., 2020; Zhang et al., 2019a).
To gauge the magnitude of retained revenue, we compute for each return journey the incremental expected revenue that would be preserved if the journey includes a store visit rather than being completed online. 6 On average, steering a return journey to a store yields €10.78 in retained revenue. In our data, 6.64% of return journeys currently involve a store visit. Increasing this share by 10 (resp. 25) percentage points—through a targeted campaign, for instance—would have retained approximately €49,227 (resp. €123,068) in revenue over the 5-month observation period. Scaled to a full year, assuming stable volume, the implied gain is roughly €118,000 (resp. €295,500). Thus, before accounting for margins and implementation costs, the 25-percentage-point scenario implies that any annual campaign or store-experience investment below €295,500 would break even on a gross retained-revenue basis. Directing less-frequent customers to the store yields €13.83 in retained revenue per journey. Targeting a 10 (resp. 25) percentage-point increase in journeys with a store visit toward these customers therefore raises the implied annual gain to roughly €151,600 (resp. €379,000). Similar patterns emerge for less-recent customers and customers with lower monetary value per order, that is, lower-value customers. In the extreme scenario in which all online return journeys are shifted to a store visit, the estimated annual retained revenue gain is €1,103,000. These indicative calculations underscore that even modest shifts in channel steering or store experience can lead to economically meaningful revenue recovery from returns that would otherwise result in refunds, especially when directed toward the right customers. A final point concerns the mechanism in play. Across our analyses, the store-visit uplift in exchanges seems closely tied to the ability to physically inspect products in the store. When a return brings a customer into contact with a broader, physically present set of plausible substitutes, the probability that they exchange increases. The RFM heterogeneity corroborates this interpretation: the exchange response is strongest among lower-value customer profiles, for whom the store visit is likely to provide the greatest informational gain. These customers have weaker prior relationships with the retailer and less accumulated experience with its assortment, so physical exposure to alternatives can more strongly update their purchase consideration set. This pattern is consistent with multichannel research linking RFM to loyalty and showing that additional channel adoption creates greater value for less loyal customers (Liu et al., 2019; Lobschat et al., 2025). Managerially, revenue recovery therefore hinges on the quality of the assortment encountered at the return touchpoint: directing online returns, especially in broad categories, to larger stores with more alternative products visible and easy to compare. Modest incentives that bring lower-value customers into an assortment-rich setting can therefore do more than recover revenue from the focal return journey; they can also create a learning opportunity that supports longer-term customer development.
Several limitations should be noted. First, our data comes from a single Dutch fashion retailer that operates in a dense store network. As there are only a limited number of stores opening during the observation period, alternative identification strategies based on store openings are infeasible. Second, the data was collected before the pandemic and before recent developments in return policies, such as the increasing use of return fees. Third, our analysis is limited to store visits for pick-ups and returns, as store visits for browsing only are not observed in the transactional data. Relatedly, 81.73% of in-store return-exchange pairs are recorded at the same timestamp, consistent with joint checkout processing; therefore, we cannot identify if customers entered the store with the intention to exchange. 7
In conclusion, retailers can leverage their omni-channel capabilities to promote services enticing online consumers to visit physical stores, facilitating the conversion of returns into exchanges. Given the high return rates of online purchases, such services are expected to substantially reduce return-related losses, potentially becoming pivotal in effective exchange management strategies. Furthermore, prioritizing consumer groups exhibiting the highest responsiveness to omni-channel interactions can enhance the effectiveness of this strategy further, aligning closely with retailers’ objectives. While Valentini et al. (2011) show that new customers are more responsive to marketing actions aimed at driving channel choice, identifying which actions best promote omni-channel services warrants further research. Additionally, future studies could explore how our findings apply across different industries. Products that require deeper inspection may benefit more from physical store interactions, aligning with experiential learning theory (Zhang et al., 2022). Investigating these variations can help tailor omni-channel strategies to enhance consumer learning and satisfaction across various sectors.
Supplemental Material
sj-pdf-1-pao-10.1177_10591478261466844 - Supplemental material for From return to exchange: The value of an omni-channel journey
Supplemental material, sj-pdf-1-pao-10.1177_10591478261466844 for From return to exchange: The value of an omni-channel journey by Somayeh Torkaman, Sarah Gelper, Nevin Mutlu and Tom Van Woensel in Production and Operations Management
Footnotes

Funding
This project received funding from the European Union's Horizon 2020 research and innovation program under the Marie Sk lodowska-Curie grant agreement No. 765395.
Declaration of conflicting interests
The authors declared no potential conflicts of interest with respect to the research, authorship, and/or publication of this article.
Notes
How to cite this article
Torkaman S, Gelper S, Mutlu N, Van Woensel T (2026) From return to exchange: The value of an omni-channel journey. Production and Operations Management x(x): 1–19.
References
Supplementary Material
Please find the following supplemental material available below.
For Open Access articles published under a Creative Commons License, all supplemental material carries the same license as the article it is associated with.
For non-Open Access articles published, all supplemental material carries a non-exclusive license, and permission requests for re-use of supplemental material or any part of supplemental material shall be sent directly to the copyright owner as specified in the copyright notice associated with the article.
