
Abstract
This paper presents an agent-based model to analyse behaviour produced under noisy and deceptive information conditions. A simple yet powerful simulation environment is developed where adaptive agents act and adapt to varying levels of information quality that they sense about their environment. The simulation environment consists of two types of agents moving in a bounded two-dimensional continuous plane: a neuro-evolutionary learning agent that adapts its manoeuvreing strategies to escape a pre-programmed deceptive agent; and a pre-programmed agent, whose goal is to capture the adaptive agent, that acts on noisy information about the adaptive agent’s manoeuvres that it senses from the environment. The pre-programmed agent is also able to produce deceptive actions to confuse the adaptive agent. The behaviour is represented in terms of the manoeuvreing strategies that the agents adopt as their actions to the environmental changes. A behaviour analysis methodology is developed to compare agent actions under different information conditions, that elicits interesting relationships between behaviour and the studied information conditions. The framework is easily extendable to analyse human behaviour in similar environments by replacing the adaptive agent with an interactive human–machine interface.
1 Introduction
The focus of our work is to understand behaviour in an adversarial environment, known as adversarial behaviour. Understanding adversarial behaviour is motivated by the goal to improve the decision-making process especially in competitive real-world situations. The efforts of developing and evaluating the strategies against the emerging threats from an adversarial environment can be widely found in the research related to adversarial learning (Dalvi, Domingos, Mausam, Sanghai, & Verma, 2004; Lowd & Meek, 2005; Barreno, Nelson, Sears, Joseph, & Tygar, 2006; Nelson & Joseph, 2006; Newsome, Karp, & Song, 2006; Veloso & Meira Jr., 2006; Jorgensen, Zhou, & Inge, 2008; Barreno et al., 2008; Nelson et al., 2009; Barreno, Nelson, Joseph, & Tygar, 2010), and also in military operations (Yang, Abbass, & Sarker, 2006; Abbass, 2009; Lauder, 2009; Abbass, Bender, & Whitbread, 2010a, 2010b). In such environments, the state of preparedness can be further improved or optimised if we are able to predict the actions taken by the opponents. However, the state of preparedness is no longer limited to anticipating the preparation efforts against adversarial threats, but also how the efforts affect the environment, the opponents or allies in the environment, and how they, or any action taken on them, affect our objectives in return (Abbass, Bender, Gaidow, & Whitbread, 2011). In this case, the study of adversarial behaviour allows us to anticipate the actions of the opponents, learn about their preferences, and organise our strategies against possible threats and competition from the opponents.
Behaviour, in natural organisms, systems or artificial agents, is commonly associated with their actions or decisions. The type of behaviour or change in behaviour is known to affect actions or decisions (Bargh, Chen, & Burrows, 1996). Conversely, the actions or decisions taken by entities reflect on their behaviour (Vallacher & Wegner, 1987). On the other hand, actions or decisions are taken to achieve certain goals or objectives (Maes, 1990). Furthermore, the goals are usually not set in isolation but are usually a function of the environment in which agents are embedded, through both including other entities in the system as well as including the physical environment itself. In a competitive world the goals may be set in the context of opponents who may have conflicting or even hostile goals. Common examples of such environments include predator–prey systems in nature (Lima, 2002), human decision-making in unknown environments, information warfare (Chaturvedi, Gupta, Mehta, & Yue, 2000) and adversarial learning (Riley & Veloso, 2000).
Many factors affect behaviour, including the quality of information available to agents about their environment when they make their decisions or take actions to achieve goals. Information (or lack of information, also known as uncertainty) can have a major impact on goals and objectives and hence on behaviour, especially in the types of hostile environments referred to above. The effect of information should therefore be a key design consideration when studying behaviour, especially in simulation-based studies of artificial behaviour. The key motivation of our work is thus to study adaptive behaviour under varying levels of information conditions. Specifically, we look at two dimensions of information conditions and their effects on behaviour: noise in the sensory input, and the introduction of purposeful deviation in the output actions, referred to as deception. Our hypothesis is that noise in information and deception in actions are two interdependent concepts. To this effect, we present an artificial agent-based simulation system in this work, in order to elicit the effect of such interdependent information conditions on behaviour, where behaviour is defined as the set of action sequences (strategies) taken by the agents to manoeuvre in the environment to achieve their goals.
The key ingredients of our simulation system include two artificial entities or agents: one with pre-defined action strategies, and the other, one that learns to adapt in the environment using neuro-evolutionary learning controllers. Both agents have set goals of capturing and evading the other agent respectively in a two-dimensional continuous bounded environment. The variation in the quality of information is simulated by controlling a) the level of noise, in terms of frequency and accuracy of information sensed by the pre-programmed agent; and b) the level of deception, in terms of frequency and magnitude of deviation from the desired action taken by the pre-programmed agent.
The neural controller in the adaptive agent is evolved under each of the experimental configurations resulting from different combinations of information-quality conditions. The movements of the evolved adaptive agents are then recorded across a number of simulation runs. The effect of varying the two information conditions on agent behaviour is then analysed across different configurations. The methodology used to analyse agent behaviour is another significant contribution of this work. Several features are extracted from the recorded action sequences and compiled in logical ways in order to see the effect of information conditions on behaviour. The methodology is generic and can be applied to compare behaviour in other environments.
Several researchers in the past have demonstrated the use of neuro-evolutionary controllers to generate complex action sequences, or behaviour, by artificial agents including those acting in hostile environments (Beer & Gallagher, 1992; Gomez & Miikkulainen, 1997). However, few studies look at the effect of noise on agent actions (Floreano & Mondada, 1994; Harvey et al., 2005). To the best of our knowledge, no study has looked at the effect of purposeful deviation (deceptive actions) from goals on agent behaviour. Our experimental setup allows us to study agent behaviour under the effects of both noise and deception.
The rest of this paper is organised as follows. Section 2 provides a detailed description of our proposed agent-based simulation environment, and the agent models used to study the agent behaviour under variable information conditions. Section 3 describes the experimental setup, detailing different configurations as a result of combining different information conditions. Section 4 provides details for the methodology used to analyse the outcomes from experiments. Discussion of the experimental results through the analysis methodology follows in Section 5. Finally, Section 6 presents conclusions and future work.
2 Simulation environment
In this section, we provide a complete description of the proposed agent-based simulation environment. The simulation environment can be considered a kind of game, where two agents with competing goals autonomously move in a two-dimensional world. One simulation run, or one game, consists of a fixed number of time steps, where both agents make equi-distant moves according to their strategies at each time step. A simulation run may also terminate earlier, if the adaptive agent is intercepted by the pre-programmed agent.
2.1 Environment representation
The environment essentially consists of a bounded two-dimensional continuous square plane, in which two agents move with assigned goals, as illustrated in Figure 1. The two agents (described in the sections below) can roam freely in this space without crossing the square boundaries. The simulation runs in discrete time, measured in terms of the number of time steps. The position of an agent in the environment at each time step is determined by its current x- and y-coordinates, where both x- and y-coordinates are bounded in the range
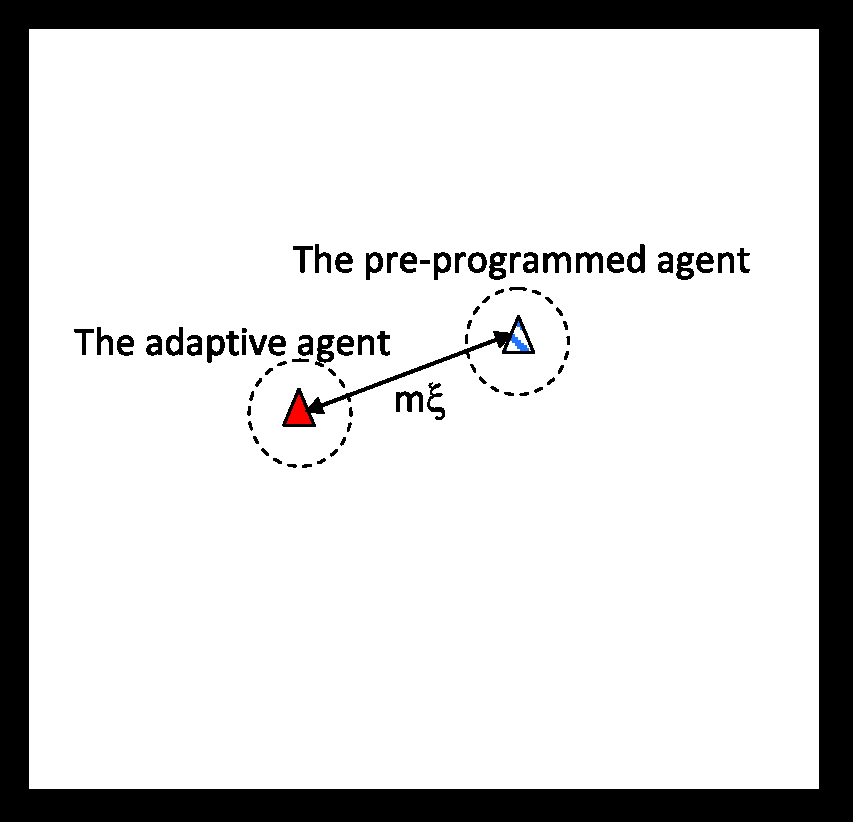
Schematic representation of the initial setup of the pre-programmed and adaptive agents in the game environment.
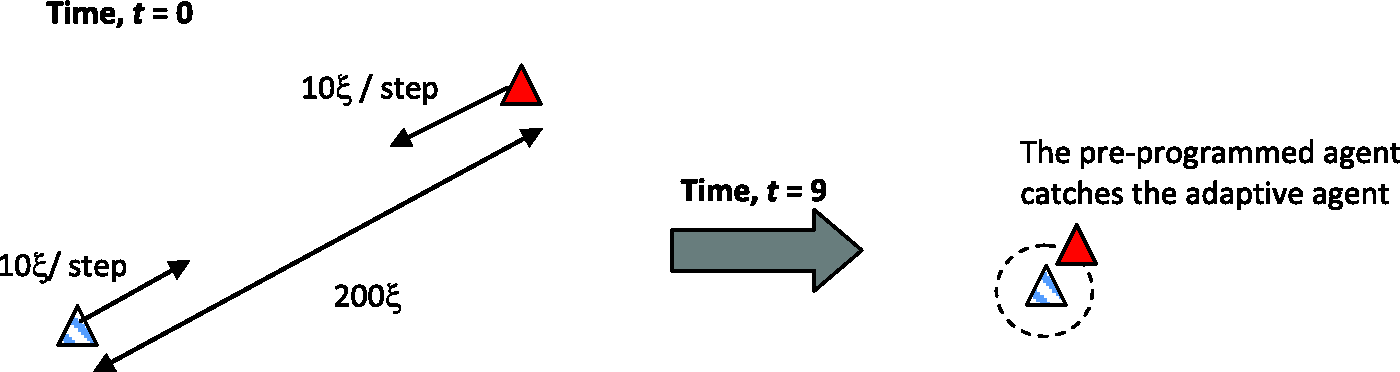
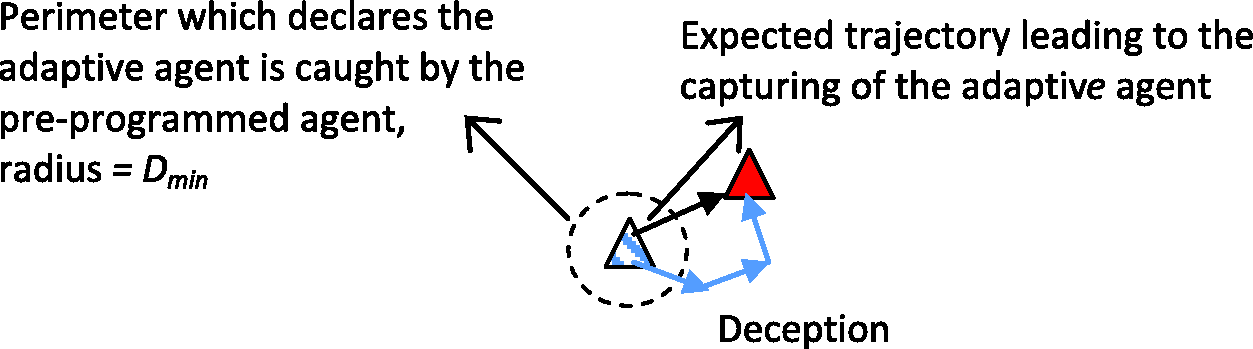
During the simulation, both agents move in the environment with opposing goals. The pre-programmed agent’s goal is to capture the adaptive agent, which adapts its strategies to escape being captured by the other agent. For both agents, their speeds are fixed so that they make equi-distant moves at each time step according to their strategies, λ = 10ξ/step. The adaptive agent is considered to be captured by the pre-programmed agent if the distance between the two agents falls below a minimum separation distance
Each simulation run terminates when the adaptive agent is captured or a fixed number of time steps S elapses, whichever is the earliest.
2.2 The pre-programmed agent representation
The goal of the pre-programmed agent is to capture the adaptive agent as quickly as possible. It follows a fixed strategy to produce its actions (direction of movement in terms of
The second component of the fixed strategy allows the pre-programmed agent to deviate from its policy-based actions in a controlled fashion. That is, the pre-programmed agent produces deceptive actions to confuse the other agent. This is controlled by two parameters:
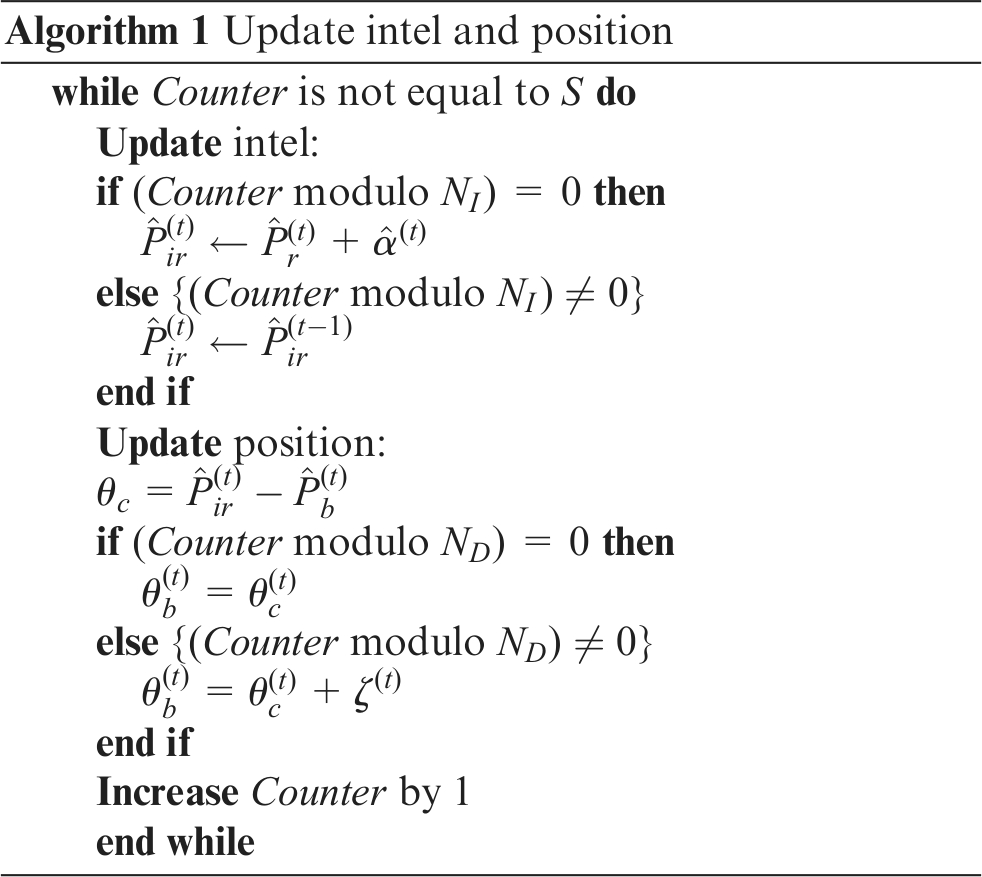
The pseudo-code of the strategy used by the pre-programmed agent is shown in Algorithm 1. The terms used in the algorithm are described below:
Counter: simulation clock.
2.3 The adaptive agent representation
To closely match these design requirements, the adaptive agent in the proposed framework is designed based on the neuro-evolutionary model (Nolfi, Parisi, & Elman, 1994). Using this model, the adaptive agent is represented by a population of back-propagating neural networks.
A genetic algorithm (GA) is used to evolve this population of neural networks, whereby individuals (neural networks) reproduce selectively based on their performance in generating the desired behaviour. It is undeniable that there are other evolutionary techniques which may perform better than GAs. However, the main focus of our work is to understand adversarial behaviour through the simulation. Since we focus on understanding the behavioural simulation rather than optimisation, we do not pay much attention to performing the behavioural simulation with different evolutionary techniques. Instead, we use the evolutionary technique that is commonly used for behavioural simulation, as shown in Nolfi and Floreano (2000).
The goal of the adaptive agent in our simulation environment is to escape capture by the pre-programmed agent. Rationally, this can be achieved by always producing an action using a repulsive strategy, opposite to the pre-programmed agent’s attraction strategy. However, in our setup the adaptive agent learns a strategy through a neuro-evolutionary process that always produces an angle, Δθ
mr
, relative to the actual repulsion angle,
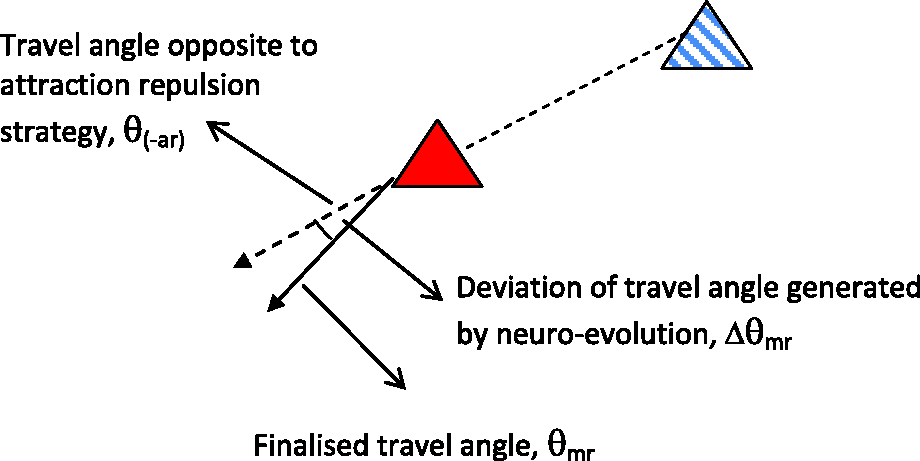
Generation of travel angle for the adaptive agent.
In the subsections below we provide further description of the agent design.
2.3.1 Network architecture
A fixed and identical architecture is used to represent individual neural networks in the evolutionary framework. Each neural network consists of a multi-layer perceptron of sigmoid units with a back-propagation algorithm. The learning rate for the network, η, is set to 0.2, and the momentum rate, γ, is set to 0. Each connection weight of the neural network ranges in the interval
To further elaborate, the networks consist of IN input, HN hidden and ON output neurons. The architecture is depicted in Figure 3 where
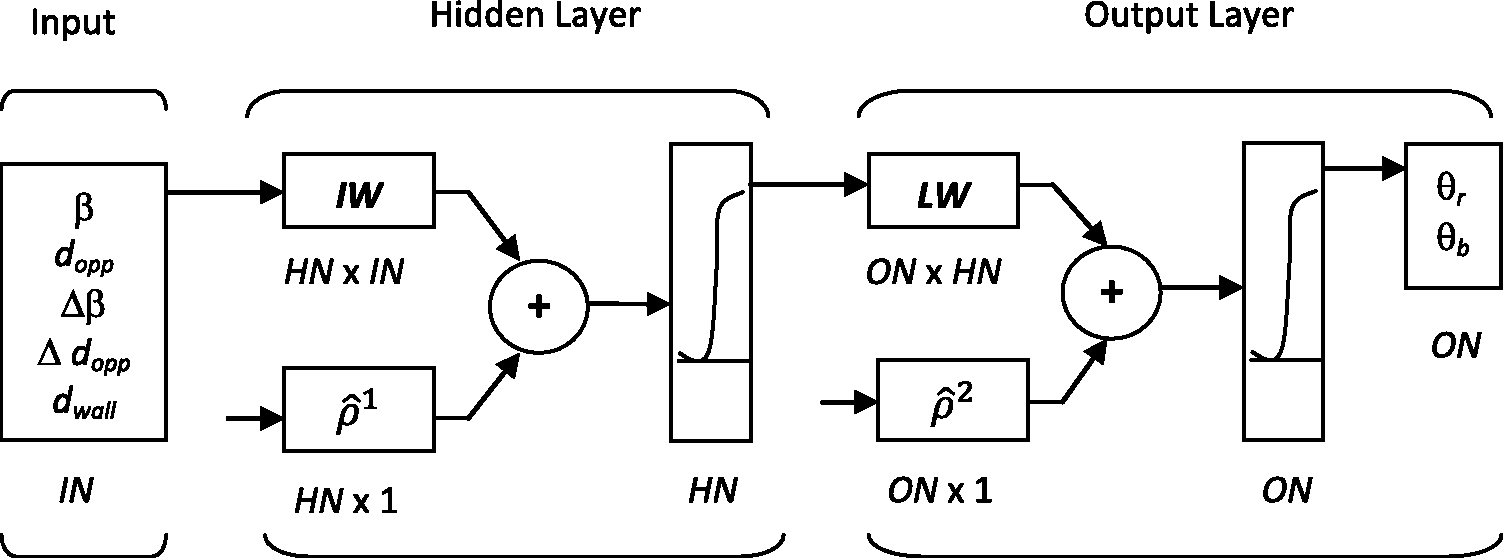
Selection of maximum values of the uniform distribution for the generation of
In the experiments, the values of IN, HN and ON are 5, 7 and 2 neurons respectively. The number of input and output neurons are determined in a quite straightforward way, as they are based on the numbers of input and output variables respectively. On the other hand, the numbers of hidden neurons is determined arbitrarily based on the fact that we need a small network size which requires less processing time. Then, GA is used to evolve the connection weights of the networks. It is found that the neural networks with evolved initial connection weights learn faster and better compared with those of initial random connection weights (Nolfi & Floreano, 2000).
Each neural network in the population is evaluated iteratively for a number of simulation runs. At each time step in a simulation run, an individual neural network senses
Input variables: – – – – – –
Decision variables: – –
At this point, the planned travel angle of the adaptive agent,
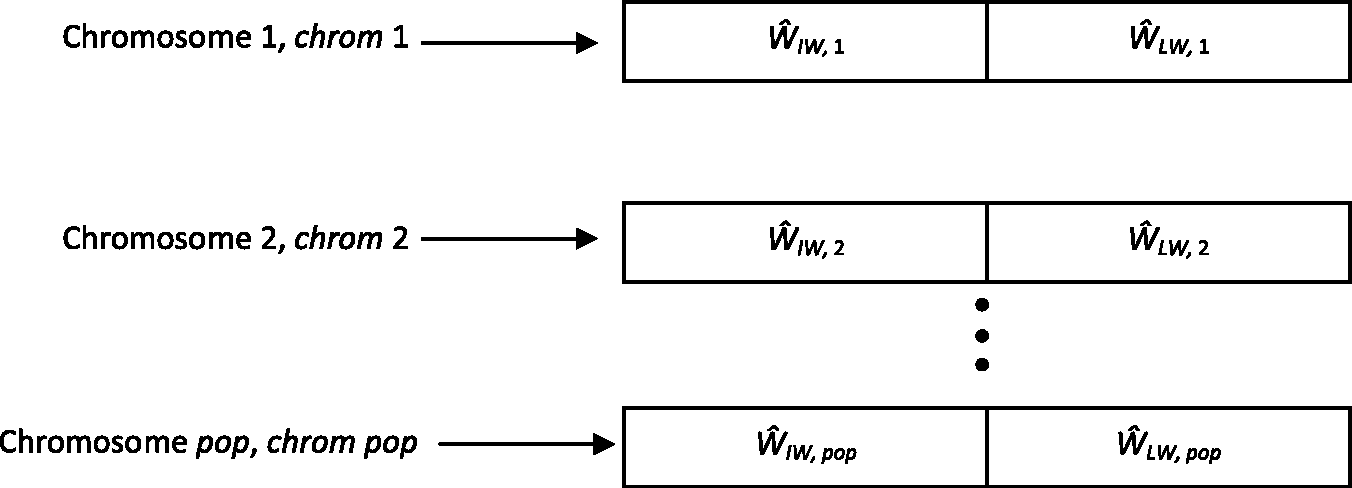
2.3.2 Genetic algorithm
Given that the architecture of the neural network is fixed,
Weights for the fixed architecture neural network in chromosome representation.
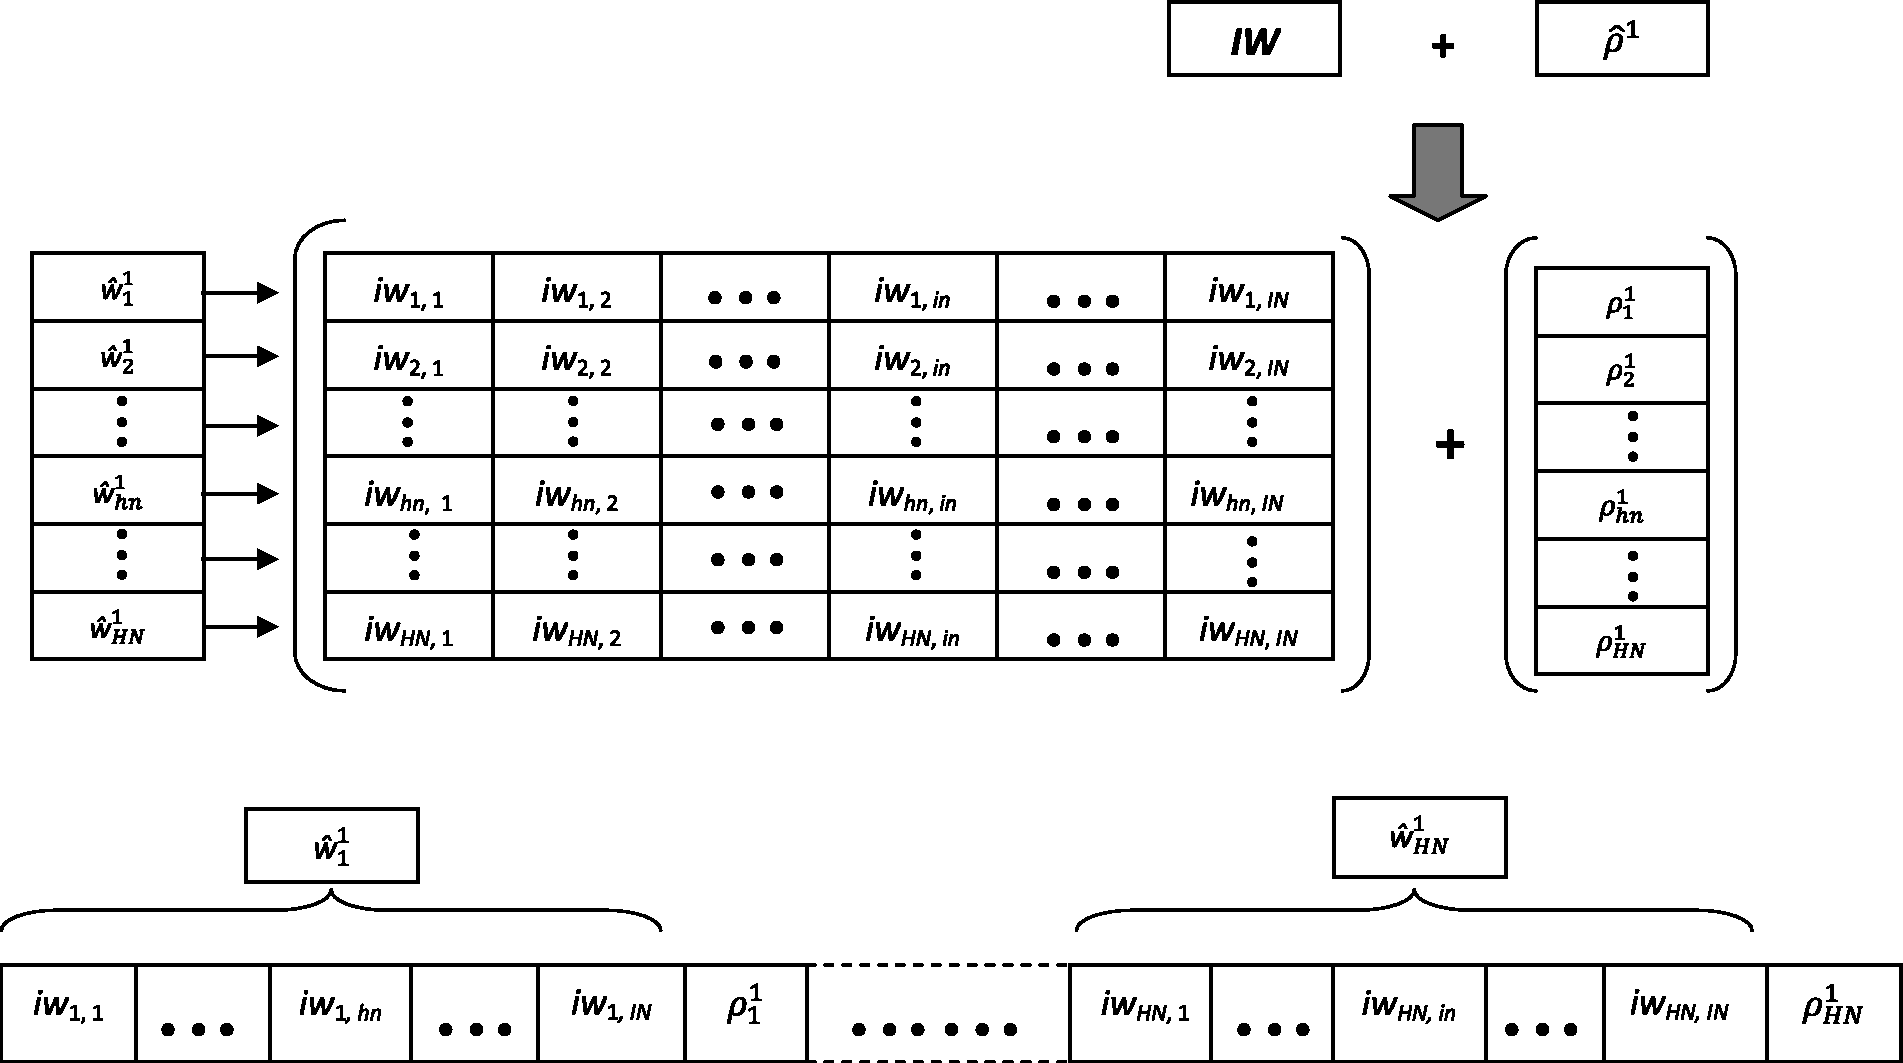
Mapping of the connection weights and bias units for both input-hidden layers.
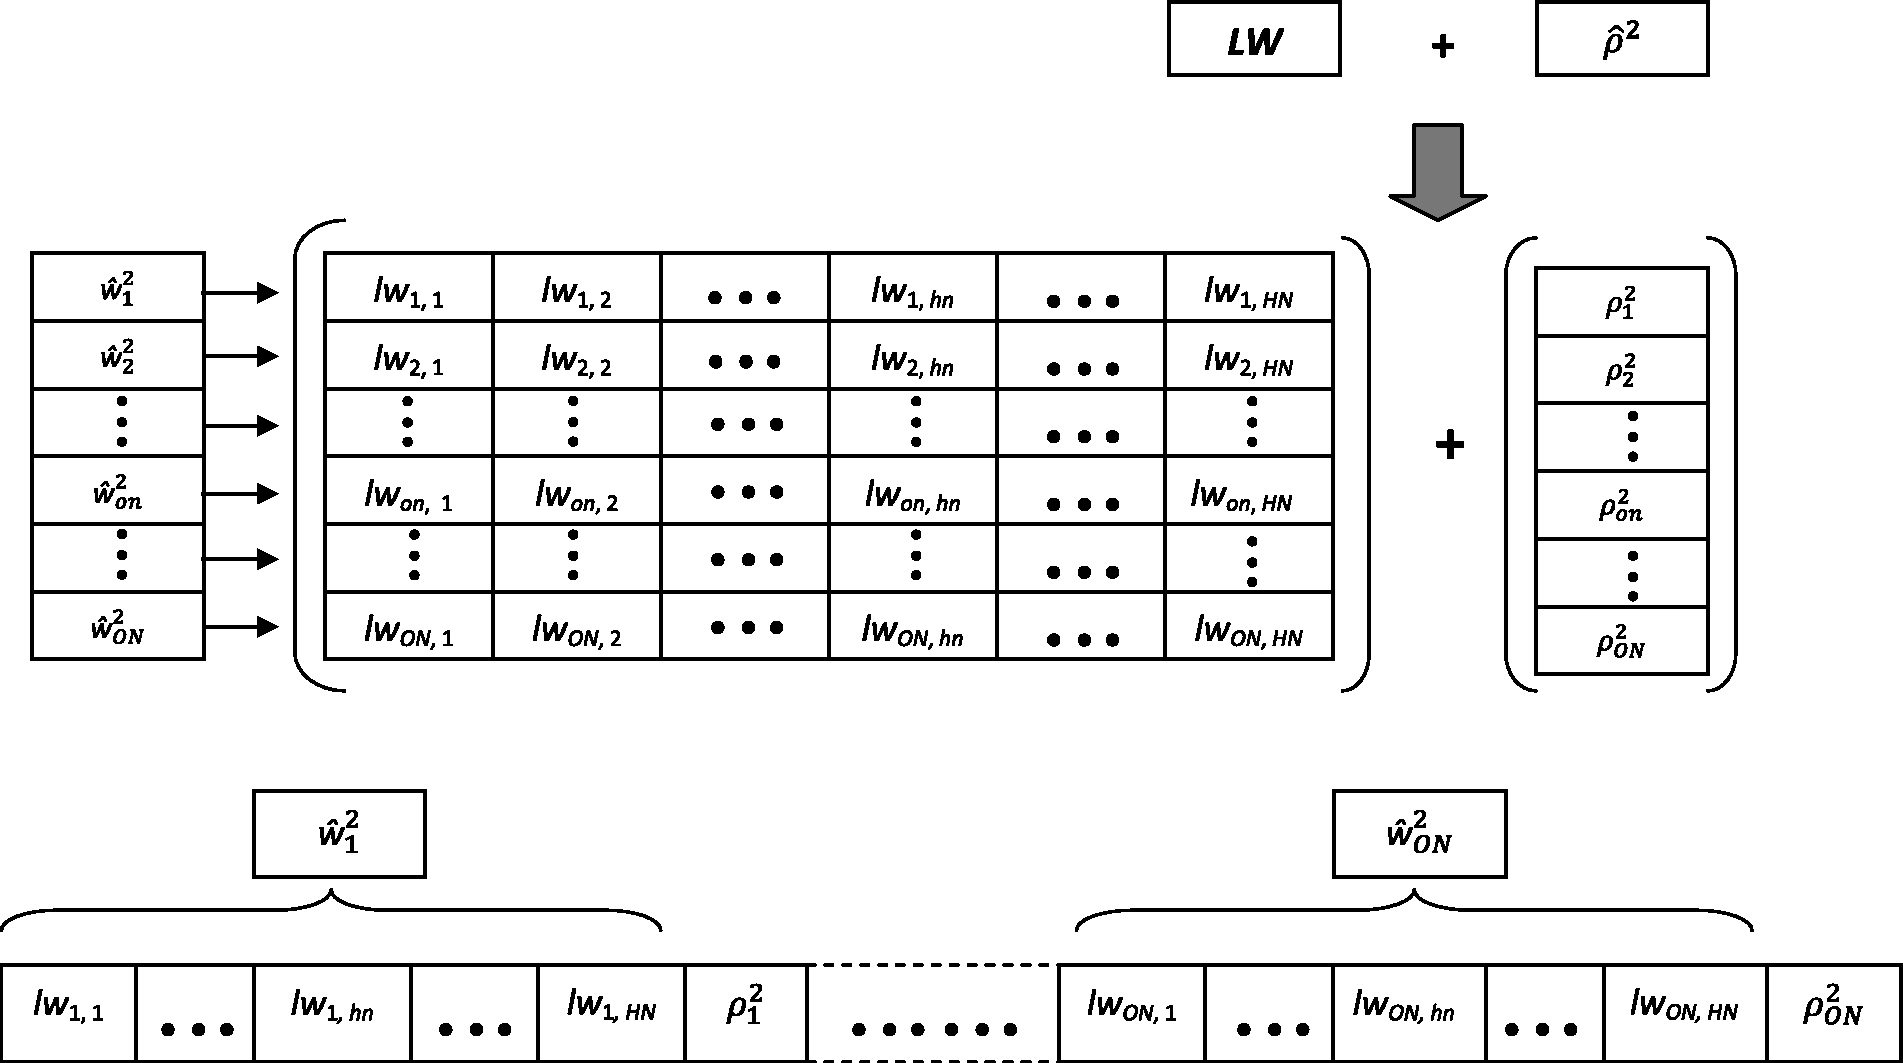
Mapping of the connection weights and bias units for both hidden-output layers.
The GA begins with a fixed size,
2.3.3 Fitness function
The goal of the adaptive agent is to avoid being captured for as long as possible. In other words, the longer an agent can survive, the fitter it is in the evolutionary setup. Obviously, the best agent (or neural network) setup is the one that can survive through an entire simulation run without being captured.
The fitness function is determined by taking into consideration how humans would develop their behaviour in a partially unknown and unpredictable environment, which is through the interaction between innate knowledge and learning. Instead of focusing on how an agent should perform a task, such as maximising the separation distance, the fitness function is evaluated based on whether the agent succeeds in performing the task or not. As the fitness function does not explicitly show how to perform the task, the agent is able to develop some useful behaviour rather than learning a particular behaviour derived in advance by the experimenter. In other words, we would like the fitness function to be loosely defined so that the design of the fitness function will be behaviour-implicit (Nolfi & Floreano, 2000), whereby the function is rated based on behavioural outcome of an evolutionary network and relies on a few variables and constraints only. Therefore, the fitness function thus is simply proportional to the average number of time steps an agent survived over a number of simulation runs. The fitness function is defined as follows:


where
3 Experimental setup
The primary objective of this research is to study behaviour under varying conditions of quality of information. This is achieved by monitoring the manoeuvreing strategies (behaviour) of an adaptive agent, evolved through a neuro-evolutionary process, in a simulated environment against a pre-programmed agent that follows a fixed rule-based strategy and operates under variable information-quality conditions. As explained in Section 2.1, there are two dimensions across which the information quality is varied: the accuracy and frequency of location information available to the pre-programmed agent about the adaptive agent, and the range of deceptive actions that the pre-programmed agent may produce based on its perception of the adaptive agent’s position in the environment. Parameters
Tables 1 and 2 show the different combinations of these parameters that we used in our experiments to simulate varying levels of information quality and deception respectively.
The combinations of
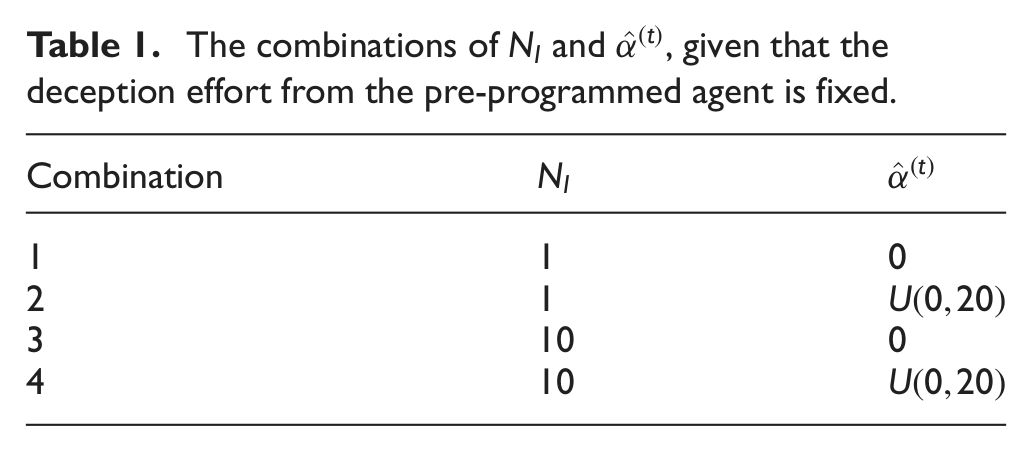
The combinations of
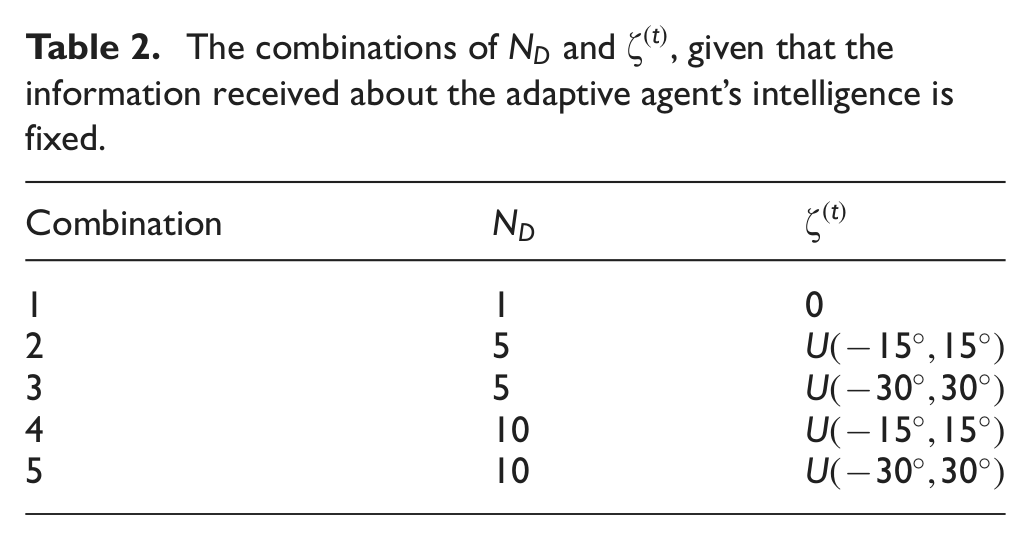
The value
Selection of maximum values for NI.
Similarly, the first combination in Table 2 represents the scenario where the pre-programmed agent always moves in the direction it expects the other agent to be,
Selection of maximum values of the uniform distribution for the generation of
Based on the four combinations given in Table 1 and the five combinations given in Table 2, 20 different experimental configurations are obtained, each representing different conditions of information quality. Since the neuro-evolutionary model for the adaptive agent is a stochastic model, experiments were repeated with 30 independent random seeds for each of the experimental configurations discussed above.
4 Behaviour analysis methodology
One of the key motivations of this work is to describe and simulate behaviour in silico. Research on behavioural decision theory (Einhorn & Hogarth, 1981) has shown the conditional nature of human decision-making and its dependence on the constraints under which the decisions are made. Decisions that might sound optimal under some given circumstances may not be optimal in a different environment and time. This implies that changes in the environment affect decision-making, or in other words, behaviour, and are reflected in the actions taken. In our simulation environment, constraints are represented by the environmental boundaries and the limited actions that the agents can perform in the environment. The variation in the quality of information under which agents decide their moves, on the other hand, represent changes in the environmental conditions under which decisions are made. The agent behaviour, specifically the adaptive agent behaviour, is then derived from the manoeuvreing strategies or sequence of actions that the agent takes in the simulated environment in response to a pre-programmed agent operating under varying information-quality conditions. While a co-evolutionary setup could easily be adopted, behaviour analysis under fixed conditions allows us to simplify the analysis and focus on our main research questions, in other words, the effect of different information conditions on adaptive behaviour.
Since the primary focus of this research is to study adaptive agent behaviour under different information-quality conditions, the analysis methodology should be able to compare behaviours under these different environmental conditions to show similarities or differences in the behaviour. This obviously requires defining features and measures against which the behaviour can be compared. In the following sections, we discuss the analysis techniques used to elicit the effect of different information conditions on adaptive agent behaviour. The analysis techniques are based on the features extracted from the action sequences (or behaviour) of the agents recorded during the simulation runs.
4.1 Capture-time analysis
The most obvious feature to analyse is the capture time, which refers to the number of time steps taken by the pre-programmed agent to capture the adaptive agent. This is analysed by plotting the best and average capture times (of 30 independent runs) over the number of generations for each of the experimental configurations discussed in Section 3. In particular, five graphs are plotted, each showing the results for an experimental setup with one of the five deception levels given in Table 2; and the capture times are plotted for four noise-level combinations given in Table 1. That is, each graph reflects the results of a setup where the deception level is fixed and the noise level is varied. What we expect to see is a trend in the adaptive agent’s learning behaviour over time, and variation of this trend across varying combinations of the informational conditions discussed above.
4.2 Trajectory visualisation
In trajectory visualisation, agents’ action sequences (that is, their actual movements) are plotted in the two-dimensional simulation environment. Due to limited space, trajectories from a single simulation run in the last generation, chosen arbitrarily based on the interestingness of evolved patterns, are plotted for each of the 20 experimental configurations. As is said, a picture is worth a thousand words: these figures reveal different movement patterns displayed by agent actions.
4.3 Action sequence analysis: action frequency distribution
Due to the cognitive load of a visual analysis, which would require an analyst to view thousands of trajectories and make sense of them, other means are needed to analyse action sequences. The intent of frequency analysis of actions is to capture the essence of the type of strategy adopted by the adaptive agents overall, relative to the strategies used by the pre-programmed agent, across a number of simulation runs. This is done by conducting a statistical analysis of the relative-heading-change feature, recorded as the difference between the two agents’ travel angles at each time step. This approach can neatly summarise the manoeuvreing strategies adopted by the agents. For instance, a predominantly zero heading-change strategy (strictly, a single peak on the frequency diagram) might indicate a straight-line motion, a two-spiked frequency pattern might indicate a zig-zag motion and a uniformly distributed heading change might indicate a circular motion. Other strategies will sit somewhere in between these extreme monotonous strategies.
For each of the 20 experimental configuration setups discussed in Section 3, the best individual (neural network) in the final population evolved over 200 generations is selected to perform the frequency diagram analysis. The best evolved adaptive agents play another
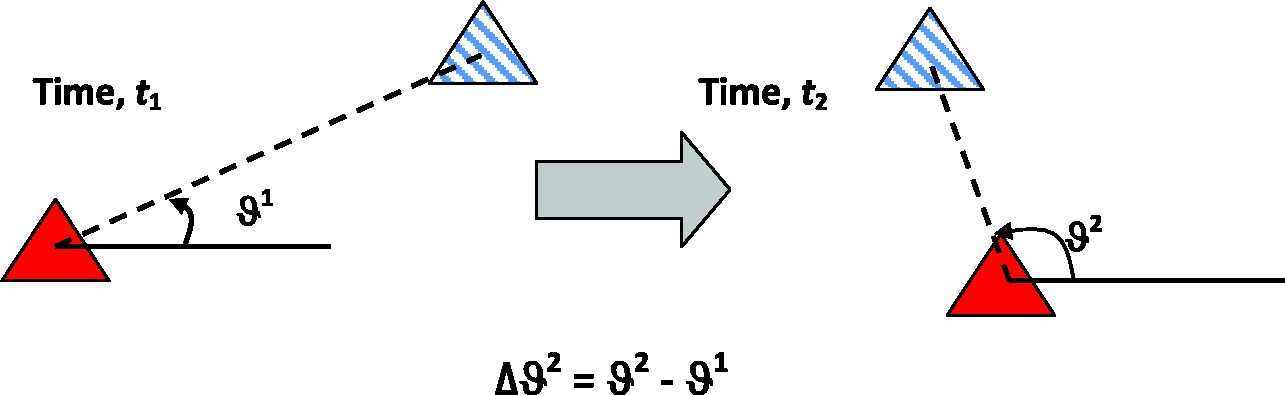
Calculation for the travel angle change,
4.4 Action sequence analysis: sub-sequence similarity analysis
While the heading-change feature used in the frequency analysis provides a handle to analyse agent strategies at every time step, the action sub-sequence analysis captures the movement patterns on a larger time scale and allows the comparison of strategies or behaviour on a much higher level of abstraction. Similar to frequency analysis, the best individual from the final generation is chosen for this analysis from each of the 20 different experimental configurations. Since the analysis is carried out for 10 simulation runs with 30 different seeds, a total of
The sub-sequences are extracted by dividing the action sequences obtained from each simulation run into an equal number of windows (Figure 10 demonstrates this concept pictorially). Since each simulation run can last a different number of time steps, the number of sub-sequences
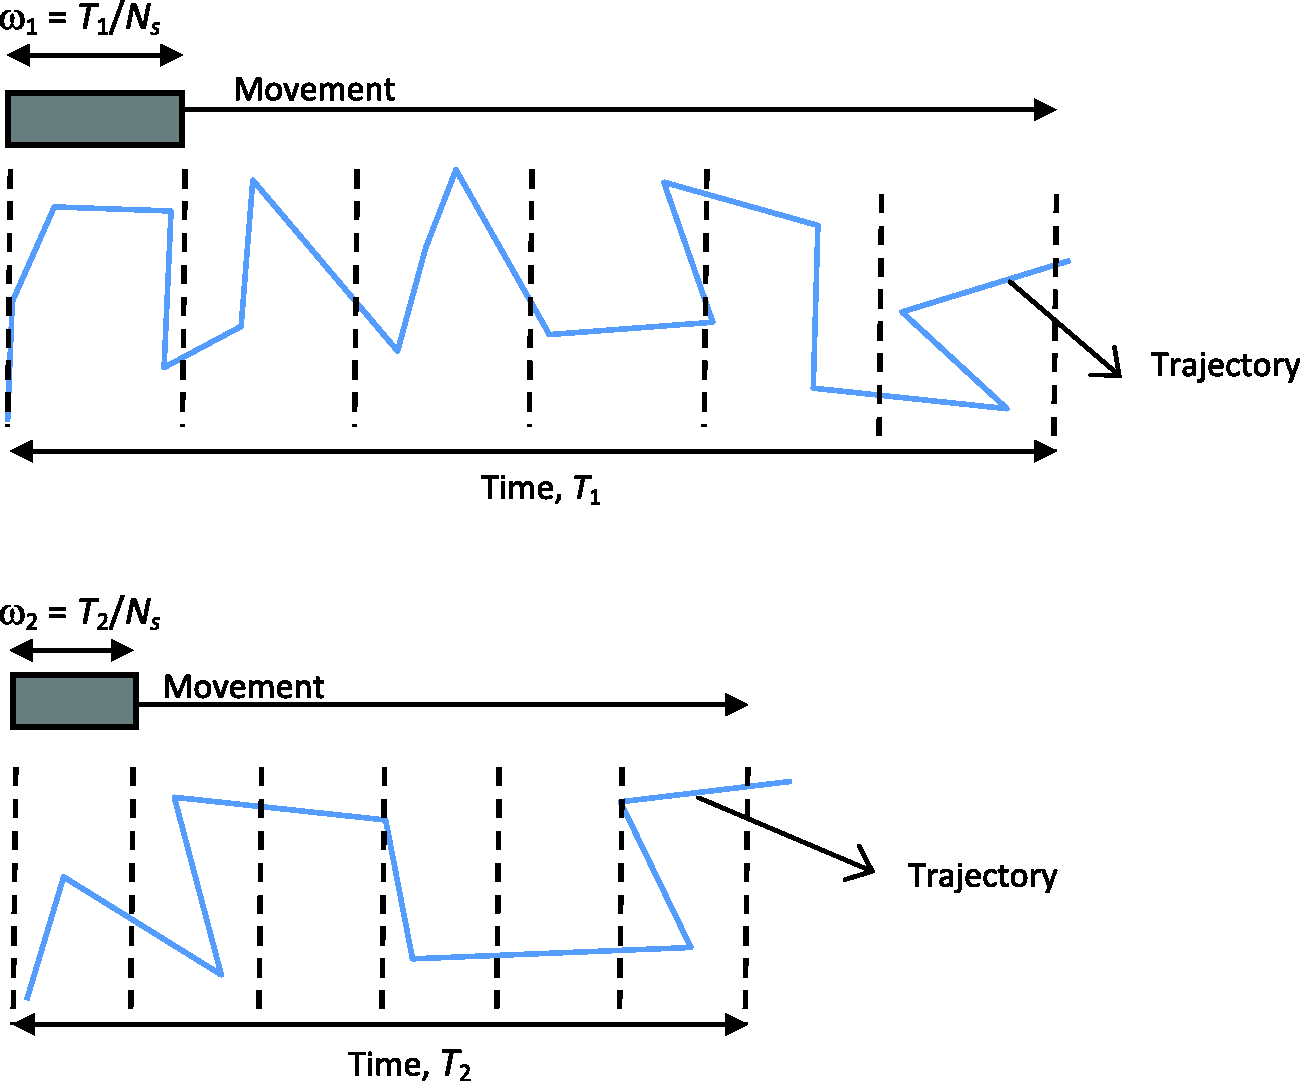
Two example action sequences divided into an equal number of sub-sequences. Each action sequence has a different length (referred as
Next, the two features velocity and acceleration are computed, corresponding to the rate of change in the position of the adaptive agents over the entire vector of sub-sequences. Formally, their relationships are given by equations (3) and (4) respectively. Here


Then, the relative direction movements between the adaptive agent


Using this method, the actual trajectories of agents are mapped to a feature space with an
Finally, the similarities between behaviours defined in terms of the feature space discussed above are analysed using a fuzzy c-mean (FCM) clustering technique. Clustering is an unsupervised data-mining technique that categorises a set of instances into several groups which share higher similarities within the clusters but lower similarities between the clusters. Unlike the popular k-means method that clusters instances into unique clusters, FCM allows the instances to belong to several clusters simultaneously with different degrees of membership in each cluster (Bezdek, 1981). We consider this to be a better technique for this analysis, owing to the complexity of the actions produced by the agents.
Two fundamental issues that need to be addressed in clustering analysis are to determine the appropriate cluster size (the number of clusters) and the quality of the formed clusters. Cluster-validity analysis (Maulik & Bandyopadhyay, 2002; Vendramin, Campello, & Hruschka, 2009) is used in our work to address these two issues when clustering agent sequences.
Cluster-validity analysis is the assessment of a clustering process’s output. It usually involves a specific criterion of optimality. There are three main categories of validity indices: external assessment, internal assessment and relative test. An external assessment compares the discovered structure with respect to an external criterion that quantifies the degree of compatibility between the discovered clusters and the actual ones. For example, the use of data labels to evaluate clustering performance is an example of external assessment. On the other hand, an internal assessment determines intrinsically whether the discovered structure is appropriate for the data without any prior information. Lastly, a relative test compares two structures and measures the relative indices between them. In our work, cluster validity based on internal assessment is used, because there is no label involved in our data. Before a clustering process is performed, cluster validity is used to determine the appropriate value from an interested range of cluster sizes. To perform the analysis, four well-known validity indices, namely the Silhoutte index (Rousseeuw, 1987), the Davies–Bouldin index (Davies & Bouldin, 1979), the Calinski–Harabasz index (Caliáski & Harabasz, 1974) and the Dunn index (Dunn, 1974), are selected for the assessment because they evaluate the discovered structure according to their appropriateness of data such as cluster separation and compactness. Since there is no `gold standard’ for selecting cluster-validity indices, we use all four indices as an ensemble to determine an appropriate cluster size.
In a nutshell, the sub-sequence clustering analysis consists of dividing action sequences across different simulation runs into equal numbers of sub-sequences, computing velocity and acceleration feature vectors for each of these sub-sequences, and measuring the similarity between behaviours (action sequences) using a FCM unsupervised clustering technique.
5 Results and analysis
In this section we show and discuss the results of the experiments run under the various experimental configurations discussed in Section 3. For ease of discussion, Table 3 gives labels to the different noise and deception levels used in the experimental configurations. The results are arranged in the subsections below according to the four types of analysis techniques (see Section 4) that are used to assimilate the findings from the experimental results.
Labelling of noise and deception levels for a descriptive narrative.
5.1 Capture/survival time
Referring to the capture-time analysis discussed in Section 4.1, Figure 11 shows the average capture times (averaged over 30 runs) for different combinations of noise levels in the sensed information by the pre-programmed agent. Each sub-figure refers to an experimental setup with a different combination of deception and noise levels.
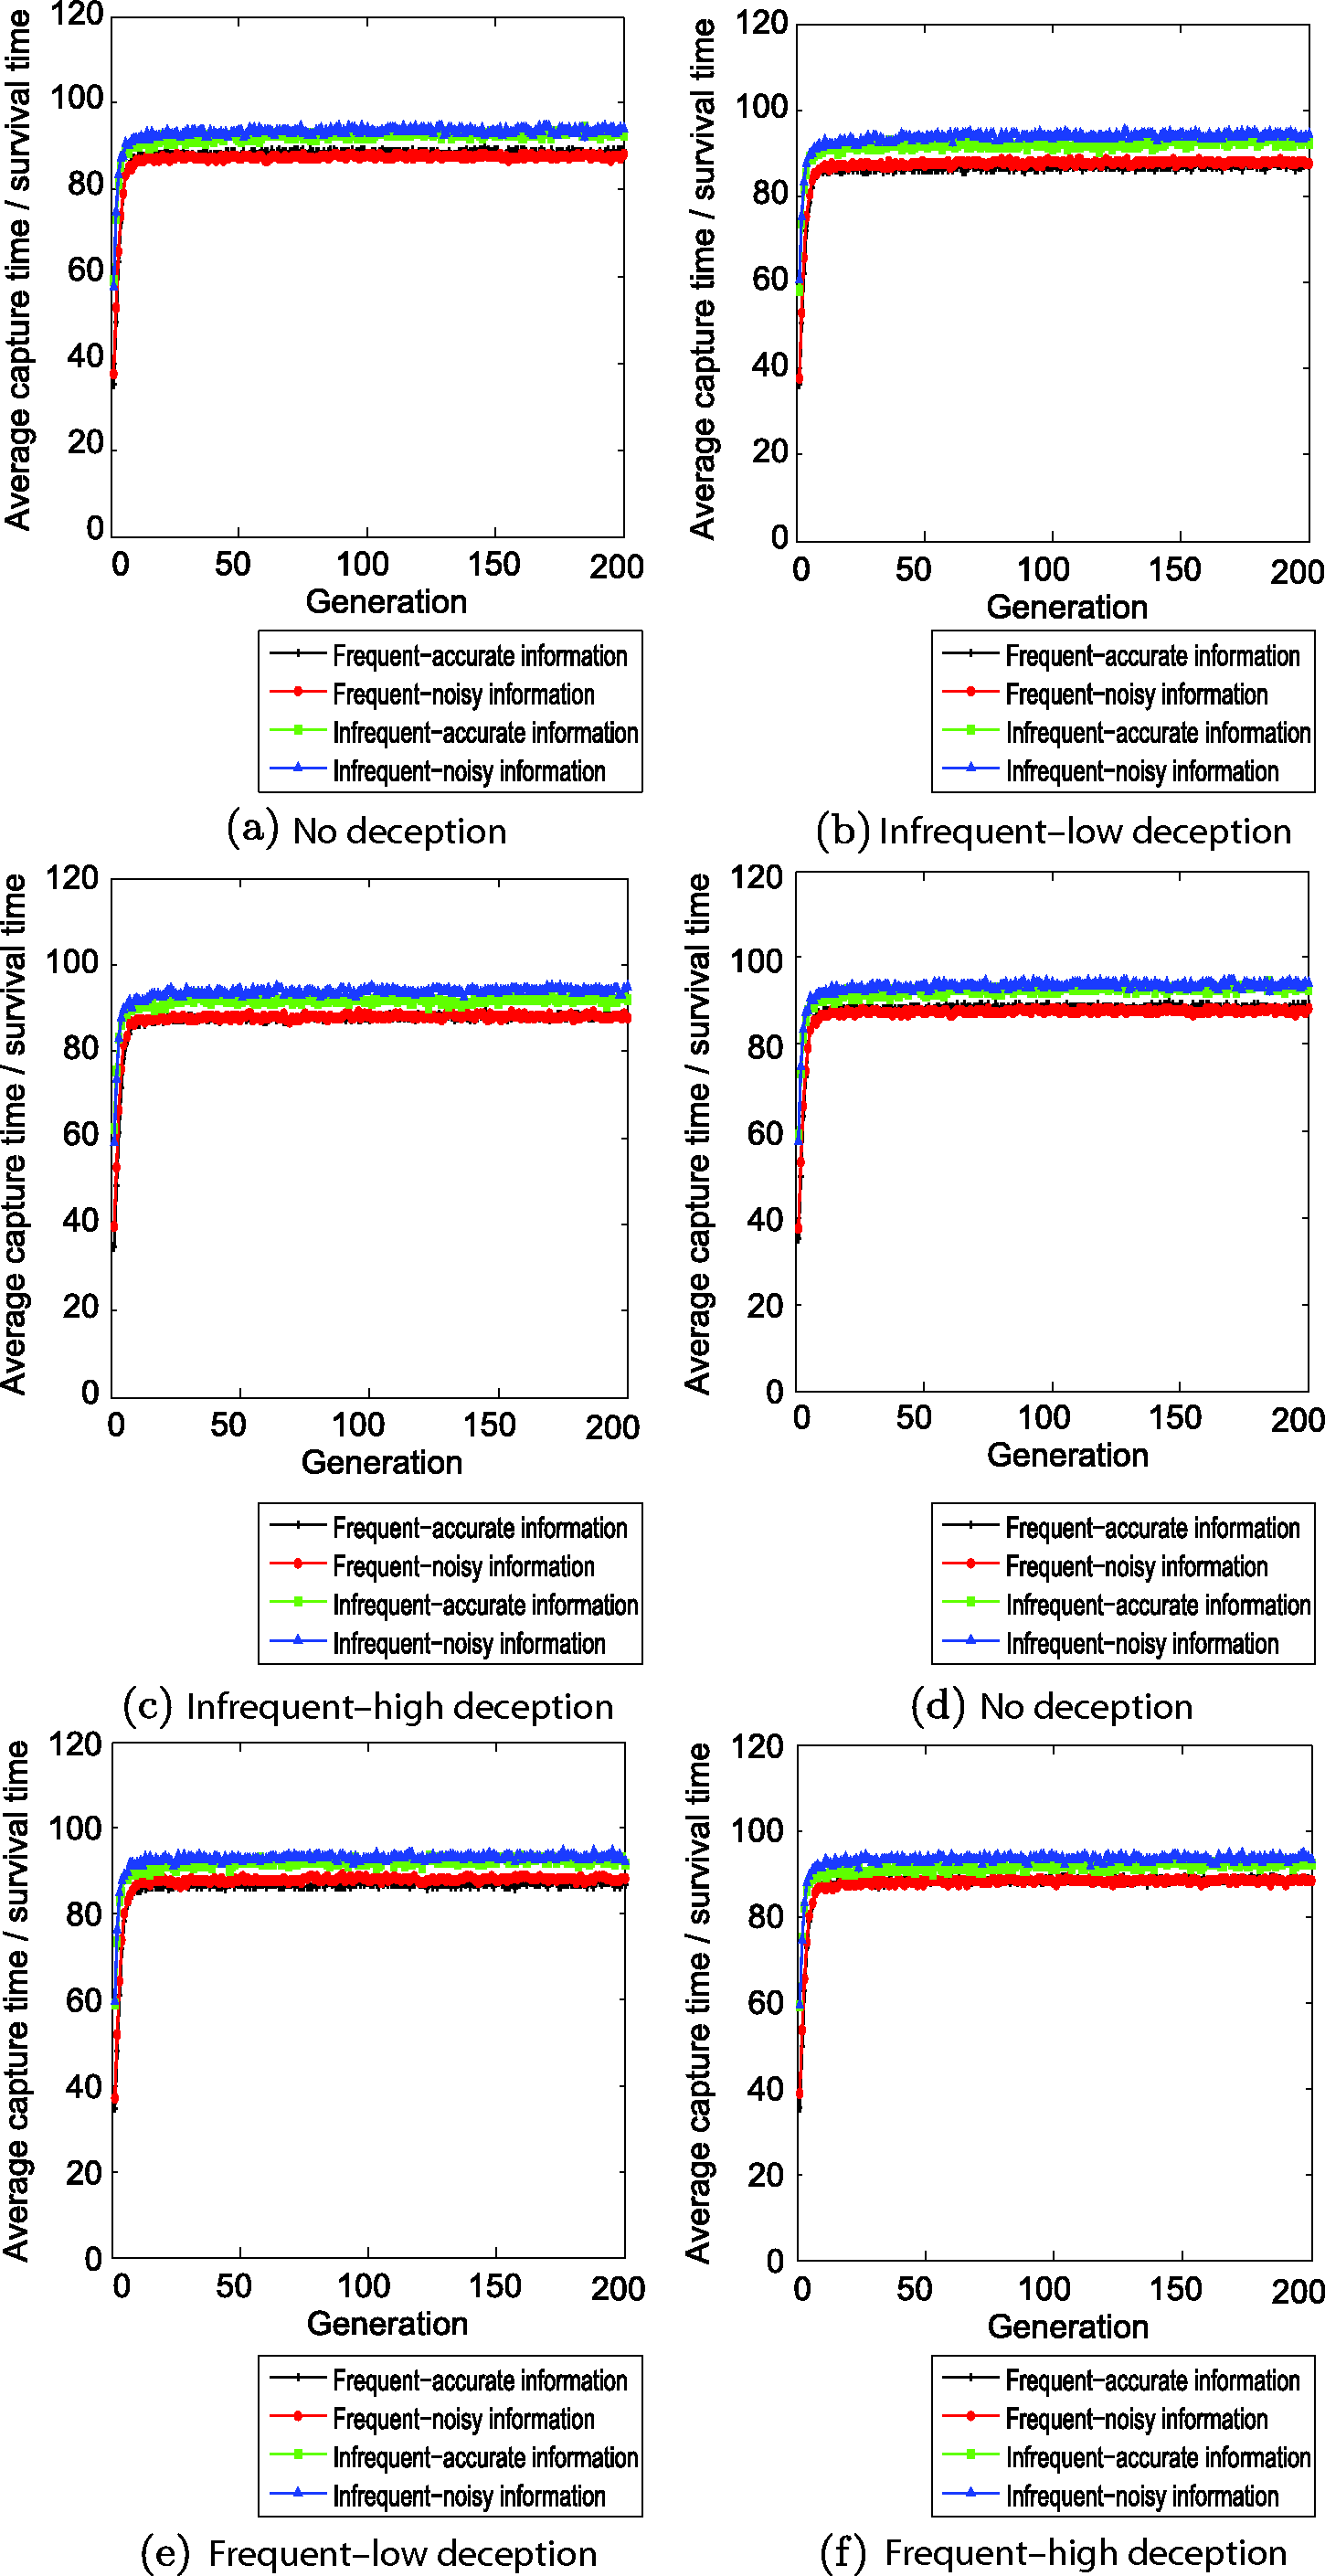
The plots of average capture/survival time. Each sub-figure shows the average capture time over the number of generations for one of the combinations of
By setting the deception frequency as low and high, the rows of Figures 11(a)–11(c) and Figures 11(d)–11(f) respectively show the average capture time with the increase of the degree of deception. These graphs can be read from two perspectives: from the adaptive agent’s perspective the plots refer to survival time, the average number of time steps the agent survived without being captured by the pre-programmed agent; from the pre-programmed agent’s perspective they refer to capture time, the average number of time steps taken to capture the adaptive agent. Figure 12 depicts a zoomed-in version of the last 50 generations in Figure 11.
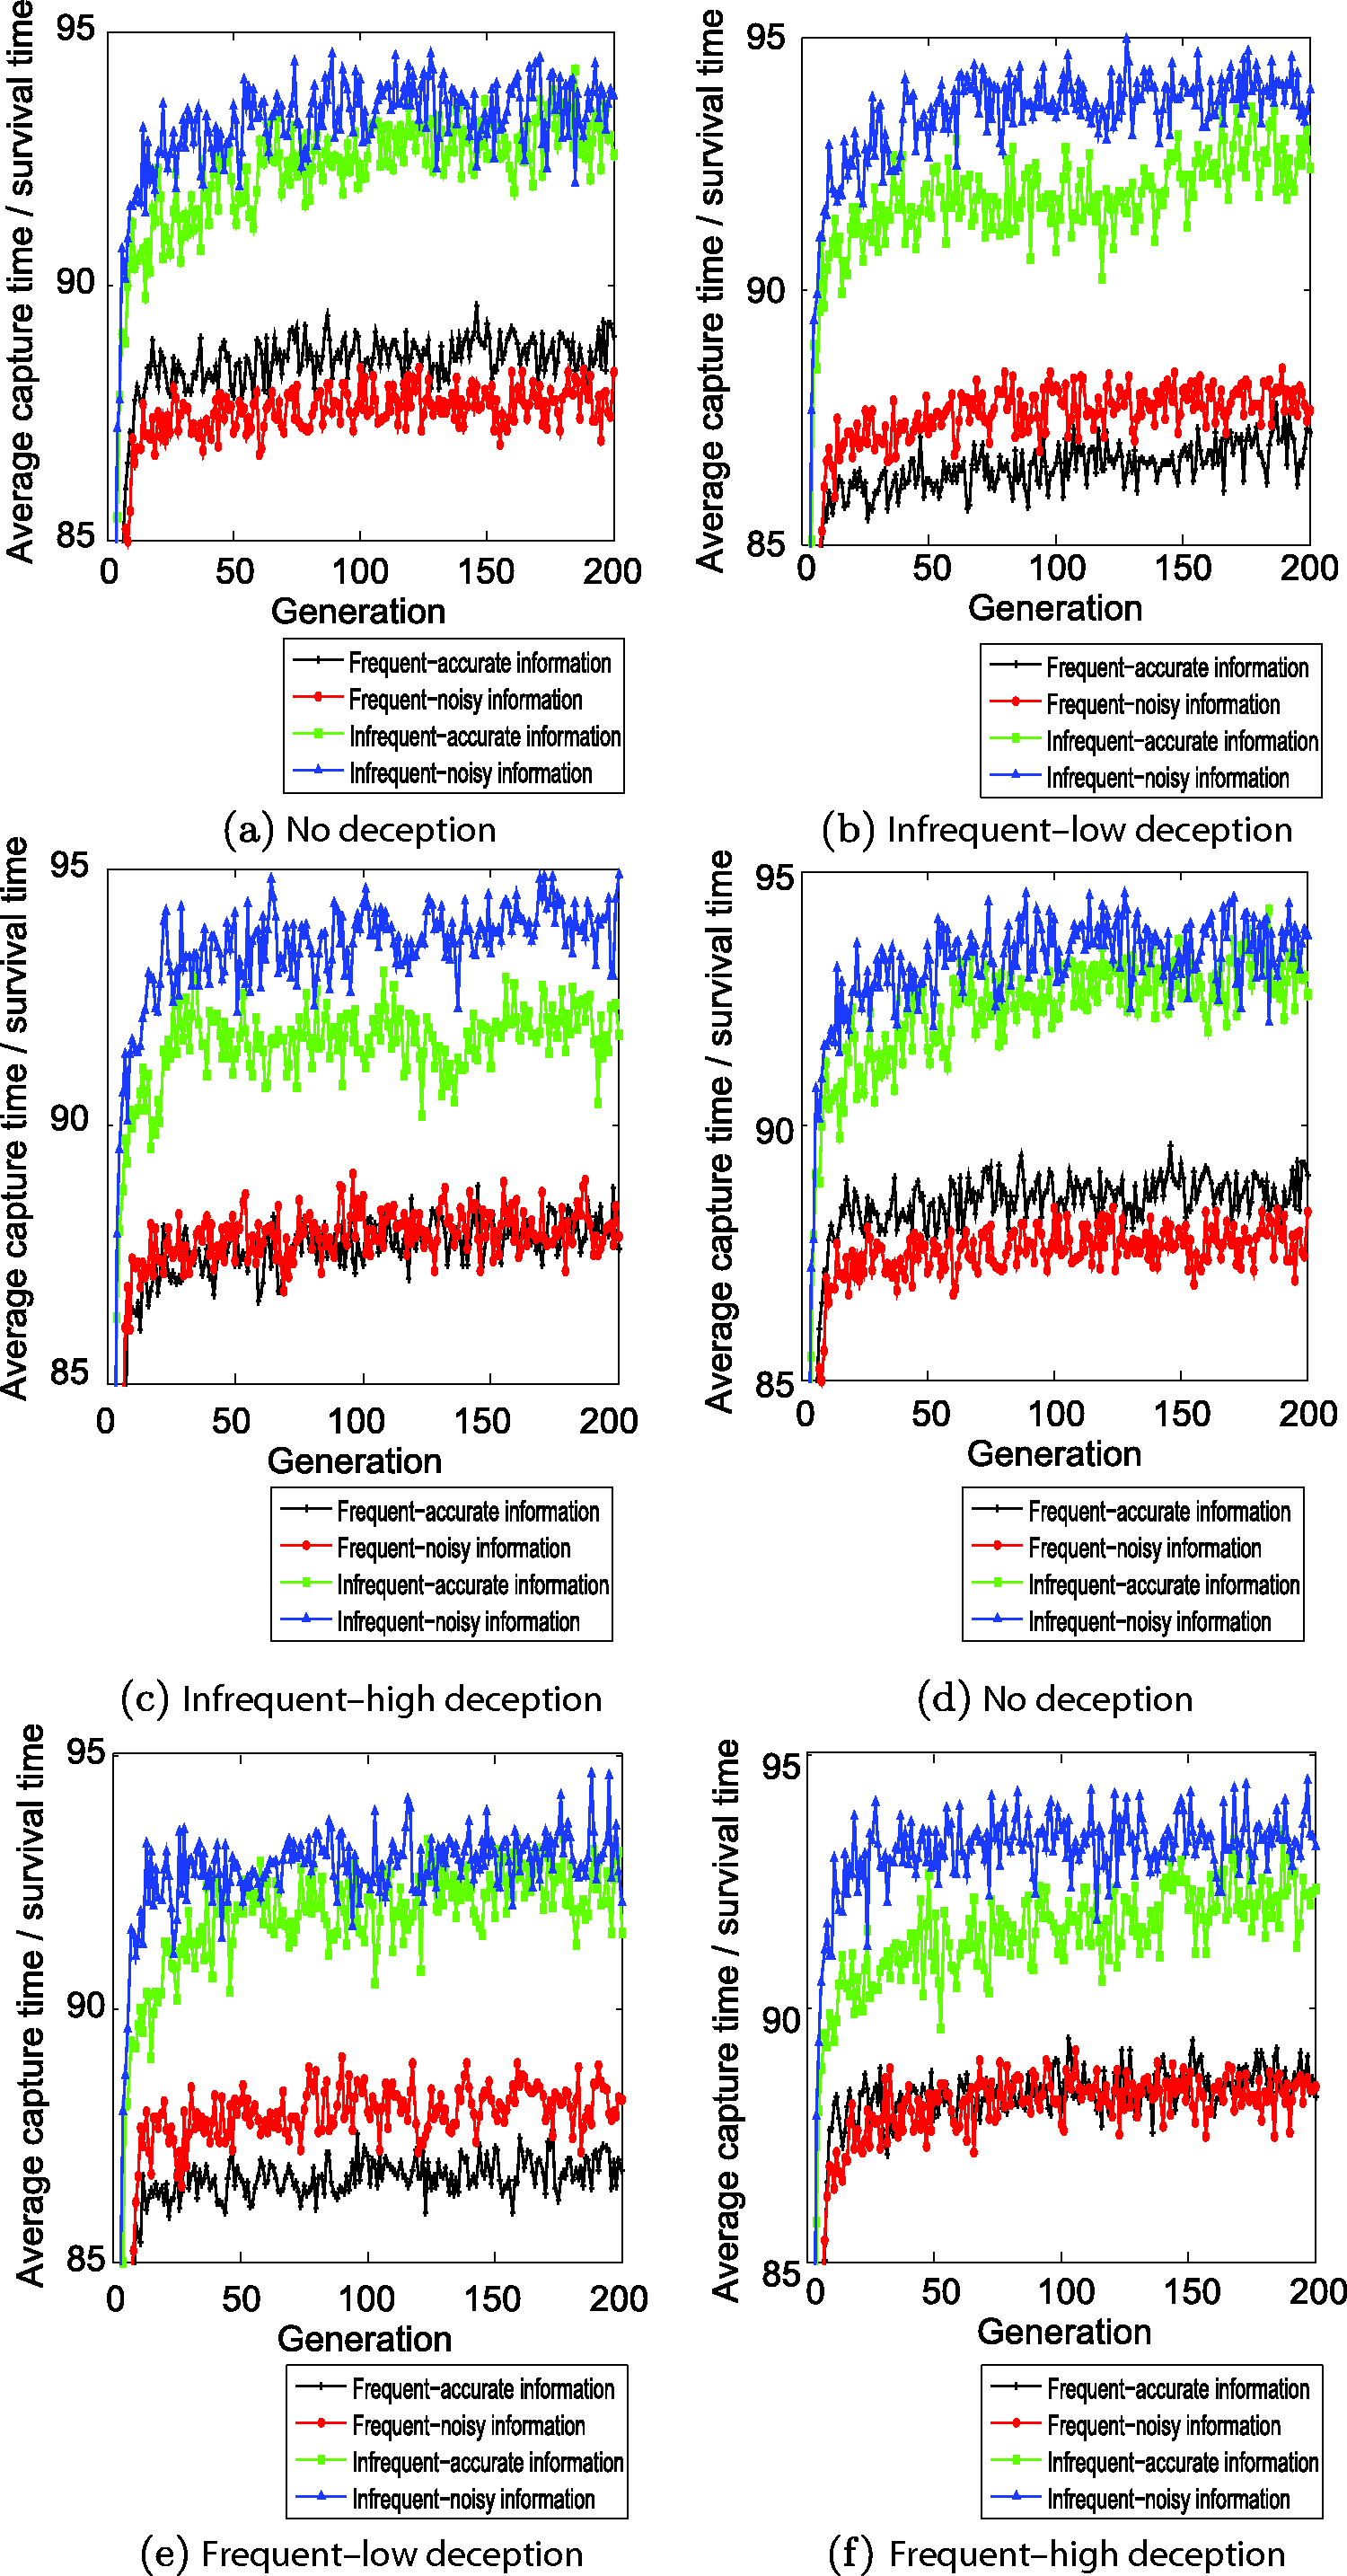
Zoom-in of Figure 11 for the last 50 generations.
A few interesting trends can be observed from these figures. First, an increasing average survival time can be observed across all setups, indicating that evolution is working and the adaptive agent improves its learning over time. Second, in accordance with intuition, the adaptive agent has shorter average survival times when the pre-programmed agent receives information more frequently. Third, the level of noise in the received information seems to have less impact on capture times than the frequency of received information. Not surprisingly, the worst survival times or best capture times are observed when the infrequent reception is compounded with higher noise level. Fourth, and the most interesting finding, is discovered by comparing the capture/survival times under infrequent and noisy information levels across different deception levels. A close look at the comparison shows that the difference between average capture/survival times under the two noise levels decreases with increasing deception levels when the frequency of receiving information is high. In contrast, the difference under the two noise levels increases with increasing deception levels when the frequency of receiving information is low.
Another interesting observation is the column-wise comparison between sub-figures (i.e. Figures 11(c)–11(f) and Figures 12(b)–12(e)). By having the same degree of deception, the difference between average capture/survival times under the two noise levels decreases with increasing deception frequencies when information is received infrequently.
This implies that a higher degree of deception has a counterbalancing effect on noise level when information is frequently received. In a situation of receiving infrequent information, a higher frequency of deception is a better option to counterbalance the effect of noise. In other words, the pre-programmed agent is better off with higher deception when it senses higher noise in information.
5.2 Trajectory visualisation
Referring to the discussion in Section 4.2, Figure 13 shows trajectories across different experimental configurations for the same starting conditions (the same seeded runs). The quality of information received by the pre-programmed agent deteriorates from left to right, while its adopted deception level increases from top to bottom. In each sub-figure, the solid dot shows the locations of both agents in the environment at the start of the simulation run, and the cross sign indicates the positions of agents at the completion of a simulation run. Based on Figure 13, the agent manoeuvreing patterns are less complicated and only follow simple curve and straight-line trajectories when the pre-programmed agent is situated in the following conditions:
The deception of the pre-programmed agent is fixed and the quality of information is varied (left to right);
The quality of information is fixed and the level of deception adopted by the pre-programmed agent is varied (top to bottom).
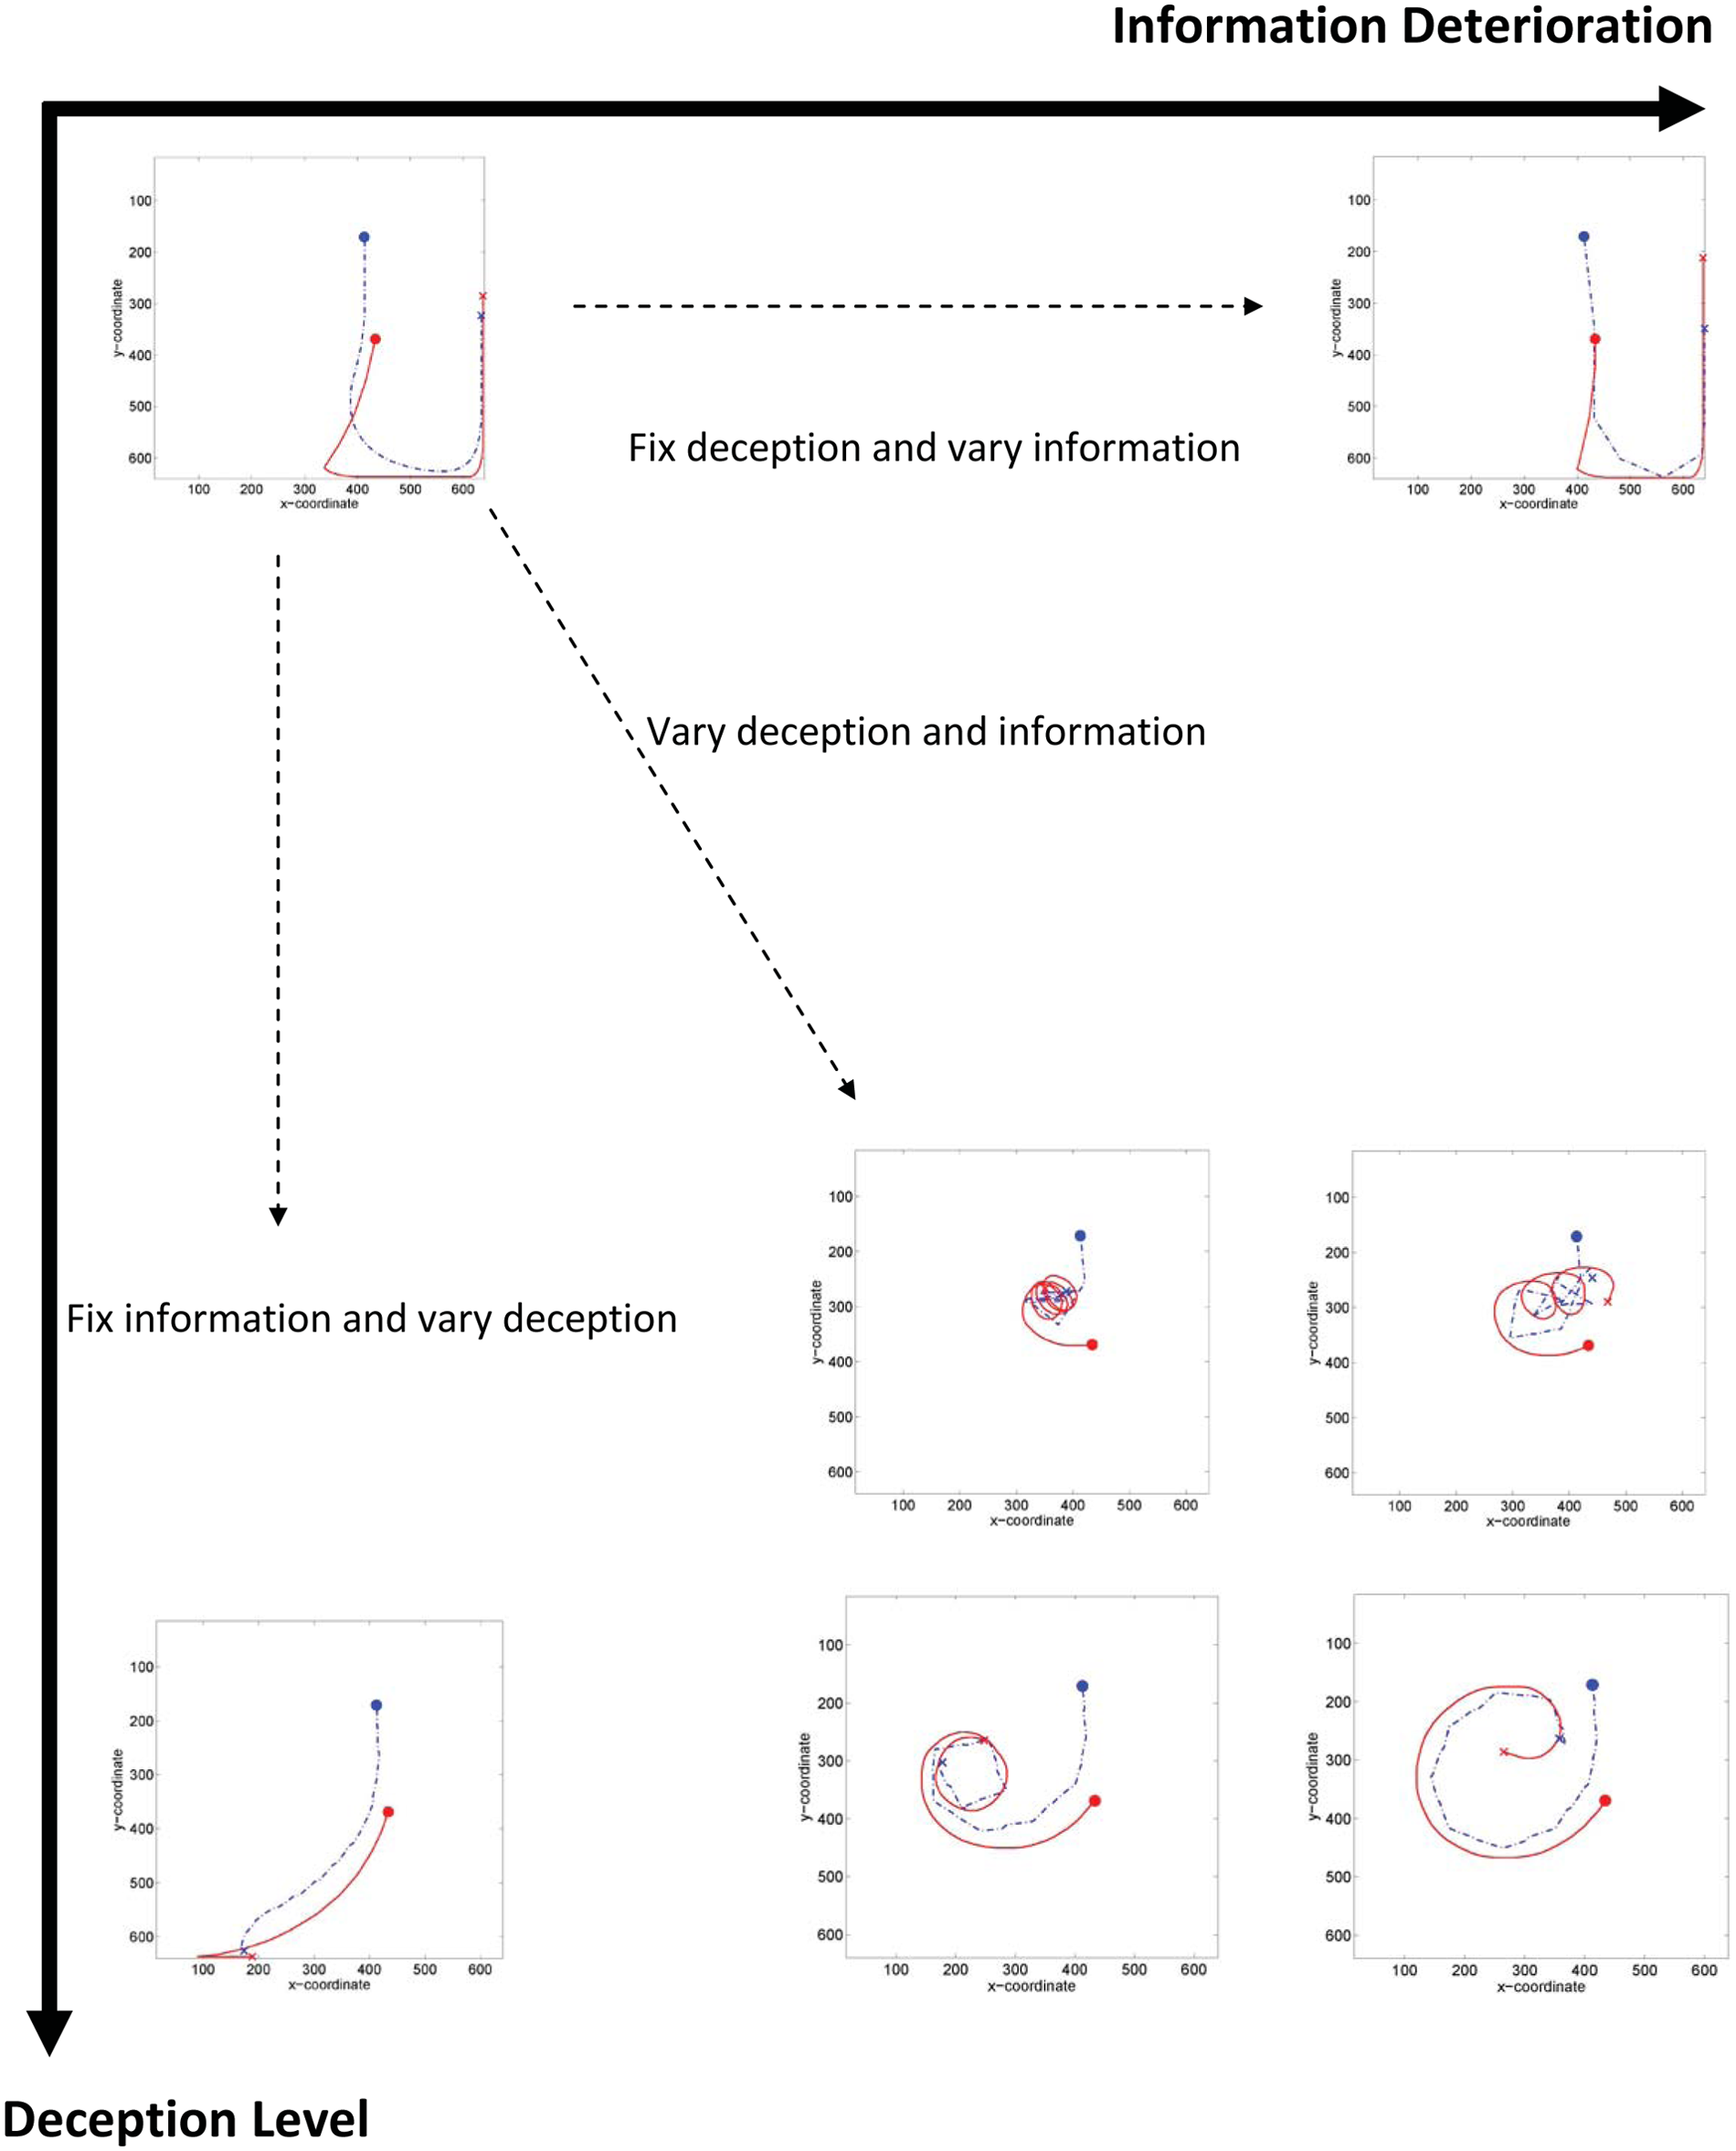
Trajectories shown by the pre-programmed and adaptive agents for different combinations of information and deception.
As the combinations of information and deception change from top left to bottom right, the trajectories show more complicated and interesting patterns, with most taking circular and spiral shapes. It is also interesting to observe that the areas travelled by the agents are smaller under such conditions. This means that the adaptive agent, using neuro-evolution, is able to produce more creative strategies as the distractions in information and deception increase, and it does not necessarily travel far in order to survive.
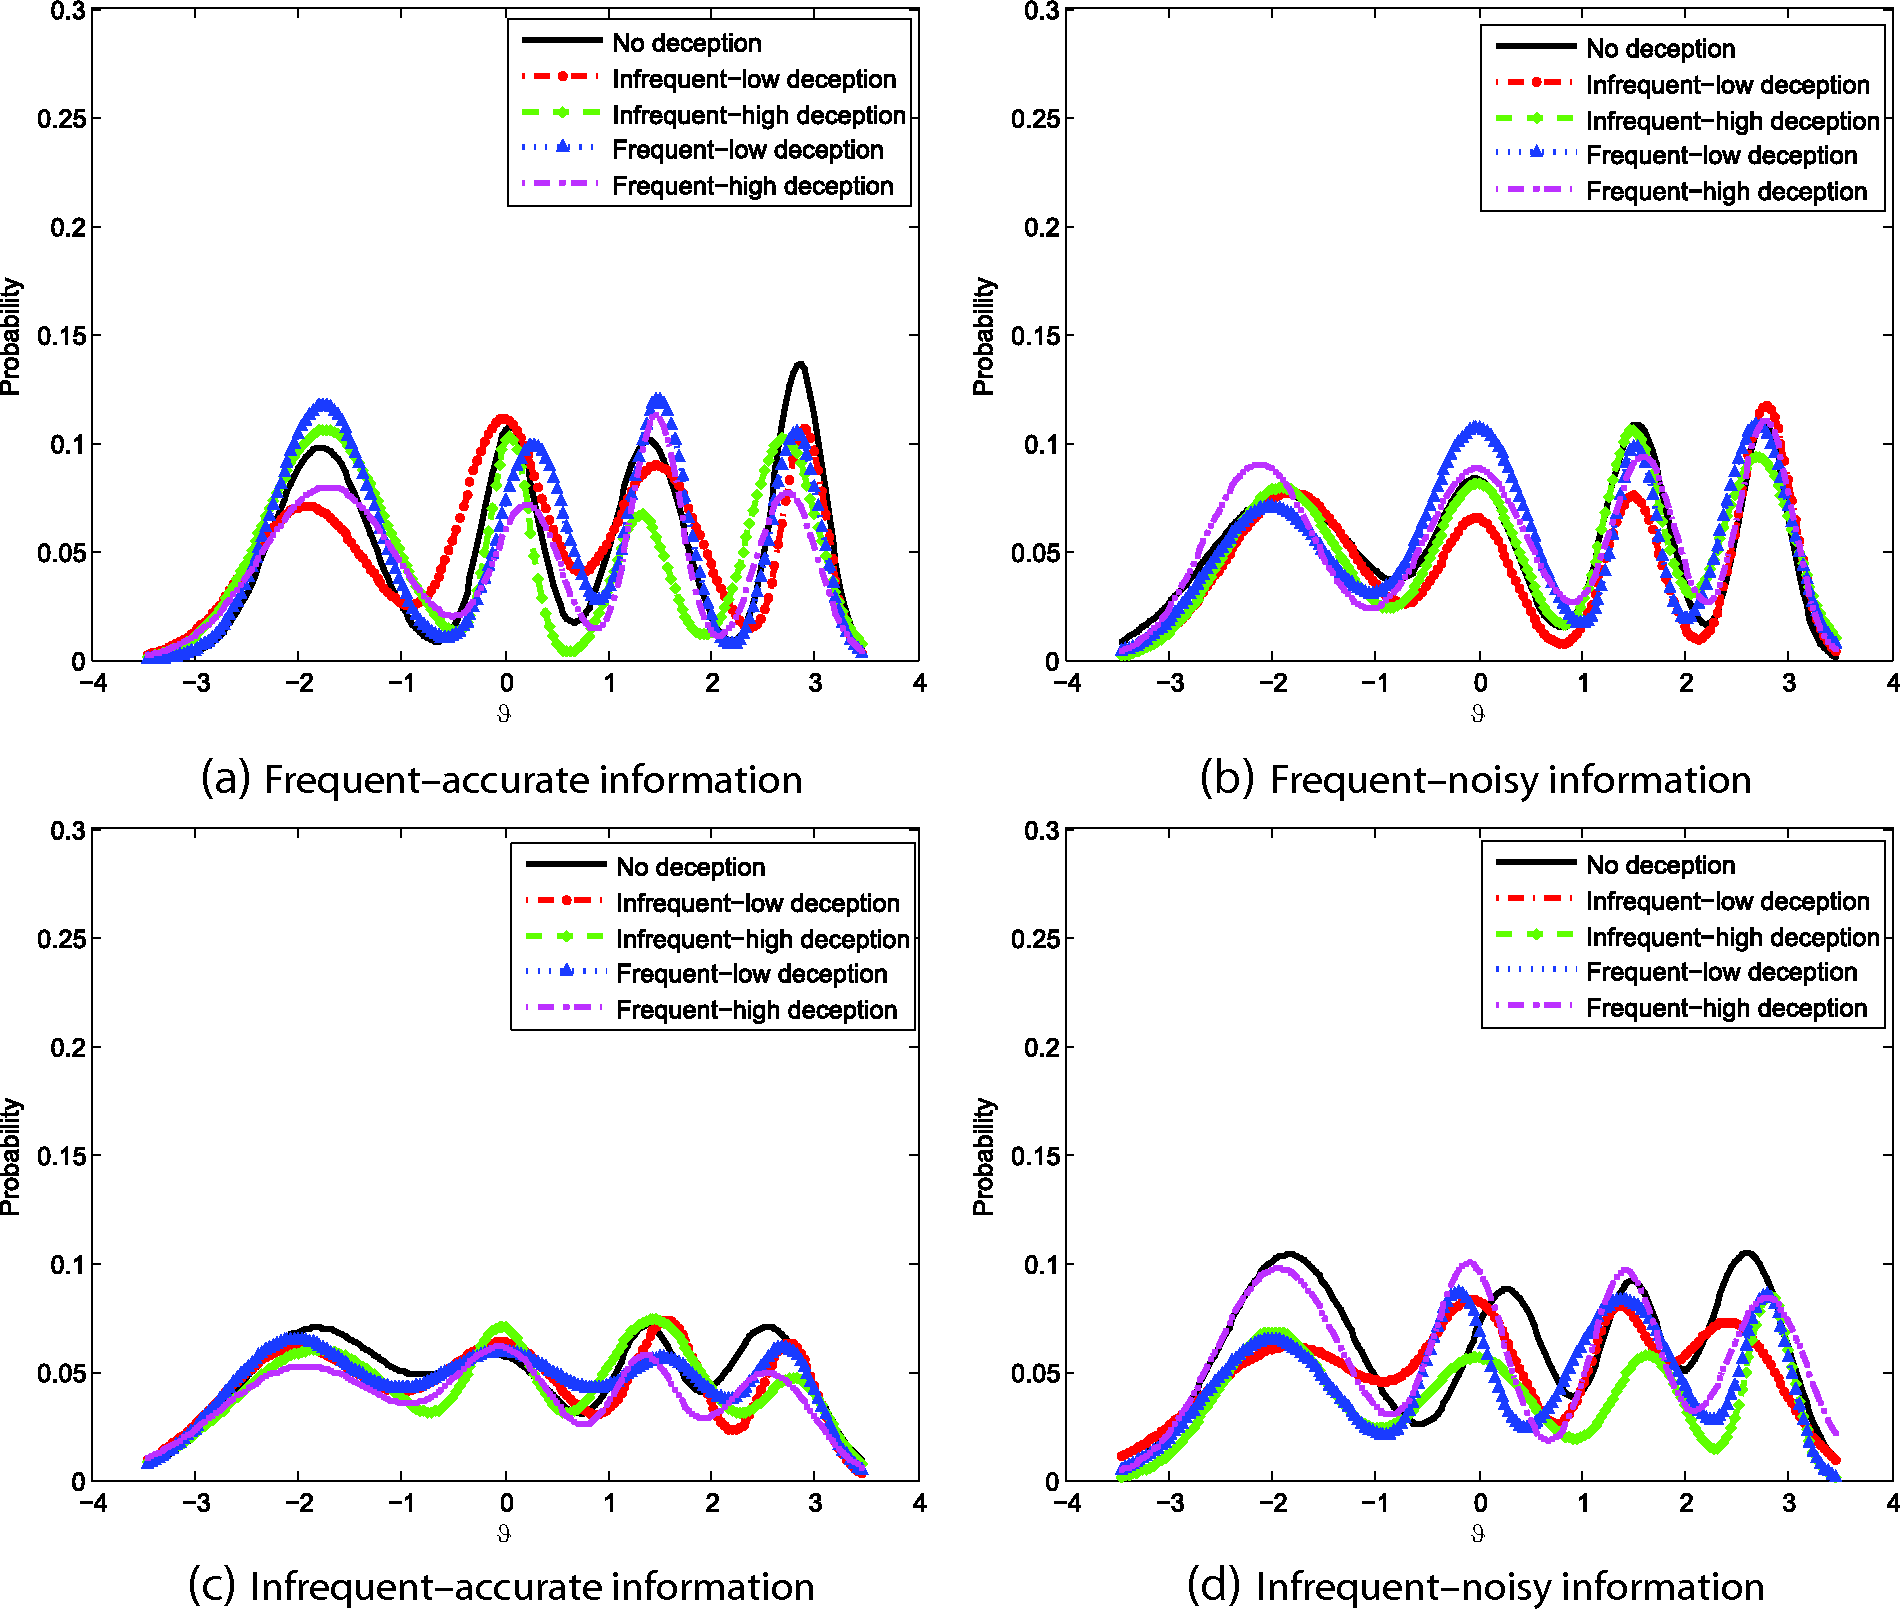
5.3 Action frequency distribution
Referring to the discussion in Section 4.3, Figures 14 and 15 show the distribution of the adaptive agent’s headings (ϑ) and its changes (
The probability plots of ϑ for different experimental configurations based on varying levels of input noise and deception.
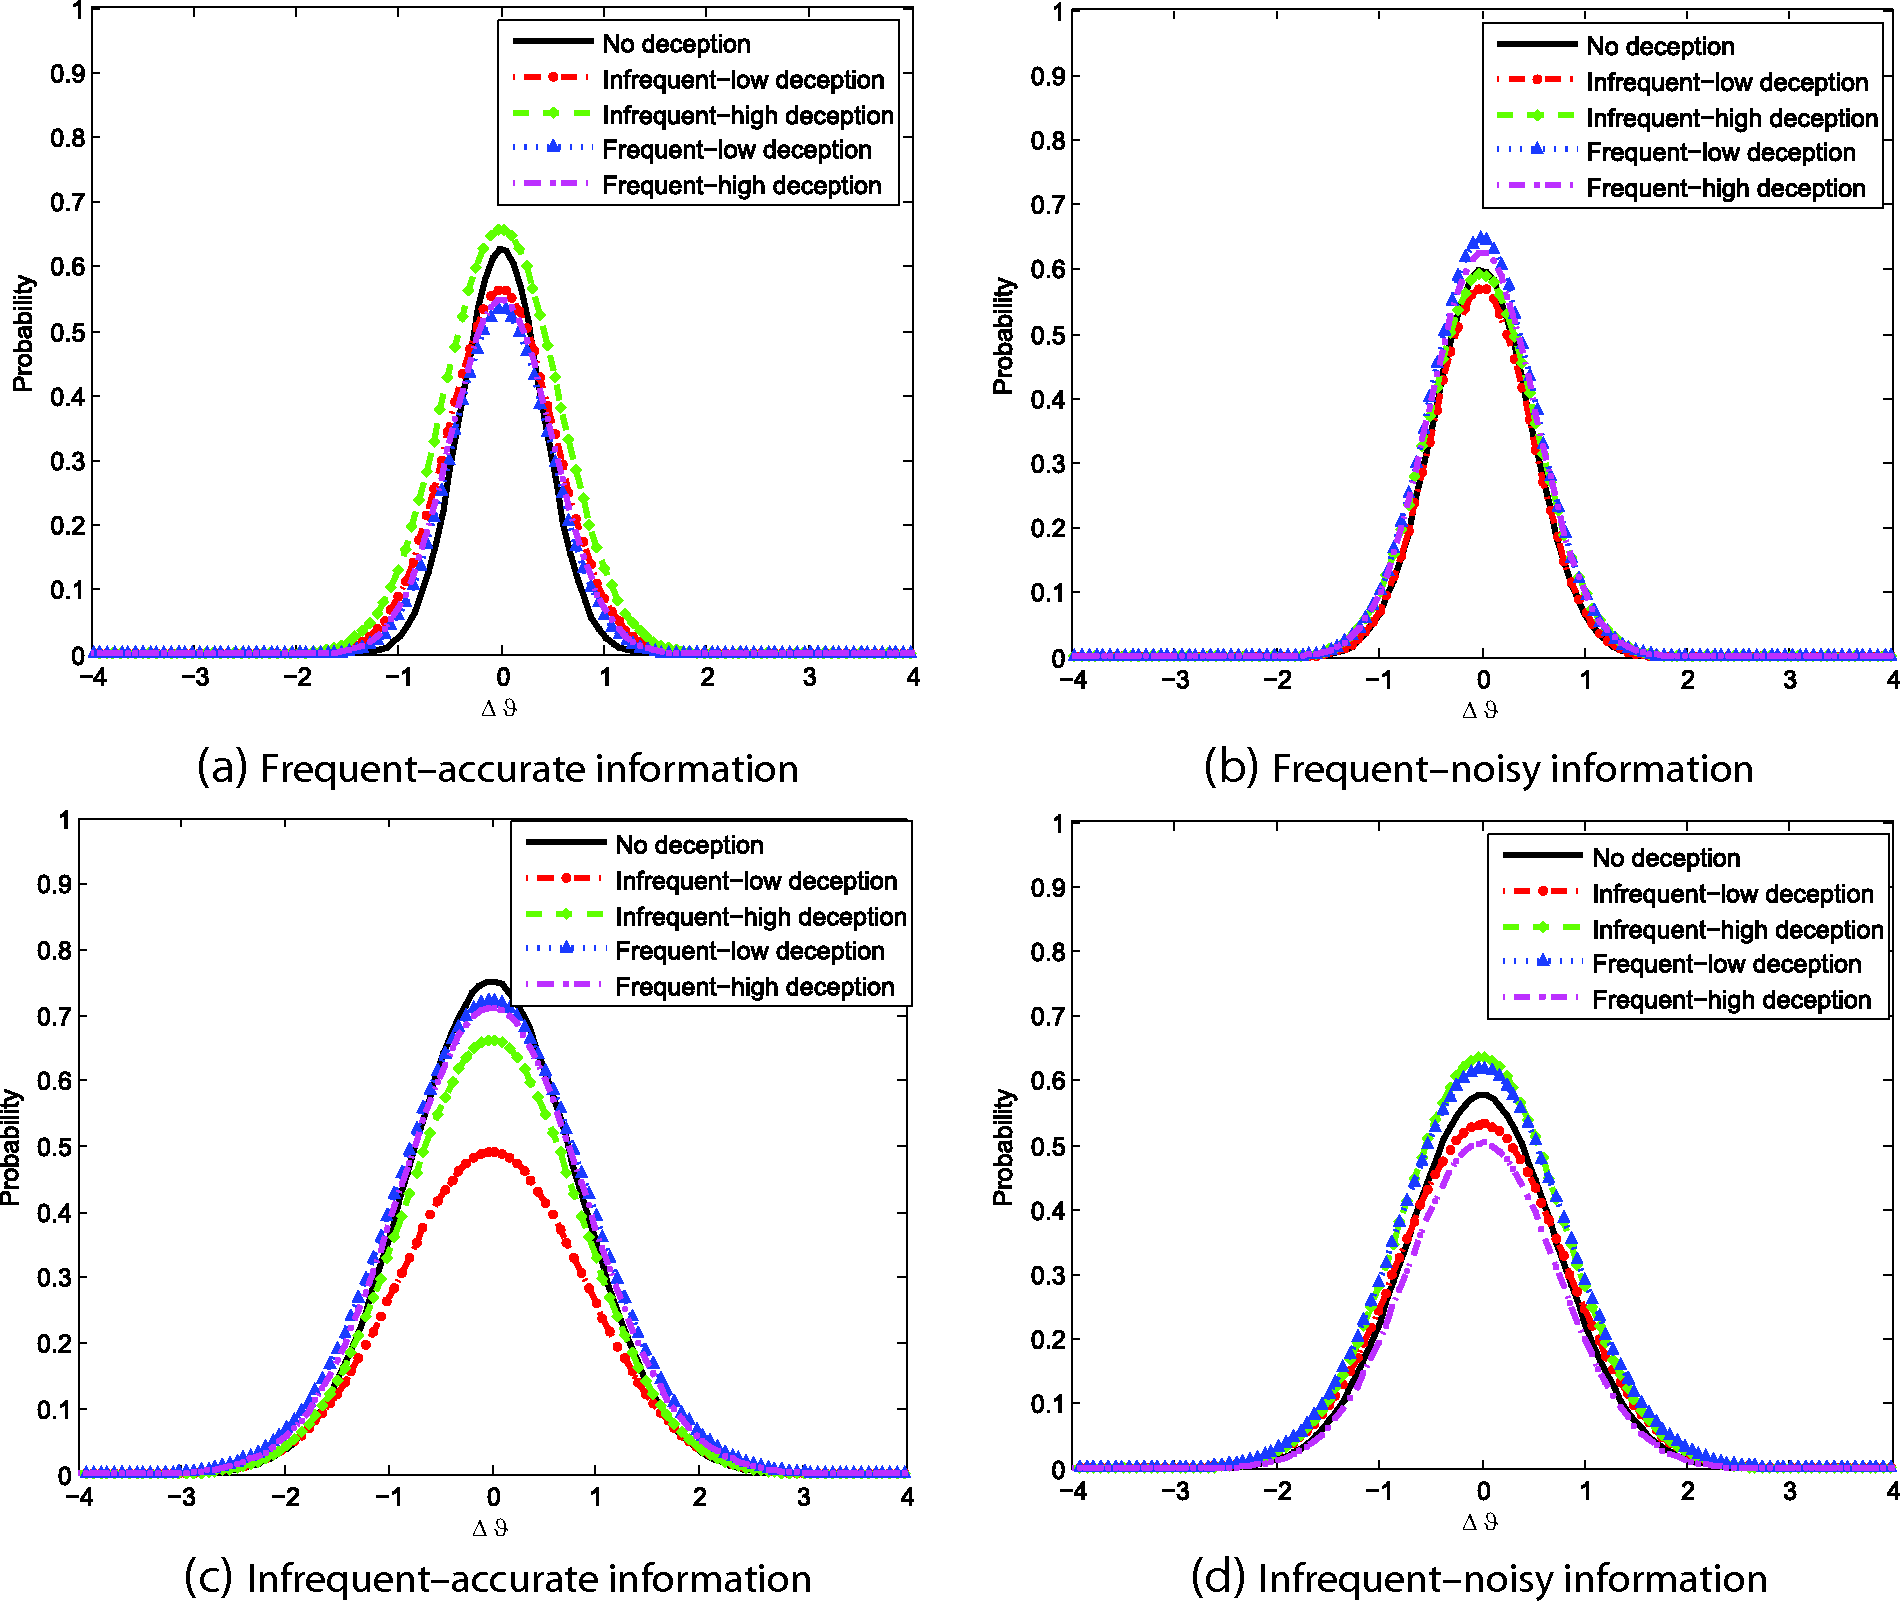
The probability plots of
It can be seen that the ϑ distributions across all experimental configurations are multi-modal, each consisting of four modes. The obvious observation from the sub-figures is that the adaptive agent actions follow similar distributions for a specific noise-level combination across different levels of deception. When the received information quality for the pre-programmed agent changes from frequent–accurate to infrequent–noisy, we can observe changes in the heights of the four peaks in the distributions, and these patterns are consistent across different levels of deception. Figure 14(a) associated with frequent–accurate information shows the highest peaks in the distribution. This implies that the adaptive agent adopts certain action strategies more commonly when the pre-programmed agent receives frequent and accurate information on its position. As frequently received information changes from accurate to noisy, there is a marginal reduction in the peaks’ heights overall as shown in Figure 14(b). The lowest peaks are observed in Figure 14(c), implying a uniformly distributed action strategy by adaptive agents when the pre-programmed agent receives accurate information infrequently. However, the introduction of noise into infrequent information as shown in Figure 14(d) encourages the adaptive agent to prefer specific actions.
When paired comparisons are made between frequent and infrequent information for accurate and noisy information respectively (i.e. Figures 14(a)–14(c) and Figures 14(b)–14(d)) we can see that the differences in peaks’ heights are clearer in accurate information than noisy information. The adaptive agent has a much lower preference for certain actions as the frequency of receiving accurate information reduces than when under noisy information conditions. In other words, one of the key results of these experiments is that the frequency of received information generally has a higher impact in constructing a preference towards specific actions than the noise level of the information does.
On the other hand, analysing the pdfs of
In summary, the findings from the action distributions show that the adaptive-agent behaviours resulting from neuro-evolution are more influenced by information quality than by deception. Even though the pre-programmed agent tries to confuse the adaptive agent by being deceptive, the adaptive agent is able to discover the dominant patterns in its movements, and thus use similar strategies to survive. However, the quality of the information influences the adaptive agent’s actions. The patterns shown in the distributions of ϑ suggest that the preferences of the adaptive agent’s action at certain values reduces in the following order: frequent–accurate, frequent–noisy, infrequent–noisy and infrequent–accurate. When the frequency of information is high, the preferences of the adaptive agent towards certain actions are less affected by the noise. However, if there is a delay in the received information by the pre-programmed agent, an introduction of noise in the information causes the adaptive agent to prefer certain actions when compared to receiving accurate information.
5.4 Sub-sequence similarity analysis
Recall from our discussion in Section 4.4 that the number of sub-sequences in each action sequence is chosen based on the smallest sequence size. Based on the 6000 samples of action sequences recorded in our experiments, the number of sub-sequences chosen in our analysis is 10. This means that our total feature vector size is 19, where the first 10 values refer to the velocity and the next nine values refer to the acceleration features, computed from the 10 sub-sequences in each sample. The total data set size for clustering analysis is then
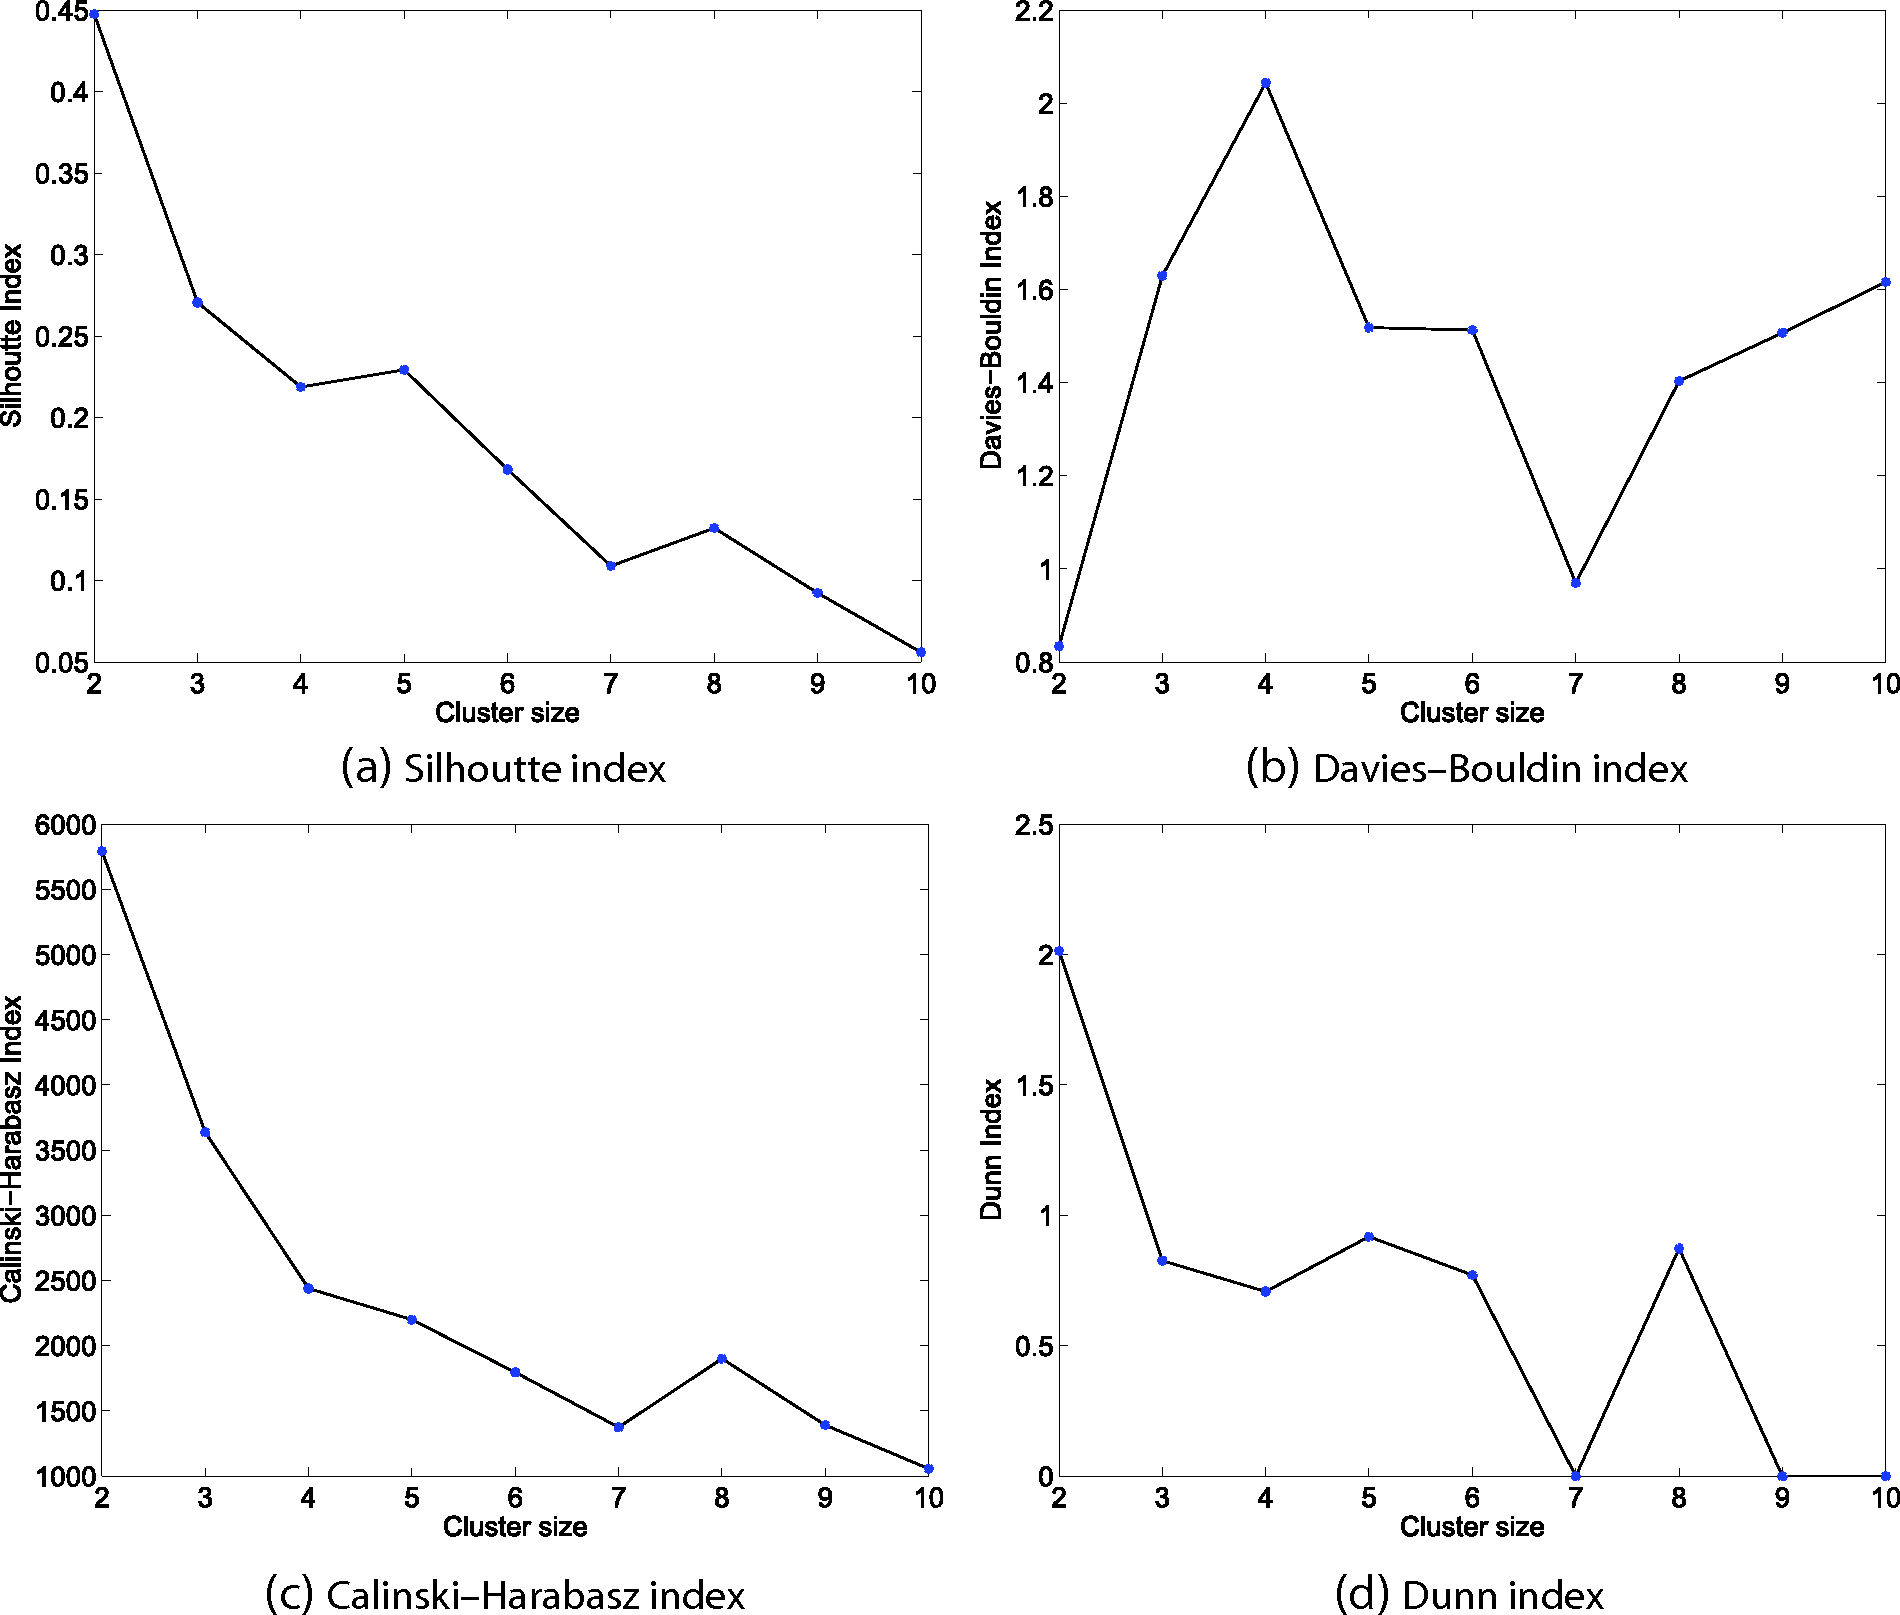
Cluster-validity indices for the action sub-sequence data set.
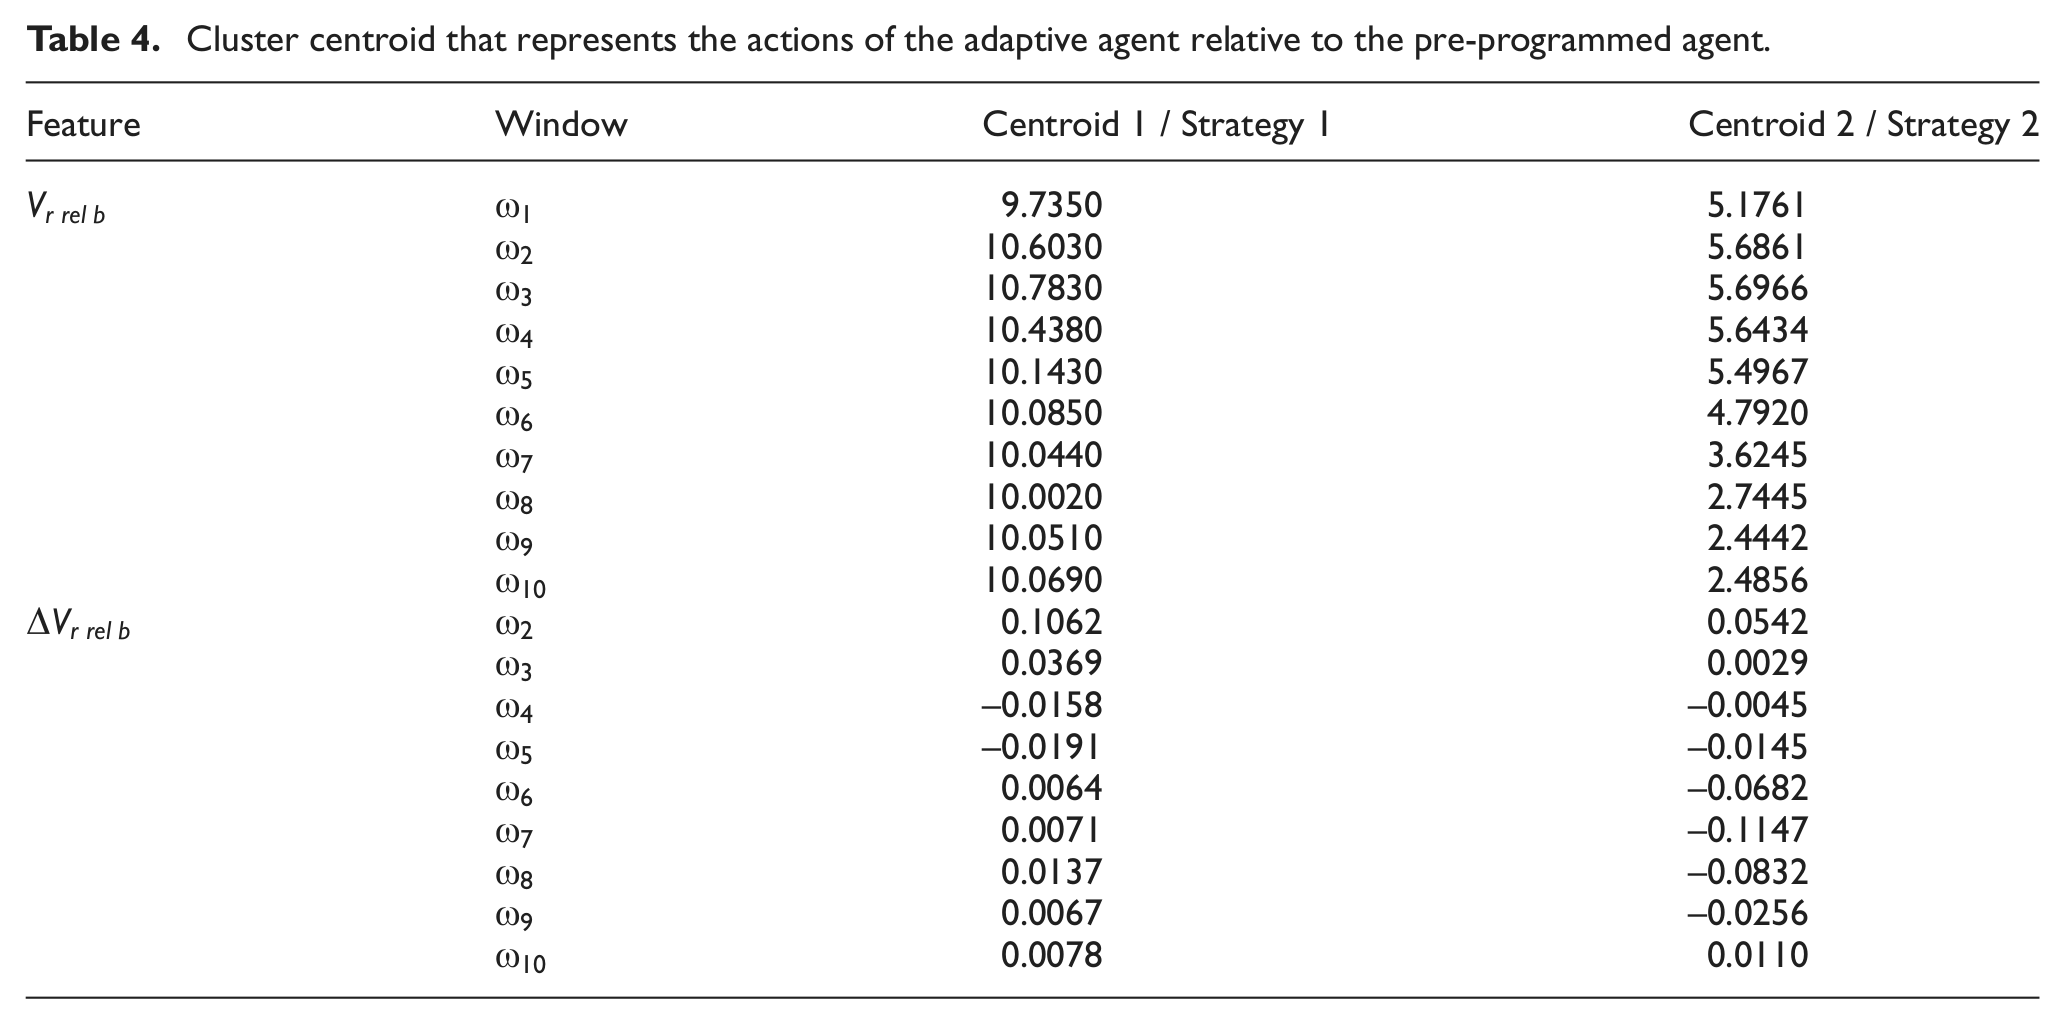
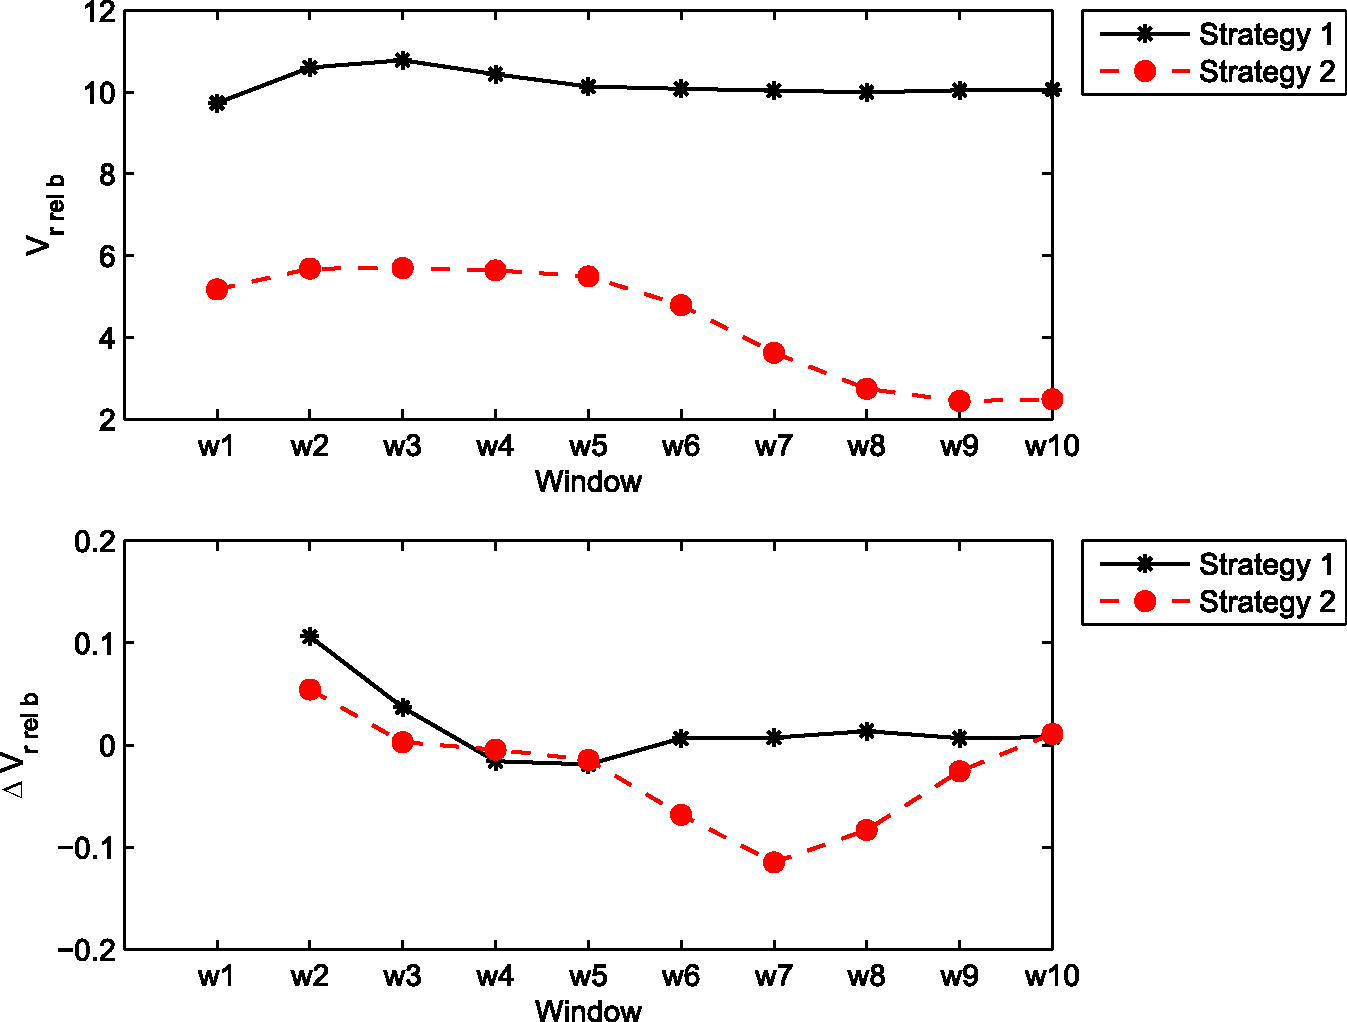
Table 4 shows the 19 feature values for two cluster centroids obtained through the FCM clustering method applied on the data set built from the velocity/acceleration features of sub-sequences. Figure 17 shows a plot of the two centroid values for both velocity and acceleration features.
Cluster centroid that represents the actions of the adaptive agent relative to the pre-programmed agent.
While this analysis clearly clustered the action sequences in our sample in two strategies, a t-test is carried out with a 0.05 significance level to further evaluate the null hypothesis that the samples in both strategies have equal means, against the alternative hypothesis that the means are unequal. The results of the t-test are shown in Table 5. The mean scores for strategies 1 and 2 are denoted by
The results of t-test for the mean scores between strategies 1 and 2.
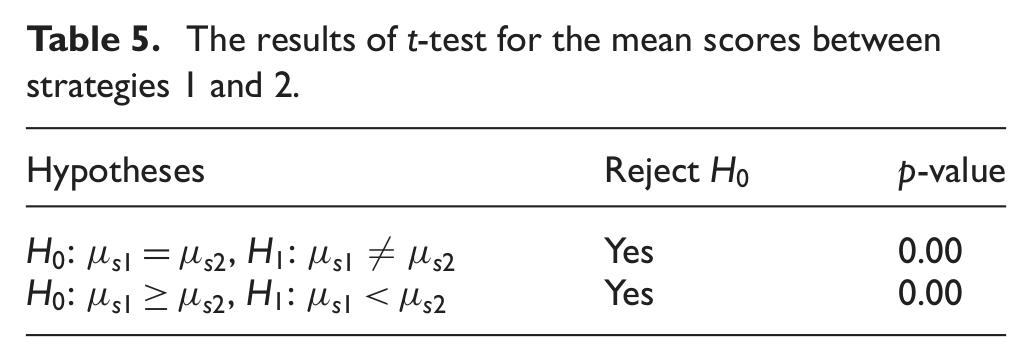
Based on Table 5, the results show that there is enough evidence to reject the null hypothesis. Therefore, we can claim that the scores for the two strategies are significantly different. The scores for both strategies, based on mean and standard deviation, are shown in Table 5. Since the mean score of strategy 2 is higher than that of strategy 1, we wish to test the null hypothesis that the score samples from strategy 1 have a greater or equal mean compared with strategy 2, against the alternative that strategy 1’s mean is less than strategy 2’s mean. Again, a t-test is carried out with a 0.05 significance level to test the hypothesis, and the significance test shows that the null hypothesis is rejected. The result of the t-test supports the conclusion that the scores for strategy 1 are significantly lower than those for strategy 2. However, the scores for both strategies are still high, with both means exceeding 90%.
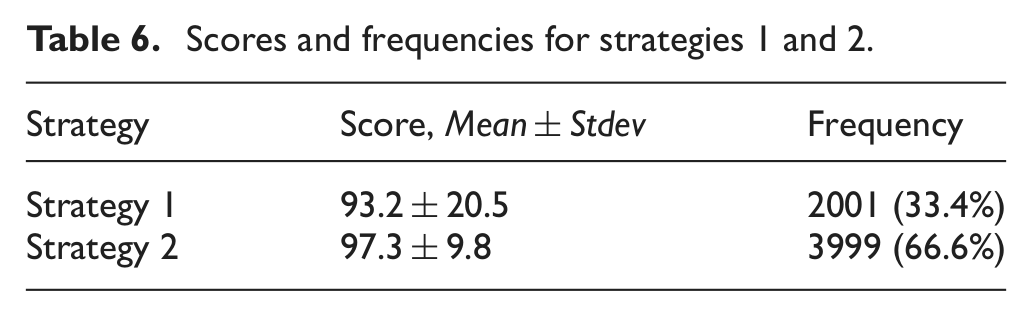
Since the patterns in the actions taken by the pre-programmed agent are influenced by the received information and its own deception, this means the evolution is also influenced by the effects of information and deception, given that it learns from the patterns in the pre-programmed agent’s actions. The best evolved solutions can be categorised into two main groups, where the differences between these two strategies lie on the mean and standard deviation of their scores. Strategy 1 has lower mean and higher standard deviation, while strategy 2 is associated with a higher mean and lower standard deviation. Besides that, the results in Table 6 show that the frequency of strategy 2 (66.6%) is higher than strategy 1 (33.4%) . This means evolution is likely to generate strategy 2 which is associated with higher scores.
Scores and frequencies for strategies 1 and 2.
Most of the strategies generated by the evolution are good and they share high similarity. A possible reason to explain the high similarity among the strategies is that evolution is able to extract the hidden patterns, even though they may be affected by information and deception, and thus produces optimum solutions. For example, the pre-programmed agent’s movements may become less obvious to the adaptive agent due to distraction in the pre-programmed agent’s information and deception. Due to the interaction between the pre-programmed agent and adaptive agent, the evolution of the adaptive agent uncovers the true intention of the pre-programmed agent and produces optimum solutions for the situation. Given that the true intention of the pre-programmed agent is to catch the adaptive agent, similar strategies are generated by the evolution, preventing the adaptive agent from being caught. This means the evolution manages to capture the dynamics between both agents and produces strategies that are mostly still capable of selecting the correct response, enabling the adaptive agent to survive for longer.
6 Conclusion
This paper presents an agent-based model to study adaptive behaviour under varying conditions of information quality. Information quality is varied in two dimensions: the noise in and frequency of the input signal, and purposeful deviation in output actions. Experiments were conducted to study the combined effect of these two information dimensions on the behaviour of an adaptive agent, operating against a controlled agent whose goal is to capture the adaptive agent. The analysis methodology included inspecting the survival time of the adaptive agent, the visual analysis of different trajectories exhibited by agent actions, and comparison of action sequences, under different informational conditions.
The analysis of capture/survival time suggests that a higher degree of deception counterbalances the effect of noise when information is received frequently. On the other hand, a higher frequency of deception has a counterbalancing effect on noise when information is received infrequently. In other words, the use of higher deception, which can be either the degree or the frequency of deception, as a potential solution to counterbalance the effect of noise depends on the frequency of receiving information.
The action distribution analysis suggests that the agent behaviour is influenced more by the quality of information than the level of deception. It seems that the characteristics of the task, such as information, can evoke strategies that partially determine the preferences of action in the adaptive agent.
Despite different configurations of information and deception, evolution is able to learn the dominant patterns of movement adopted by the pre-programmed agent and produce the best evolved solutions, where the actions generated by the solutions experience minimal changes. In other words, the strategies produced by the best evolved solutions are robust across the fixed strategies under different information conditions.
Analysis of action similarity reveals that the adaptive agent’s strategies across different combinations of information and deception can be categorised into two main groups. Even though both strategies achieve high fitness scores, one of them has a higher mean and lower standard deviation in term of scores than the other does. Furthermore, the frequency of the better strategy is higher as well. This means neuro-evolution is likely to generate strategies with high performance.
Our next step in this research is to replace the artificial agents with human subjects in a similar environment, and analyse their behaviour using the methodology presented in this work. A comparison between the strategies taken by the human subjects, and the artificial agents studied in this paper, would lead us to determine how successfully human behaviour can be replicated by artificial agents. The same result can also be used to further refine our agent models to closely match human behaviour.
Footnotes
Funding
The first author would like to thank the Sultan Idris University of Education (UPSI) and Ministry of Higher Education, Malaysia, for providing the scholarship to carry out the PhD study at the University of New South Wales.