
Abstract
Aggregation, a widely observed behavior in social insects, is the gathering of individuals on any location or on a cue. The former being called the self-organized aggregation, and the latter being called the cue-based aggregation. One of the fascinating examples of cue-based aggregation is the thermotactic behavior of young honeybees. Young honeybees aggregate on optimal temperature zones in the hive using a simple set of behaviors. The state-of-the-art cue-based aggregation method BEECLUST was derived based on these behaviors. The BEECLUST method is a very simple, yet a very capable method that has favorable characteristics such as robustness to noise and simplicity to apply. However, the BEECLUST method does not perform well in low robot densities. In this article, inspired by the navigation techniques used by ants and bees, a self-adaptive landmark-based aggregation method is proposed. In this method, robots use landmarks in the environment to locate the cue once they “learn” the relative position of the cue with respect to the landmark. With the introduction of an error threshold parameter, the method also becomes adaptive to changes in the environment. Through systematic experiments in kinematic and realistic simulators with different parameters, robot densities, and cue sizes, it was observed that using the information of the environment makes the proposed method to show better performance than the BEECLUST in all the settings, including low robot density, high noise, and dynamic conditions.
1. Introduction
Environment plays a significant role in different aspects for animals. They interact with the environment by all means to survive. One aspect of the environment is its critical role in the navigation of some animals. For example, ants form pheromone trails between a foraging site and their nest then use this trail as a landmark for navigation (Hölldobler et al., 1990). Honeybees are one another species that use environmental cues for navigation (Srinivasan, 2010). They use visual (Collett, 1996) or olfactory cues (Reinhard, Srinivasan, Guez, & Zhang, 2004; Reinhard, Srinivasan, & Zhang, 2004) to find their way in foraging. Both ants and bees are able to memorize the distance and direction they traveled with respect to a landmark; then, they can integrate this information to return back to their nest (Collett & Collett, 2002). Another aspect of the environment is its protection for animals. Species usually aggregate and hide for protection on the habitat they live in (Grünbaum & Okubo, 1994). In aggregation behavior, animals such as amoeba (Rappel et al., 1999) or cockroaches (Camazine et al., 2003) gather as a single group that is beneficial for their survival. There are two types of aggregation behavior observed in nature: self-organized and cue-based. In self-organized aggregation, species aggregate without the need of any external cue (Halloy et al., 2007). In contrast, in cue-based aggregation, species aggregate on an external cue that is a zone with a distinctive physical feature such as temperature or light intensity in the environment (Frank et al., 2015). Young honeybees are one such species exhibiting this behavior to aggregate on locations that have optimal temperature range favorable for their growth (Heran, 1952) called the thermotactic behavior.
A behavior-based approach is used to model thermotatic behavior of young honeybees (Schmickl & Hamann, 2011). The behavior of bees is modeled as follows: a bee moves randomly in the hive until it encounters another bee. It waits for a particular amount of time based on the local temperature, then starts to move randomly again. From this model, the novel cue-based aggregation method, BEECLUST, is derived based on a simple state machine: (1) move randomly, (2) avoid obstacles, and (3) wait for a certain time proportional to the local light intensity. When the waiting time is over, the robot goes back to state (1) (Kernbach et al., 2009).
The BEECLUST method has been implemented in different studies for over a decade. In Schmickl et al. (2009), the BEECLUST method was studied in both static and dynamic environments. In the static environment, there was only one light source, while, in the dynamic environment, two light sources were located in the arena, and the intensity of the light sources was varied during the experiments. It was shown that the BEECLUST method was robust in dynamic environments. In Arvin et al. (2011), parameters of the BEECLUST method were studied systematically, and velocity and waiting time parameters were modified and tested systematically in a dynamic environment. The results showed that both the aggregation time and aggregation performance improved. In Arvin et al. (2014), a fuzzy logic–based aggregation method was proposed. Through systematic experiments in single- and multiple-cue arenas with static and dynamic settings, the proposed method performed better than the BEECLUST method. The BEECLUST method was modified in Wahby et al. (2016) such that robots were able to calibrate the waiting time based on the intensity of the cue which increased the aggregation performance. In a follow-up study (Wahby et al., 2019), two additions were made to the BEECLUST method so that robots were able to measure local robot density and light intensity and share this information with their neighbors. Through systematic experiments, it was shown that robots were able to adapt to dynamic lighting conditions and, as a result, the performance of aggregation was improved in the low-density robot population. The BEECLUST method was modified in Vardy (2016) such that the “wait” state was changed with the “seek” state. When a robot encountered another robot, instead of waiting, it sought the location of its last encounter with another robot for a predefined amount of time. Systematic experiments were conducted, and the proposed method performed better than the BEECLUST method in larger arenas with a large swarm size. While all the aforementioned works considered behavioral homogeneity, in Bodi et al. (2012), a swarm with two different behavioral groups, one with the tendency to aggregate in the area with a high illuminance and the other with the tendency to aggregate in the area with a low illuminance, were created using the BEECLUST method. Through systematic experiments, it was shown that the performance of aggregation depends on the density of robot population. A performance increase was observed particularly for low densities. Similarly, in Kengyel et al. (2015), four different behavioral groups (goal finder, wall follower, random walker, and immobile agent) were created and the BEECLUST method was applied. Evolutionary experiments showed that a certain combination of behavioral groups (in the descending order of ratios: wall follower, immobile agent, random walker, and goal finder) gives the best aggregation performance. A decentralized collaboration strategy to achieve aggregation is proposed in Güzel and Kayakökü (2017). In their work, agents attended a group and allocated a leader for each group. While the leader keeps moving toward a goal, other robots stay coordinated with the leader and the center of gravity of the group. In a follow-up work (Güzel et al., 2019), leaders used a vision-based goal detection algorithm to find the goal in a cluttered environment. Furthermore, to enable collaborative and efficient exploration of goals, an exploration algorithm was proposed.
Different landmark-based navigation techniques have been adopted in swarm robotics. Using pheromones is one such technique applied by different means in different studies (Arvin et al., 2014; Garnier et al., 2013; Mayet et al., 2010; Payton et al., 2001). In Arvin et al. (2018), an artificial pheromone system (Arvin et al., 2015; Na et al., 2020) with an LCD and a USB camera was used. Through systematic experiments, the effects of different parameters such as evaporation and diffusion rates were studied. It was shown that pheromone-based landmark navigation improved the aggregation performance. In Lemmens and Tuyls (2009), an adaptive foraging method using landmark navigation was proposed. The method was based on path integration capabilities of bees. Radio-frequency identification (RFID) tags and other agents were used as the landmarks, and it was shown that the proposed method improved the foraging performance. In Alers et al. (2013), different ways of realizing landmarks including the QR-codes in a real environment were evaluated in different settings, and it was concluded that feasibility of using a particular landmark realization depends on its complexity and the computational capabilities of the robot.
In this article, inspired from the navigation techniques used by the ants and bees (Collett & Collett, 2002), a self-adaptive landmark-based aggregation (LBA) method is proposed based on the BEECLUST method. The main motivation of the proposed method is to increase the poor performance of the BEECLUST method in low densities (Arvin et al., 2016). The performance of the method is tested and compared with the BEECLUST method in static and dynamic environments with different robot densities, cue sizes, and noise.
The contribution of this article is twofold. First, to the best of our knowledge, this is the first implementation of landmark-based navigation in a cue-based aggregation setting. Second, through systematic studies, it was shown that the performance of the proposed method outperforms the BEECLUST method both in low- and high-density populations. In addition, the proposed method is compared to another state-of-the-art aggregation method, ODOCLUST (Vardy, 2016). Results illustrate that the proposed method was able to outperform the ODOCLUST method as well.
The rest of the article is organized as follows: In the next section, the BEECLUST and LBA methods are introduced. Following that, the experimental setup is discussed, and details on the two simulation platforms are provided. Then, the results of the experiments are represented and discussed. Finally, in the last section, the conclusions and the vision for the future works are given.
2. Aggregation method
In this article, three aggregation methods are implemented. Besides the BEECLUST and ODOCLUST methods, the proposed LBA method is discussed in this section.
2.1. BEECLUST method
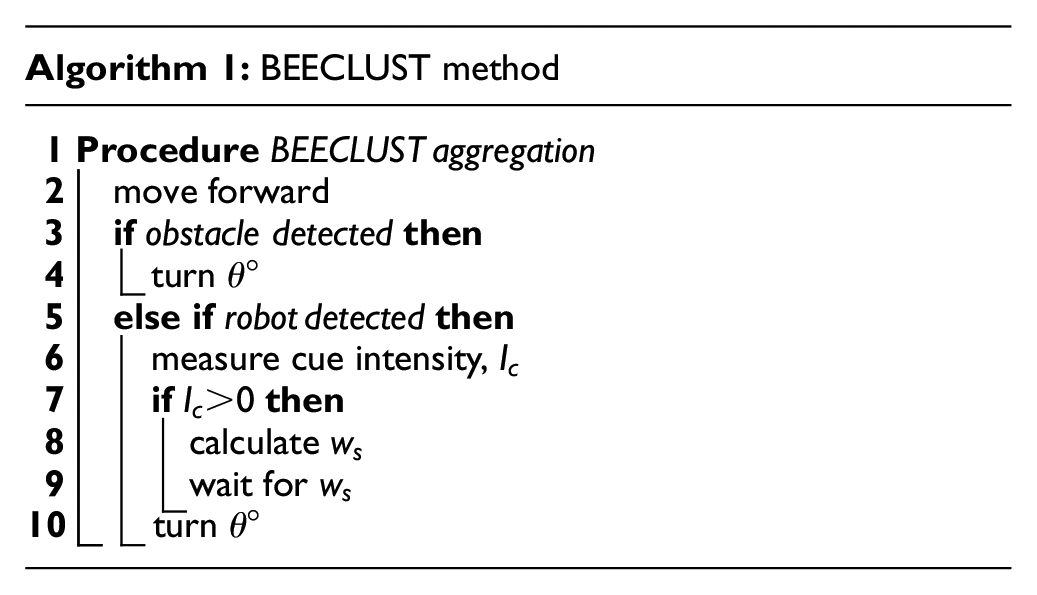
In the BEECLUST method, robots aggregate on a cue present in the environment. In this method, shown in Algorithm 1, when a robot detects another robot, it stops and waits for a predetermined time. The waiting time depends on the intensity of the cue at the location where the robot is detected. It is calculated as
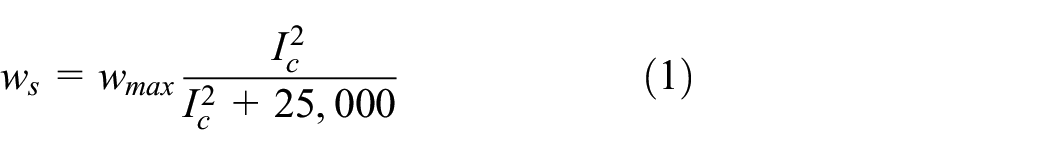
where
2.2. ODOCLUST method
The main idea behind the ODOCLUST method was to increase the aggregation performance using odometry. In this method, robots explore the arena, and save the position of the last two collision points by using odometry. They go in between these two collision points for a specific amount of time called the timeout. In the original version of the ODOCLUST method (Vardy, 2016), the timeout was decided randomly. However, since our article is focused on cue-based aggregation, the ODOCLUST method was modified and implemented such that the timeout duration was decided based on the cue intensity. Figure 1 shows the state machine of the modified ODOCLUST method.
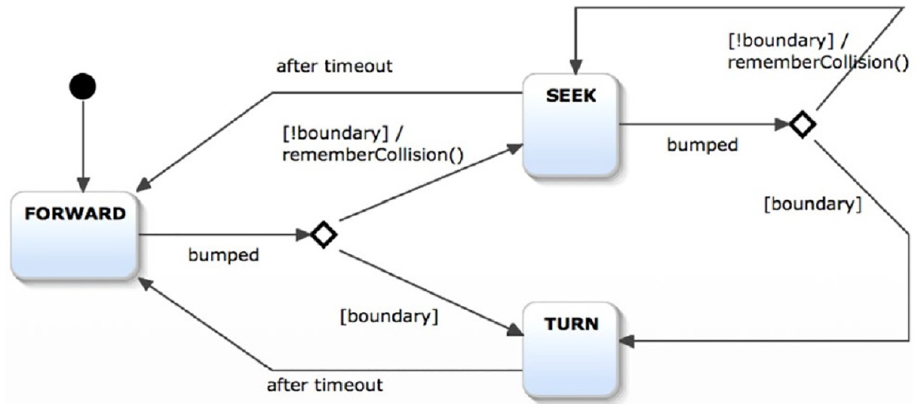
State machine of the ODOCLUST method.
2.3. The LBA method
The LBA method, shown in Algorithm 2, is developed based on the BEECLUST method. It is assumed that there are landmarks and a cue present in the environment. Landmarks do not contain any a priori information about the location of the cue. They are just distinct identifiers detectable by the robots.
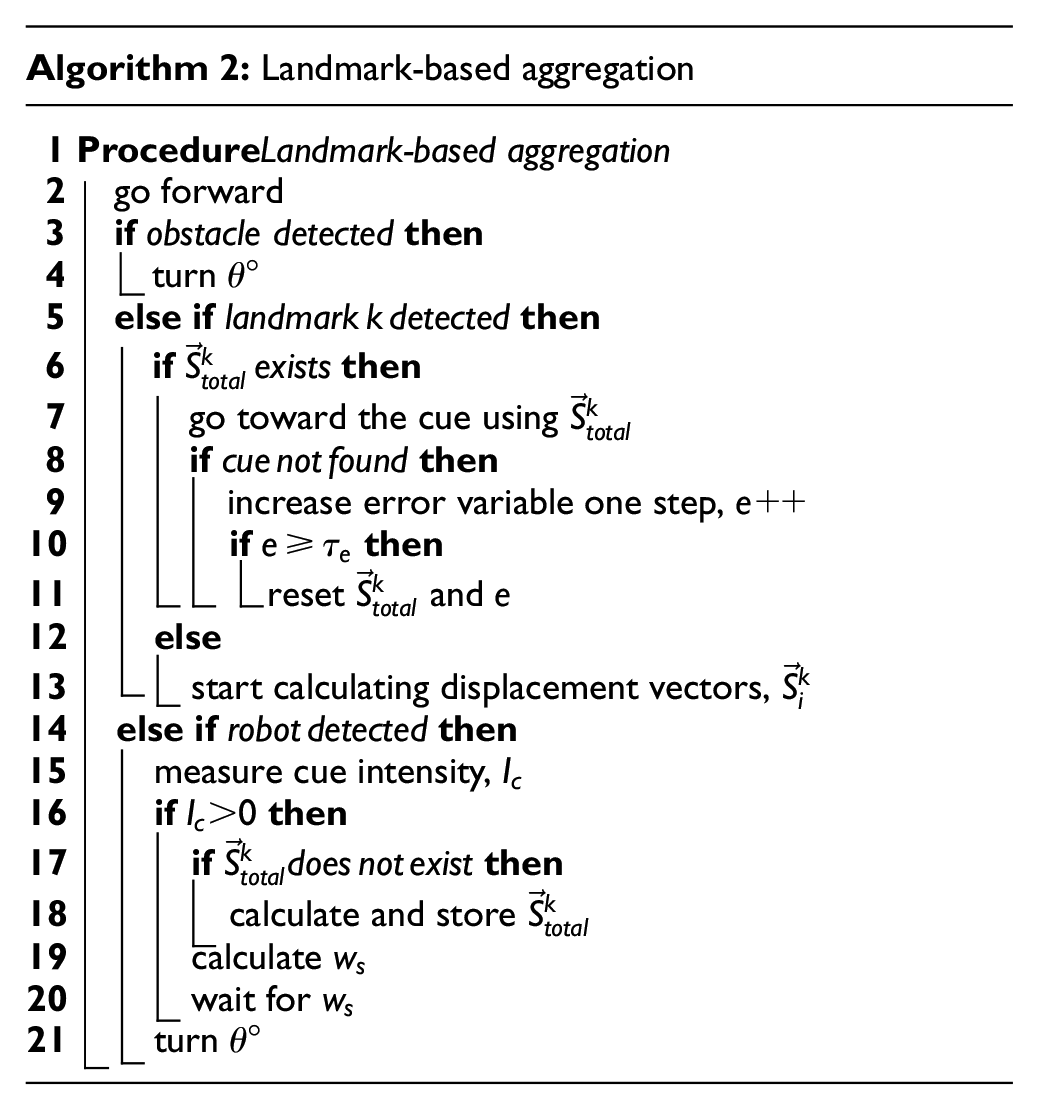
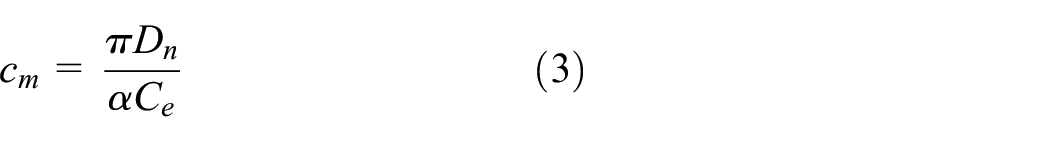
Initially, a focal robot, as in the BEECLUST method, starts to explore the environment randomly. When it detects one of the landmarks (ID, relative position, and orientation of the landmark are extracted) for the first time, it starts to integrate all displacement vectors and continues to explore the environment randomly until the focal robot encounters another robot. Then, it checks the intensity at the location of the encounter. If there is a cue, then it stores the total displacement vector, which is determined by adding the individual displacement vectors, as detailed in Figure 2. The resulting vector conveys (noisy) information about the relative position of the cue from the landmark. So, when the robot detects the same landmark for the next time, it uses the total displacement vector for this particular landmark to go directly toward the cue without the need for further exploration, unlike the BEECLUST method. The magnitude and angle of the displacement vectors are calculated using odometry. Odometry is implemented by counting the pulses from the optical encoder on each wheel. By doing so, it is possible for a robot to calculate the traveled distance as well as the angle that it rotated. The distance that a robot traveled from a given point can be derived by using the incremental travel distance for the left and right wheels
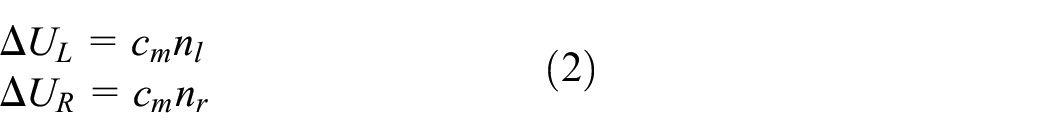
where
where
Demonstration of how
Similarly, when a robot turns, the angular displacement,
where
It is assumed that robots can detect the relative position and orientation of the landmarks. So, when a robot detects a landmark, it calculates its position and orientation with respect to the coordinate system of the landmark as a reference and thereafter, keeps track of its orientation using odometry.
The ith displacement vector,

where
where
Each robot saves a new displacement vector when it detects a new landmark, and assigns this vector to the ID of the detected landmark. Hence, a robot is able to store as many
To add the effect of noise due to detection and odometry, noise is added to the actual direction,

In this equation,
To make the LBA method adaptive, an error variable,
An increment in error variable
3. Experimental setup
In the experimental analysis, two different simulation platforms were used. The first was the kinematic simulator and the other was the realistic simulator. For the sake of comparison, in all the simulations, both the LBA method and the BEECLUST method were implemented.
3.1. Kinematic simulations
In kinematic simulations, shown in Figure 3(a), robots were modeled as two-wheeled agents that have a certain size, linear speed, and rotational speed but no dynamics. The specifications of the robots were taken to be the same as the Kobot robot (Turgut et al., 2007), as shown in Figure 4.
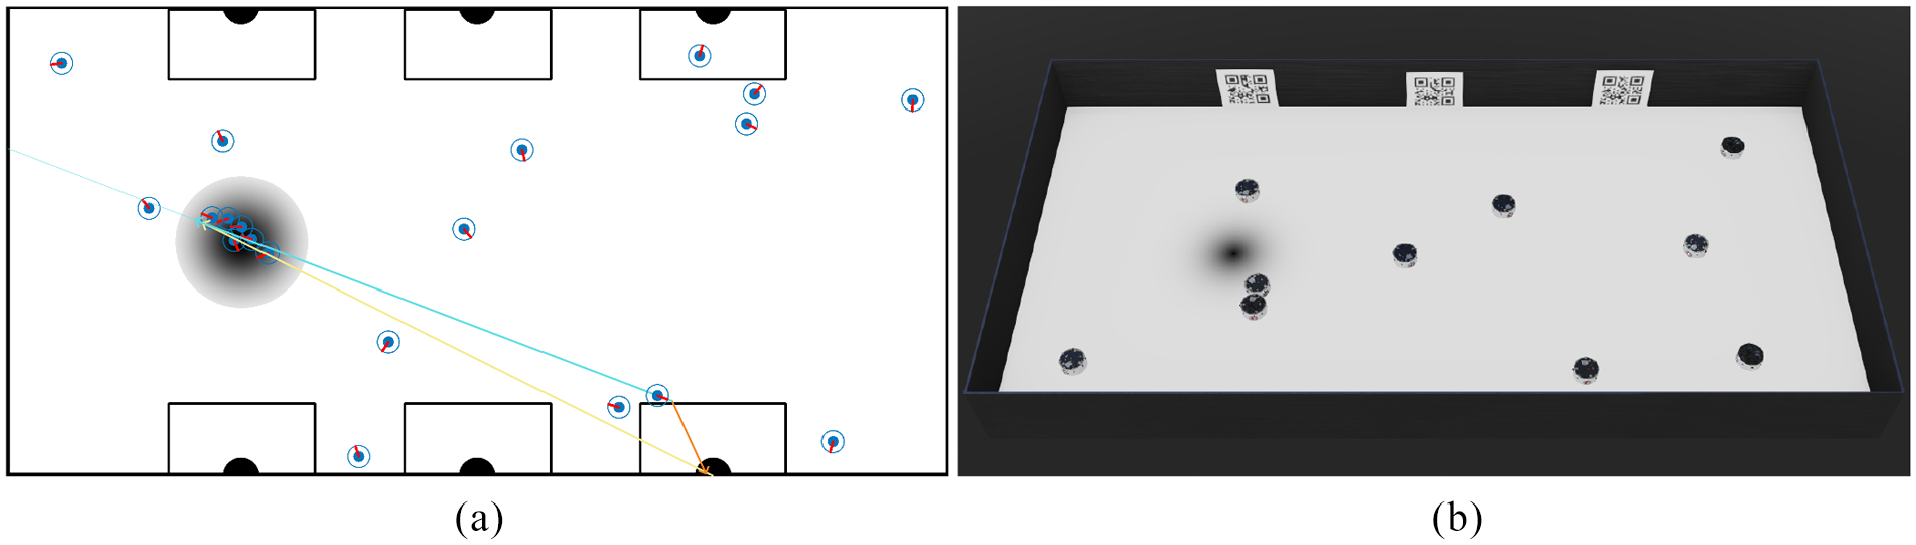
Simulation platforms. (a) The kinematic simulator. The light blue inner and outer circles represent a robot and sensing range of its sensors, respectively. The red line represents the direction of a robot. Six black semicircles represent the location of landmarks. The detectable region for the landmarks is represented by black rectangles. The cue is shown by a gray-black disk. (b) The realistic simulator. Robots and QR-codes are simulated realistically.
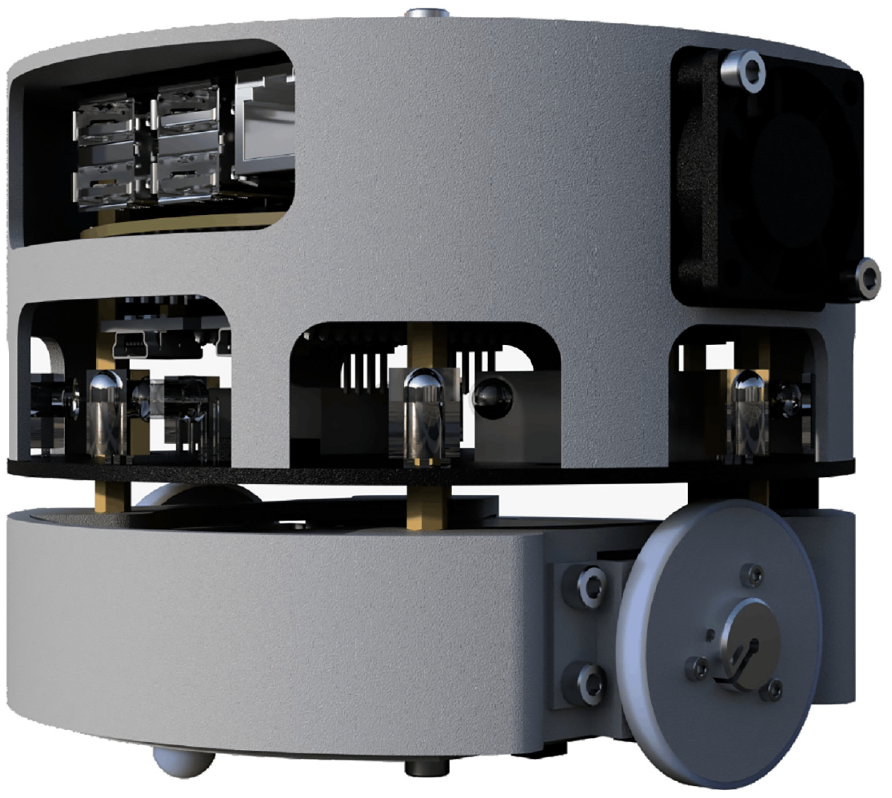
A picture of the Kobot robot CAD model. The Kobot robot has a diameter of 12 cm and a height of 11 cm.
A
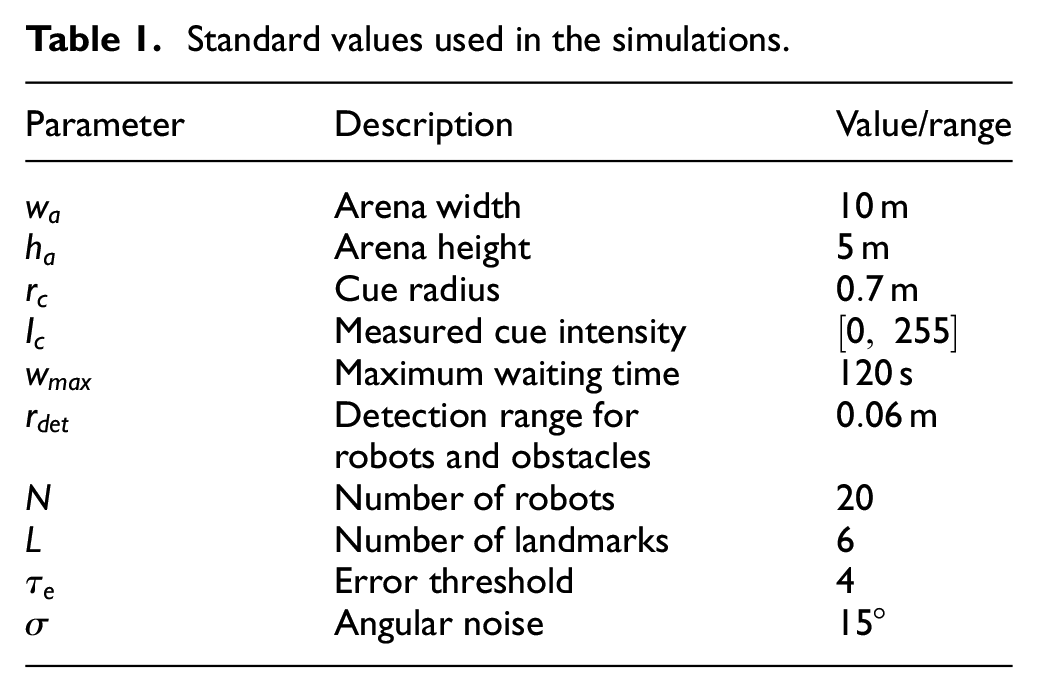
Standard values used in the simulations.
To illustrate various aspects of the proposed method, different experiments were implemented. All these experiments were repeated for a given number of Monte Carlo trials, to decrease the effect of unwanted factors on the evaluation, such as initial conditions and noise. More specifically, initial positions of robots within the arena followed a random distribution.
Evaluation of the non-adaptive LBA method: In these experiments, to study the LBA method without its adaptation capability, the error threshold was set to a very large number, such that error variables never reset, so that the LBA method became non-adaptive. The duration of the experiments was 80,000 s, and the cue was changed at 40,000 s. The static part of these simulations was taken longer than the other experiments to make sure that robots utilize all the landmarks during the first part of the experiments. Consequently, all the calculated total displacement vectors pointed to the wrong cue at “A,” as shown in Figure 2, in the second part of the simulation. This assumption was intentionally made to highlight the consequences of lack of adaptability for the LBA method.
Error threshold experiments: In these experiments, the effect of error threshold on the performance of the adaptive LBA method was investigated using
Noise experiments: In these experiments, the effect of noise on the performance of the adaptive LBA method was investigated using
Population size experiments: In these experiments, the effect of population size was studied as in Arvin et al. (2016) using
Cue size experiments: In these experiments, the effect of cue size was investigated using
3.2. Realistic simulations
In realistic simulations, shown in Figure 3(b), all the actuators and sensors of Kobots were modeled using the Webots simulator (Michel, 2004). No robot had access to any global information of either itself or other robots, and all the processing was done on board. Static experiments were performed using 10 simulated Kobot robots with a duration of
During the experiments, fiducial markers, in particular, QR-codes were used as the landmarks. The advantage of using QR-codes is that they can easily be detected by readily available computer vision libraries using a simple complementary metal–oxide–semiconductor (CMOS) camera in a fairly robust way even when they are partially visible (Liu et al., 2008). Relative distance and orientation information can be extracted from QR-codes using Perspective-n-Point (PnP) algorithms with low computational requirements, and all these can easily be implemented in a real-world scenario. Therefore, during realistic simulations, 2D images of QR-codes with a size of
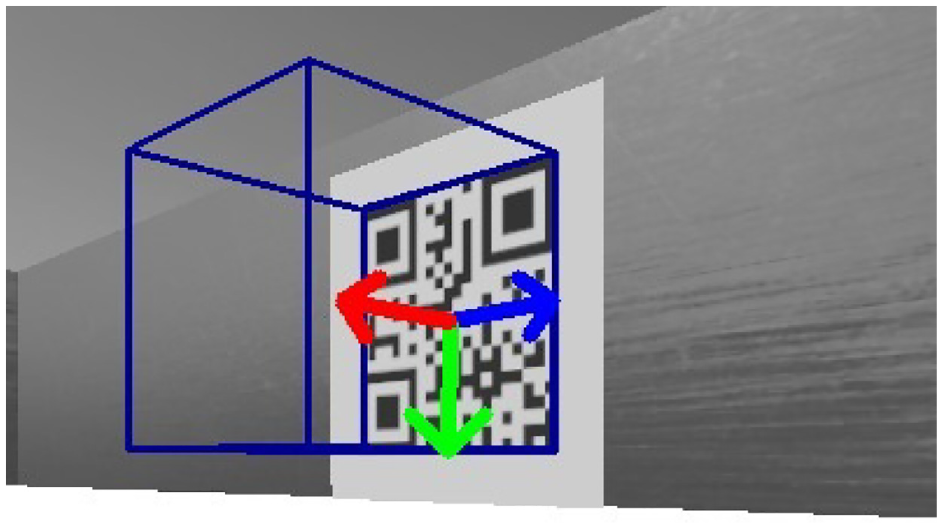
A snapshot of a QR-code in Webots. QR-codes are implemented as 2D images attached to the boundaries of the arena. The QR-code is detected using the OpenCV library implemented in Webots. The relative position and orientation of the QR-code are determined using the PnP algorithm.
During the experiments, images were acquired by a camera installed on each robot. If a QR-code was present in the image, its ID, relative position, and orientation were obtained using the QRCodeDetector() function of the OpenCV library (Baggio et al., 2012). The vector
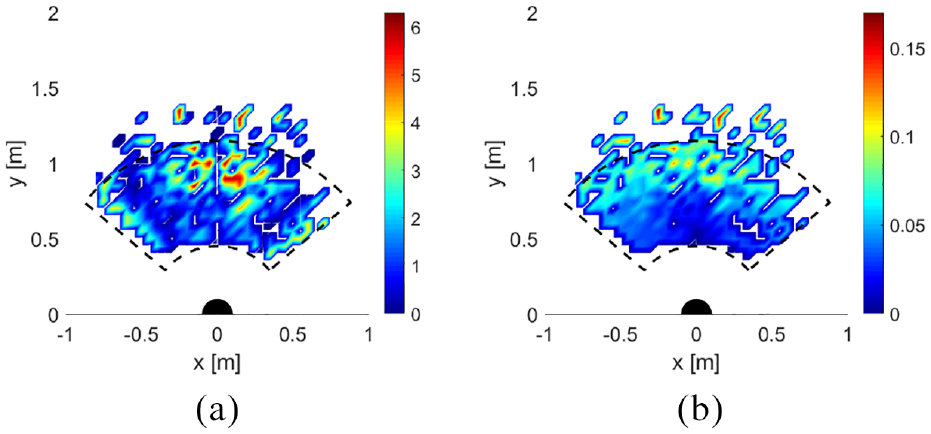
The error caused by image processing of a QR-code for different points of the arena. The QR-code (shown by the black half disk) was not detectable from the white points. The black dashed lines show the approximate bounds of the detectable area of the QR-code. (a) Angular error of the measured relative orientation compared to the actual orientation. (b) Distance error of the measured relative distance compared to the actual distance.
3.3. Metrics
As of the performance metric, the normalized aggregation size (NAS), which is the number of robots aggregated on the cue divided by the population size, was used. For some experiments, the time evolution of the metric was shown to illustrate the transient behavior of the methods. For the others, the steady-state value of the metric was taken into account by averaging the last 100 samples of the metric. In this regard, the steady state was assumed to be reached when the metric value reached and settled within the 5% range of its mean value of the last 500 samples.
4. Results and discussions
4.1. Kinematic simulations
4.1.1. Evaluation of the non-adaptive LBA method
The results of these experiments are depicted in Figure 7. In the first part of the experiment, with the LBA method, NAS reaches almost 0.8, whereas it is 0.3 with the BEECLUST method. In the second part of the experiment in which the position of the cue changed from “A” to “B” as shown in Figure 2, NAS decreases dramatically reaching almost 0 for both methods. The BEECLUST method recovers faster than the LBA method, both attaining an NAS of 0.3. As already mentioned, to give enough time for all the robots to utilize all the landmarks to learn the location of the cue, the cue changed at
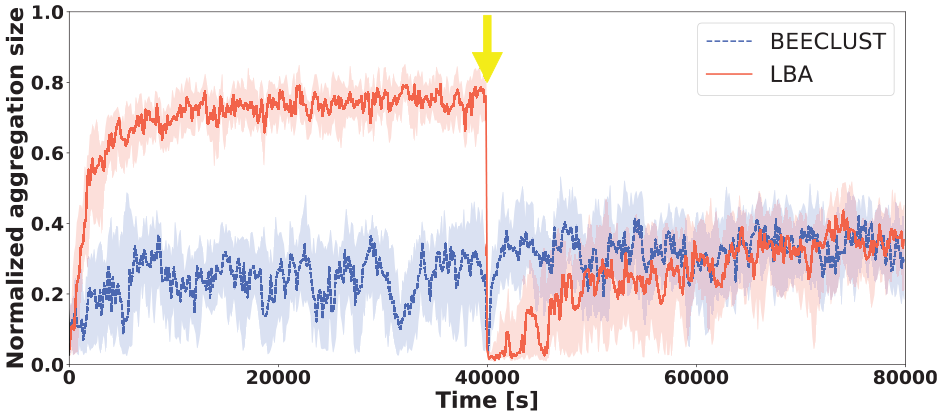
Non-adaptive LBA method experiments. The normalized aggregation size for the non-adaptive LBA and BEECLUST methods. The duration of the experiment is
With the LBA method, robots are able to use the landmarks in the environment making them “learn” the location of the cue and aggregate rapidly on the cue around
To show the underlying differences between the LBA method and the BEECLUST method, the heat maps of the static part
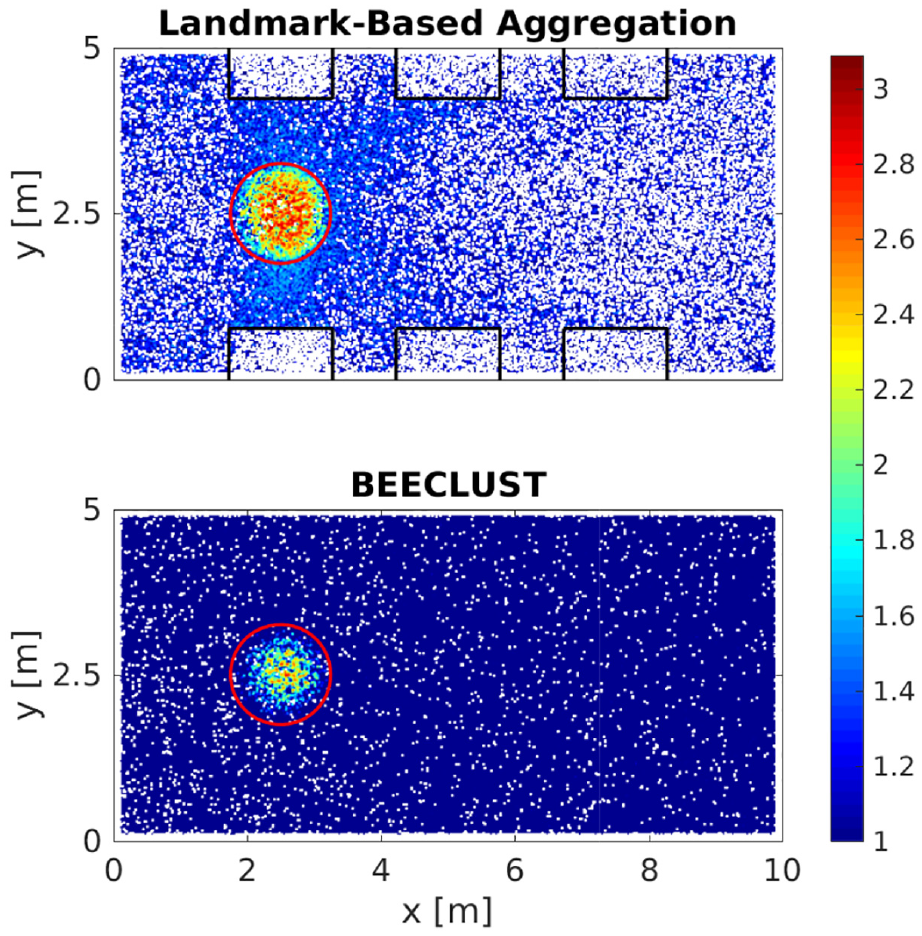
Non-adaptive LBA experiments. Heat maps of a randomly selected experiment of the non-adaptive LBA method (top) and the BEECLUST method (bottom). Positions of the robots are accumulated during
4.1.2. Error threshold experiments
In these experiments, the effect of error threshold on the adaptability of the LBA method is investigated in a dynamic environment. Time evolution of the NAS values is depicted in Figure 9(a) for the LBA
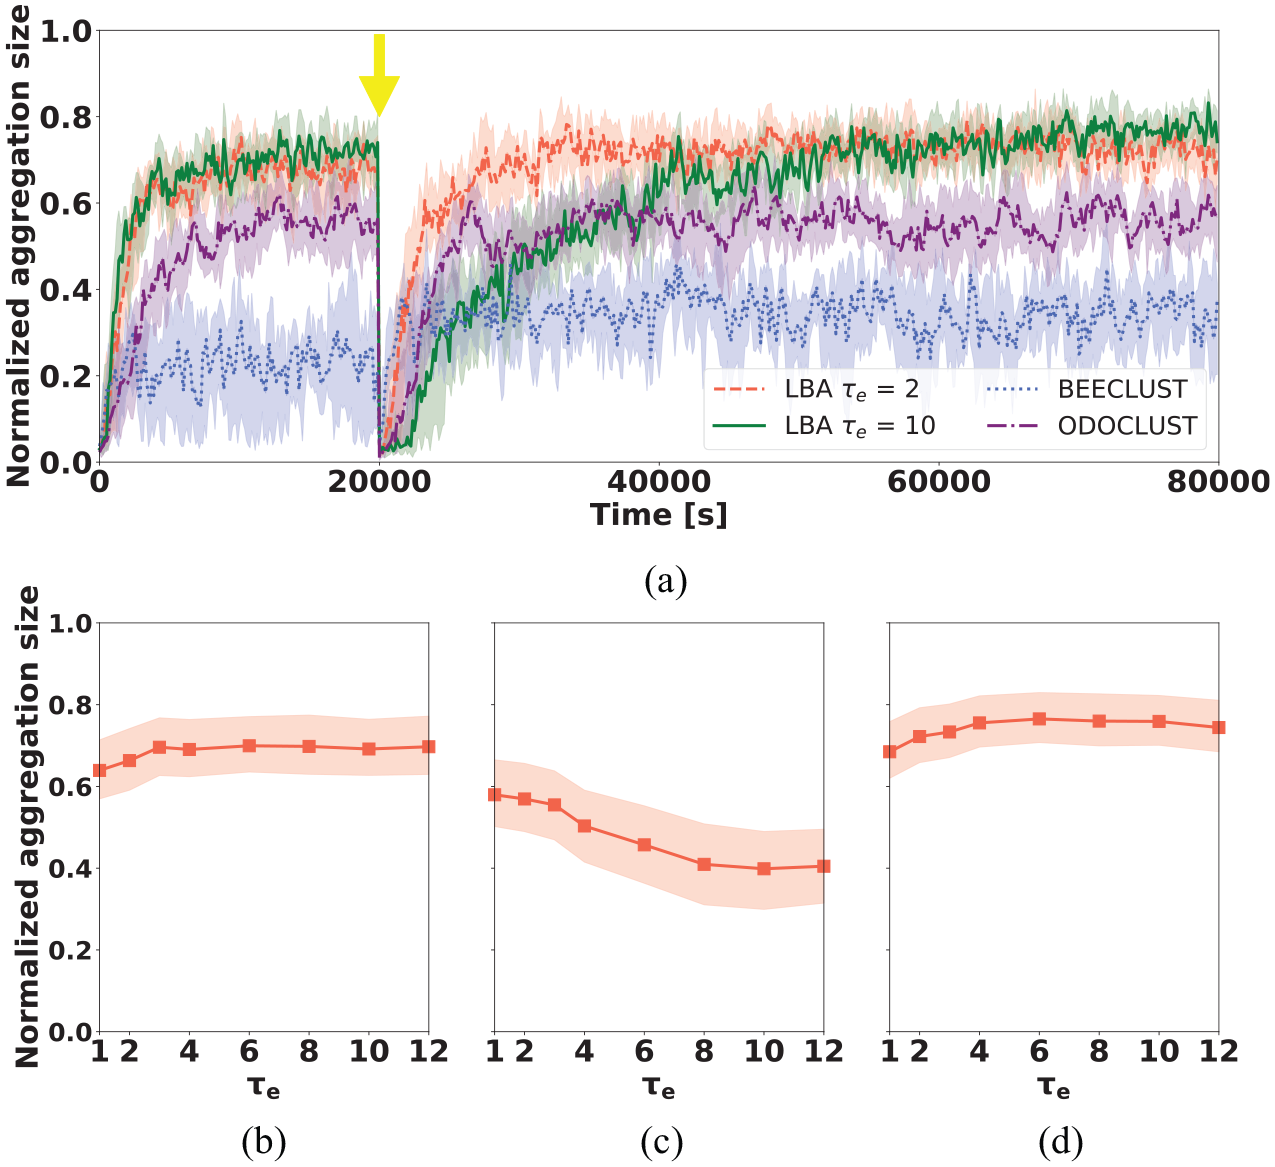
Error threshold experiments. The normalized mean aggregation size for the adaptive LBA method for (a)
The error threshold changes the behavior of the LBA method drastically. In the static part of the experiment
4.1.3. Noise experiments
In these experiments, the effect of noise on the performance of the LBA method is analyzed in a static environment and the steady-state results are depicted for
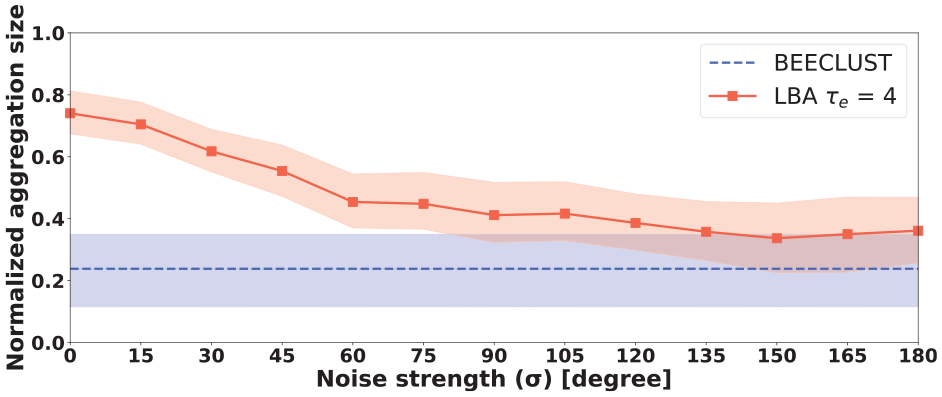
Noise experiments. The steady-state normalized mean aggregation size for the adaptive LBA (red solid line) and BEECLUST (blue dashed line) methods. For the adaptive LBA method, the noise is taken as
As discussed in the previous section, noise has a negative effect on the performance of the LBA method. Although the overall performance decreases, it can still be compensated by the error threshold. Increasing the error threshold as shown in Figure 9(b) increases the performance when the noise is constant. The advantage of the BEECLUST method is that it is totally robust against noise albeit its low performance when compared to the LBA method. It can be deduced that when
4.1.4. Population size experiments
In population size experiments, the size of the arena is kept fixed and the number of robots is increased from 5 to 45, and the steady-state NAS values are depicted in Figure 11 for the LBA and BEECLUST methods. For the LBA method, the NAS values increase reaching 0.7 and then decrease to 0.6 as the number of robots increases. For the BEECLUST method, the trend is somehow different; the NAS value increases from a very small value, 0.1–0.4, where it is saturated as the number of robots increases.
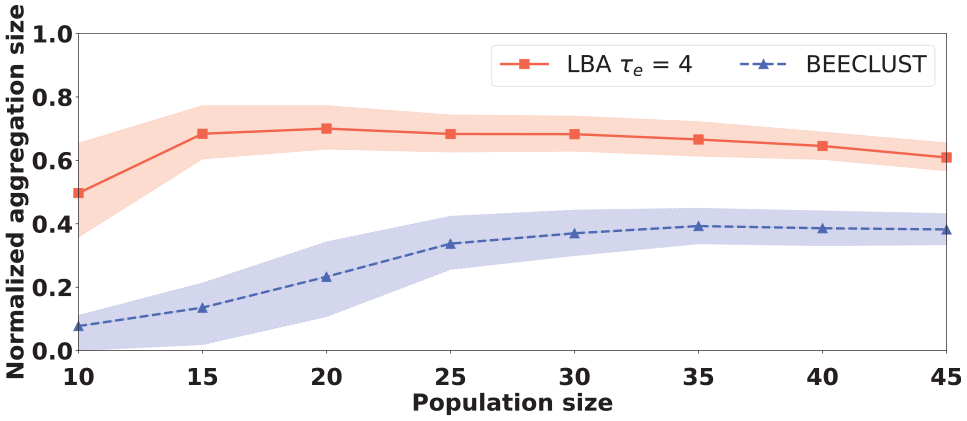
Population size experiments. The steady-state normalized mean aggregation size for the adaptive LBA (red solid line) and BEECLUST (blue dashed line) methods. The population size is taken as
When the LBA method is considered, increasing the population size (or the density of robots) increases its performance (up to 20 robots) and then the performance saturates and starts to decrease slowly as the size increases. The performance increase is expected since a robot needs another robot to calculate the displacement vector (so that robot learns its way from the landmark to the cue) and to wait on the cue (so that aggregation happens) else the robot does not make intensity measurement and misses the cue as shown in the last part of Algorithm 2. So, when the number of robots increases, there is a higher chance for a robot to meet another robot increasing the learning rate and performance of the method. The reason behind the decrease in performance is more subtle; when the population size is larger than a certain value, the probability of encounter with another robot off-the-cue increases. And if a robot is moving toward the cue using the total displacement vector, it would stop, measure the cue intensity (that would be 0 since it is an off-the-cue encounter), turn randomly, and move toward this random direction instead of going straight to the cue, decreasing the performance of the LBA method. However, when the BEECLUST method is considered, increasing the population size increases the performance reaching an NAS value of 0.3. The reason for the increase in performance is the increased probability of encounters of the robots on the cue. The performance saturates around 0.3 due to the overcrowding of robots in the arena. The performance difference between the two methods is more prominent in low densities (or low population size). High robot density hinders the performance of the LBA method due to overcrowding, preventing to use environmental information.
4.1.5. Cue size experiments
In the cue size experiments, the size of the arena is fixed, yet the size of the cue is increased from 0.25 to 10, and the steady-state NAS values are depicted in Figure 12 both for the LBA and BEECLUST methods. When the cue size increases, the performance of the LBA method increases sharply, saturating at
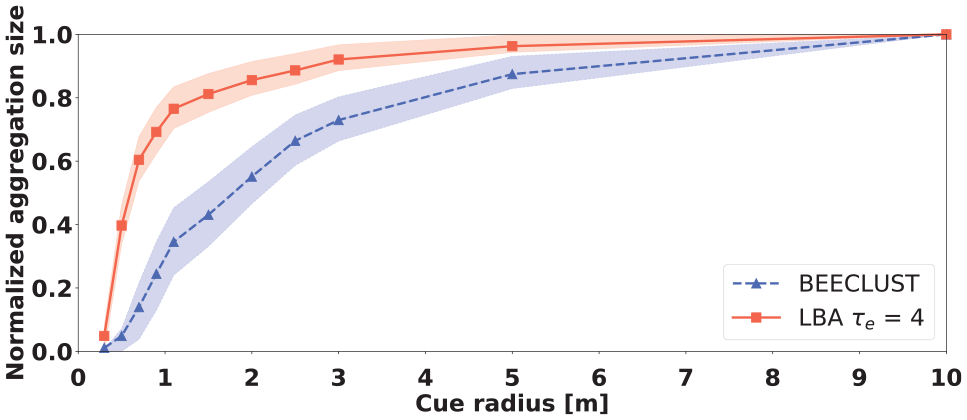
Cue size experiments. The steady-state normalized mean aggregation size for the adaptive LBA (red solid line) and BEECLUST (blue dashed line) methods. The cue radius is taken as
When the LBA method is considered, the increase in the cue size increases the probability of finding the cue. This increases both the learning rate of total displacement vectors and the probability of finding another robot on the cue causing a rapid increase in the performance as seen in Figure 12. Since the performance of the BEECLUST method solely depends on the random encounters of robots on the cue, increasing the size of the cue increases the number of robots on the cue, hence increasing the performance of the BEECLUST method. The rate of performance increase is higher for the LBA method since it also utilizes environmental information. The last point to note is that the performance difference between the two methods decreases, similar to the population size experiments, as the cue size increases. In the limiting case, performance of the BEECLUST method catches that of the LBA method. That is an expected result, since when the cue radius is
4.2. Realistic simulation
These simulations are performed to illustrate the applicability of the LBA method in a realistic setting using the simulated models of all actuators and sensors, including the camera, as discussed in the previous section. Due to heavy computational load, a systematic investigation of all parameters has not been performed using realistic simulations; instead, a representative set of values is investigated, and the results for the LBA and BEECLUST methods are depicted in Figure 13. Both methods show a similar trend, though the LBA method performs better than the BEECLUST method. The kinematic and realistic simulation results are very similar, showing that the kinematic simulations are reliable.
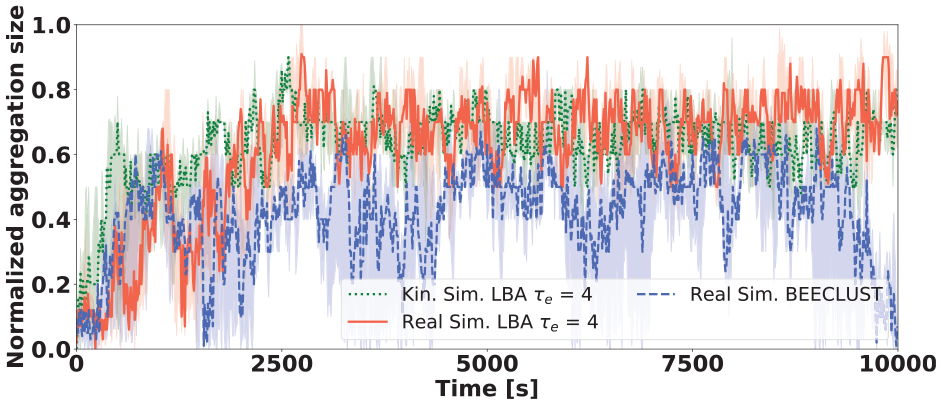
Realistic experiments. The time evolution of the normalized mean aggregation size for the adaptive LBA method with the realistic simulation (red solid line) and with the kinematic simulation (green dotted line) and the BEECLUST method with the realistic simulation (blue dashed line). The population size is
One of the main concerns in realistic simulations is the noise. Since there is noise inherently in actuation and sensing of robots in realistic simulations, noise was not added artificially during the simulations. The noise in detecting the QR-codes affects both the estimation of the relative orientation of the QR-codes
In both plots, there are regions shown in white indicating that the positions where the robot was not able to detect the QR-code. When the angular error is considered, a symmetric pattern of positive and negative relative angles is observed. The heat map is mostly blue indicating that the angular error is relatively small, almost below 2. Moreover, the detectable region has a bow shape, and the range is from
Realistic simulation errors.
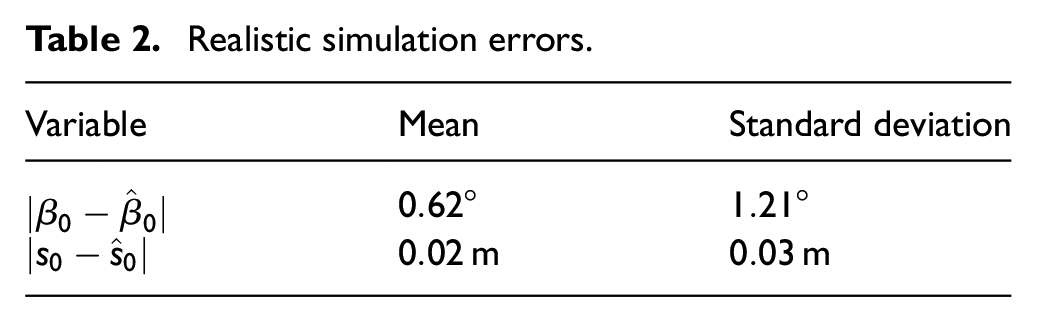
In both the plots, the maximum error is observed around the central axis of the detectable region that is furthest from the QR-code. Since the angle is calculated using the slope of the vertical lines of the rectangle on the periphery of the QR-code, a few-pixel error causes a big change in the slope for very small relative angles resulting in larger errors than the moderate relative angles. Finally, the undetectable points (white regions) can be categorized into three groups: (1) those which are too close to the landmark, where the camera could not capture the whole QR-code; (2) the points which are too far from the QR-code, and due to the limited resolution of the image, the detection is not achieved; and (3) the regions having a larger relative angle with respect to the QR-code.
5. Conclusion and future work
In this article, a new aggregation method was proposed based on the BEECLUST algorithm. The proposed method added the capability of using landmarks for navigation. Triggered by landmarks, robots recall their memories to move toward the cue. The experiments supported the idea that compared to the BEECLUST, the LBA method makes robots to wander less off-the-cue, and to move toward the cue as soon as they meet a landmark. It was proven that exploiting the data of the landmarks significantly increases the aggregation performance, when the environment is static. In a dynamic environment, however, the situation was more challenging. The dynamic feature of such environments makes the old information not valid anymore; hence, relying on outdated data is detrimental to the aggregation performance. The concept of the adaptive algorithm is introduced to cope with this challenge by using an error variable and a corresponding error tolerance threshold. By so doing, the proposed method reacts to the changes in the environment, makes the robots able to erase the wrong perceptions of the environment, and subsequently updates them. By evaluating the performance of the LBA method in dynamic environments, it was revealed that the proposed method was more adaptive to the environment changes than the BEECLUST method. Thus, it was concluded that the proposed method not only outperformed the original BEECLUST method in stationary environments but also was able to adapt faster to the changing environment. Hitherto, we draw the conclusion that for a dynamic environment, non-adaptive LBA is not able to aggregate the swarm, thus considering the adaptive feature of the method is inevitable.
The study on different error threshold parameters,
Similar to another study by Arvin et al. (2016), on the effect of the population density, the results bore the conclusion that the BEECLUST method lacks a proper performance in low-density swarms. More than that, the difference between the LBA method and the BEECLUST method widened for the swarms with low-density populations. Thus, an important conclusion to be made here is the fact that in such cases, adopting the LBA method significantly increases the performance. In the sample experiment, the amount of increase was so much that even a 4 times denser swarm of robots with the BEECLUST method could not outperform the LBA method. As one of the most main conclusions of this article, compared to increasing the number of robots with the BEECLUST method, equipping robots with the LBA method costs less, yet performs better.
The effect of cue size on the aggregation performance was also studied in the last investigation which reflected the fact that in an environment with low density of cue, exploiting the environmental information plays a vital role in the aggregation performance of robots. Therefore, in an environment with low probability of finding the cue, storing data and referring to them can considerably boost the aggregation performance.
As a future work, the implementation of the LBA method on real robots will be investigated. More than that, the advantage of using an artificial neural network–based algorithm will help the method to estimate the center of the cue to increase the probability of collision. Furthermore, the possibility of sharing information via a pheromone-based communication system might help the swarm to increase the performance of aggregation. Another important aspect is to analyze the number, distribution, and position of landmarks and their effects on the aggregation performance as a future study. Besides, the presence of static or dynamic obstacles was not considered in this work. In future works, stationary and moving objects will be added to the scenario, and the performance of the proposed method will be evaluated under these new circumstances. Last but not the least, for all the aforementioned studies, meta-heuristic algorithms such as genetic algorithms might be used to automate the design of the controllers.
Footnotes
Handling Editor: Hiroyuki Iizuka, Hokkaido University, Japan
Declaration of Conflicting Interests
The author(s) declared no potential conflicts of interest with respect to the research, authorship, and/or publication of this article.
Funding
The author(s) received no financial support for the research, authorship, and/or publication of this article.
Supplemental material
Supplemental material for this article is available online.
About the Authors
References
Supplementary Material
Please find the following supplemental material available below.
For Open Access articles published under a Creative Commons License, all supplemental material carries the same license as the article it is associated with.
For non-Open Access articles published, all supplemental material carries a non-exclusive license, and permission requests for re-use of supplemental material or any part of supplemental material shall be sent directly to the copyright owner as specified in the copyright notice associated with the article.