
Abstract
High frequency hearing loss (HFHL), often related to hazardous noise, affects one in six U.S. adolescents. Yet, only 20 states include school-based hearing screens for adolescents. Only six states test multiple high frequencies. Study objectives were to (1) compare the sensitivity of state school-based hearing screens for adolescents to gold standard sound-treated booth testing and (2) consider the effect of adding multiple high frequencies and two-step screening on sensitivity/specificity. Of 134 eleventh-grade participants (2013–2014), 43 of the 134 (32%) did not pass sound-treated booth testing, and 27 of the 43 (63%) had HFHL. Sensitivity/specificity of the most common protocol (1,000, 2,000, 4,000 Hz at 20 dB HL) for these hearing losses was 25.6% (95% confidence interval [CI] = [13.5, 41.2]) and 85.7% (95% CI [76.8, 92.2]), respectively. A protocol including 500, 1,000, 2,000, 4,000, 6,000 Hz at 20 dB HL significantly improved sensitivity to 76.7% (95% CI [61.4, 88.2]), p < .001. Two-step screening maintained specificity (84.6%, 95% CI [75.5, 91.3]). Adolescent school-based hearing screen sensitivity improves with high frequencies.
High frequency hearing loss (HFHL, ≥3,000 Hz), which is often associated with hazardous noise exposures, affects one in six adolescents in the United States (Henderson, Testa, & Harnick, 2011; Niskar et al., 2001; Shargorodsky, Curhan, Curhan, & Eavey, 2010). In comparison, young children more often have low frequency hearing loss, associated with otitis media, effusions, and wax impaction (Harlor, Bower, Committee on Practice and Ambulatory Medicine, & Section on Otolaryngology-Head and Neck Surgery, 2009; Maxson & Yamauchi, 1996; Niskar et al., 1998). School-based hearing screens have historically focused on the low frequency, speech-related hearing losses more common in young children (Sekhar, Zalewski, & Paul, 2013). The impact of missed hearing loss is substantial; it is estimated 30% of students with unilateral hearing loss and 37% of those with minimal sensorineural hearing loss will repeat a grade (American Academy of Audiology [AAA], 2011). Young students with mild hearing loss may be misdiagnosed with attention deficit disorder, learning disabilities, and behavioral problems (AAA, 2011).
However, most school-based hearing screen protocols do not account for the changing epidemiology of hearing loss, specifically increases in adolescent HFHL. HFHL is insidious in its early stages, and parents and adolescents are known to provide poor self-report of hearing-related symptoms (Meinke & Dice, 2007; Stewart et al., 1999). Studies of adult work-related occupational noise-induced hearing loss demonstrate impaired social interactions and limited workplace advancement (Hétu, Getty, & Quoc, 1995). Yet, once identified, noise-induced HFHL progression is preventable by limiting hazardous noise exposures (AAA, 2011; Meinke, 2011; Meinke & Dice, 2007). As of 2012, school-based hearing screening was required in 34 states, but only 20 states included screening for adolescents (Sekhar et al., 2013). While all school pure tone audiometry-screening protocols included one high frequency test point (4,000 Hz), only six states had recommendations for the addition of 6,000 and/or 8,000 Hz. Tennessee, Missouri, Mississippi, and Maine recommended the inclusion of these high frequencies. Kansas required inclusion of 6,000 Hz for fourth grade and above, and Colorado required 6,000 Hz be added for testing sixth grade and above (Sekhar et al., 2013). Objective data are limited on the best protocol to detect adolescent hearing loss.
Screening tests must balance sensitivity and specificity. Sensitivity is the proportion of adolescents with hearing loss who correctly screen positive. Specificity is the proportion of normal hearing adolescents who correctly screen negative (Gordis, 2000). As sensitivity increases by adding high frequency test points, the opportunity for error and false-positive results increases, reducing specificity. Thus, the study objectives were to determine (1) the sensitivity of current state school-based hearing screens for adolescent hearing loss compared to testing in a sound-treated booth as the “gold standard” and (2) if adding multiple high frequencies significantly improves sensitivity, can two-step screening of initial referrals reduce false-positive results (maintaining specificity). Hearing screening is conducted regularly in thousands of U.S. schools. As a large amount of time and effort is invested in this endeavor, optimizing and standardizing hearing screens using objective evidence will ensure results are valid and reliable.
Method
Participants
This was a within-subjects design involving 11th graders at a public high school (Lebanon, PA). Parents/guardians of the 309 upcoming 11th graders received a letter in August 2013 regarding the study. Eleventh grade was selected, as the Pennsylvania Department of Health (PA DOH) mandates hearing screens at this grade level, so the study (detailed below) was anticipated to be well accepted (DOH, 2011). The letter described the study process, which involved two screening rounds and gold standard testing in a mobile sound-treated booth, with the option to decline participation. This study was approved by Penn State College of Medicine’s Human Subjects Protection Office and the school district superintendent.
Nurse Training
Our Department of Nursing assists with school health screenings and agreed to administer the study hearing screen with other PA DOH-mandated health screens (i.e., state hearing screen, vision screen, body mass index screen). All nurses participating in the high school hearing screen underwent an orientation with a state-licensed audiologist. The orientation reviewed use of the audiometer, headphones, and the study hearing screen. The study hearing screen was a threshold test at 250, 500, 1,000, 2,000, 3,000, 4,000, 6,000, and 8,000 Hz using pulsed pure tones (Sekhar et al., 2011; Sekhar et al., 2014; Sekhar et al., 2016). Threshold testing identified the lowest intensity participants could positively respond to a tone in two of the three trials. Testing began at 1,000 Hz and 30 dB HL. The signal intensity was decreased in 10 dB HL steps until the tone was inaudible, and then increased in 5 dB HL increments to establish the threshold level (DOH, 2011; Sekhar et al., 2011; Sekhar et al., 2014; Sekhar et al., 2016). This hearing “threshold” in dB HL was marked on the audiogram at each tested frequency. The audiogram was then used to determine the sensitivity and specificity of various frequency and decibel-level combinations compared to the gold standard results obtained in the sound-treated booth during Round 2 (Table 1). Background noise was quantified in the study by either A-weighted or C-weighted noise measurements, which are standard audiology measurements for ambient noise. The octave band measurements in Round 2 provide information on background noise by frequency.
Standard 2 × 2 Table to Calculate Sensitivity and Specificity of Various Hearing Screen Protocols With Testing in a Sound-Treated Booth as the Gold Standard.a
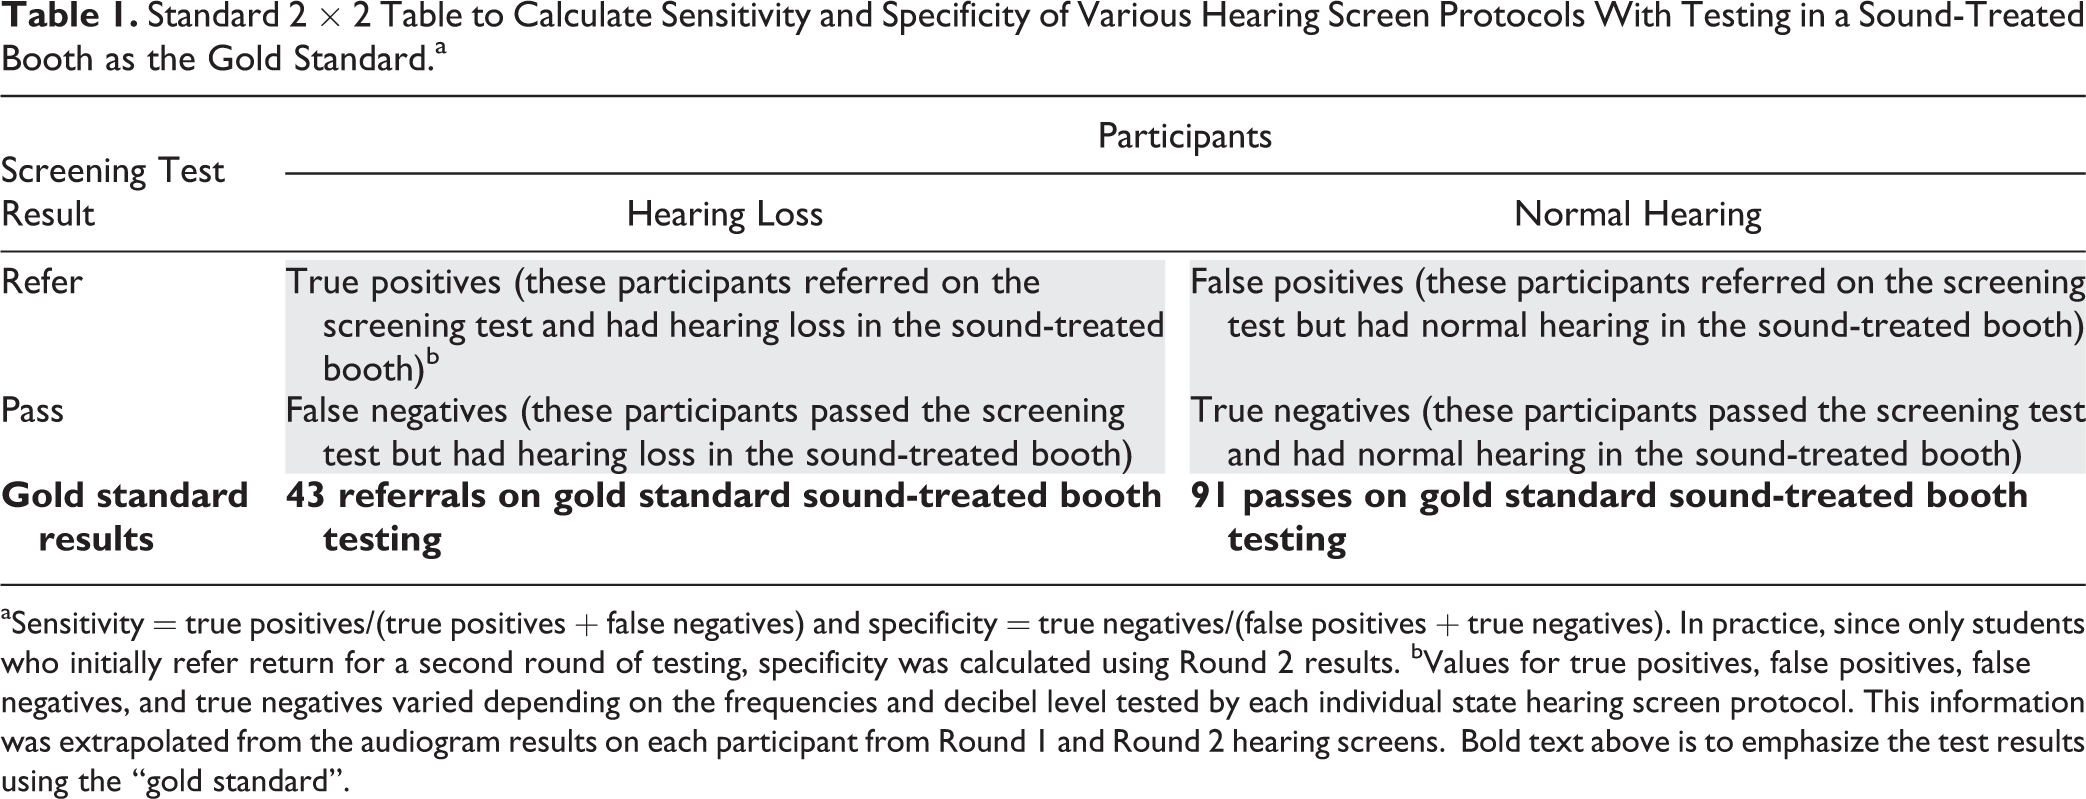
aSensitivity = true positives/(true positives + false negatives) and specificity = true negatives/(false positives + true negatives). In practice, since only students who initially refer return for a second round of testing, specificity was calculated using Round 2 results. bValues for true positives, false positives, false negatives, and true negatives varied depending on the frequencies and decibel level tested by each individual state hearing screen protocol. This information was extrapolated from the audiogram results on each participant from Round 1 and Round 2 hearing screens. Bold text above is to emphasize the test results using the “gold standard”.
Study Design
Round 1 study hearing screens were conducted in the school library using school audiometers with standard TDH-39 headphones. Exhaustive calibration was performed by a certified National Association of Special Equipment Distributors (NASED) technician. Eight screening stations ran simultaneously, set up in between library stacks to minimize background noise, which may significantly impact results (DOH, 2011; Lo & McPherson, 2013). Background noise during Round 1 was quantified by C-level, sound-level measurements taken by a state-licensed audiologist. Initial Round 1 measurements averaged 50 dB C and intermittently increased to around 65 dB C, exceeding acceptable ambient noise levels for screening environments (Killion & Studebaker, 1978). Screeners were instructed to begin testing in either the right or left ear to minimize the effect of fatigue on results. Prior to screening, a state-licensed audiologist and an audiology extern reviewed the study hearing screen with the nurses (Sekhar et al., 2016).
Round 1 study hearing screens were reviewed by two state-licensed audiologists with discrepancies resolved by a third. Letters were mailed to the parents/guardians of all participants detailing hearing screen results and the option to return for a second round of testing. A 1-800 line was established for parents/guardians to provide consent, decline further study involvement, or ask questions. All Round 1 referrals who did not respond and a subset of passes were contacted to consent for Round 2 testing. Referrals were advised to seek follow-up with their primary care provider, especially if they declined retesting with the research study (Sekhar et al., 2016).
Round 2 involved a repeat of the study hearing screen and pure tone threshold testing in a mobile sound-treated booth (for a gold standard comparison) and was completed over 3 days to afford the highest probability of participation. Participants repeated the study hearing screen in a conference room with two study nurses who completed training with the same state-licensed audiologist from the initial orientation. This was followed by testing in one of two custom-made (Healthcare Enterprises, Inc., Hermitage, PA) mobile sound-treated booths. The manufacturer’s specification indicates the booths can test as low as 500 Hz (the 250 Hz tone could not be tested). Round 2 sound-level readings by octave band 1/1 (A-weighted) were taken by booth technicians with certification by the Council for Accreditation in Occupational Hearing Conservation. Two readings were taken on each test date either at different locations or at different times within the conference room and the sound-treated booths used for Round 2 testing. Ambient noise measurements were acceptable in the conference room (< 35 dBA) and sound-treated booths (<17 dBA for 500–1,000 Hz and <12 dBA for ≥2,000 Hz, Occupational Safety & Health Administration). Round 2 hearing screen and sound-treated booth results were similarly reviewed by two state-licensed audiologists with discrepancies resolved by a third. Final results were based on sound-treated booth testing. Round 2 participants received a US$20 Walmart gift card. Follow-up recommendations were mailed to parents/guardians (Sekhar et al., 2016).
Audiogram Classification
Both rounds of testing used the same referral criteria. Participant results on Rounds 1 and 2 hearing screens and Round 2 sound-treated booth testing fell into one of the three categories: Category 1 (pass): all thresholds ≤ 25 dB HL Category 2 (refer): one or more thresholds > 25 dB HL in either ear at any frequency Category 3 (refer): identified if one or both ears met the following criteria for a noise-induced threshold shift, an audiogram finding that suggests hazardous noise exposure
thresholds ≤ 15 dB HL at 500 and/or 1,000 Hz
notching (a decline in hearing) at 3,000, 4,000, or 6,000 Hz at least 15 dB HL poorer than the better threshold at 500 or 1,000 Hz
recovery of at least 10 dB HL at 8,000 Hz compared to the poorest threshold at 3,000, 4,000, or 6,000 Hz (Meinke & Dice, 2007; Niskar et al., 2001; Sekhar et al., 2011; Sekhar et al., 2014; Sekhar et al., 2016).
Audiograms fitting Categories 2 and 3 were classified as Category 3.
Audiogram classifications were based on previously published work, PA school screen criteria (which uses 25 dB HL tones), and the necessity of providing participants a clear determination following testing (DOH, 2011; Sekhar et al., 2011; Sekhar et al., 2014; Sekhar et al., 2016). However, as stated above, the use of threshold testing as part of the study hearing screen afforded the opportunity to consider various state school-based hearing screen protocols and potential modifications to optimize sensitivity and specificity.
Statistical Analysis
Sample size calculations were based on a desired level of precision ± 0.15 for a 95% CI around the sensitivity of the study hearing screen, which required a total of 28 sound-treated booth failures. With the 20% prevalence of adolescent hearing loss (Sekhar et al., 2011; Shargorodsky et al., 2010), 140 participants completing both rounds of testing was the anticipated goal, which was predicted to provide at least 28 sound-treated booth referrals. This resulted in precision less than ± 0.15 for the 95% CI around the specificity due to the higher prevalence of sound-treated booth passes. This goal assumed a large percentage of referrals would return for Round 2 testing. Exact 95% binomial confidence limits were estimated for sensitivity and specificity using the sound-treated booth results as the gold standard. McNemar’s test for paired proportions was used to compare the sensitivities of the hearing screen protocols. Comparisons between those who did and did not return for testing with respect to demographic characteristics were evaluated using χ2 or Fisher’s exact tests (Sekhar et al., 2016).
Results
Demographics
Of the 309 eligible students, 248 completed Round 1, and 134 participants completed both Rounds 1 and 2. The overall sample was 51% male. The majority of participants self-identified as White (41%) and Latino (49%). Fewer Blacks returned for Round 2, but otherwise there was no difference among those who returned or did not by sex, race, or age (Table 2). Neither sex, race, nor age was associated with Round 1 hearing screen results, Round 2 hearing screen results, or sound-treated booth results (all p > .1).
Demographics of Study Participants.
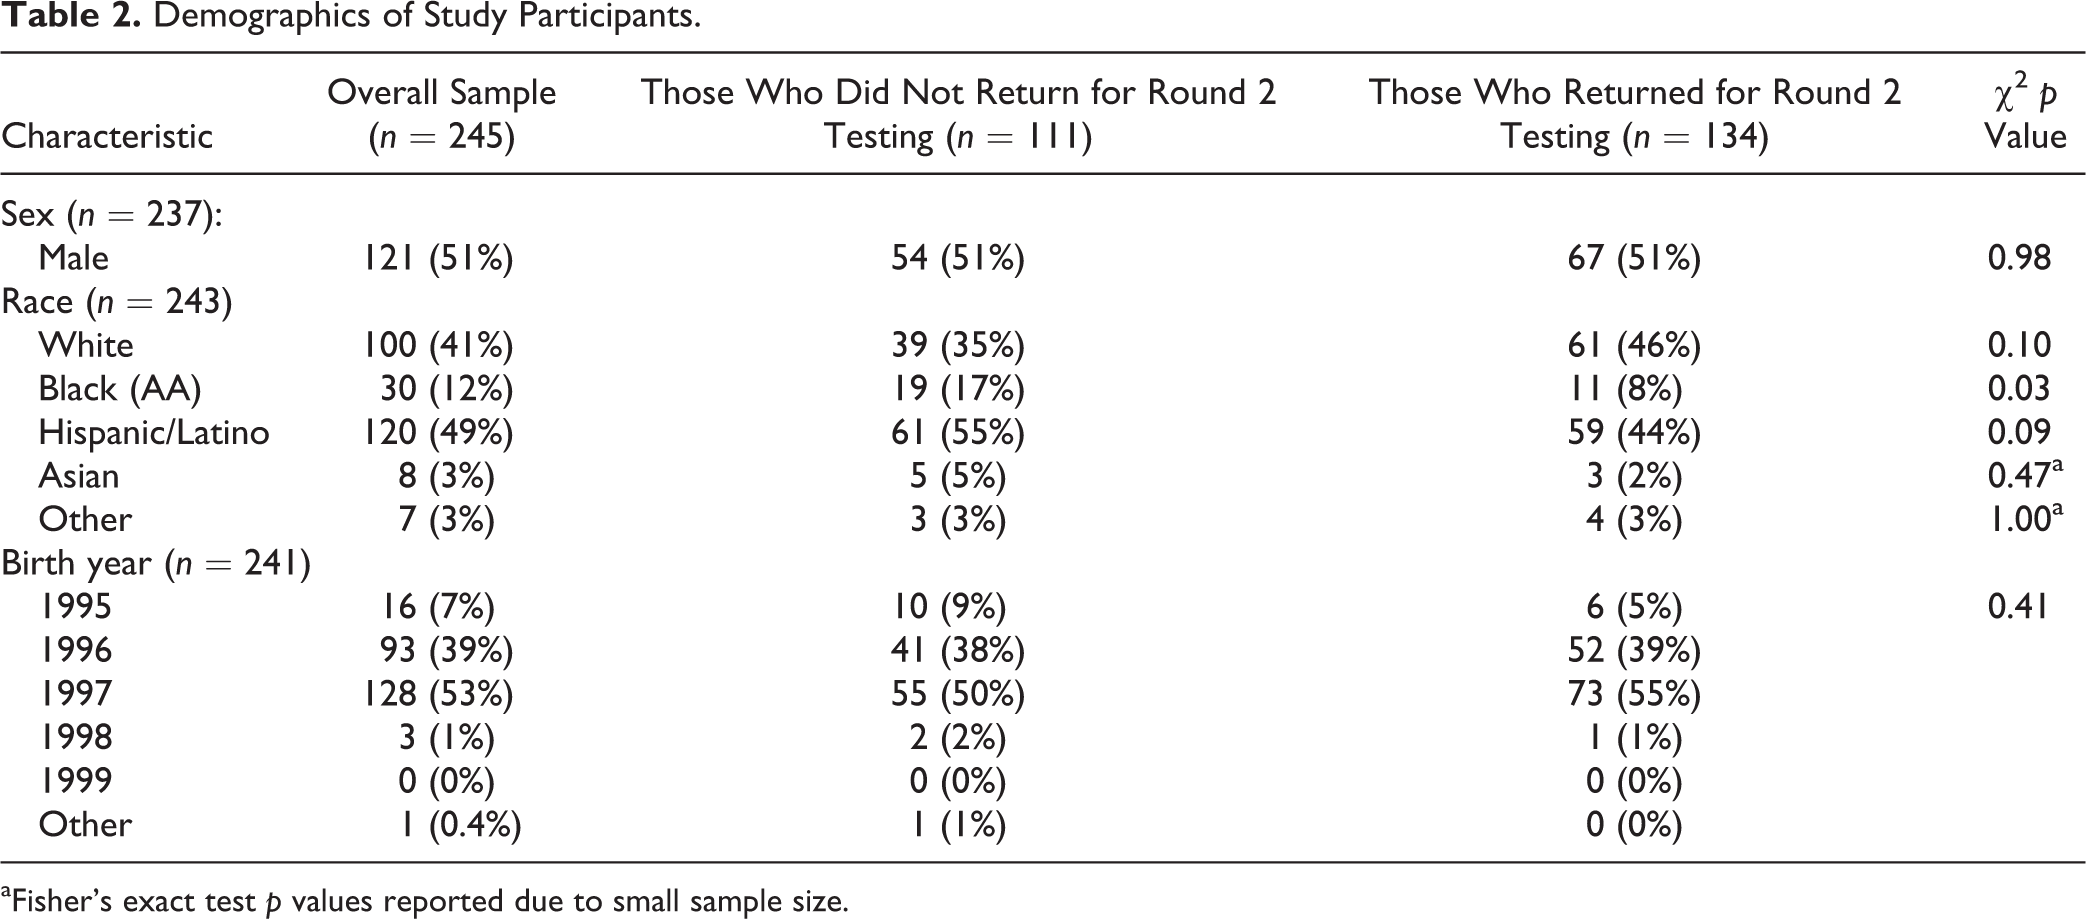
aFisher’s exact test p values reported due to small sample size.
Sensitivity and Specificity of Various Protocols
Of 134 participants tested in the sound-treated booth, 43 had results outside normal and met criteria for Categories 2 or 3. Specifically, 16 (37%) met Category 2 criteria, while 27 (63%) met Category 3 criteria. The most common state school-based hearing screen protocol tests at 1,000, 2,000, and 4,000 Hz at 20 dB HL and has a sensitivity of 25.6% (95% CI [13.5, 41.2]) and specificity of 85.7% (95% CI [76.8, 92.2]) after Round 1 testing for adolescent hearing loss (Table 3). After Round 2 testing, the specificity of this protocol was 100% (95% CI [96.0, 100]). Overall, testing conducted at 25 dB HL had lower sensitivity than testing at 20 dB HL.
Sensitivity and Specificity of Various State School-Based Hearing Screens to Detect Adolescent Hearing Loss Using Threshold Testing in a Sound-Treated Booth as the Gold Standard.a
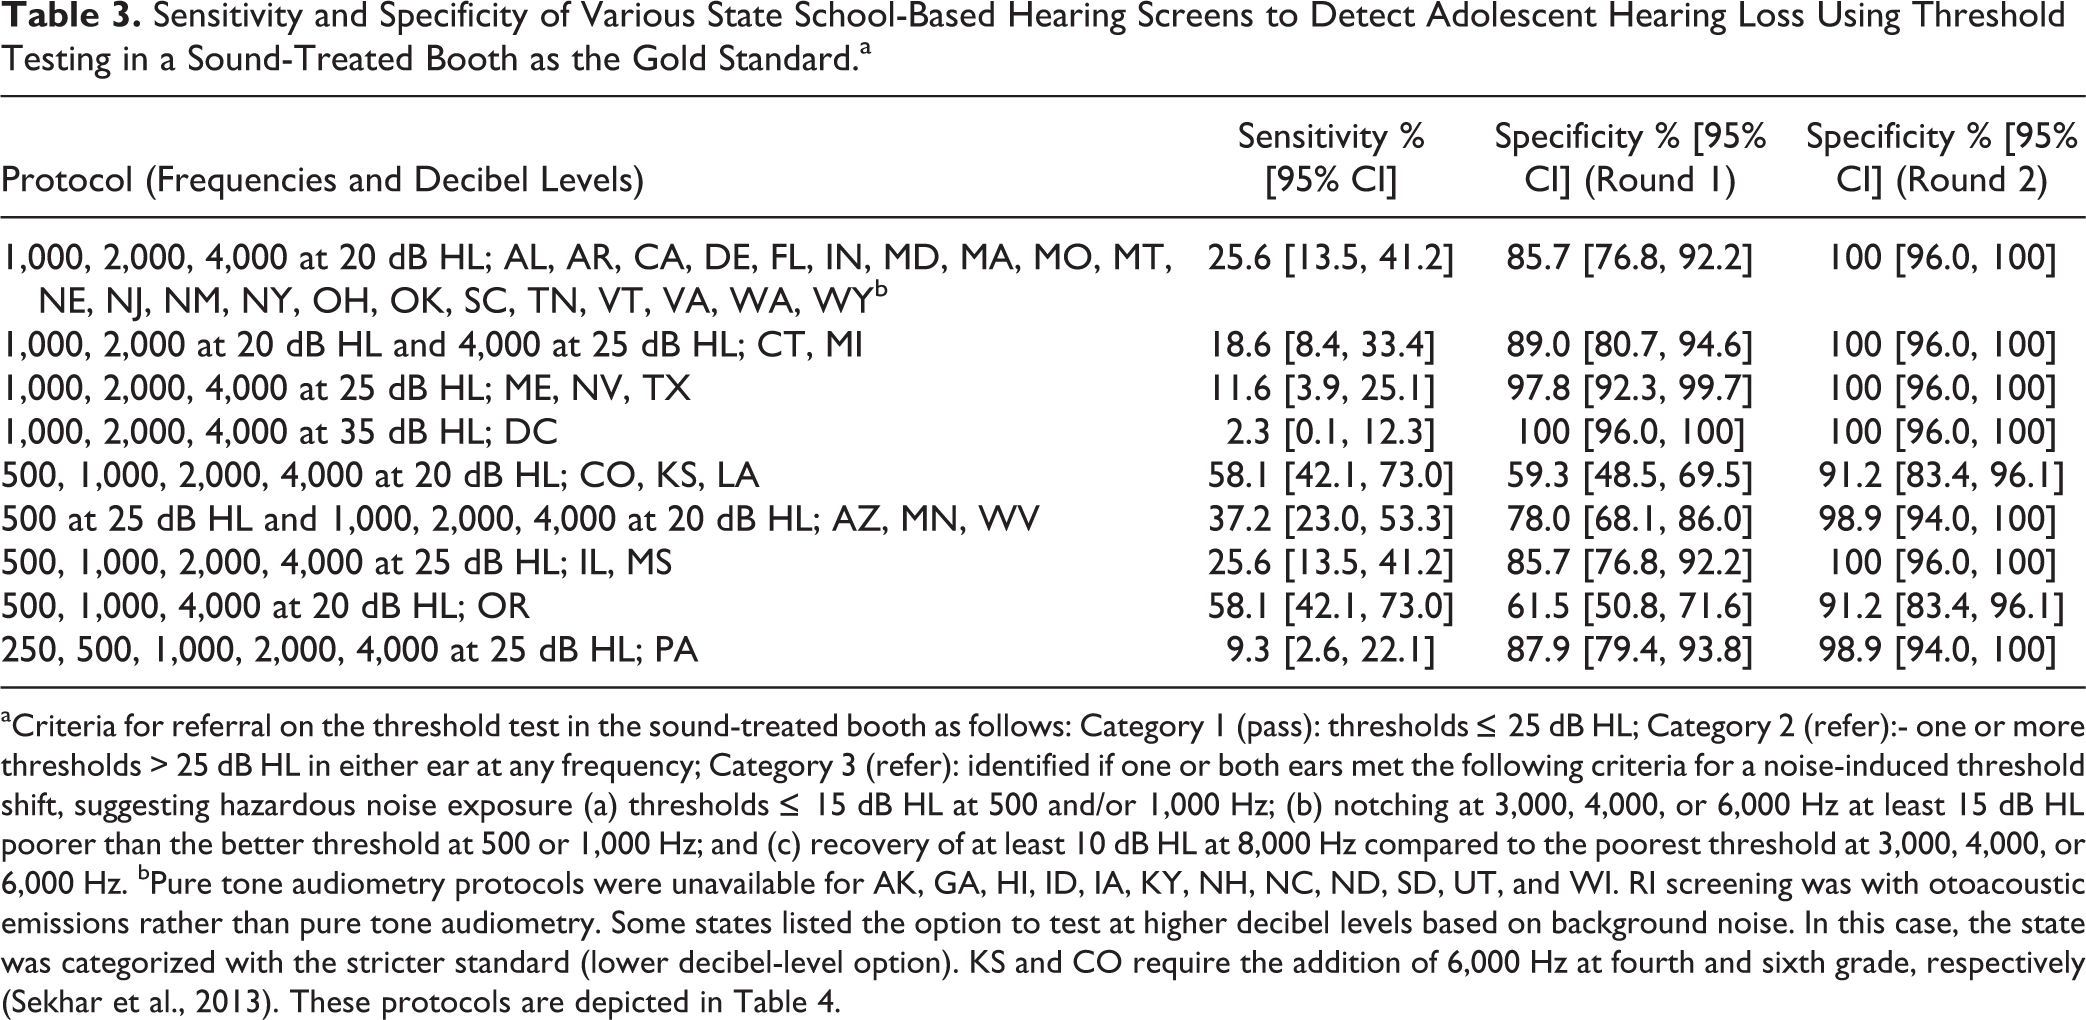
aCriteria for referral on the threshold test in the sound-treated booth as follows: Category 1 (pass): thresholds ≤ 25 dB HL; Category 2 (refer):- one or more thresholds > 25 dB HL in either ear at any frequency; Category 3 (refer): identified if one or both ears met the following criteria for a noise-induced threshold shift, suggesting hazardous noise exposure (a) thresholds ≤ 15 dB HL at 500 and/or 1,000 Hz; (b) notching at 3,000, 4,000, or 6,000 Hz at least 15 dB HL poorer than the better threshold at 500 or 1,000 Hz; and (c) recovery of at least 10 dB HL at 8,000 Hz compared to the poorest threshold at 3,000, 4,000, or 6,000 Hz. bPure tone audiometry protocols were unavailable for AK, GA, HI, ID, IA, KY, NH, NC, ND, SD, UT, and WI. RI screening was with otoacoustic emissions rather than pure tone audiometry. Some states listed the option to test at higher decibel levels based on background noise. In this case, the state was categorized with the stricter standard (lower decibel-level option). KS and CO require the addition of 6,000 Hz at fourth and sixth grade, respectively (Sekhar et al., 2013). These protocols are depicted in Table 4.
Adding 6,000 Hz to the most common state school-based protocol resulted in significantly improved sensitivity to 51.2% (95% CI [35.5, 66.7], p < .001; Table 4). Inclusion of 6,000 Hz to a protocol including 500, 1,000, 2,000, and 4,000 Hz at 20 dB HL significantly improved sensitivity to 76.7% (95% CI [61.4, 88.2], p < .001). The addition of 8,000 Hz resulted in a small further increase in the protocol sensitivity. The increase in sensitivity was offset by a decline in specificity, but following two test rounds specificity improved to 84.6% (95% CI [75.5, 91.3]). As specificity of the reference protocol (1,000, 2,000, and 4,000 Hz at 20 dB HL) after two test rounds was 100%, there were no participants who were false positives, and therefore McNemar’s test could not be performed to compare specificity measures.
Sensitivity and Specificity of Proposed Hearing Screens Including Multiple High Frequencies to Detect Adolescent Hearing Loss Compared to the Most Commonly Used State School-Based Hearing Screen (1,000, 2,000, 4,000 at 20 dB HL).a
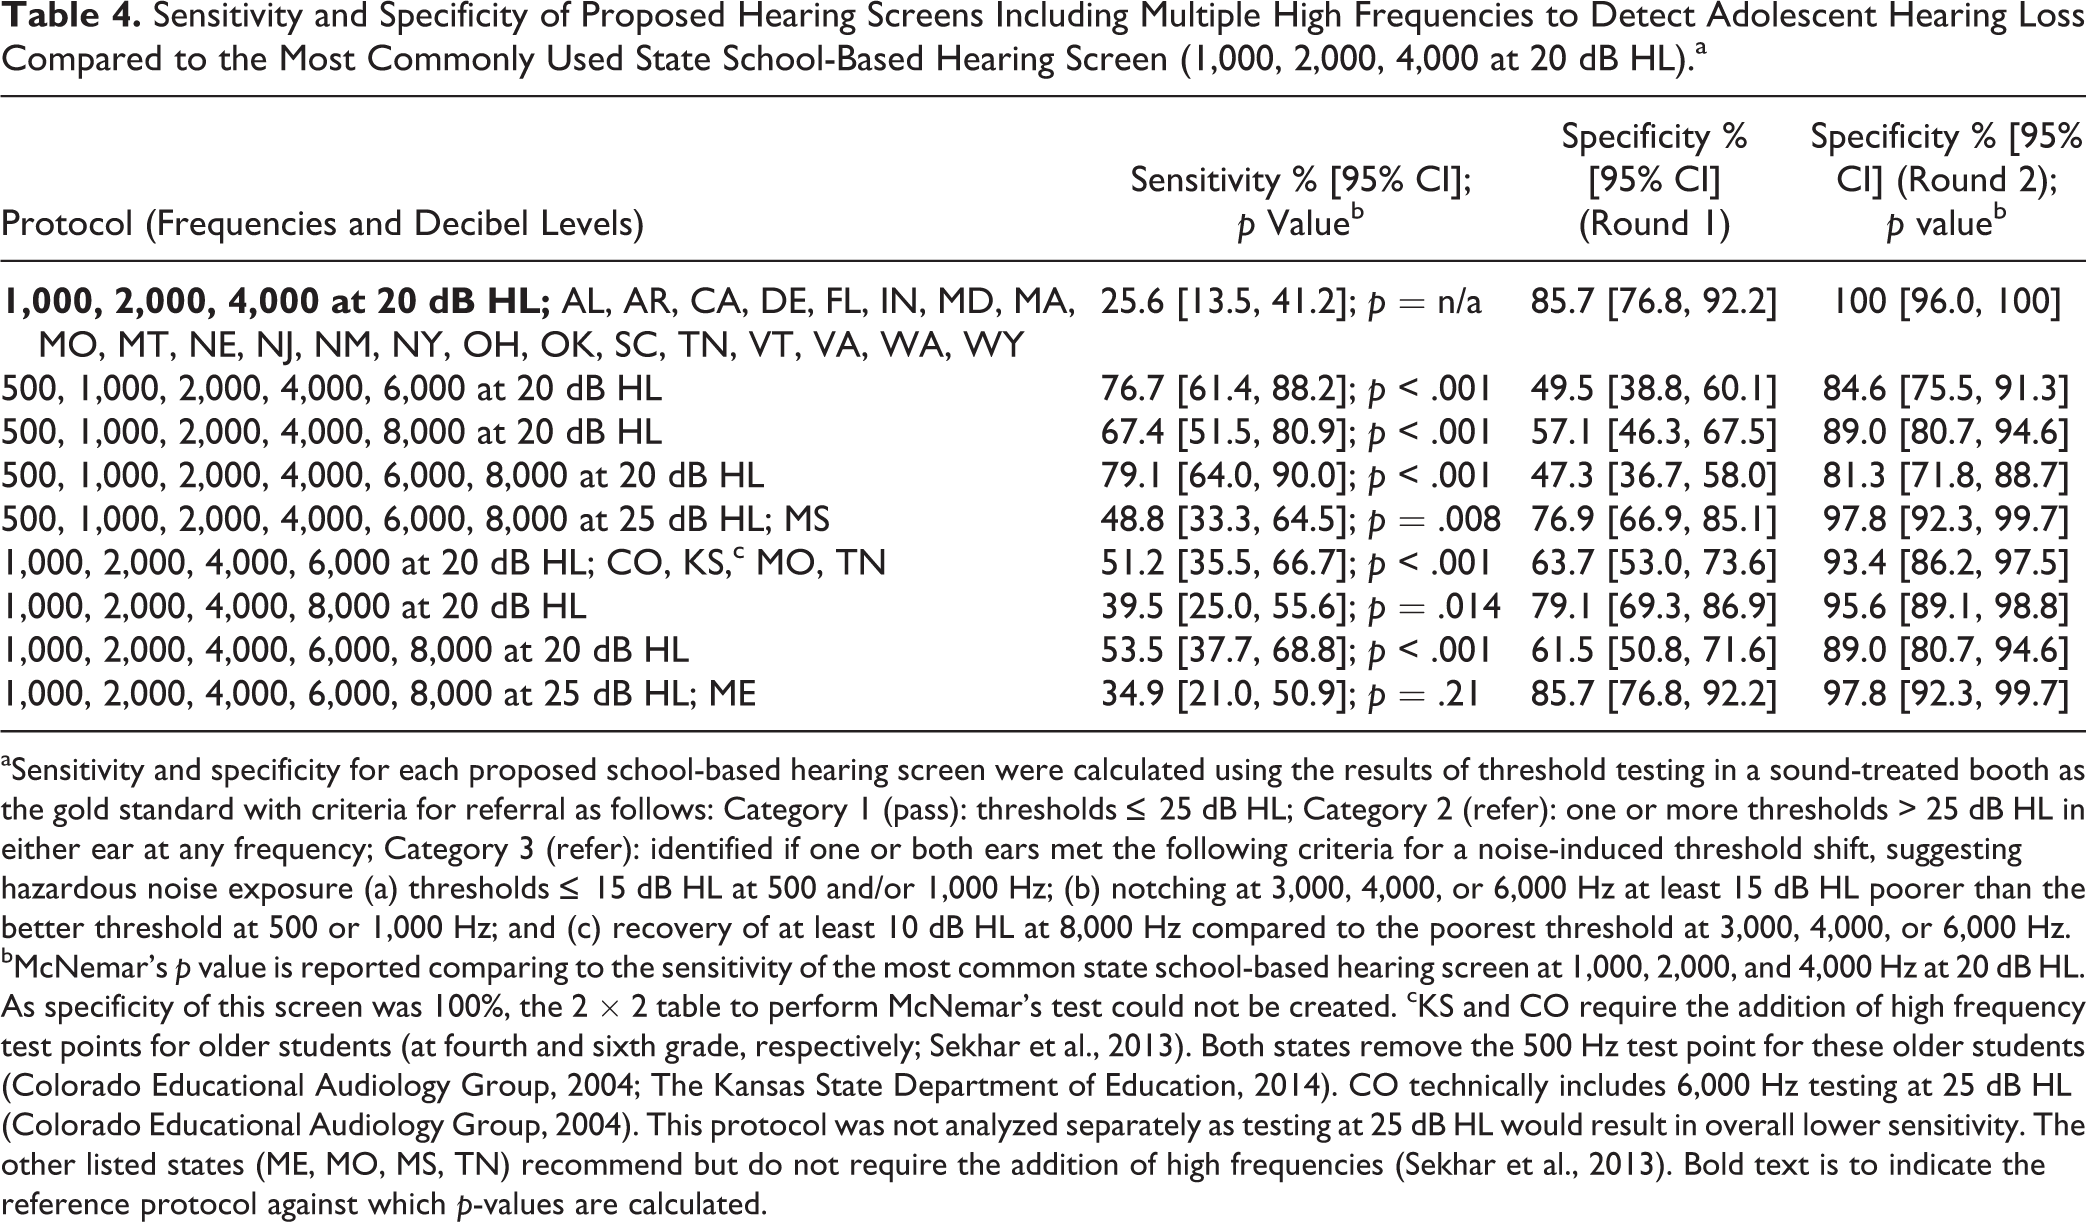
aSensitivity and specificity for each proposed school-based hearing screen were calculated using the results of threshold testing in a sound-treated booth as the gold standard with criteria for referral as follows: Category 1 (pass): thresholds ≤ 25 dB HL; Category 2 (refer): one or more thresholds > 25 dB HL in either ear at any frequency; Category 3 (refer): identified if one or both ears met the following criteria for a noise-induced threshold shift, suggesting hazardous noise exposure (a) thresholds ≤ 15 dB HL at 500 and/or 1,000 Hz; (b) notching at 3,000, 4,000, or 6,000 Hz at least 15 dB HL poorer than the better threshold at 500 or 1,000 Hz; and (c) recovery of at least 10 dB HL at 8,000 Hz compared to the poorest threshold at 3,000, 4,000, or 6,000 Hz. bMcNemar’s p value is reported comparing to the sensitivity of the most common state school-based hearing screen at 1,000, 2,000, and 4,000 Hz at 20 dB HL. As specificity of this screen was 100%, the 2 × 2 table to perform McNemar’s test could not be created. cKS and CO require the addition of high frequency test points for older students (at fourth and sixth grade, respectively; Sekhar et al., 2013). Both states remove the 500 Hz test point for these older students (Colorado Educational Audiology Group, 2004; The Kansas State Department of Education, 2014). CO technically includes 6,000 Hz testing at 25 dB HL (Colorado Educational Audiology Group, 2004). This protocol was not analyzed separately as testing at 25 dB HL would result in overall lower sensitivity. The other listed states (ME, MO, MS, TN) recommend but do not require the addition of high frequencies (Sekhar et al., 2013). Bold text is to indicate the reference protocol against which p-values are calculated.
Discussion
The results of the current research clearly indicate that the most commonly utilized state school-based hearing screen has poor sensitivity (25.6%) for adolescent hearing loss. A protocol including 500, 1,000, 2,000, 4,000, and 6,000 Hz at 20 dB HL for older students demonstrates significantly improved sensitivity (76.7%). Assuming initial referrals return for repeat screening, this is balanced by a decline in specificity of approximately 15% (100% vs. 84.6%), likely an acceptable trade-off. The addition of 8,000 Hz results in small additional gains in sensitivity (79.1%) with a corresponding small decrease in specificity. While the focus of the analysis was on the addition of high frequencies, the results also indicate screening at 20 dB HL as opposed to 25 dB HL and the inclusion of 500 Hz in the protocol significantly improve the sensitivity of the hearing screen for adolescent hearing loss. Nationally standardizing a school-based hearing screen protocol at 500, 1,000, 2,000, 4,000, and 6,000 Hz at 20 dB HL in testing adolescents may be a worthwhile change.
Any change to the protocol that increases sensitivity will also increase false-positive results, the number of students who require repeat screening, and referrals to hearing professionals, which raises cost and potentially anxiety among adolescents and their families. However, early detection could prevent future morbidity.
The addition of one high frequency tone (e.g., 6,000 Hz) at 20 dB HL in each ear will require minimal additional time per child. In the case of mass screening in the school setting, adding 10 s/screen to a class of 300 eleventh graders will add a total of 50 min of screening time. More students will also require a repeat test for an initial referral. However, this small additional time commitment to an evidence-based protocol would be balanced by the positive impact of early detection of hearing loss in the adolescent population.
Testing additional high frequency points does not require the use of new equipment. The current study included the use of typical school audiometers, most of which have the capability of producing 6,000 Hz and/or 8,000 Hz tones.
Background noise is an ongoing issue when completing hearing screens in the school setting, prompting some state protocols to test at 25 dB HL or above (DOH, 2011; Lo & McPherson, 2013; Sekhar et al., 2013). In this study, the background noise exceeded acceptable limits during Round 1 testing (Killion & Studebaker, 1978). However, it is reassuring that sensitivity and specificity were maintained in actual school screening conditions.
Next steps may involve a comparison of student referrals and identification of hearing loss between a state such as Kansas and others which include fewer high frequency test points. Including additional high frequencies only for children in higher grade levels may make the extra time required for testing and follow-up of referrals more manageable. While the protocols in use by Kansas and Colorado add 6,000 Hz for older students and remove the 500 Hz tone (Colorado Educational Audiology Group, 2004; The Kansas State Department of Education, 2014), our results did suggest retaining the 500 Hz tone improves sensitivity.
Limitations
Hearing screening in this study was performed under actual school conditions. Thus, factors such as background noise have influenced the sensitivity and specificity results. Similarly, students were not prohibited from using personal listening devices, attending band practice, or other potentially hazardous noise situations prior to the testing. Thus, it is possible that the refer results obtained were due to a temporary threshold shift (Niskar et al., 2001; Sekhar et al., 2011). Additionally, ear examinations were not done on those who referred but are a good practice prior to audiology referral as cerumen impaction, ear infections, and upper respiratory infections may also impact hearing test results. The time lag between Rounds 1 and 2 testing may have also impacted sensitivity and specificity results. However, it was reassuring to find sensitivity could be improved and specificity maintained in real-world conditions.
School Nursing and School Health Implications
School nurses play a critical role in screening students for impairments (e.g., hearing), which can negatively impact academic success. Considering the amount of time and effort that must be invested to successfully conduct mass screening in the school setting, ensuring the results are valid and reliable is imperative. These study results clearly demonstrate that current state school-based hearing screens omitting multiple high frequencies have poor sensitivity to detect adolescent hearing loss in the school setting. Continuing adolescent hearing screens with a low-sensitivity protocol is not beneficial for students. While hearing screen protocols are mandated by individual states, national organizations (e.g., National Association of School Nurses) provide an excellent venue to begin the dialogue on revising adolescent hearing screens. Collaboration between nurses from states including versus omitting additional high frequencies would provide access to the data and expertise to answer the feasibility and cost–benefit of adding high frequency test points to mass hearing screening for adolescents.
Additionally, school nurses may use the hearing screen as an opportunity to discuss hearing conservation and use of hearing protection during typical adolescent activities (e.g., lawn mowing or concert attendance). School nurses may also collaborate with teachers to model appropriate hearing protection in the school setting (shop class, band).
Footnotes
Acknowledgments
We thank the Lebanon School District and Penn State Nursing for volunteering to participate in this study.
Authors' Note
The corresponding author affirms all those who contributed substantially to the work have been listed.
Declaration of Conflicting Interests
The author(s) declared no potential conflicts of interest with respect to the research, authorship, and/or publication of this article.
Funding
The author(s) disclosed receipt of the following financial support for the research, authorship, and/or publication of this article: The study received internal funding via the Children’s Miracle Network at Penn State Hershey Children’s Hospital. The funding agency had no role in the design and conduct of the study; collection, management, analysis, and interpretation of the data; preparation, review, or approval of the manuscript; and decision to submit the manuscript for publication.