
Abstract
This study examined the relationship of students’ perceptions of school safety and school avoidance related to feeling unsafe with predictor variables: bullying victimization, student/teacher/parent/administration relations, rule clarity and consistency, school physical environment (negative and positive), and student’s belongingness. In a public high school sample (n = 585), 24.7% of students felt unsafe and 14.4% avoided school due to feeling unsafe during the past month. Being female and experiencing bullying was associated with feeling unsafe. However, after accounting for demographics and bullying victimization, perceptions of safety increased when students reported positive student and teacher relations, consistent rules, a clean school that is also crowded/noisy, and a sense of school belonging. Avoiding school because of safety concerns was related to decreased school belonging and teacher/student relationships, but not bullying. Focusing on enhancing the school climate/environment, facilitating student belongingness, and reducing bullying are ways school nurses can help promote safer schools.
Keywords
Promoting a sense of school safety while keeping students enrolled in school is a national priority (Centers for Diseases Control and Prevention [CDC], 2017; Center for Public Education, 2007; National School Climate Center [NSCC], 2017). Feeling safe at school has been associated with enhanced classroom engagement, academic success, and overall student well-being (Astor, Guerra, & VanAcker, 2010; Ripski & Gregory, 2009; Varela et al., 2017). In 2017, NSCC proposed that feeling safe at school is a necessary precondition for learning and optimal physical, emotional, and social development.
The impact of experiencing bullying, community victimization, and violence has been consistently examined in the school safety literature (Aldridge, McChesney, & Afari, 2017; Brewer, Meckley-Brewer, & Stinson, 2017; NSCC, 2017; Sulak, 2017; Vidourek, King, & Merianos, 2016; Thapa, Cohen, & Guffey-Higgins-D’Alessandro, 2013). Bullying has most recently been defined as “aggressive, goal-directed behavior that harms another individual within the context of a power imbalance” (Volk, Dane, & Marini, 2014, p. 35; Volk, Veenestra, & Espelage, 2017). Students experiencing bullying have been shown to be at risk of depression as well as suicidal behavior (Williams, Langhinrichsen-Rohling, Wornell, & Finnegan, 2017) and are also at risk of absenteeism and school dropout (Bradshaw, Waasdorp, Debnam, & Johnson, 2014). Yablon and Addington (2017) posit that even one experience with victimization may lead to generalized feelings of being unsafe and reductions in school performance. However, feeling unsafe at school is likely to be a result of an array of variables in addition to bullying including sex, race, student personality, school connectedness, and other risk/protective factors (Hutzell & Payne, 2012; Mehta, Cornell, Fan, & Gregory, 2013; Yablon & Addington, 2017).
School environment has been suggested as one of the additional risk/protective factors for feeling safe at school. For example, some students report feeling less safe in undersupervised and crowded areas (Basch, 2011; Biag, 2014; Vaillancourt et al., 2010). In addition, Kitsantas, Ware, and Martinez-Arias (2004) found perceptions of class climate (e.g., “enjoyment at school,” “extent to which students and teachers respect each other” p. 418) impacted perceptions of school safety in a positive direction. Similarly, having an authoritative climate consisting of clear expectations and predetermined consequences increased feelings of safety for students while in school (Fisher, Viano, Curran, Pearman, & Gardella, 2017). Bachman, Gunter, and Bakken (2011) noted students at schools with higher rates of suspension and expulsion were more fearful than students at schools with lower rates of suspension and expulsion. However, when school personnel communicated well and enforced the rules consistently and fairly, students were less likely to be fearful at school. In 2010, Akiba found that perceptions of not belonging in the school and low academic achievement were the strongest predictors of fear while in school. Other researchers propose increasing students’ feelings of connection and engagement to one’s school are pathways to reduce school fear, increase academic achievement, and reduce school avoidance (Berkowitz, Moore, Astor, & Benbenishty, 2017; Upadyaya & Salmela-Aro, 2015).
Consistent with the above research, this study is conceptually based on authoritative school climate theory (Gregory & Cornell, 2009), which postulates that both student support and disciplinary structure are essential components of a safe school environment that is conducive to learning. Student support includes elements that bolster student’s connectivity toward the school (e.g., positive teacher–faculty relations, positive student–student relations, and student’s sense of belonging). Disciplinary structure has been defined as strict but fair enforcement of the rules (Cornell, 2016). Others have argued that physical structure may also be an important component of school climate; specifically, the degree to which the school is perceived as noisy/crowded and/or well maintained and cared for (Biag, 2014).
The degree to which these three school environmental factors (elements of support, disciplinary structure, and physical structure) influence perceptions of school safety and possible school avoidance or skipping school, beyond the impact of bullying experiences has not been fully examined. Understanding the impact of school environmental factors is important as school nurses, counselors, teachers, and administrators may have more control over influencing the school environment, climate, and culture, than the ability to realistically stop all experiences of bullying. Thus, in line with theory, it was hypothesized that features of student support, disciplinary structure, and physical structure (student/parent/teacher/administration relationships, school rules and norms, and positive and negative physical space) would each contribute significantly to predictions of feeling safe at school and avoidance of school because of feeling unsafe, beyond the experience of being bullied. Finally, it was specifically expected that adding student’s sense of belonging to their school would account for additional variance in predicting the two school safety indicators, consistent with the work of Akiba (2010).
Method
Design
This study design involved analysis of secondary data collected using a cross-sectional design. School personnel initiated the administration of a school-wide survey using Survey Monkey to better understand their school climate and the experiences of their student body. Student participation was voluntary and anonymous. The survey was developed specifically for the school using a variety of previously published and validated measures of bullying (Swearer, Siebecker, Johnsen-Frerichs, & Wang, 2010), school environment (The Colorado Trust Student School Survey, 2005), and student mental health (see Williams, Langhinrichsen-Rohling, Wornell & Finnegan, 2017). The questions chosen were drawn from and are consistent with multiple existing surveys measuring constructs of school climate to include student/parent/teacher/administration relationships and student support, disciplinary structure, physical environment, and student belongingness (Cornell, 2016; school climate survey compendium). Examples can be found (https://safesupportivelearning.ed.gov/resources/school-climate-survey-compendium). The University of South Alabama institutional review board approved secondary analysis of these data, and ethical procedures were followed throughout.
Procedures
Parents were sent home written information about the school climate/data collection survey. As per established district protocol, passive consent procedures were used allowing parents to refuse permission for their student to participate by returning a signed form to the school. Otherwise, parental consent was assumed as approved; this type of consent is recognized as resulting in higher participation rates, lower cost, and reduced burden on faculty and staff (Shaw, Cross, Thomas, & Zubrick, 2015). Students provided active assent for participation by voluntarily agreeing to complete the online survey during the school day. Students were given the opportunity to decline participation without penalty or repercussions; additionally, students could actively refuse to answer any or all questions presented. The school provided on-site support from school nurses and counselors for students who showed any signs of emotional distress related to any of the mental health questions. All students were also provided a list of referral sources for mental health care. Once all data were collected, a deidentified electronic spreadsheet was provided to investigators for analysis.
Measures
Demographics
Students were asked to report the following: current grade (9th, 10th, 11th, and 12th), sex (male, female), race/ethnicity (White, Black, Hispanic/Latino, Asian, Native American, Biracial/Multiracial, and Other), primary language spoken in the home, and lunch option as proxy for socioeconomic status (free, reduced, pay full price, and bring lunch from home). Given the small number of students endorsing any race/ethnicity other than White, data were recoded into White versus all others (non-White) for data analyses.
Dependent Variables
Perception of physical safety at school
Consistent with the strategy of the CDC Youth Risk Behavior Survey (2009), one question (During the past 30 days, how safe have you felt at school?) with six answer choices varying from very unsafe and scared to very safe was used to assess school safety. Students were also asked where they felt most unsafe at school with the following choices: lunchroom, classroom, hallways, bathrooms, gym, other (specify), or the choice “Nowhere—I feel safe at school.”
Impact of perceived lack of school safety—absenteeism
One question, drawn from the CDC Youth Risk Behavior Survey (2009), determined how many days the student had not gone to school due to feeling unsafe either while in school or traveling to/from school with five answer choices varying from 0 days to more than 5 days.
Predictor Variables
Bullying experience
The prevalence and frequency of experiencing bullying was examined via the essential question from the Bully Survey (Swearer et al., 2010); an overall operational definition of bullying was not included for participants. Specifically, students were directly asked yes or no, “Have you been bullied at school this year?” Students who responded yes to this question were then asked the following, “If yes, how often were you bullied?” Response choices were “one or more times a day,” “one or more times a week,” and “one or more times a month.” Students were also asked where in the school bullying was most likely to take place.
Support
Student relations
Three questions from The Colorado Trust Student School Survey (2005) were used to determine students’ perceptions of how cohesive the student body is at their school. These questions were “Students in my school can be trusted,” “Students in my school generally get along with each other,” and “Students in my school generally feel the same way about things.” These questions were answered with a 4-point Likert-type scale ranging from 1 = really disagree to 4 = really agree. The coefficient α for these three questions was adequate in the current sample, α = .70.
Teacher/faculty relations
Three parallel questions from The Colorado Trust Student School Survey (2005) were used to determine students’ perceptions of faculty cohesiveness. These questions were “Teachers in my school can be trusted,” “Teachers in my school generally get along with each other,” and “Teachers in my school generally feel the same way about things.” These questions were answered with a 4-point Likert-type scale ranging from 1 = really disagree to 4 = really agree. In the current sample, the coefficient α for these 3 items was good, α = .78.
Disciplinary Structure
Rules and norms of the school
When responding to four questions from The Colorado Trust Student School Survey (2005) regarding the consistency of application, communication, and transparency of rules at their school, students could answer on a 4-point Likert-type scale from 1 = not true at all to 4 = very true. Two questions assessed whether the school tells parents when a student has done something “right” and whether they tell parents when the student has done something “wrong.” Question 3 assessed if students believed the school rules were clear and understandable; the final question determined if students believed the rules were the same for all students by all teachers and administrators. The coefficient α for these four questions in the current sample was fair, α = .62. The item assessing the school’s tendency to communicate about misbehavior was the least correlated with the total score for this scale, r = .25 (n = 585). Higher scores on this scale reflect greater endorsement of fairness, clarity, and school communication about student behavior, both positive and negative.
Physical Structure
Positive physical school environment
Consistent with many existing climate surveys, three questions were asked to determine students’ positive attitudes about the physical structure of the school. They were “My school building is clean and in good condition,” “My school has enough space to accommodate all of the students that are enrolled,” and “I like how my school looks and would be proud to show it off.” These questions were answered with a 4-point Likert-type scale ranging from 1 = really disagree” to 4 = really agree. The coefficient α for these 3 items was adequate, α = .74.
Negative physical school environment
Similarly, three face valid questions were used to determine students’ negative attitudes about their school structure and environment. They were “The amount of noise in the school makes it difficult to learn,” “The classrooms are too crowded,” and “The school is too crowded.” These questions were answered on a 4-point Likert-type scale ranging from 1 = really disagree to 4 = really agree; higher scores reflect perceptions of a noisier and more crowded school. The coefficient α for these 3 items was fair, α = .61. The question about noise had the lowest correlation with the overall score, r = .29 (n = 585).
Sense of belonging
In keeping with the Student Engagement Scale that is a part of the Authoritative School Climate Survey (Cornell, 2016), three questions asked students about feeling of belonging at their school: “I feel like I belong at my school,” “My school is a good place to be,” and “My school is important to me.” On a 4-point Likert-type scale, students could answer, 1 = not true at all to 4 = very true. The coefficient α for these three questions in the current sample was good, α = .78.
Statistical Analysis
Statistical Package for Social Sciences Version 23 (SPSS-23) (2013) was used for statistical analysis. Descriptive statistics were used to examine the demographic data and both dependent variables (student’s perceptions of school safety and school avoidance due to feeling unsafe at school) and predictor variables (bullying experiences, student/teacher/parent/administration relationships, rules and norms of the school, positive and negative school environment, and belonging at school). Pearson’s R correlations were used to examine the strength of association between the predictors and the dependent variables.
The first five-stage hierarchical linear regression analysis was used to predict students’ perceptions of school safety. In the first block, sex of participant (male, female) and race (White vs. non-White) were entered; in the second block, frequency of bullying victimization was entered; in the third block, student relationships/climate, teacher relationships/climate, and the degree to which rules and norms were adhered to were entered; in the fourth block, positive (clean) and negative (noisy/crowded) perceptions of the school environment were added as predictors. Finally, in Block 5, students’ sense of school belongingness was added to the predictive equation.
The second five-stage hierarchical linear regression analysis was used to predict students’ school avoidance (missing days of school) because of feeling unsafe while at school or while traveling to or from school. In the first block, sex of participant and race (White vs. non-White) were entered; in the second block, frequency of bullying victimization was entered; in the third block, student relationships/climate, teacher relationships/climate, and the degree to which rules and norms were adhered to were entered; in the fourth block, positive (clean) and negative (crowded/noisy) perceptions of the school environment were added as predictors. Finally, in Block 5, students’ sense of school belongingness was added to the predictive equation.
Results
Data were gathered from 585 students (9th grade: n = 233, 10th grade: n = 133, 11th grade: n = 143, and 12th: grade n = 76) attending a rural high school located within the Southern United States. The school had a total population of approximately 1,167 students. Slightly more females than males participated (322 females, 263 males). Most participants (70.4%) self-identified as White, with 20.7% identifying as Black, 4.6% as bi/multiracial, 2.7% as Native American, and less than 1% of the sample indicating they were Asian or Hispanic. Most of the sample (94.5%) reported English as the primary language spoken at home. Nearly, half (47.2%) indicated their family income qualified them for free or reduced-price lunch.
Most students (75.3%) reported feeling “kind of safe,” “safe,” or “very safe” at school. Of note, this left a quarter of the sample reporting feeling “kind of unsafe,” “unsafe and scared,” or “very unsafe and scared.” While most of the sample did not report school avoidance due to concerns of safety, 14.4% reported missing school due to feeling unsafe at school or on the way to school. Students were additionally asked where they felt the most unsafe at school. The most endorsed locations were the hallway with over a quarter (26%) of students endorsing this place, the bus (17%), with the academic classroom and cafeteria similarly endorsed as unsafe by roughly 15% of students.
Over half of the students reported being bullied, and 59.6% reported this victimization occurring one or more times a month. Bullying experiences were most commonly reported as occurring in the hallways (26.5%), after school (18.7%), or on the bus (17.4%). Mean levels of endorsement of the other predictor variables are presented in Table 1. Pearson’s R correlations between demographics (sex, race), each of the predictor variables, and the two school safety indices are presented in Table 2. All variables except race were significantly correlated with a student’s perception of safety at school in the last 30 days. All variables except sex, being bullied, and rules and norms of the school were significantly related to school avoidance due to feeling unsafe at school.
Means and Standard Deviations of Structure, Support, Physical Environment and Sense of Belongingness Variables.
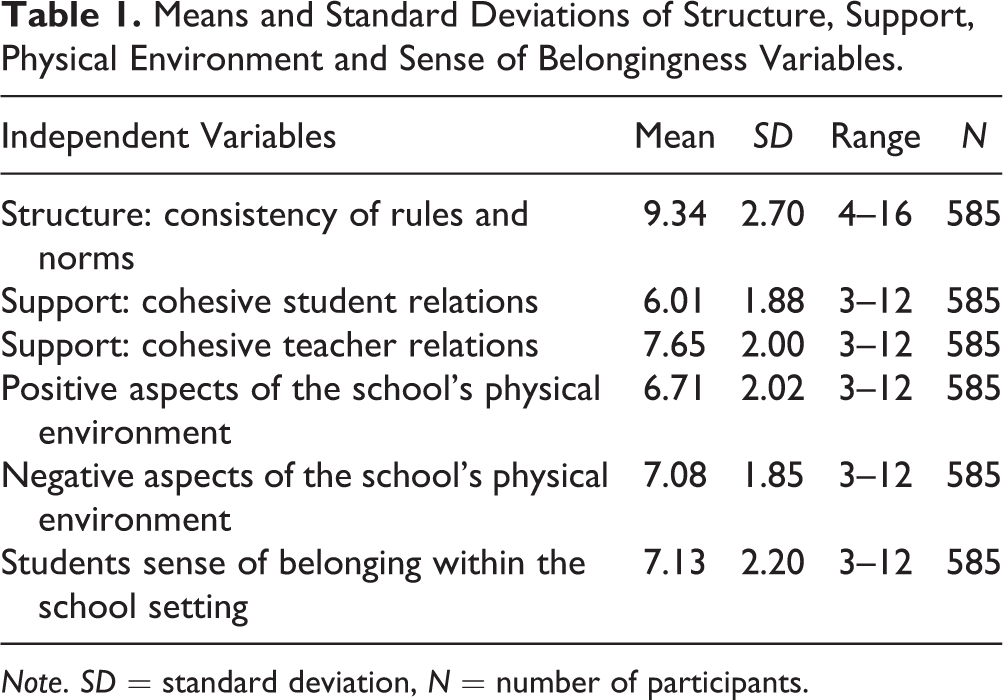
Note. SD = standard deviation, N = number of participants.
Pearson’s R Correlations Among the Demographic Indices, School Environment Variables, Student’s Perceived Belongingness, and the Two School Safety Indicators.
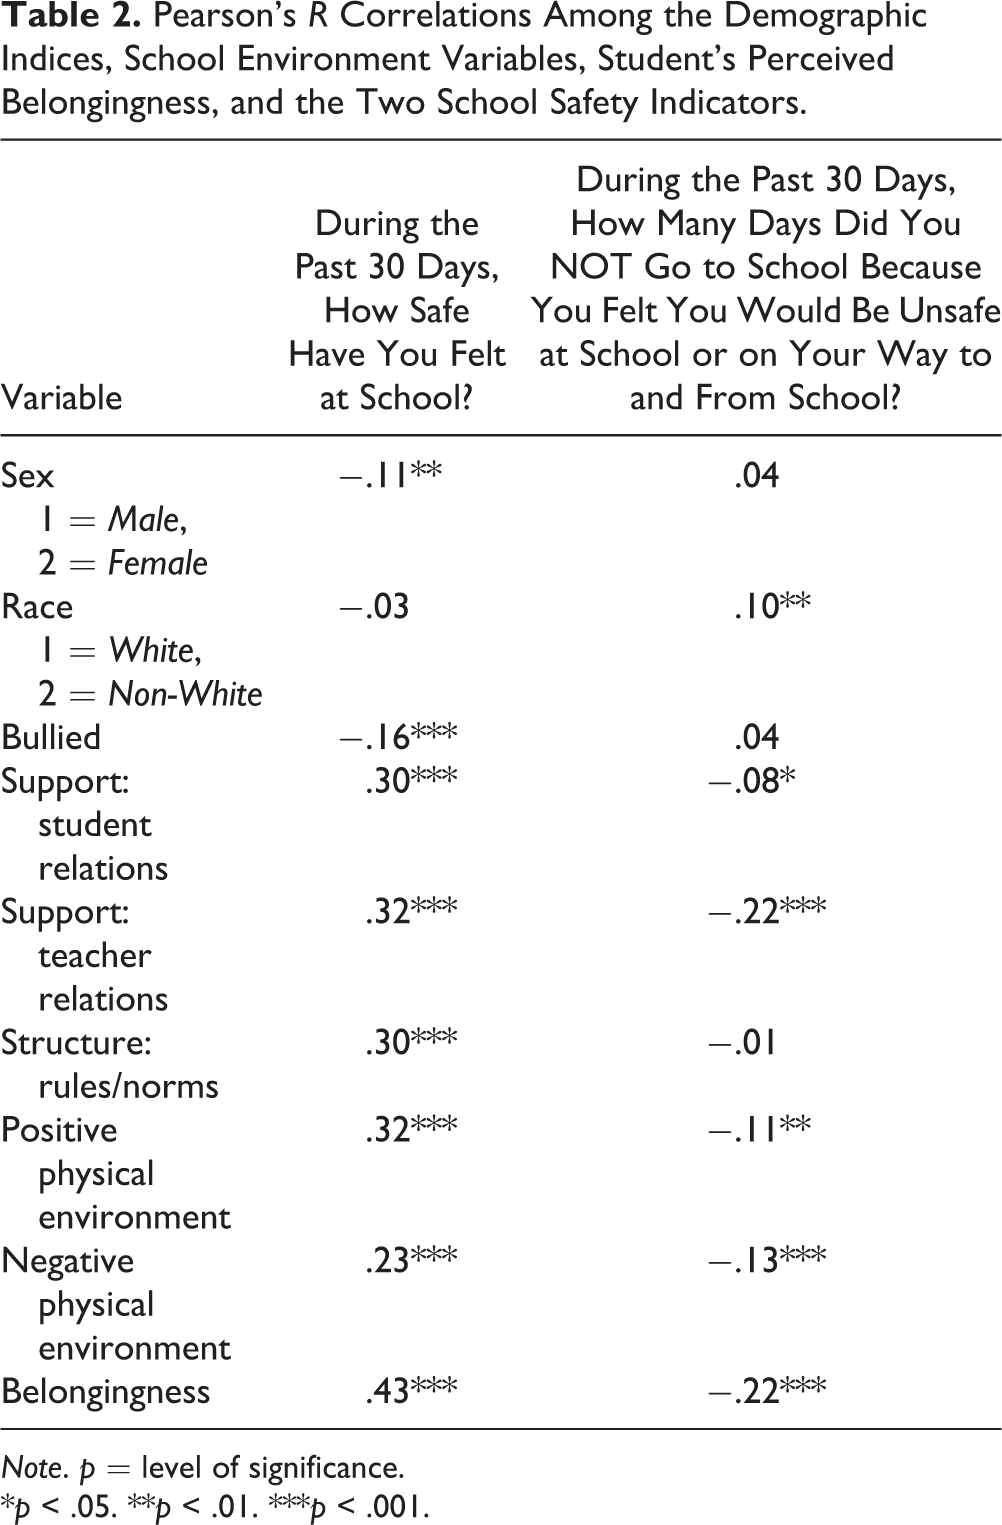
Note. p = level of significance.
*p < .05. **p < .01. ***p < .001.
At the first block of the first multiple regression model (see Table 3), the model was significant, F(2, 582) = 4.01, p < .05. Sex emerged as a predictor indicating males were more likely than females to report feeling safe at school. Race did not emerge as a significant predictor of perceptions of school safety. At the second block, the model was also significant with, F(1, 581) = 11.59, p < .001. Frequency of bullying emerged as a negative predictor of school safety explaining an additional 2% of the variance. In the third block, the model was again significant, F(3, 578) = 34.04, p < .001, and an additional 14% of the variance in perceptions of school safety was explained. All three included variables contributed independently to the regression equation: student relationships/climate, teacher relationships/climate, and rules, and norms/discipline structure; higher levels predicted greater sense of safety. The experience of bullying also remained a significant predictor in the third block.
Sex, Race, Bullying Frequency, School Environment Variables, and Sense of Belonging as Predictors of Students’ Perceptions of School Safety.
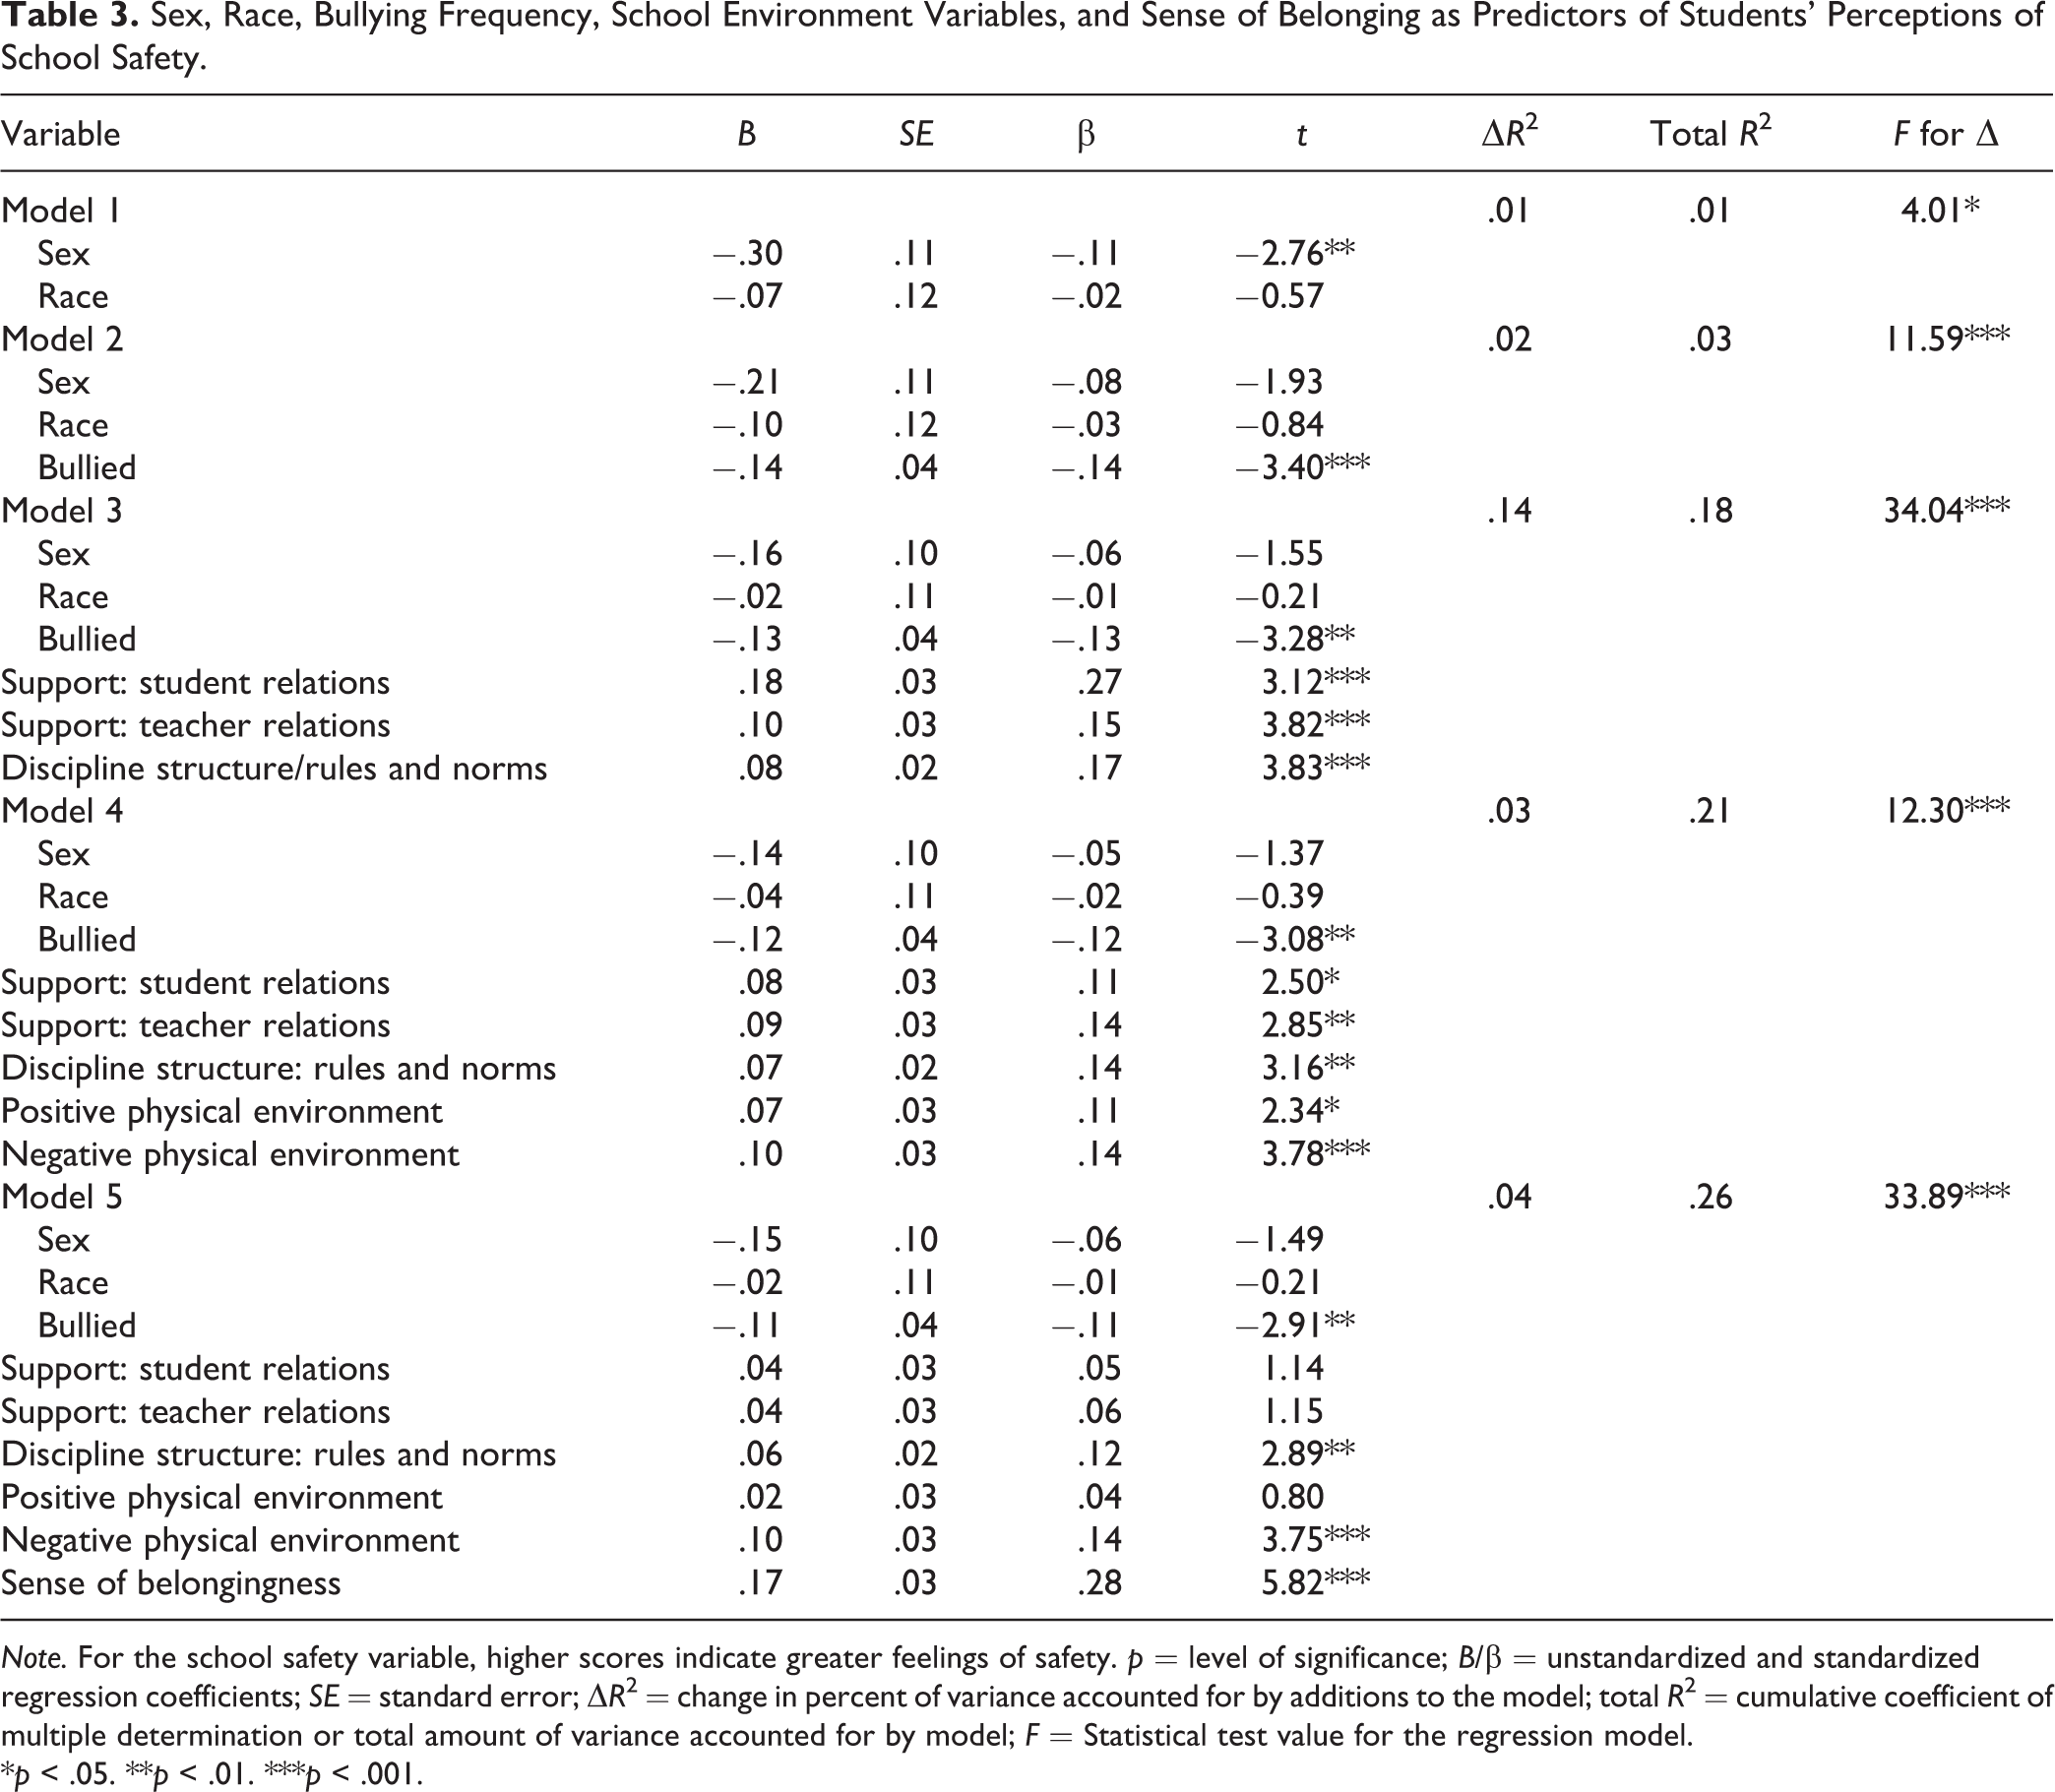
Note. For the school safety variable, higher scores indicate greater feelings of safety. p = level of significance; B/β = unstandardized and standardized regression coefficients; SE = standard error; ΔR 2 = change in percent of variance accounted for by additions to the model; total R 2 = cumulative coefficient of multiple determination or total amount of variance accounted for by model; F = Statistical test value for the regression model.
*p < .05. **p < .01. ***p < .001.
In the fourth block, positive and negative perceptions of the school’s physical environment were added to the predictive equation. These variables accounted for an additional 3% of the variance, F(2, 576) = 12.30, p < .001, and each contributed significantly to the regression equation. Overall, less frequent experiences of being bullied, more positive student relationships/climate, more positive teacher relationships/climate, greater enforcement of school rules/discipline structure, and higher levels of both positive (clean) and negative (crowded/noisy) perceptions of the school environment were retained as significant predictors of feeling safe at school in the fourth block.
Finally, in the fifth block, students’ perception of belonging within the school was added. As expected, this variable also contributed significantly to the regression equation and accounted for an additional 4% of the variance in feelings of safety. In the overall model, 26% of the variance was explained by four variables that remained as significant predictors of feeling safe at school: reduced frequency of bullying, greater enforcement of rules, a noisier/crowded school environment, and a sense of belonging to one’s school.
Results revealed that for school avoidance due to a perceived lack of school safety, the model was significant at the first block (see Table 4), F(2, 582) = 3.543, p < .05. However, only 1% of the variance in school avoidance was explained. Specifically, race emerged as a significant predictor indicating non-Whites were more likely than Whites to report school avoidance due to concerns with safety. Sex of the participant did not emerge as a significant predictor. At the second block, adding experiences with being bullied did not significantly contribute to predicting school avoidance due to feeling unsafe. At the third block, the addition of student relationships/climate, teacher relationships/climate, and enforcement of the rules/discipline structure significantly contributed to the regression equation and accounted for an additional 5% of the variance in school avoidance due to feeling unsafe.
Sex, Race, Bullying Frequency, and School Environment Variables as Predictors of School Avoidance Due to Safety Concerns.
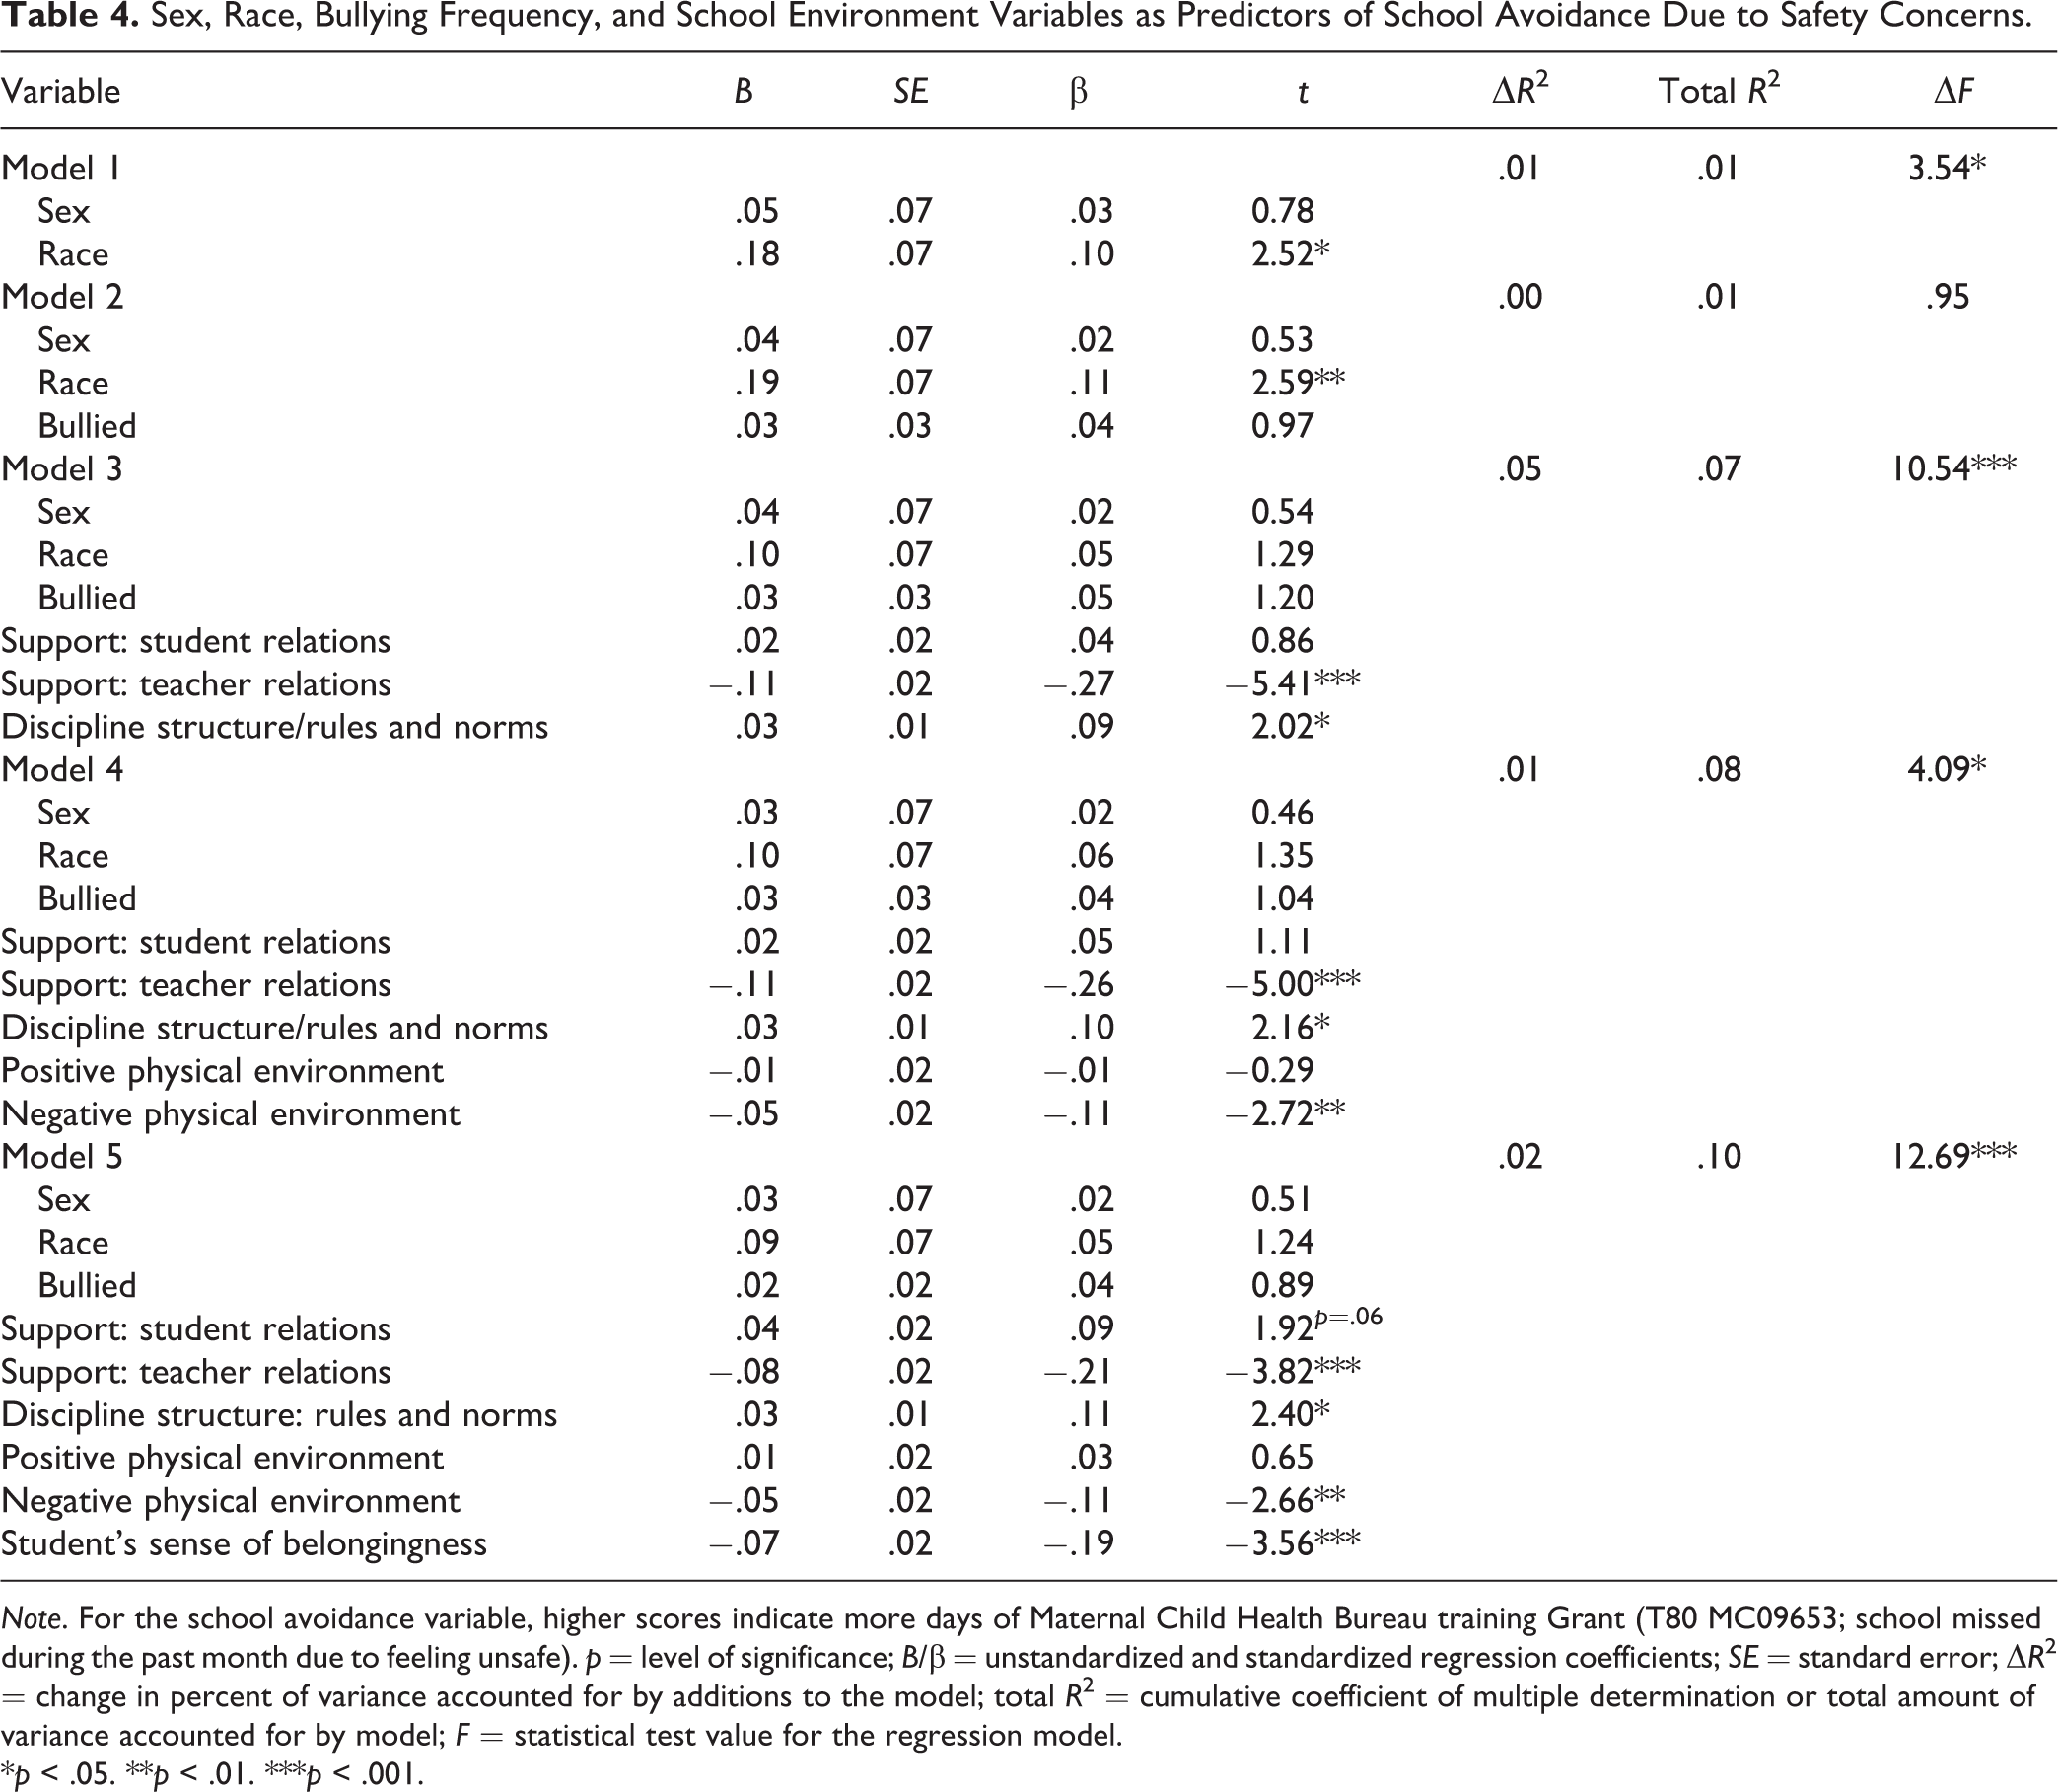
Note. For the school avoidance variable, higher scores indicate more days of Maternal Child Health Bureau training Grant (T80 MC09653; school missed during the past month due to feeling unsafe). p = level of significance; B/β = unstandardized and standardized regression coefficients; SE = standard error; ΔR 2 = change in percent of variance accounted for by additions to the model; total R 2 = cumulative coefficient of multiple determination or total amount of variance accounted for by model; F = statistical test value for the regression model.
*p < .05. **p < .01. ***p < .001.
In Block 4, with the addition of positive and negative perceptions of the school’s environment, the model increased in its predictive power and an additional 1% of the variance in school avoidance due to feeling unsafe was explained (R 2 total = .08). A less positive teacher climate, greater enforcement discipline structure, and a less noisy/crowded school predicted more frequent school avoidance due to feeling unsafe.
Finally, in the fifth block, students’ perceptions of belonging within the school were added. This variable also contributed significantly to the regression equation and accounted for an additional 2% of the variance in school avoidance. In the final model, four variables remained as significant predictors of school avoidance because of feeling unsafe: a less positive teacher/faculty climate, greater discipline structure, a less noisy/crowded school environment, and a lack of belongingness to one’s school. However, in the total multiple regression model, only 10% of the variance in school avoidance due to feeling unsafe was explained.
Discussion
Two key indicators of student safety were the focus of the current study: Perceptions of feeling safe while at school over the past 30 days and self-reports of school avoidance due to feeling unsafe either while at school or on the way to and from school over the past 30 days. One quarter of students who completed the survey indicated some degree of feeling unsafe while at school. This is concerning because a sense of safety is thought to be essential for learning, optimal development, and creativity (NSCC, 2017). Regarding school avoidance, while the prevalence of students indicating they had avoided attending school because of safety concerns was substantially lower, 14% of the students completing the survey indicated they had missed at least 1 day of school across the past month because of feeling unsafe. These prevalence rates may be underestimated since fearful students may not have been at school on the day of the survey, may have transferred during the year, or may have dropped out of high school completely. Using a variety of methodologies to establish prevalence rates of feeling unsafe and/or missing school because of fear will be important. It will also be important to determine the degree to which these indicators vary by type of school and school location.
Perceptions of School Safety
As expected, and consistent with theory, components of student support, disciplinary structure, physical structure, and belongingness were shown to predict perceptions of school safety, with the overall model explaining 26% of the variance, even after accounting for bullying experiences. Specifically, at the initial step, females were more likely to endorse feeling unsafe than males. Similarly, in a recent study of bullying, harassment, and cybervictimization, researchers found that females were more likely to report six types of victimization than males (Salmon, Turner, Taillieu, Fortier, & Afifi, 2018). At the next step, consistent with many other studies (Akiba, 2010; Aldridge et al., 2017; Biag, 2014; Yablon & Addington, 2017), more frequent experiences of being bullied were associated with reduced feelings of safety while in school. This finding supports a robust literature highlighting the ongoing need to address bullying and student-to-student aggression as a public health problem (Flannery et al., 2016). Moreover, once bullying victimization was entered into the regression equation in the current study, sex of participant was no longer a predictor of feelings of safety, suggesting although there may be differences in gender related to the types of bullying victimization, bullying is a universal concern for youth (Williams et al., 2017). However, adding bullying experiences only accounted for a small percentage of the variance in safety perceptions (2%), highlighting that a multifaceted violence reduction and safety enhancement program is likely to be more beneficial than a strategy which targets bullying reduction exclusively.
In this study, perceptions of safety increased when students reported positive student and teacher relations. In a similar, much larger study (n = 5,441), Mitchell, Kensler, and Tschannen-Moran (2018) found that when students trust their teachers, students’ perceptions of safety and their identification or belonging to the school increases. One unanticipated finding was students reporting feeling safer if they rated the school as noisier and crowded. This result was contrary to previous findings that students report feeling less safe in undersupervised and crowded areas (Basch, 2011; Biag, 2014; Vaillancourt et al., 2010). One possibility is that a well supervised/rule governed but noisy/crowded school can offer more options for friends and reduced chances for isolation and bullying victimization. Thus, another possibility is students living in more rural or suburban communities may respond to questions about crowding and noise differently than students from dense urban areas. Future research will be needed to resolve this inconsistency and determine the generalizability of these findings.
Consistent with the work of Akiba (2010), student belongingness was a strong predictor of feeling safe at school. Once this variable was included, only less frequent experiences of being bullied, greater consistency and transparency of rule enforcement, and a noisier/crowded environment remained as independent predictors of feeling safe while at school. These findings suggest school nurses, counselors, and administrators should consider how to build a sense of community among all students who attend the same high school. School nurses could assess and/or screen for belongingness, which has also been shown to be an important component of suicide prevention efforts (Marraccini & Brier, 2017). Nurses, counselors, and teachers could deliberately highlight an array of school connection opportunities for all types of students as engagement and belongingness are also important contributors to a safe and positive learning environment (Bradshaw et al., 2014; Mehta, Cornell, Fan & Gregory, 2014; Ripsky & Gregory 2009; Upadyaya & Salmela-Aro, 2015). Using school-wide interventions to increase belongingness and promote resiliency might also be better tolerated by students and administrators who may be saturated with efforts to prevent negative behaviors such as bullying (Bradshaw, Koth, Thornton, & Leaf, 2009).
School Avoidance
Contrary to expectation, the same predictors did not emerge as significant for predicting greater avoidance of school because of feeling unsafe. Rather than sex differences, non-White students, who are in the minority in the studied high school, were more likely to report missing school due to safety concerns than White students. Other researchers found similar results in that non-White students had a higher level of fear at school than White students (Akiba, 2010; Bachman, Gunter, & Bakken, 2011; Hughes, Gaines, & Pryor, 2015; Hutzell & Payne, 2012). However, in contrast to our study, Hutzel and Payne (2012) did not find a relationship between avoiding school and race. Continued exploration into the intersection of race, sex, safety, and school attendance is warranted.
In this study, more frequent experiences of bullying were not significantly associated with school avoidance. This was also unexpected as other researchers have found bullying victimization experiences predicted avoidance behaviors due to fear of being attacked (Aldridge et al., 2017; Hutzell & Payne, 2012; Randa & Wilcox, 2012; Vidourek et al., 2016). Similarly, Meyer-Adams and Conner (2008) found that students who perceived a negative psychosocial environment (victimization by bullying or presence of factors contributing to bullying behaviors) were more likely to consider bringing a gun to school or avoiding school by skipping classes. Hence, efforts to reduce bullying should continue to be supported.
However, given that teacher–faculty relationships, overcrowding, and a student’s sense of lack of belonging were shown to be predictors of this low base rate behavior, nurses, counselors, teachers, and administrators need to consider the physical, psychosocial, and emotional/mental health components of the school environment when addressing absenteeism and school safety. Moreover, helping at-risk students become more engaged with the school environment may facilitate attendance while promoting youth mental health (Beck & Reilly, 2017). Encouraging school nurses to intervene with students who feel isolated and disconnected from their school may provide direct and indirect benefits to that student, the greater student body, and the learning environment. One intervention pathway may be to encourage students to become involved in targeted programs, activities or technological career paths promoted within their school. Partaking in career-focused or hands-on school-to-work programs may lead students to develop new interests, better relationships with specific teachers, and increased hopes for future employment (Thessin, Scully-Russ, & Lieberman, 2017).
It must be noted, however, that a relatively small amount of variance (10%) in this low base rate behavior was explained by the variables included in this study. Other factors to consider include experiences of sexual violence before, after, or at school (De La Rue, Polanin, Espelage, & Pigott, 2017; Krauss, Krauss, O’Day, & Rente, 2005); violence, harassment, or electronic bullying against sexual minority students (Bouris, Everett, Heath, Elsaesser, & Neilands, 2016; Willging, Green, & Ramos, 2016); violence against racial/ethnic minority students (Basch, 2011); dating violence (National Center for Injury Prevention and Control, 2018); gang violence (Carson & Esbensen, 2017; Issurdatt, 2011); youth physical health factors, transportation, and aspects of home and neighborhood environments. A comprehensive understanding of absenteeism is needed.
Limitations
Limitations to this study should be noted. Data were cross-sectional; therefore, causal inferences cannot be made. Conducting a longitudinal study which considers the development of perceptions of feeling unsafe while at school and school avoidance due to feeling unsafe would provide insight into how these factors interact over time. Care should be used generalizing these findings as the study population was drawn from a single semirural high school in the Southern United States. Replicating these results with data drawn from multiple schools from multiple areas of the United States will be essential. In addition, offering the survey on multiple days and during multiple time slots might facilitate more comprehensive participation. Unfortunately, many senior students and other students were absent on the day the survey was conducted, and no other time to take the survey was provided. Finally, many measures in the current study consisted of a single question or a group of questions taken from well-known surveys. While using brief measures is essential when collecting school-wide data, use of more reliable and valid measures would add credence to these results. Moreover, two measures in the current study (disciplinary structure, negative physical environment) had lower than ideal internal consistency indices. Although other climate surveys have also yielded a range of coefficient αs for measures with a low number of items (e.g., .63 to .91, Huang & Cornell, 2016), suggesting a need to further refine the constructs being measured and continue measurement development. Finally, some recent school climate surveys, including the Authoritative School Climate Survey (Cornell, 2016), have provided students with an operational definition of bullying prior to asking whether the student has been victimized. The definition highlighted that: Bullying is the repeated use of one’s strength or popularity to injure, threaten, or embarrass another person on purpose; bullying can be physical, verbal, or social; and bullying occurs in a relationship characterized by a power imbalance and does not occur when two students who are about the same in strength or popularity have a fight or argument. Including an explicit definition of bullying serves to educate students while obtaining more valid prevalence rates. Replicating this study’s results with included operational definitions, different measures, additional and diverse students, and diverse and geographically distinct schools would be valuable.
School Nursing Implications
The American Academy of Pediatrics (2016) postulates that physical and emotional health issues are the strongest contributing factors to chronic school absenteeism, which is defined as missing at least 10% or more of school days (Council on School Health Policy, 2012). Additional school climate factors, some examined in the current study, may be underlying reasons students avoid school or have chronic absenteeism. There is evidence that as the number of nurses in schools’ increase, the number of student absences decrease (Gottfried, 2013). Student’s social and emotional health, including their sense of belonging to their school, is the foundation of academic success (Mulloy, 2014). One way to incorporate more nurses into schools is by utilizing a hospital-funded school nurse program. For example, in Michigan, using this model, to increase the presence of nurses in schools by even 1 day per week was shown to be effective in reducing chronic absenteeism by as much as 32% (Jacobsen, Meeder, & Voskuil, 2016). The presence of a school nurse to handle physical and mental health concerns and crises while promoting resilience might also enhance teacher–faculty relationships and reduce employee stress.
Knowing that one in five students ages 4–17 experience symptoms of mental or behavioral health issues (Substance Abuse and Mental Health Services Administration, 2012), it will also be important for school nurses and school-based personnel to receive recurring training in Mental Health First Aid or an equivalent (Koller & Bertel, 2006). While access to these trainings might be limited in under resourced and/or rural areas, there are online courses that could be offered by schools or self-initiated by school nurses (Mental Health First Aid USA, 2013; Moon, Williford, & Mendenhall, 2017).
Finally, while even on-site school nurses cannot be everywhere in the schools, there is a high likelihood a student who has been a victim of violence, bullying, and/or feels unsafe at school will visit the nurse’s office (Zinan, 2017). If school nurses understand how to provide support and facilitate belongingness while addressing school climate factors, including helping to promote positive teacher and student relationships, consistent disciplinary action, and clean and orderly physical structure, students are likely to experience a greater sense of safety, security, and trust in their school setting. This, in turn, should facilitate school attendance, school academic success, and learning.
Footnotes
Declaration of Conflicting Interests
The author(s) declared no potential conflicts of interest with respect to the research, authorship, and/or publication of this article.
Funding
The author(s) disclosed receipt of the following financial support for the research, authorship, and/or publication of this article: Funding for this research came from the Gulf Region Health Outreach Program. The Outreach Program was developed jointly by BP and the Plaintiffs’ Steering Committee as part of the Deepwater Horizon Medical Benefits Class Action Settlement, which was approved by the U.S. District Court in New Orleans on January 11, 2013, and became effective on February 12, 2014. The Outreach Program is supervised by the court and is funded with US$105 million from the medical settlement.