
Abstract
Introduction
Adverse drug events (ADEs) are among the leading causes of death in the United States 1 and >50% of the affected are older adults. 2 One of the approaches to mitigate ADEs is to ensure that drug dosing regimens limit risks while maintaining therapeutic benefits. Drug dosing to balance benefits and risks depends on the understanding of the dose-concentration-response (DCR) relationships. Unfortunately, data on DCR relationships for drugs used by older adults are frequently sparse because of the limited inclusion of geriatric patients (ie, 65 years and older) in drug studies and the numerous opportunities for missing data. Zulman et al 3 reported that about 20% of randomized controlled trials published in major medical journals excluded patients older than a specific age, and 45.6% had exclusions that disproportionately affect older adults. Thus, there are gaps in the knowledge of drug effects in older populations. With the US geriatric population projected to reach 72 million by 2030, 4 the need to fill the gaps is urgent.
One of the proposed approaches to filling the knowledge gaps is to increase inclusion of older adults in clinical trials. 3 Efforts to increase inclusion of older participants in drug trials are likely to be hindered by the high prevalence of risk factors for adverse outcomes (eg, multiple comorbidities) among older adults. Consequently, alternative low-risk methods for understanding drug DCR relationships warrant consideration. Modeling and simulation approaches are among existing low-risk methods that can be used to characterize drug DCR relationships.
Modeling and simulation methods are particularly attractive for geriatric studies for a number of reasons. 5 Advanced age is associated with increased pharmacokinetic and pharmacodynamic heterogeneity (variability), 6 and mixed-effect modeling can unravel the sources of variability7,8 and reduce the sample sizes needed for reliable inferences. Mixed-effect modeling can also handle sparse sampling/data,9,10 which often occurs in studies involving older adults because of recruitment challenges, dropouts, limited sampling capacity, to mention a few. Simulation can replicate experiments under different scenarios to provide insights into the impact of variability in patient characteristics on drug response and expose the limits of certainty of results. Hence, modeling and simulation have an enormous potential to provide useful information from geriatric studies without the need to extensively expose patients to drugs.
Beyond filling the knowledge gaps, determining that the proposed dosing regimen optimally balances benefits and risks is vital. Whereas qualitative methods are important, quantitative methods are more likely to be precise and limit bias. Risk-benefit acceptability methods offer a flexible quantitative framework 11 that has an added advantage of incorporating the decision-makers’ preference into the determination of the dosing strategy.
In this study, we explore the potential utility of modeling and simulation for analyses of sparse data in a limited number of older patients to determine the ideal geriatric drug dosing regimen. We also evaluate the use of a risk-benefit acceptability threshold method, which utilizes simulations, to explore alterations in the balance of benefit-risk at a specific drug exposure as the decision-maker changes the threshold.
Methods
Data Source
The primary aim of this study was to evaluate the utility of modeling and simulation in combination with a risk-benefit acceptability threshold method to determine the optimal drug dosing regimen in older patients. To that end, we used modeling and simulation to estimate the dose range of olanzapine within which antipsychotic efficacy is maintained and risk for glucose intolerance minimized. Then, we used the risk-benefit acceptability threshold method to explore the balance of benefit and risk. We analyzed data collected in phase 1 of the Clinical Antipsychotic Trials of Intervention Effectiveness (CATIE) study. The CATIE study was a National Institute of Mental Health–initiated project designed to systematically assess the clinical response to antipsychotics in the management of schizophrenia (SZ) 12 and Alzheimer’s disease (AD). 13 The CATIE study enrolled a total of 1881 patients (1460 SZ and 421 AD). The patients were recruited between 2001 and 2004, and those included in our analyses were treated with oral olanzapine in the SZ and AD trials. The data on blood olanzapine concentration were obtained from an ancillary study of CATIE 14 in which each participant contributed 1 to 6 plasma samples for the determination of olanzapine concentration after treatment with olanzapine over a daily dose range of 7.5 to 30 mg. A population 1-compartment pharmacokinetic model with additive error was determined to be the best representation of the data, and the covariates reported to significantly influence olanzapine exposure were smoking, race, and sex. 14
The CATIE study obtained written informed consent from each participant or their legal guardian and was approved by the institutional review board at each of the study sites. Our study was approved by the Research Involving Human Subjects Committee of the US Food and Drug Administration.
Study Population
The study population was limited to adults ≥50 years old because SZ reduces life expectancy by 10 to 25 years.15,16 We only included those who had continuously taken olanzapine for at least 2 weeks to ensure that assessments were made during steady-state drug concentration. To limit analyses to patients without preexisting glucose intolerance, 17 we excluded data for patients who reported a history of diabetes mellitus, use of antidiabetic medications and/or had baseline blood glucose levels >100 mg/dL. Of the 22 AD patients, only 8 had baseline blood glucose ≤100 mg/dL. Further analyses were restricted to SZ patients because the AD data were too sparse for reliable benefit-risk analyses.
We defined therapeutic benefit as ≥20% reduction of total Positive and Negative Syndrome Scale (PANSS) score from baseline while on olanzapine. 18 The percentage reduction of total PANSS score from baseline was obtained by dividing the difference in baseline and postbaseline total PANSS score by baseline total PANSS score and multiplying the ratio by 100. Risk (glucose intolerance) was defined as occurrence of a blood glucose level >100 mg/dL 17 at any time subsequent to the 2 weeks postbaseline period while on olanzapine. Each participant was assigned a benefit and risk status (benefit, ≥20% reduction from baseline of total PANSS score; no benefit, <20% reduction from baseline of total PANSS score; risk, at least 1 glucose value >100 mg/dL postbaseline; no risk, no glucose measurement exceeding 100 mg/dL postbaseline).
Key Variables
Patients were treated with olanzapine 7.5 to 30 mg daily. Other relevant information collected included age, race, sex, current smoking status, weight, height, comorbidities, concomitant medications, neuropsychiatric measurements (PANSS scores), fasting blood glucose, and olanzapine plasma concentrations. 14
Analytical Procedures
Our initial exploratory data analyses included spaghetti plots for the longitudinal assessment of total PANSS scores to confirm efficacy of olanzapine over time.
Pharmacokinetic Analysis
The plasma data were fitted using nonlinear mixed effects modeling based on the structural and covariate model developed by Bigos et al. 14 Each individual participant’s clearance (CLi) was derived from post hoc estimates from the olanzapine pharmacokinetic model. To estimate exposure to olanzapine, we determined the maximum area under the concentration-time curve (AUC) of olanzapine by dividing each individual participant’s olanzapine dose by their CLi (AUC = Dose/CLi). This derived post hoc AUC for each study participant was used for subsequent analyses.
Determination of Benefit-Risk Breakpoint
To determine the olanzapine exposure at which benefit is expected and risk of glucose intolerance is minimum (benefit-risk breakpoint), we initially calculated the mean AUC and the corresponding 95% CI associated with the following outcomes: benefit, no benefit, risk, and no risk. We used the lower limit of the 95% CI for the mean AUC for benefit (524.5 ng h/mL) as the minimum AUC above which benefit is expected. This lower limit of the 95% CI for the mean AUC for benefit was found to be within the 95% CI for the mean AUC for no risk, making it our best estimate for the benefit-risk breakpoint. To further evaluate the reliability of AUC of 524.5 ng h/mL as a credible benefit-risk breakpoint, we performed simulations of benefit-risk pairs comparing results from individuals with AUC ≤524.5 ng h/mL with that of those with AUC >524.5 ng h/mL.
Determination of the Optimal Dose for Balance of Risk-Benefit
We used linear regression to determine the olanzapine doses corresponding to the benefit-risk breakpoint AUC (524.5 ng h/mL). By regressing olanzapine dose on the log-transformed AUC controlling for sex, race, and current smoking status, we obtained the corresponding doses from the regression equation. We then conducted a Monte Carlo (MC) simulation to evaluate the sampling distribution of the olanzapine dose that corresponds to the breakpoint AUC. Subsequently, we estimated the benefit and risk probabilities at daily doses of 7.5, 15, and 30 mg. After using the risk-benefit plane to explore favorable doses, we used MC simulation (n = 5000) to determine the distribution of benefit and risk probabilities for each dose. Finally, we used risk-benefit acceptability curves to determine the proportion of the risk-benefit joint density below the risk-benefit preference value of one (µ = 1).
Statistical Analysis
Population PK modeling, prediction of PK data, and simulations were conducted using Nonlinear Mixed Effects Modeling (NONMEM), Version VI. SAS 9.2 (©2002-2008 SAS Institute Inc, Cary, NC), JMP version 7.0.1 (©2007 SAS Institute Inc, Cary, NC), and STATA version 11.0 (©2009 StataCorp, College Station, TX) were used to perform the other analyses.
Results
Data Characteristics
After applying the inclusion and exclusion criteria, the study population consisted of 34 SZ patients (Figure 1). More than three-fourths of the patients (82.4%) were male (Table 1), and the mean age was 54.4 years (SD = 4.5), with more than half (58.8%) between the ages of 50 and 54 years. Approximately two-thirds (67.6%) were white and more than three-fourths (76.5%) were current smokers.
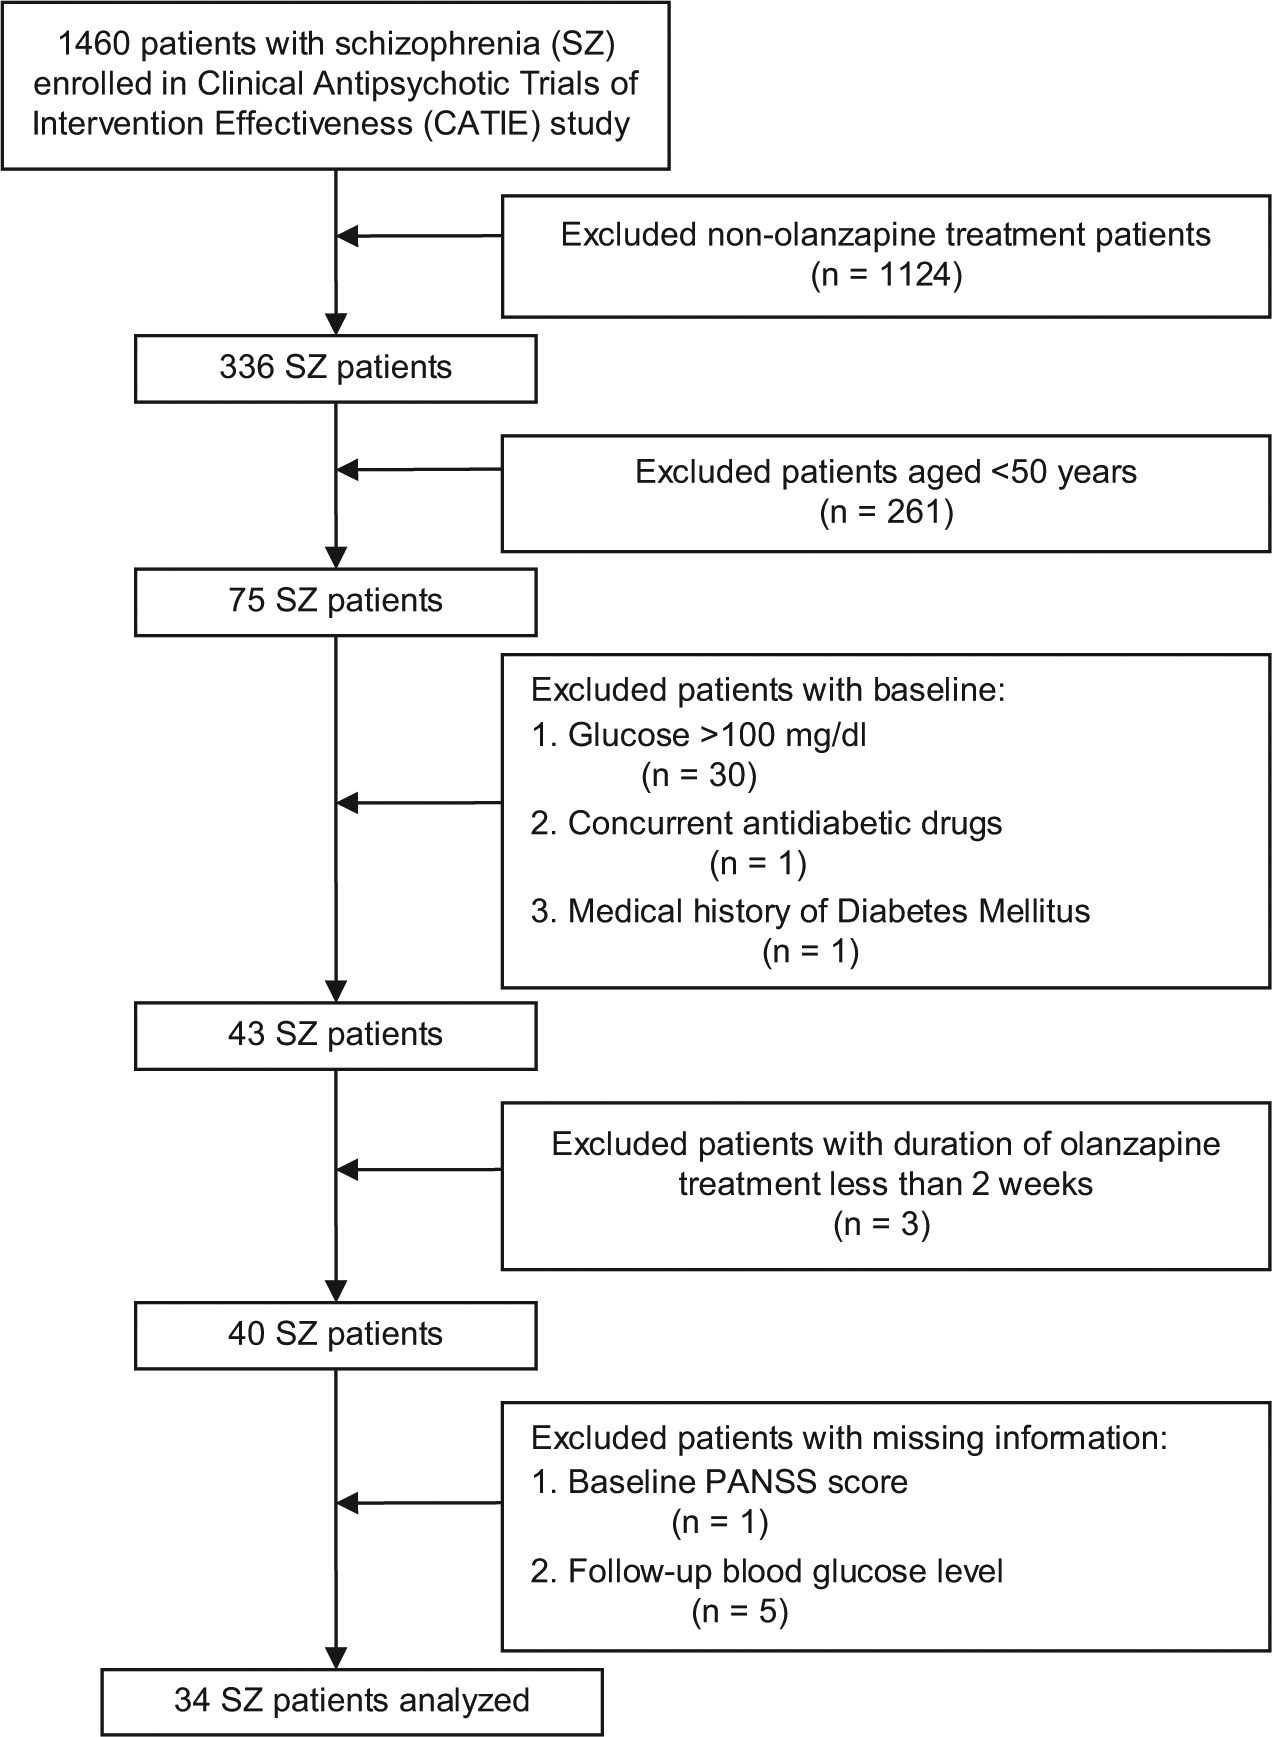
Flow diagram of sample size changes with application of inclusion/exclusion criteria.
Demographic Characteristics, Smoking Status, and Olanzapine Dosing Category of the Study Population (n = 34).
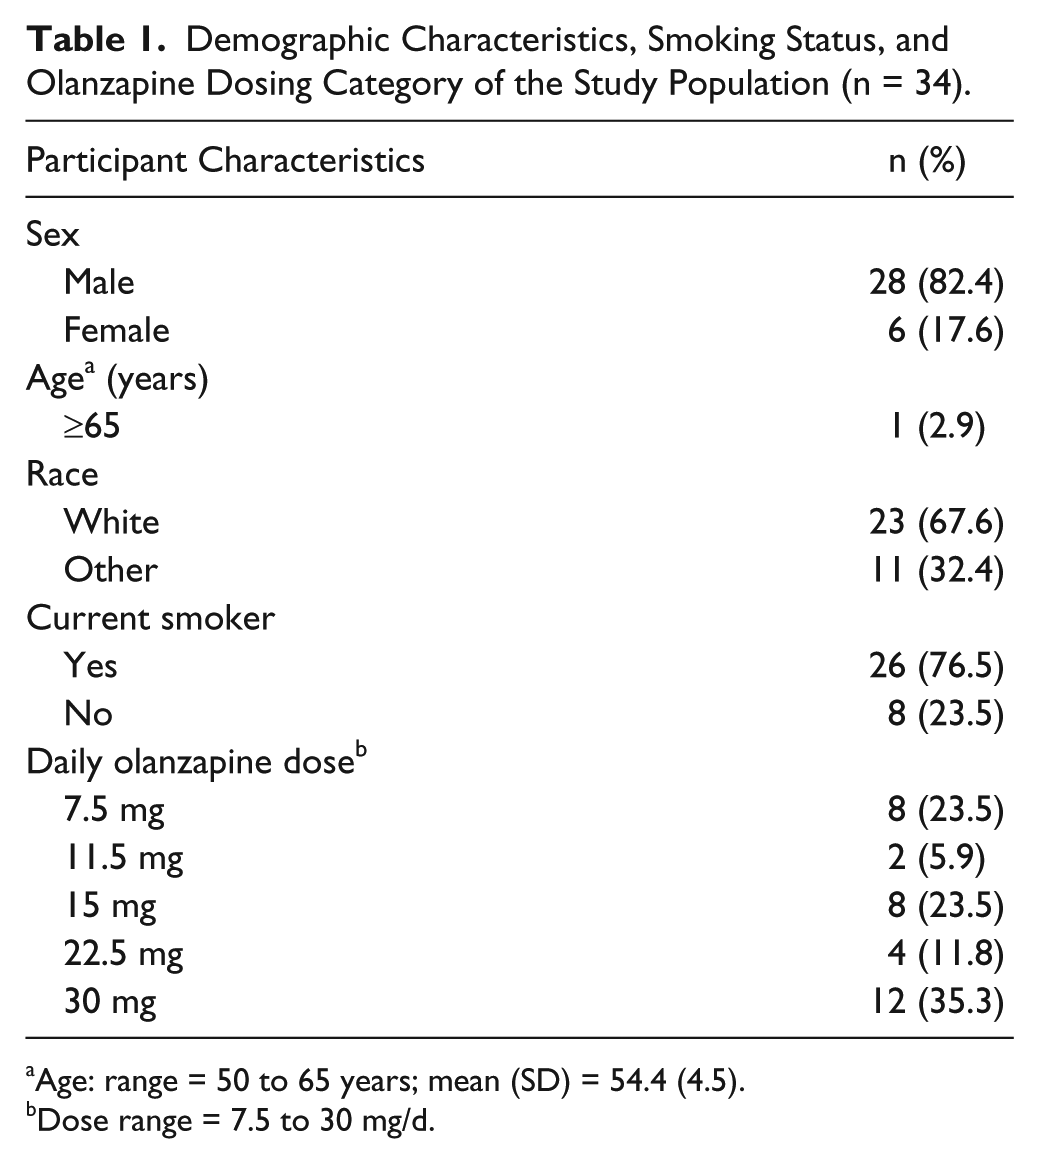
Age: range = 50 to 65 years; mean (SD) = 54.4 (4.5).
Dose range = 7.5 to 30 mg/d.
The most commonly used oral olanzapine daily dose was 30 mg (35.3%) and the least common dose was 11.5 mg (5.9%; Table 1). The mean duration of therapy was 361.8 days (SD = 179.3). The spaghetti plots of longitudinal total PANSS scores showed efficacy of olanzapine over time (not shown).
As shown in Table 2, 16 SZ patients (47.1%) experienced benefit from olanzapine treatment and the percentage of patients who developed glucose intolerance was 44.1% (n = 15). The benefit group (n = 16) had a mean AUC of 747.6 ng h/mL (95% CI = 524.5, 970.7); no-benefit group (n = 18), 604.2 ng h/mL (95% CI = 393.9, 814.6). The postbaseline blood glucose level ranged from 68 to 210 mg/dL, with a mean of 107.2 mg/dL (SD = 29.6). The no-risk group (n = 19) had a mean AUC of 606.6 ng h/mL (95% CI = 414.8, 798.4); the mean AUC for the risk group (n = 15) was 754.1 ng h/mL (95% CI = 505.9, 1002.4). To benefit from olanzapine, an AUC of at least 524.5 ng h/mL appeared necessary. To minimize risk, the AUC not to be exceeded was 798.4 ng h/mL. Therefore, an AUC of 524.5 ng h/mL seemed to be the safe breakpoint for benefit-risk (see Figures 2 and 3).
Benefit-Risk Subgroups With Their Corresponding AUCs.
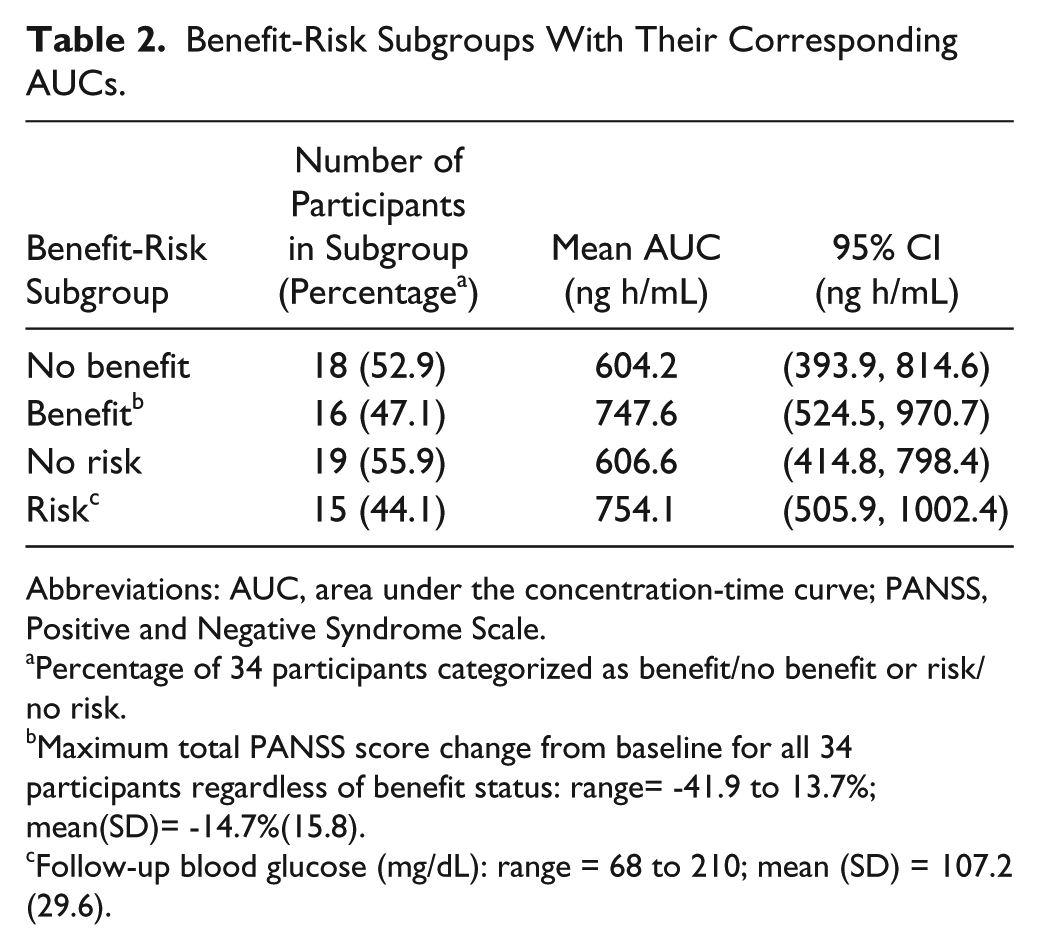
Abbreviations: AUC, area under the concentration-time curve; PANSS, Positive and Negative Syndrome Scale.
Percentage of 34 participants categorized as benefit/no benefit or risk/no risk.
Maximum total PANSS score change from baseline for all 34 participants regardless of benefit status: range= −41.9 to 13.7%; mean(SD)= −14.7%(15.8).
Follow-up blood glucose (mg/dL): range = 68 to 210; mean (SD) = 107.2 (29.6).
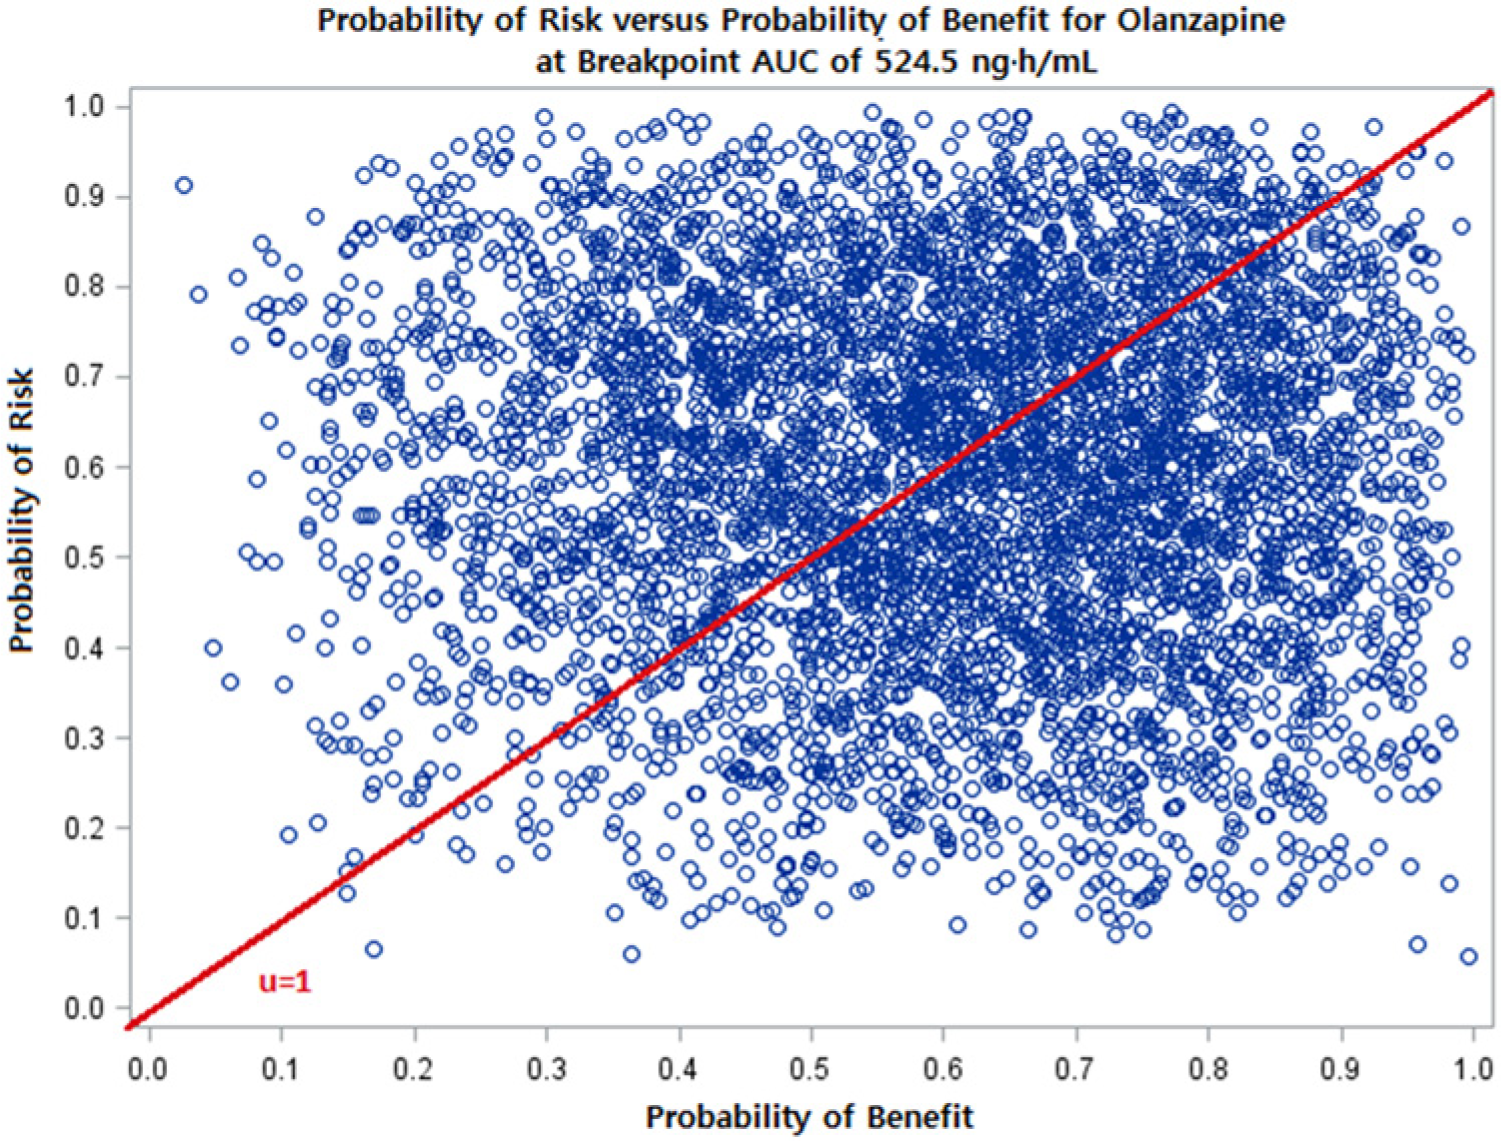
Plot of Monte Carlo simulation on risk-benefit plane: The probability of risk versus probability of benefit at a breakpoint AUC of 524.5 ng h/mL. Risk is defined as postbaseline blood glucose >100 mg/dL and benefit is defined as ≥20% reduction from baseline of total PANSS score. The line from the origin represents a risk-benefit threshold (µ) value of 1. The proportion of the 5000 simulated points falling below the µ = 1 threshold line is greater than the proportion above the line, suggesting that the probability of benefit is greater than risk at a breakpoint AUC of 524.5 ng h/mL. The proportion below the threshold of 1 is calculated and shown in Figure 3.
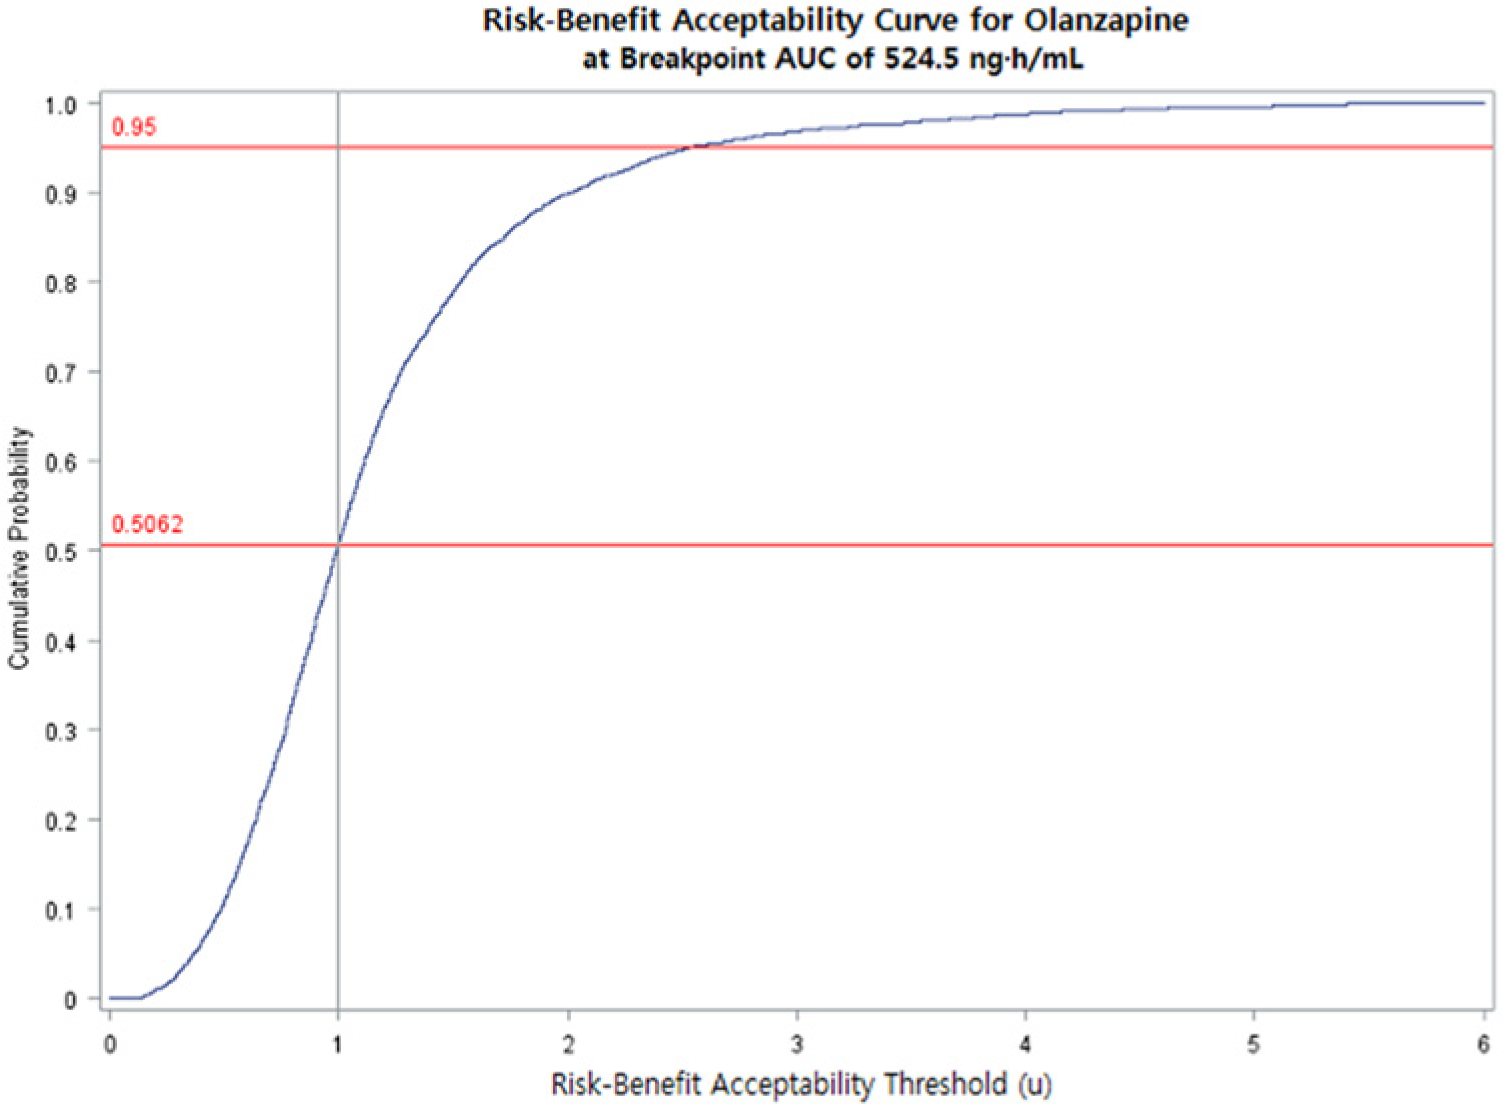
Risk-benefit acceptability curve: Cumulative probability distribution of joint risk-benefit plotted against risk-benefit acceptability thresholds at an olanzapine AUC = 524.5 ng h/mL. Risk is defined as postbaseline blood glucose >100 mg/dL; benefit is defined as ≥20% reduction from baseline of total PANSS score. The vertical line represents the risk-benefit threshold (µ) value of 1. At µ = 1, approximately 51% (0.51) of joint risk-benefit simulated points were below the threshold, demonstrating that, at an AUC of 524.5 ng h/mL, the benefit of olanzapine outweighed the risk of glucose intolerance.
The regression analysis yielded the following equation:
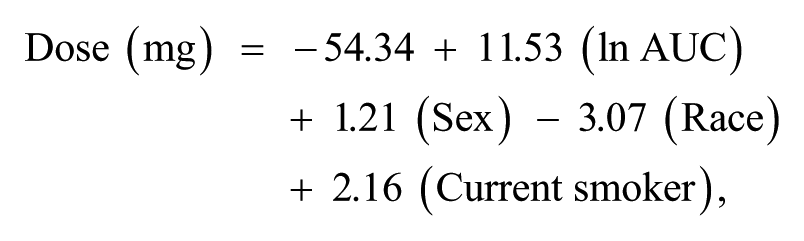
where Dose is daily olanzapine dose, AUC is the breakpoint AUC of 524.5 ng h/mL, Sex is female/male, Race is white/other, and Current smoker is yes/no. Using the AUC of 524.5 ng h/mL, the regression equation estimated that the mean olanzapine dose for which benefit can be achieved and risk of glucose intolerance minimized is approximately 17.8 mg/d. The safe (breakpoint) dose varied from 14.8 to 21.2 mg/d depending on the sex, race, and current smoking status of the individual (Table 3). White women who were nonsmokers had the lowest mean breakpoint dose (14.8 mg/d) and non-white men who were smokers had the highest mean breakpoint dose (21.2 mg/d); patients with other combinations of the characteristics (sex, race, and current smoking status) had mean breakpoint doses between the 2 extremes (Table 3).
Estimated Olanzapine Daily Dose Based on Participant Characteristics.*
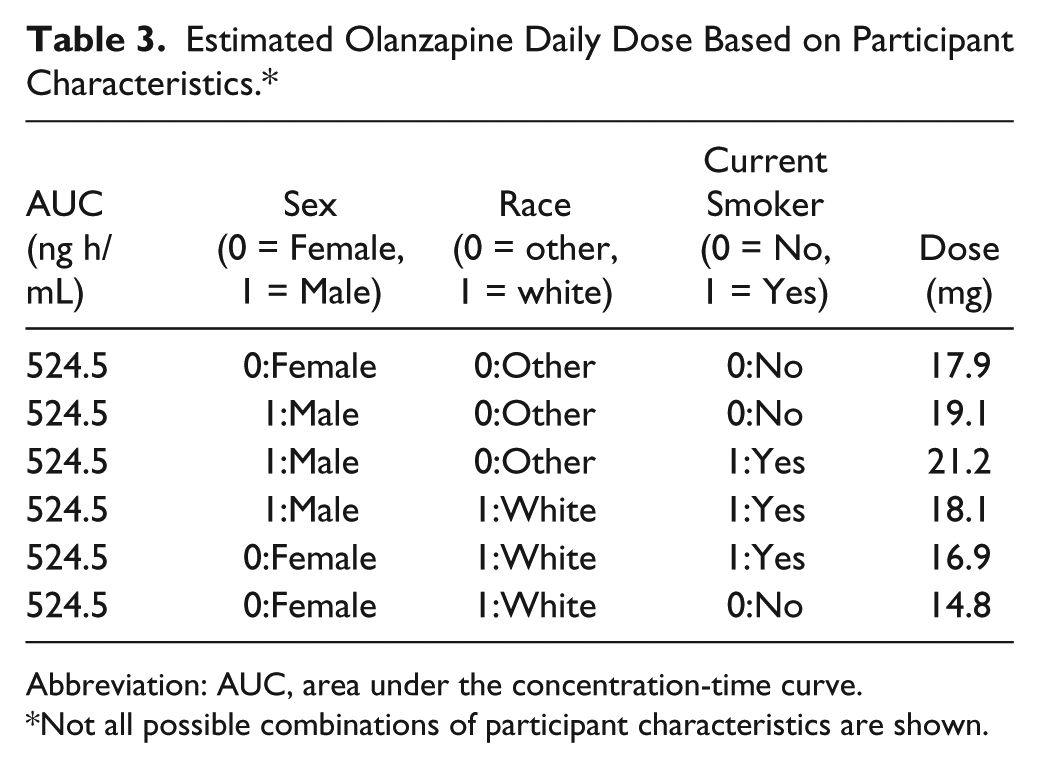
Abbreviation: AUC, area under the concentration-time curve.
Not all possible combinations of participant characteristics are shown.
Discussion
Pharmacotherapy can enhance the quality of life of older adults but has been associated with ADEs. The modifying effects of aging on drug pharmacokinetics and pharmacodynamics complicate the challenge of appropriate drug dosing for older adults. This challenge is made more difficult by the limited number of older adults included in drug studies. Sparse data are not uncommon in geriatric studies because of the multiple opportunities for missing data in studies involving older adults (eg, acute illness, death, lack of independent transportation to research facilities, and inability to obtain biological samples as scheduled). Therefore, there is an urgent need for the development and advancement of analytical methods that are capable of using sparse data for determination of doses relevant for drug benefit-risk decisions in older adults. This study utilized pharmacostatistical methods to evaluate the DCR relationships for olanzapine to estimate the AUC and the optimal dosing regimen likely to be associated with benefit and minimizing the risk of glucose intolerance.
The daily olanzapine exposure ranging from 7.5 to 30 mg for an average duration of almost 1 year in this study provides an adequate opportunity for the effects of long-term therapy to be observed. Such exposure is important because older adults tend to have chronic illnesses for which they are likely to take medications for a long time. The long period of exposure at clinically relevant doses provides an opportunity for accumulation of adequate patient-related effects critical to the purpose of this study. With 47.1% of patients achieving a beneficial effect and a 44.1% cumulative incidence of glucose intolerance, the ability to explore the benefit-risk balance was optimized.
The clear separation of exposure for benefit (mean AUC = 747.6 ng h/mL) from no benefit (mean AUC = 604.2 ng h/mL) and risk (mean AUC = 754.1 ng h/mL) from no risk (mean AUC = 606.6 ng h/mL) by AUC support the credibility of our benefit and risk criteria. To test the reliability of our method, it is reasonable to expect an overlap between our results and findings of studies published in the biomedical literature. We estimated that the mean AUC associated with benefit in SZ is 747.6 ng h/mL (95% CI = 524.5, 970.7). Rao et al 19 reported that the optimal therapeutic range for olanzapine serum levels is 20 to 40 ng/mL; this range will yield an approximate AUC0-24 hours range of 480 to 960 ng h/mL and an average AUC0-24 of 720 ng h/mL. The estimate of 720 ng h/mL is not appreciably different from our study results of 747.6 ng h/mL.
We show that the average dose at which antipsychotic efficacy can be maintained and risk of glucose intolerance minimized is 17.8 mg/d (range = 14.8 to 21.2 mg/d). Koller and Doraiswamy 20 reported that in their analysis of 196 spontaneous reports submitted to the FDA between 1994 and 2001, the mean daily dose of olanzapine taken by patients who developed new onset diabetes was 16.1 mg (SD = 7.0 mg). The observation that the mean dose of 16.1 mg/d does not appear considerably different from our estimated 17.8 mg/d and is within our dose range of 14.8- 21.2 mg/d further strengthens the proposition that our analytic methods are valid.
The combined use of population pharmacokinetic modeling, MC simulation, and a risk-benefit acceptability threshold method represents an innovative approach for finding the optimal drug dosing regimen for a vulnerable population. Avoiding exposure of a large number of research participants to adverse drug effects is an advantage. This study has demonstrated the utility of a systematic quantitative method for the determination of the dose range at which drug benefit and risk are balanced. Such an approach can be used to fill the gaps in information needed to evaluate the safety of drugs, particularly for geriatric populations. In addition to benefiting older populations, the methods in this study can be used to support health care and regulatory decision- making by providing information on efficacious drug dose ranges that will minimize the occurrence of ADEs in other populations.
Use of the methods in this study for patient care will require estimation of AUC from which dose will be determined. One relatively less onerous approach will be for clinicians to measure the average drug concentration at steady state (from a blood sample) and then multiply it by the dosing interval to obtain AUC at steady state. The AUC at steady state, however, may not be the breakpoint AUC for benefit-risk. Also, determining dose from AUC could be challenging. Therefore, routine use of methods in this study by clinicians at the point of care is not advisable at this time. The clinical value of the methods in this study is for them to be included in drug research programs, expecting that with time, data on breakpoint AUCs, particularly for major ADEs, will accumulate for clinical use. As information technology advances, we anticipate that the methods in this study will be part of Web-based programs or mobile device applications for estimation of breakpoint AUCs. For calculation of drug dose from the AUC, the Carboplatin AUC dose calculator, 21 which is available through the Internet, is an example of Web-based programs that can be combined with a breakpoint AUC estimator to convert AUC to dose for patient care.
The main limitation of our study is the small percentage (2.9%) of patients aged ≥65 years in the final analysis data set. Given that SZ reduces life expectancy by 10 to 25 years,15,16 50 years as the lower age cutoff for inclusion in this study is reasonable. Because of the limited data available for dose optimization, extrapolation of our results to other scenarios should be undertaken with caution. Finally, because the primary aim of this study is to demonstrate the utility of an innovative combination of methods to optimize drug safety in an older and vulnerable population, our findings should not be used as the basis for patient care.
Conclusion
This study introduces a real-world approach for finding the safe drug dose without extensive exposure of a vulnerable population to adverse drug effects. Generalizability of our results is limited. Further studies into the use of modeling and simulation as well as risk-benefit acceptability threshold methods for optimizing drug safety in older populations are needed. We balanced one measure of benefit with one risk outcome. Clinicians often need to balance a single benefit and multiple risks; therefore, further research into the use of the methods in this study in such scenarios is needed. Future studies should also replicate our approach in other therapeutic areas and include simulations using models that can accommodate parameters unique to older adults. Moreover, it will be important for future studies to examine whether the methods in this study are robust to nonlinear drug pharmacokinetics. We anticipate the methods in this study to contribute to making individualized drug dosing more precise, as desired by geriatric health care providers worldwide.
Footnotes
Acknowledgements
We are grateful to Leslie Kenna, PhD, Thomas Laughren, MD, Kristin Bigos, PhD, Robert Bies, PharmD, PhD, and George Rochester, PhD, for their intellectual support.
Declaration of Conflicting Interests
The author(s) declared no potential conflicts of interest with respect to the research, authorship, and/or publication of this article.
Funding
The author(s) disclosed receipt of the following financial support for the research, authorship, and/or publication of this article: US FDA CDER Regulatory Science and Review Enhancement (RSR) Program and the FDA CDER Critical Path Program for the research presented in this article.
Authors’ Note
Disclaimer: The views expressed in this article are those of the authors and do not represent the official views or position of the US Food and Drug Administration. Jung Lee was a research fellow at the US Food and Drug Administration during her involvement with the research presented in this article. This article was presented in part at the American Society for Clinical Pharmacology and Therapeutics Annual Meeting, March 2012, National Harbor, Maryland.