
Abstract
Background
Warfarin is still the most commonly recommended anticoagulant for treating venous thromboembolism and other hypercoagulable states. 1 It is also frequently used for preventing thromboembolic complications in conditions such as atrial fibrillation and prosthetic heart valves. The degree of anticoagulation is measured using the international normalized ratio (INR), typically with a target of 2 to 3 or 2.5 to 3.5, depending on the indication. 1 Dosing of warfarin needs to be adjusted to maintain the INR within a narrow therapeutic range. Numerous factors, including medication interactions, diet, acute illnesses, and other individual patient circumstances are known to affect the metabolism of warfarin, thus increasing or decreasing the INR. In addition, the drug is metabolized via the hepatic enzyme system, and studies have confirmed that polymorphisms within the genes coding these enzymes, such as CYP2C9 and VKORC1, can be associated with an increased risk of over anticoagulation. 2 Because these factors can affect both the dosing of warfarin and the resulting INR, out-of-range therapeutic levels of warfarin cause patients to be at risk of both bleeding and thrombotic complications.
Given the desire to reach and maintain the INR within the therapeutic range, as well as to reduce the risk of complications when the INR is either sub- or supratherapeutic, multiple studies have been undertaken in an attempt to design warfarin dosing protocols.3-14 Increased interest in dosing protocols has also been prompted by the Joint Commission’s National Patient Safety Goal to “reduce the likelihood of patient harm associated with the use of anticoagulant therapy,” and to “use a correct INR to adjust warfarin therapy.” 15 Many of the studies have focused on initiation protocols, which compare various initiation doses and time to therapeutic INR.3-7 Still others have focused on predicting maintenance dosing, as evidenced by the development of dosing protocols based on the initial INR response to warfarin.9-14
The relationship between warfarin dose and individual patient characteristics is less clear. A small number of investigations have looked at patient age and gender to evaluate if these demographics can be used to predict initiation or maintenance dosing.14,16-18 There is evidence that warfarin dosing in elderly patients is inversely correlated with age.19-23 It has also been suggested that weight and/or body mass index (BMI) could influence the time to achieving a therapeutic dose and initial dosing.18,24-27 However, to our knowledge there have been no studies specifically evaluating the relationship between the maintenance warfarin dose and BMI categories. Therefore, the purpose of this study was to identify patients whose INR was within the therapeutic range and assess whether there was a significant correlation between BMI and the total weekly dose (TWD) of warfarin. We also evaluated whether there was a significant relationship between the TWD and specific BMI categories.
Methods
This retrospective study was conducted at a tertiary care academic medical institution and was approved by the Mayo Clinic Institutional Review Board. A total of 831 patients (359 female patients and 472 male patients) taking warfarin for various indications between April 2009 and November 2011 seen at Mayo Clinic for care were included in the study. Patients were on a stable dose of warfarin maintenance therapy, which was defined as having a therapeutic INR without a change in dosing for at least 30 days. Baseline INR, target INR range, TWD of warfarin, and indication for warfarin therapy were collected. Patients who were started on warfarin therapy within the previous 30 days or who were missing demographics, baseline INR, target INR, or a current weekly dose were excluded from the study.
Descriptive statistic data (mean, median, standard deviation [SD], and range) for the total weekly dose were calculated. These data were then correlated to the 6 standard BMI categories. Patient demographic characteristics were summarized as mean ± SD for continuous variables or frequency (percentage) for categorical variables. Linear regression analysis and generalized linear model analysis were used to evaluate the association between BMI and warfarin dose. Any P value less than .05 was considered statistically significant. We used bivariate analysis to assess whether there was an association between BMI and the TWD of warfarin (Figure 1). With a sample size of 800, the linear regression test has 80% power to detect one normally distributed covariate with Pearson correlation coefficient r > 0.099 from 0 at a 0.050 two-sided significance level. All statistical analyses were performed by JMP version 9 software (SAS Institute Inc, Cary, NC).
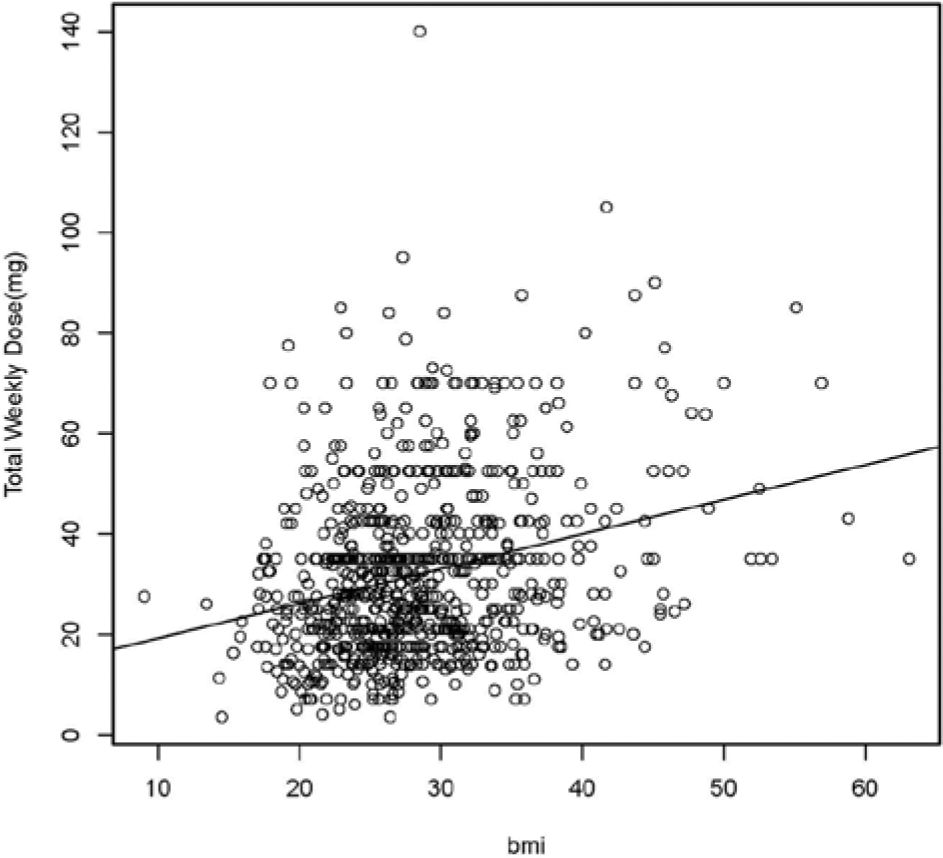
Bivariate fit of total weekly dose by body mass index (BMI).
Results
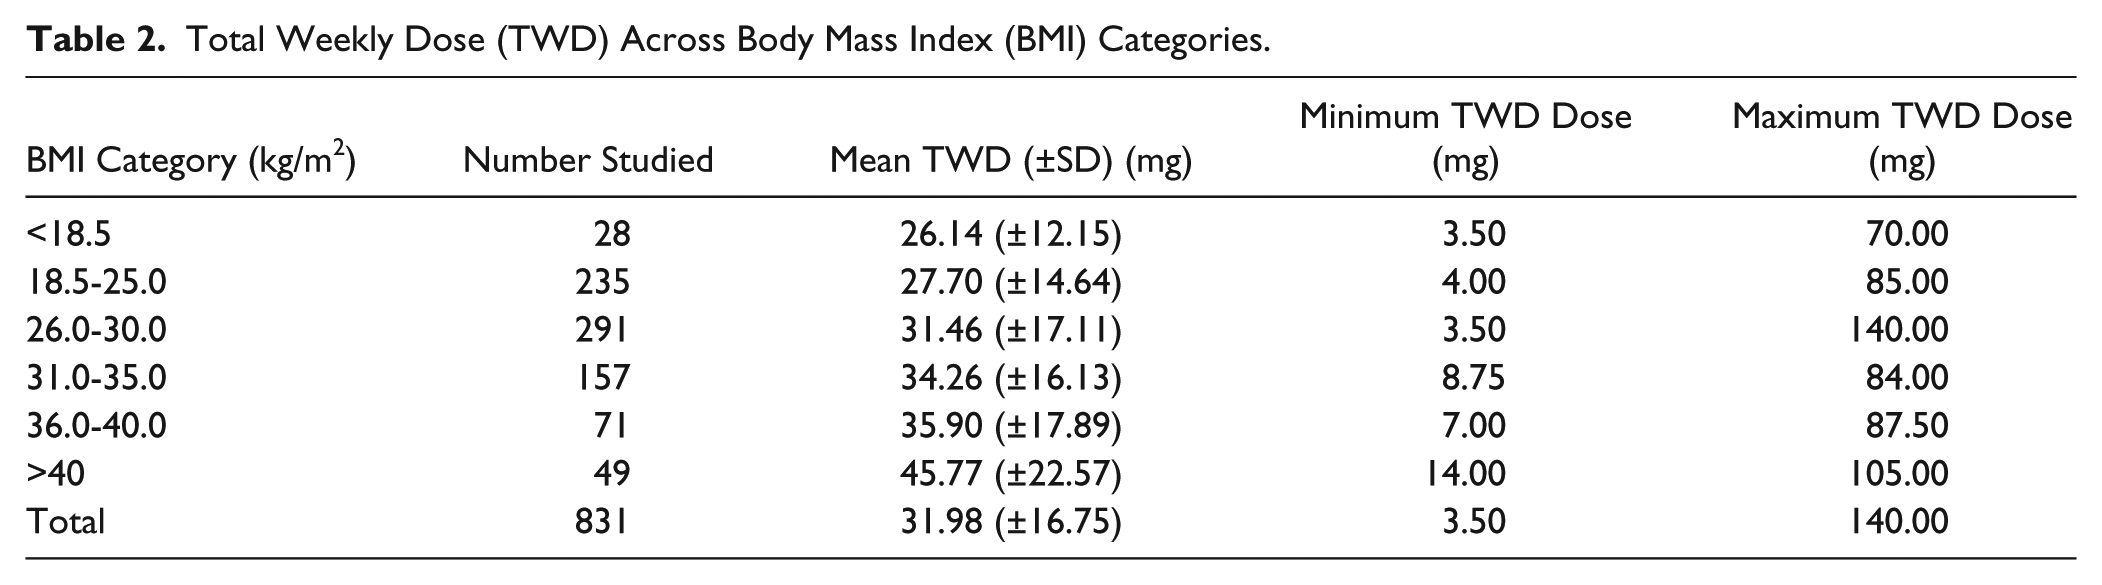
In all, 831 patients were included in the analysis. The weekly dose of warfarin varied between 3.5 and 140 mg with an average TWD of 32 mg. BMI values varied between 13.4 and 63.1 kg/m2 with the majority of the patients having a BMI value between 18.5 and 34.9 kg/m2 (Table 2). The most common BMI range was 26 to 30 kg/m2; the average BMI was 28.4 kg/m2. Age of the participants ranged from 19 to 96 years. Indications for warfarin therapy included atrial fibrillation, heart failure, pulmonary embolism, stroke, venous thromboembolism, valvular heart disease, and biological or mechanical valve replacement. The target INR ranges in the study were 2.0 to 3.0 or 2.5 to 3.5 (Table 1). The most commonly used target INR range was 2.0 to 3.0 for patients diagnosed with atrial fibrillation, pulmonary embolism, venous thromboembolism, and heart failure. Patients who had a target INR range of 2.5 to 3.5 were taking anticoagulation therapy because of biological or mechanical valve replacement or valvular heart disease.
Characteristics of Study Patients.
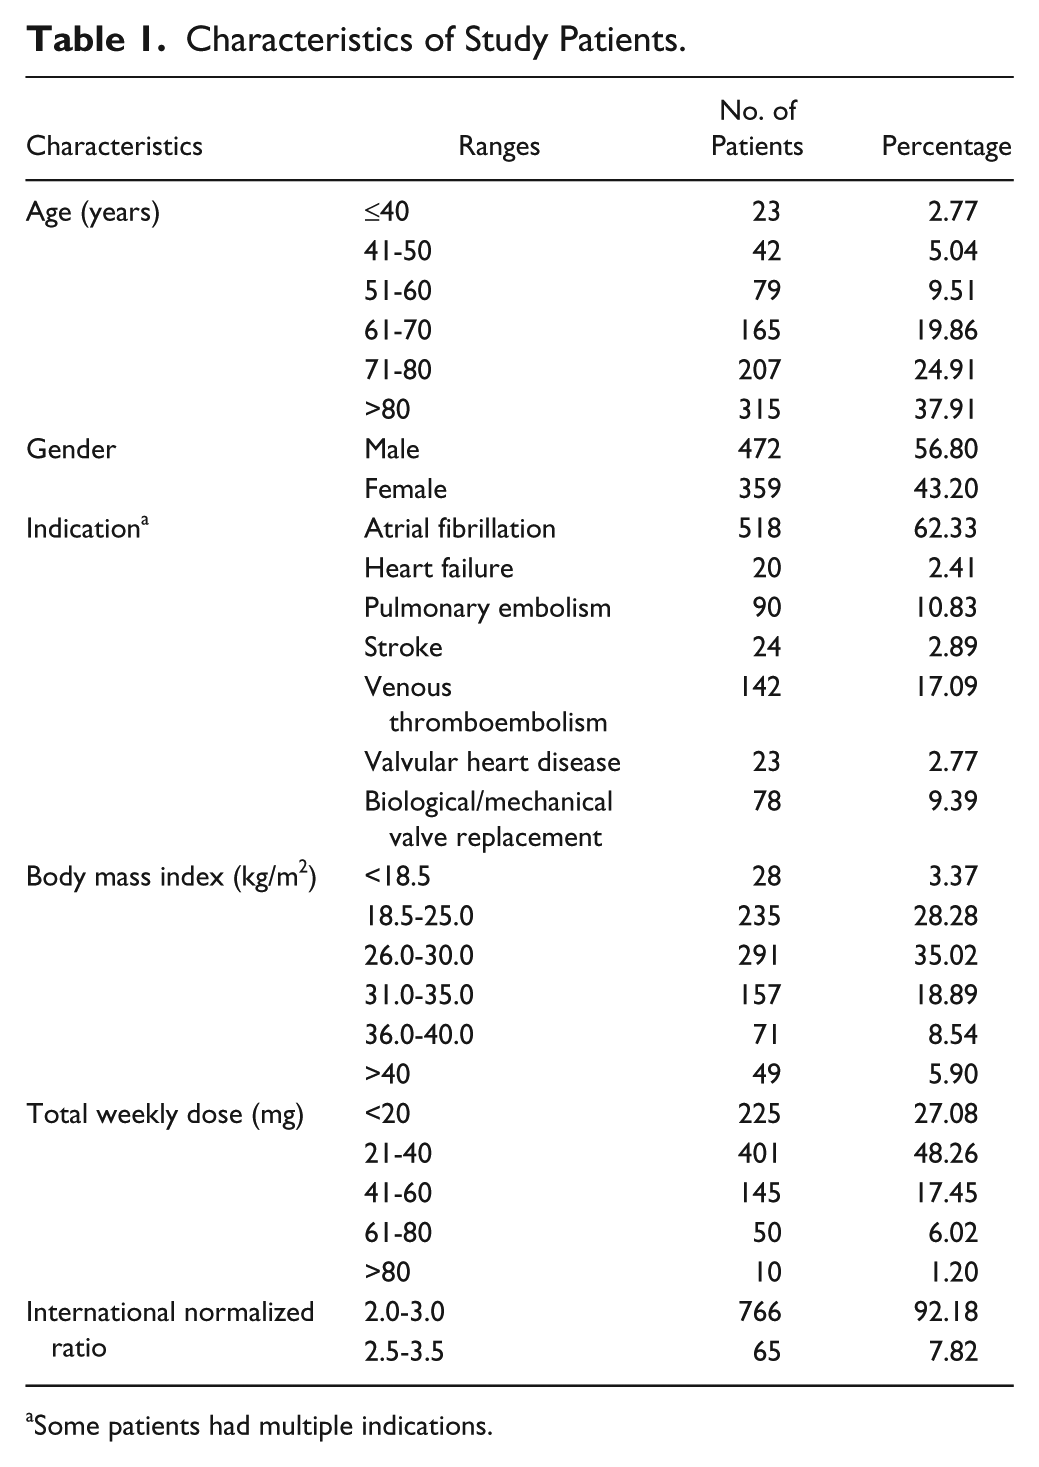
Some patients had multiple indications.
Total Weekly Dose (TWD) Across Body Mass Index (BMI) Categories.
There was a strong relationship between warfarin dose and BMI. For each 1-unit increase in BMI, the weekly warfarin dose increased by 0.69 mg (P < .001). After controlling for age and gender, the relationship between BMI and warfarin dosing remained. Using the linear fit (Figure 1), the average warfarin weekly dose in this population can be estimated using the formula: 12.34 + 0.69 × BMI. In summary, based on this analysis, patients with a higher BMI would require a higher TWD of warfarin to maintain a stable therapeutic INR.
Discussion
Warfarin maintenance dosing can be challenging due to variations in patient characteristics and lack of standardized dosing. Several studies have looked at individual patient characteristics in relation to this dosing10,17-22,24-26; however, few have addressed BMI or weight. We found that BMI has a small but significant effect on TWD. Our study showed that for each 1-point increase in BMI the average weekly warfarin dose increased by 0.69 mg. This could have dosing implications for both patients and prescribers, as patients with a high BMI will be expected to require higher doses of warfarin to maintain a therapeutic INR.
Our study has limitations. The minimum period for a therapeutic INR level in this patient population was 30 days without a change in dose, and this could have been too short a period to confirm a stable dose. However, most patients studied had a longer length of time without a significant dose change, confirmed by a chart review when available. Specific data on length of therapeutic INR was not collected. Also, we did not account for diet, which can raise or lower the dose of warfarin by multiple mechanisms, most important, because of the amount of vitamin K in the diet. However, it would be unlikely that obese patients as a group had consistent diets with higher levels of this vitamin, but this cannot be confirmed in our study. In addition, we did not control for medications that interact with warfarin. Many medications affect the dosing of warfarin either by increasing or decreasing the warfarin metabolism and availability. Although this was not specifically addressed in this study, again, it is unlikely that obese patients as a group were taking a larger proportion of medications that inhibited warfarin. Using BMI as a measure of obesity also has known limitations as it does not distinguish between fat and muscle particularly in younger patients. Future studies could incorporate waist circumference or other measures to confirm these results. Finally, our study is retrospective therefore all confounding factors could not be assessed or controlled for (ie, diet, provider dosing differences, etc). A prospective study using our formula could validate these results.
In a recent study, Wallace et al 25 evaluated patients across 5 BMI categories similar to those in this study, who were initiated on warfarin therapy while hospitalized and compared the warfarin doses and the time required to achieve therapeutic INR among these groups. Their study demonstrated that obese and morbidly obese patients required a longer period to become therapeutic after initiation of warfarin. The obese and morbidly obese also had an overall higher average daily dose and mean discharge dose after initiation. They concluded that clinicians should anticipate a 40% to 50% higher initial warfarin dose in the obese patient population. Our study adds to this knowledge by confirming that patients with a high BMI also need an increased dose of warfarin to maintain therapeutic levels. Previous studies have also indicated that body surface area has an effect on warfarin dose. Gage et al 28 found in their study that there was an 11% increase in the therapeutic warfarin dose for each 0.25 m2 increase in body surface area. An additional study found a correlation between warfarin dose and body surface area in patients who had stable doses of warfarin; however, there was no significant contribution on the regression model for dose. 19
Although there are several novel anticoagulant medications that are now available to providers, warfarin remains the mainstay drug used for anticoagulation and there is still a large population of patients that require this medication. To improve safety, many organizations use dosing protocols to guide physicians or to enable mid-level providers, pharmacists, or nurses to dose warfarin. 13 Developing these protocols and individualizing them to each patient requires knowledge about patients’ characteristics that can affect dosing. Genetic polymorphisms (CYP2C9 and VKORC1), are known to affect the metabolism of warfarin and can cause dosing variability. However, variability remains even within populations with these genetic factors therefore they do not completely account for the wide variability.29,30 Understanding all the factors that influence dosing of warfarin, including BMI, is critical to using prediction models and protocols.
In conclusion, our study showed that there is a positive correlation between BMI and warfarin steady-state dosing. Although prior studies have suggested a correlation, to our knowledge, this is the first study that has confirmed this correlation within BMI categories including a specific correction factor. Further studies examining other patient characteristics may be helpful for developing dosing protocols in order to continue to improve the safety of this high-risk medication.
Footnotes
Declaration of Conflicting Interests
The author(s) declared no potential conflicts of interest with respect to the research, authorship, and/or publication of this article.
Funding
The author(s) received no financial support for the research, authorship, and/or publication of this article.