






Abstract
Background:
The US Food and Drug Administration (FDA) recommends using only FDA-reviewed pharmacogenetic information to make prescribing decisions based on genetic test results. Such information is available in drug labeling and in the Table of Pharmacogenetic Associations (“Associations table”).
Objective:
To compile a list of drug-gene pairs from drug labeling and the Associations table and categorize the pharmacogenetic information and clinical outcome associated with each drug-gene pair.
Methods:
This was a cross-sectional analysis of pharmacogenetic information in the Associations table and individual drug labeling in March 2020. We used the Table of Pharmacogenomic Biomarkers in Drug Labeling to identify drug labels to review. We categorized the pharmacogenetic information for each drug-gene pair according to whether the purpose was to describe (1) polymorphisms affecting drug disposition (metabolism or transport), (2) polymorphisms affecting a direct drug target, (3) variants associated with adverse drug reaction (ADR) susceptibility, (4) variants associated with therapeutic failure, (5) a biomarker-defined indication, or (6) a biomarker-defined ADR. We also categorized the clinical outcome—efficacy, safety, or unknown—associated with each drug-gene pair. We reported counts and proportions of drug-gene pairs in each pharmacogenetic information and clinical outcome category.
Results:
We identified 308 drug-gene pairs, of which 36% were associated with a biomarker-defined drug indication, 33% with polymorphic drug metabolism, and 28% with ADR susceptibility. Most drug-gene pairs (n = 267, 87%) were associated with an efficacy or safety-related outcome.
Conclusion and Relevance:
FDA-reviewed pharmacogenetic information is available for more than 300 drug-gene pairs and can help guide prescribing decisions.
Keywords
Background
The incorporation of pharmacogenetic testing in clinical practice has become an increasingly recognized strategy for optimizing medication use.1-3 Certain genetic variants are known to be associated with clinically important interindividual differences in drug disposition, susceptibility risk to adverse drug reactions (ADRs; eg, human leukocyte antigen [HLA]-B*57:01 positive status and abacavir hypersensitivity reaction), and likelihood of therapeutic response.4,5 Clinicians can use a patient’s pharmacogenetic profile to help select appropriate drugs and dosing while avoiding treatments likely to cause ADRs or result in therapeutic failure.
Although pharmacogenetic clinical practice guidelines are available from several professional organizations, the US Food and Drug Administration (FDA) has warned against the use of pharmacogenetic information that has not undergone FDA review to guide prescribing decisions.6-9 The FDA website provides 2 online tables with FDA-reviewed pharmacogenetic information. The first table, established in 2008, is the Table of Pharmacogenomic Biomarkers in Drug Labeling.10,11 As the name suggests, the table gives a listing of biomarkers and sections of individual drug labeling that include the biomarker. Although the table does not summarize pharmacogenetic information for each drug-biomarker pair, users can navigate from the table to the FDA-approved drug label housed in the drugs@fda database and then use the sections of drug labeling listed in the table to guide review of the drug label for biomarker information. The second table, launched in 2020 and named the Table of Pharmacogenetic Associations, gives a listing of drugs associated with genetic variations in drug metabolism, drug transport, drug targets, or ADR risk and may include information not found in drug labeling.12,13 Each drug-gene pair on this table is accompanied by a description of the drug-gene interaction, a description of the affected patient subgroups, and a tier of supporting data for the pharmacogenetic association.
To our knowledge, compilation and categorization of pharmacogenetic information from these 2 FDA resources has not yet been conducted. Characterizing FDA-reviewed effects of genetic variation in drug disposition and response may be helpful to clinicians seeking authoritative information and guidance on applying genomic findings to patient care.
Objectives
The purpose of this study was to compile a single list of FDA-validated drug-gene pairs and categorize the pharmacogenetic information and clinical outcome associated with each pair based on review of individual drug labels and information in the Table of Pharmacogenetic Associations. We additionally sought to describe differences in coverage and content between the FDA Table of Biomarkers in Drug Labeling and the FDA Table of Pharmacogenetic Associations.
Methods
Data Extraction
On March 3, 2020, one author (CMC) recorded the following data from the FDA Table of Biomarkers in Drug Labeling (“Biomarker table”): drug name, biomarker name, therapeutic area, and labeling sections. The same author also recorded the following data from the Table of Pharmacogenetic Associations (“Associations table”): drug name, gene name, affected patient subgroups, drug-gene interaction description, and evidence tier:
Data support therapeutic management recommenda-tions.
Data indicate a potential impact on safety or response.
Data demonstrate a potential impact on pharmacokinetic properties only.
If the Biomarker table listed a group of biomarkers (eg, urea cycle disorders) as a single entry on the table, then we correspondingly listed the group as a single biomarker entry in our data set. Furthermore, for the purposes of this study, we referred to each biomarker entry as a gene to simplify recordkeeping and cross-referencing data between the 2 tables.
Our study did not require an ethics board approval because no human subjects were involved.
Categorization of Pharmacogenetic Information and Clinical Outcome
We developed categories to classify the pharmacogenetic information in the label and/or the Associations table. We based our categories on FDA guidance documents and schema from previously published literature.14-16 The categories were as follows (Table 1):
polymorphism affecting drug metabolism, where genetic variation in a drug metabolizing enzyme altered exposure to the active drug moiety;
polymorphism affecting drug transport, where genetic variation in a drug transporter altered uptake to organs responsible for the drug’s biotransformation or excretion;
polymorphism affecting a drug’s direct protein target, where genetic variation in the drug target led to altered drug sensitivity and interindividual differences in dose requirement;
variant associated with increased ADR susceptibility, where genetic variation increased an individual’s risk for an ADR through mechanisms other than drug metabolism or transport;
variant associated with poor therapeutic effect, where genetic variation predicted poor therapeutic response to the drug through mechanisms other than drug metabolism or transport;
biomarker-defined drug indication, where the drug had at least 1 FDA-approved indication based on presence or absence of the biomarker; and
biomarker-defined ADR, where an ADR was characterized by presence or absence of the biomarker
Pharmacogenetic Information Categories and Clinical Outcome Categories for Drug-Gene Pairs Listed in FDA Resources.

Abbreviations: ADR, adverse drug reaction; CFTR, cystic fibrosis transmembrane conductance regulator; CYP, cytochrome P450; DMD, dystrophin; G6PD, glucose-6-phosphate dehydrogenase; HER2, human epidermal growth factor receptor 2; HLA, human leukocyte antigen; IFNL3, interferon lambda 3; RAS, rat sarcoma; SLCO1B1, solute carrier organic anion transporter family member 1B1; SVR, sustained virological response; TPMT, thiopurine methyltransferase; UGT1A1, UDP glucuronosyltransferase family 1 member A1; VKORC1, vitamin K epoxide reductase.
Unrelated to drug disposition.
We additionally categorized the clinical outcome associated with each drug-gene pair based on information in the drug labeling and/or the description of the drug-gene interaction in the Associations table. The categories were as follows:
Drug safety: either or both sources associated genetic variation with an established or potential ADR with standard drug dosing; this category included drug-gene pairs for which either or both sources included recommendations for therapy adjustment (eg, dose modification, dose restriction, close monitoring, avoidance of the drug) to prevent the occurrence of high systemic concentrations of the active drug moiety, regardless of whether the source explicitly described a link between elevated drug concentrations with an established ADR.
Drug efficacy: either or both sources associated genetic variation with increased risk for therapeutic failure or with patient selection for therapy.
Unknown: either or both sources associated genetic variation with differences in drug pharmacokinetic parameters (eg, reduced clearance or increased exposure), but neither source associated these differences with any known impact on safety or efficacy outcomes or included recommendations for therapy adjustment.
Because our focus was on how an individual’s genetic test result could affect drug disposition or response, we excluded drug-gene pairs from categorization if the pharmacogenetic information in drug labeling was present solely to (1) describe a drug interaction (eg, interaction with cytochrome P450 [CYP]-2D6 inhibitor) without association to an individual’s germline genome, (2) describe features of a clinical study (eg, “Patients with hypoparathyroidism due to calcium-sensing receptor mutations were excluded from the trial”), (3) state that a variant had no or unknown effect on drug disposition or response (eg, “Whether a deficiency in [CYP2D6 or CYP2C19] results in elevated systemic exposure to formoterol or systemic adverse effects has not been adequately explored”), (4) describe a drug-gene interaction that involved a drug other than the index drug (eg, the ceftriaxone labeling includes information on risk for methemoglobinemia with use of local anesthetics in patients with glucose-6-phosphate dehydrogenase[G6PD] deficiency), (5) describe a drug’s place in therapy (eg, “LONSURF is indicated for the treatment of adult patients with metastatic colorectal cancer previously treated with fluoropyrimidine-, oxaliplatin- and irinotecan-based chemotherapy, an anti-VEGF biological therapy, and if RAS wild-type, an anti-EGFR [epidermal growth factor receptor] therapy”), or (6) describe a drug’s pharmacological mechanism of action without mention of variant-based patient selection criteria or action to be taken (eg, “Avelumab binds PD-L1 and blocks the interaction between PD-L1 and its receptors”).17-21 We also excluded drugs from either source if neither the generic nor branded product was marketed in the United States according to the FDA Orange Book. 22
Data Evaluation and Synthesis
We used the links provided on the Biomarker table webpage to navigate to the most recent drug label posted to the drugs@fda database for each drug. If a label was not available in drugs@fda, then we searched for the structured product label on DailyMed. We recorded the application number and version date of each drug label that we reviewed for this study (Supplemental Table 1, available online). For each drug-gene pair, 2 authors (CMC and TWS) independently reviewed sections of drug labeling specified in the Biomarker table and, if available, the drug-gene interaction description on the Associations table, and assigned a pharmacogenetic information category and clinical outcome category using the categorization schemas described above. For drug-gene pairs listed exclusively in the Associations table (and not in drug labeling), we based our categorizations solely on information in the Associations table. A third author (JLB) reviewed the final categorizations. Any disagreements in category assignments were resolved through discussion until consensus.
We used the therapeutic area associated with each drug on the Biomarker table to allow for descriptive grouping of drugs. For drugs that were listed only in the Associations table, we assigned a therapeutic area based on the designations of similar drugs on the Biomarker table.
Outcome Measures
Our primary outcome measures were counts and proportions of drug-gene pairs associated with the different categories of pharmacogenetic information and clinical outcomes. Our secondary outcome measures were the numbers of drug-gene pairs included on the Associations table but missing from the Biomarker table and the numbers of drug-gene pairs found in both sources but with differing information. We recorded all data in MS Excel.
Results
There were a total of 409 drug-gene pairs listed in FDA sources, including 405 pairs on the Biomarker table and 109 pairs on the Association table. We excluded 97 pairs on the Biomarker table because the purpose of the pharmacogenetic information in the drug label was to describe clinical trial design features (n = 44), place in therapy (n = 5), impact of genetic variation on drugs other than the index drug (n = 4), genetic variation with no or unknown influence on drug disposition or response (n = 28), drug-drug interactions (n = 8), or the drug’s mechanism of action without reference to inherited variation or variant-based criteria for therapy selection (n = 8). We additionally excluded 4 drug-gene pairs (mivacurium/butyrylcholinesterase, simeprevir/interferon lambda 3 (IFNL3), telaprevir/IFNL3, tolazamide/G6PD) from one or both tables because the drug was no longer marketed in the United States (Supplemental Table 2, available online).
Overall, there were 308 drug-gene pairs involving 232 unique drugs used in a variety of therapeutic areas included in our study (Figure 1). The average number of genes involved with each drug was 1.3 (range, 1-6). The pharmacogenetic information for most drugs (n = 181, 78%) concerned just a single gene. There were 3 pharmacogenetic information categories that accounted for nearly all (n = 299, 97%) drug-gene pairs: biomarker-defined drug indication (n = 110), polymorphisms affecting drug metabolism (n = 101), and variants associated with increased ADR susceptibility (n = 88; Table 2).
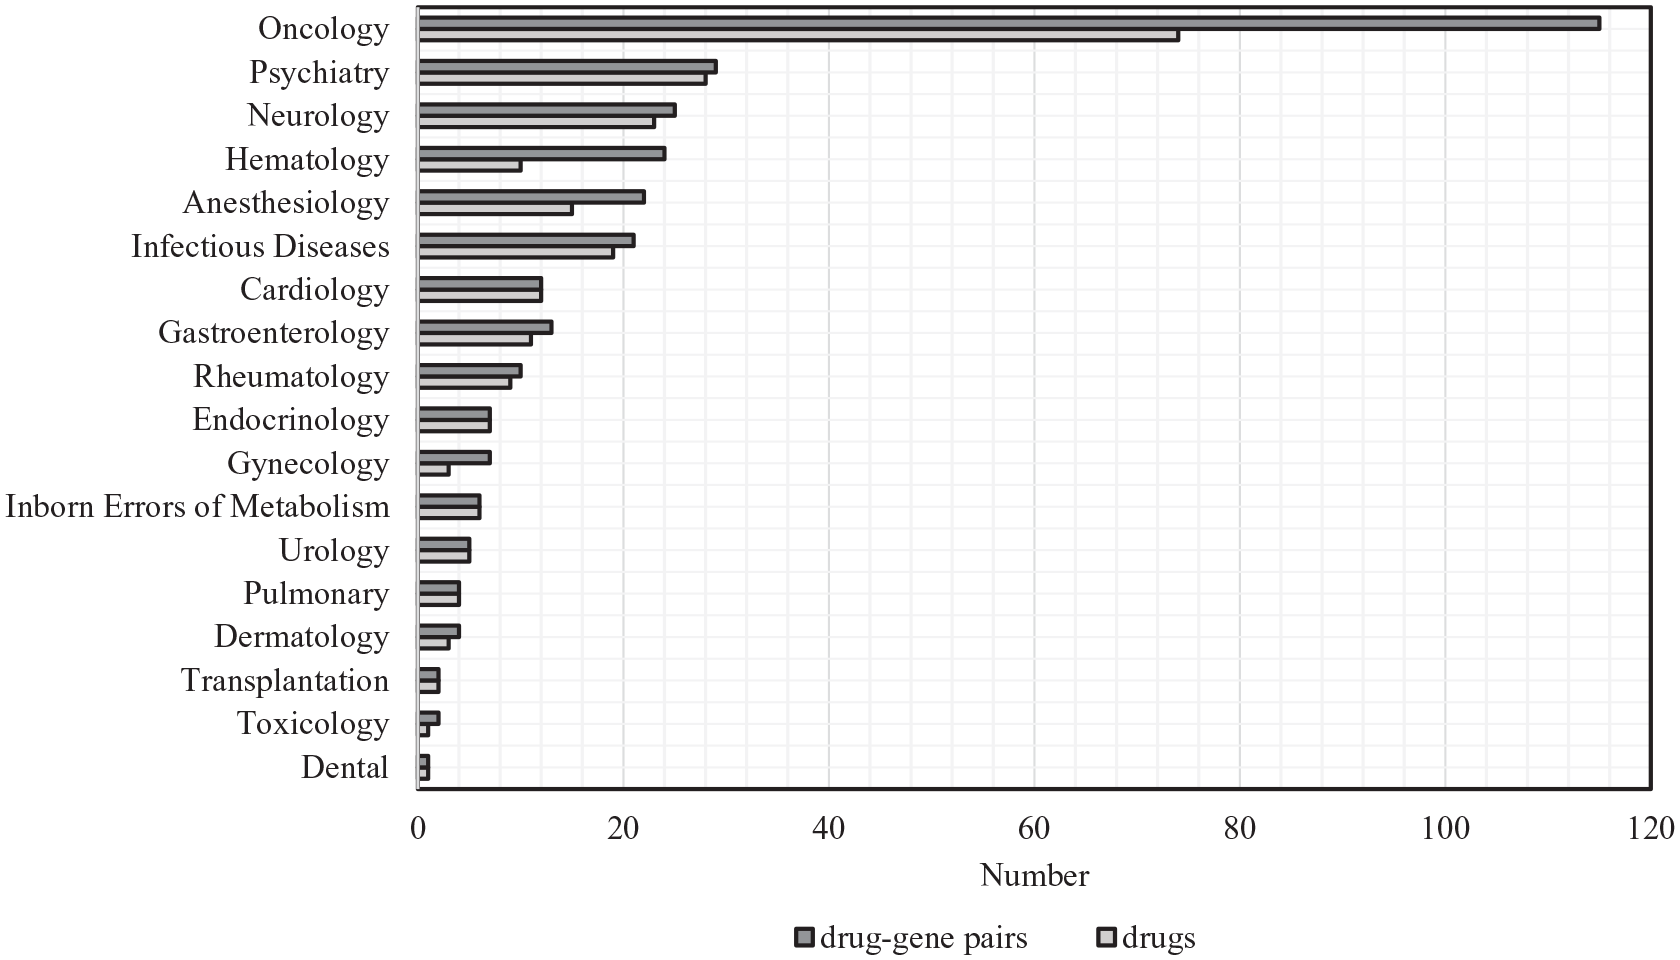
Therapeutic areasa of drugs and drug-gene pairs associated with pharmacogenetic information.
Numbers of Drug-Gene Pairs and Drugs Associated With Categories of Pharmacogenetic Information and Clinical Outcome in FDA Resources.

Abbreviations: ADR, adverse drug reaction; CYP, cytochrome P450; FDA, Food and Drug Administration.
A given drug may be affected by multiple genes associated with different pharmacogenetic information categories.
Codeine/CYP2D6 and eliglustat/CYP2D6 were both associated with polymorphic drug metabolism and with both efficacy and safety outcomes depending on CYP2D6 phenotype. Eliglustat/CYP2D6 was associated with both biomarker-defined drug indication and polymorphic drug metabolism.
Most drug-gene pairs with at least 1 biomarker-defined drug indication involved an oncology drug (n = 89, 80%). Among these pairs, the most prevalent biomarkers were HER2 (human epidermal growth factor receptor 2; n = 14), ESR (estrogen receptor) or PGR (progesterone receptor; n = 14), EGFR (n = 9), ALK (anaplastic lymphoma kinase; n = 8), BCR-ABL1 (Philadelphia chromosome; n = 6), BRCA (breast cancer gene; n = 6), and BRAF (B-Raf proto-oncogene, serine/threonine kinase; n = 6). The remaining 21 drug-gene pairs in this category involved therapies for genetic disorders such as cystic fibrosis (n = 4), sickle cell disease (n = 3), transthyretin amyloidosis (n = 3), and Duchenne muscular dystrophy (n = 2). A total of 38 drugs, corresponding to 47 drug-gene pairs, had been approved with a companion diagnostic to facilitate appropriate patient selection for treatment with the drug.
Polymorphisms in genes encoding drug metabolizing enzymes affected 95 drugs in 101 drug-gene pairs. The majority of the pairs (n = 78, 76%) involved genes for CYP2D6 (n = 52), CYP2C19 (n = 15), CYP2C9 (n = 11), and N-acetyltransferase (n = 7) and drugs from a variety of therapeutic areas including psychiatry (n = 29), neurology (n = 13), oncology (n = 11), cardiology (n = 8), and gastroenterology (n = 8).
We assigned 1 drug-gene pair, eliglustat/CYP2D6, to 2 pharmacogenetic information categories. This drug-gene pair was associated with polymorphism affecting drug metabolism because CYP2D6 allelic variants can affect eliglustat plasma concentrations. It was also associated with a biomarker-defined indication because CYP2D6 testing is necessary to determine treatment eligibility and appropriate dosing; eliglustat should not be used for treatment of Gaucher’s disease in CYP2D6 ultrarapid metabolizers because these individuals may not achieve therapeutic drug concentrations. 23
There were 88 drug-gene pairs involving 69 drugs and 21 genes associated with increased susceptibility to an ADR. Among these drug-gene pairs, the most prevalent genes and associated ADRs were G6PD deficiency and risk of hemolytic anemia (n = 30), genetic deficiencies in factor V Leiden, prothrombin, antithrombin III, protein C or protein S and increased risk for thrombosis (n = 20), and genetic variants associated with high risk susceptibility for methemoglobinemia (n = 18). There were 10 drug-gene pairs comprising histocompatibility complex (HLA) variants associated with an increased risk for immune-mediated ADRs: abacavir/HLA-B*57:01, allopurinol/HLA-B*58:01, carbamazepine/HLA-A*31:01, carbamazepine/HLA-B*15:02, oxcarbazepine/HLA-B*15:02, pazopanib/HLA-B*57:01, lapatinib/HLA-DQA1*02:01, lapatinib/HLA-DRB1*07:01, phenytoin/HLA-B*15:02, and fosphenytoin/HLA-B*15:02.
All 3 drug-gene pairs associated with polymorphic drug transport involved the SLCO1B1 gene. This gene encodes the OATP1B1 uptake transporter responsible for hepatic uptake of simvastatin, elagolix, and rosuvastatin for metabolism and elimination from the body.
The 3 drug-gene pairs associated with poor therapeutic effect unrelated to altered drug disposition were busulfan/BCR-ABL1 (Philadelphia chromosome), peginterferon alfa-2b/IFNL3, and warfarin/CYP4F2. According to the drug label, busulfan is less effective in patients with chronic myelogenous leukemia who lack the Philadelphia chromosome. Similarly, the drug label of peginterferon alfa-2b states that patients with IFNL3 CT or TT genotype had lower rates of sustained virological response when used in combination with ribavirin for treatment of chronic hepatitis C virus infection compared with patients with the CC genotype. Only the Associations table listed warfarin/CYP4F2. Carriers of the CYP4F2 V433M variant may have higher bioavailability of vitamin K and, therefore, require higher than standard warfarin doses to achieve a therapeutic INR.
The 2 drug-gene pairs with a biomarker-defined ADR involved development of RAS mutation–positive malignancies with exposure to BRAF inhibitors dabrafenib and vemurafenib. Warfarin was the only drug associated with altered response as a result of polymorphisms affecting the gene encoding its drug target, VKORC1 (vitamin K epoxide reductase).
Overall, the pharmacogenetic information of nearly half (n = 152, 49%) of all drug-gene pairs had a safety-related outcome, and more than a third (n = 116, 38%) had an efficacy-related outcome. Most of the drug-gene pairs that influenced drug efficacy were comprised of disease-related genetic variants that defined the drug’s therapeutic indication (n = 110, 95%), whereas those affecting drug safety could be a result of polymorphisms in drug metabolism, drug transport or drug target, or variants associated with ADR susceptibility risk. Two drug-gene pairs, codeine/CYP2D6 and eliglustat/CYP2D6, were associated with both safety and efficacy outcomes. Use of codeine in CYP2D6 ultrarapid metabolizers may increase the risk for respiratory depression, whereas use in CYP2D6 poor metabolizers could result in poor analgesia. As previously described, the eliglustat label stated that the drug was not indicated for use in CYP2D6 ultrarapid metabolizers due to of likelihood of therapeutic failure; however, the label also warned against concomitant use of CYP3A inhibitors in CYP2D6 intermediate and poor metabolizers because of an increased risk for cardiac adverse events, including QT prolongation. 23
In all, 41 drug-gene pairs affected by variation in drug metabolism or drug transport were associated with pharmacokinetic changes, such as increased exposure or reduced clearance but without direct association with a clinical safety or efficacy outcome.
Comparison of Drug Labeling and the Associations Table
Of the 104 drug-gene pairs included in both drug labeling and the Associations table, the information for 87 (84%) was consistent between the 2 sources. There were 14 drug-gene pairs for which phenotypes listed in the Associations table were not found in the corresponding drug label, and an additional 3 drug-gene pairs (amphetamine/CYP2D6, raltegravir/UGT1A1 [UDP glucuronosyltransferase family 1 member A1], venlafaxine/CYP2D6) for which the drug-gene interaction description differed between the 2 sources (Table 3). There were 4 drug-gene pairs on the Associations table that were missing from drug labeling: simvastatin/SLCO1B1, allopurinol/HLA-B*58:01, tacrolimus/CYP3A5, and warfarin/CYP4F2.
Discrepancies in Pharmacogenetic Information Between Drug Labeling and the Table of Pharmacogenetic Associations.

Abbreviations: ADR, adverse drug reaction; BCHE, butyrylcholinesterase; CYP, cytochrome P450; DPYD, dihydropyrimidine dehydrogenase; EM, extensive metabolizers; HLA, human leukocyte antigen; IM, intermediate metabolizers; NAT, N-acetyltransferase; NM, normal metabolizers; NUDT15, nudix hydrolase 15; ODV, O-desmethylvenlafaxine; PK, pharmacokinetics; PM, poor metabolizers; SLCO1B1, solute carrier organic anion transporter family member 1B1; TPMT, thiopurine methyltransferase; UGT1A1, UDP glucuronosyltransferase family 1 member A1; UM, ultrarapid metabolizers.
Phenotype listed in both labeling and Table of Pharmacogenetic Associations.
There were also instances where phenotype descriptions between the label and the Associations table differed and required genotype-to-phenotype translation or literature search to determine whether the terms used were equivalent.
The Biomarker table, which was our reference source for drug labeling with pharmacogenetic information, included nearly 3 times as many drug-gene pairs included in this study as the Associations table. Although most of the drug-gene pairs exclusive to the Biomarker table were those associated with biomarker-defined indications and non–HLA-mediated susceptibility to ADRs, there were several drug-gene pairs associated with polymorphic drug metabolism that we found in the drug label and that were not included in the Associations table. Examples included duloxetine/CYP2D6, flibanserin/CYP2D6, flibanserin/CYP2C9, lesinurad/CYP2C9, meloxicam/CYP2C9, and pitolisant/CYP2D6.
Discussion
Our study identified 308 FDA-validated drug-gene pairs affected by genetic variation, of which 267 (87%) were associated with safety or efficacy-related clinical outcomes. Nearly all drug-gene pairs involved either polymorphisms in drug metabolism, ADR susceptibility, or association with at least 1 biomarker-defined indication. Except for 4 drug-gene pairs, all the drug-gene interactions listed on the Associations table were also found in drug labeling, though the Associations table listed additional affected patient subgroups for some of the drug-gene pairs. Conversely, the drug labeling referenced in the Biomarker table was the sole source of nearly all drug-gene pairs associated with a biomarker-defined indication, biomarker-defined ADR, or susceptibility to a non–HLA-mediated ADR. Thus, at the present time, clinicians should consult both tables for a comprehensive view of FDA-reviewed pharmacogenetic information.
To our knowledge, this is the first study to compile and categorize pharmacogenetic information from both drug labeling and the Associations table. Having a single list of FDA-reviewed drug-gene pairs associated with clinically meaningful pharmacogenetic information is important considering that the FDA recommends use of pharmacogenetic information that has undergone agency review to make prescribing decisions based on a genetic test result.
Although previous studies have described reasons for why a gene may be included in the drug label, we were surprised that nearly 20% of the drug-gene pairs listed on the Biomarker table were associated with label information that did not pertain to clinician use of genetic test results to guide drug selection, therapy adjustment, or monitoring.24,25 As such, an additional column with a categorization of pharmacogenetic information, akin to what we used in this study, may help provide additional context for the label information.
Although the Associations table provided more focused information on clinically relevant drug-gene interactions, we observed differences between the Associations table and drug labeling that may be confusing to users who try to cross-reference the 2 sources. Use of different phenotype terms—for example, slow acetylator versus poor metabolizer—and inclusion of additional phenotypes or drug-gene interactions in the Associations table but missing from the label may raise questions as to what information in each resource to use. Notation to identify instances where information in the table is inconsistent with and should supersede the drug label, or whether certain terms should be considered equivalent, may be helpful for bridging information between the 2 sources while maintaining currency with new research and changes to pharmacogenetic clinical practice standards. 26
Our study has several limitations. First, we reviewed only the labeling linked to the Biomarker table and did not separately review labeling from each manufacturer or for different formulations of a given drug that may have included information on additional genes or variants that could influence drug disposition or response. Nor did we query drug label databases to identify drug-gene interactions that may have been missing from the Biomarker table. 27 In addition, we did not assess the clinical utility of the genetic information for each drug-gene pair, because some—for example, peginterferon alfa-2b/INFL3 and clopidogrel/CYP2C19—may be inconsequential in certain practice settings because of availability of newer, safer, and more effective alternate therapies.28,29 Nor did we compare the information in FDA sources with pharmacogenetic guidelines from professional organizations such as the Clinical Pharmacogenetics Implementation Consortium or the Dutch Pharmacogenetics Working Group or data repositories such as PharmGKB. It was beyond the scope of this study to assess whether additional drug-gene pairs should have been included or whether the outcomes attributed to a given drug-gene pair in the FDA sources was consistent or complete relative to information in other sources. These evaluations as well as an assessment of whether our pharmacogenetic categorization schemas could be used to characterize and compare information in these other sources are a topic of future research. Whether and how the FDA will update its pharmacogenetic resources also remains to be seen. At the time of this writing, the FDA docket for the Associations table was open for comments and feedback. 30 Finally, our evaluation was limited only to the content of the Biomarker table and Associations table in March 2020.
Conclusions and Relevance
There are more than 300 FDA-reviewed and validated drug-gene interactions, and the majority of these are associated with an efficacy or safety-related outcome. Clinicians should be aware that a wide range of clinically relevant pharmacogenetic information is available in drug labeling and the Associations table, with the caveat that coverage of drug-gene pairs differs between the sources, and some inconsistencies in information may exist.
Supplemental Material
sj-pdf-1-aop-10.1177_1060028020983049 – Supplemental material for Characterization of Pharmacogenetic Information in Food and Drug Administration Drug Labeling and the Table of Pharmacogenetic Associations
Supplemental material, sj-pdf-1-aop-10.1177_1060028020983049 for Characterization of Pharmacogenetic Information in Food and Drug Administration Drug Labeling and the Table of Pharmacogenetic Associations by Christine M. Cheng, Thomas W. So and Jeff L. Bubp in Annals of Pharmacotherapy
Footnotes
Authors’ Note
We do not have any similar work that is under review or in press discussing this research. This research has not been previously presented.
Declaration of Conflicting Interests
The authors declared no potential conflicts of interest with respect to the research, authorship, and/or publication of this article.
Funding
The authors received no financial support for the research, authorship, and/or publication of this article.

Supplemental Material
Supplemental material for this article is available online.
References
Supplementary Material
Please find the following supplemental material available below.
For Open Access articles published under a Creative Commons License, all supplemental material carries the same license as the article it is associated with.
For non-Open Access articles published, all supplemental material carries a non-exclusive license, and permission requests for re-use of supplemental material or any part of supplemental material shall be sent directly to the copyright owner as specified in the copyright notice associated with the article.
