
Abstract
To date, work on masculinity ideologies, or the culture-based standards and norms expected of boys and men, has focused almost exclusively on younger adulthood. Given the emphases in men’s lives during middle and late adulthood vis-à-vis young adulthood, it is important to determine what norms script aging men’s lives. The Aging Men’s Masculinity Ideologies Inventory (AMMII) is a measure designed to assess the masculinities relevant to aging men. The present study investigated whether individuals (N = 1,352) of different age groups respond to a scale measuring the gender expectations for aging men in a similar way. Multigroup confirmatory factor analyses were performed to assess the measurement invariance of the AMMII across three age groups—young adults (ages 18–29 years), established adults (ages 30–59 years), and older adults (ages 60+ years). Support for configural, metric, and partial scalar invariance was found, allowing for the comparison of means between groups.
Keywords
Imagine a man who needs to nap after a morning of errands, is unable to shovel the sidewalk, and needs assistance with carrying a small television up from the basement. Would this man be thought of as less of a man because he does not meet the gendered ideals of a strong, self-reliant man? Does it matter if this man is 70 years old rather than 20 years old? The answer may be yes for the 20-year-old man, but we do not know what the masculinity expectations are for aging men. Are they the same as those for young men? Must we assume the cultural blueprint for being a man is “never-aging” (Spector-Mersel, 2006)?
The construct of masculinity ideologies identifies the cultural- and historical-based values that specify the expected gender practices of boys and men (Thompson et al., 1992). They are embedded in people’s attitudes and beliefs about a set of prescriptive (i.e., suggestions for how men should act) and proscriptive (i.e., how men should not act) social norms for gender performances across most contexts. In Western cultures, expectations such as being successful and respected, which are likely applicable to young and aging men alike, have been often referred to as core dimensions of a hegemonic “traditional” masculinity ideology (Levant & Richmond, 2016; Mahalik et al., 2003). Traditional is certainly a contested term, as one must logically ask, traditional for whom and in what context? As Connell and Messerschmidt (2005) argued, “traditional” masculinity ideologies support privileged men’s dominance over other men and all men’s dominance over women within patriarchal societies. The “traditional” masculinity ideologies operationalized by most existing quantitative measures were developed throughout the 1980s–1990s and targeted the values of the privileged found within race (White), class (middle), sexuality (heterosexuality), gender identity (cis gender), age (young), and place (Global North countries).
To illustrate, one commonly used measure is the Male Role Norms Inventory–Short Form (MRNI-SF; Levant et al., 2013), which measures avoidance of femininity, self-reliance through mechanical skills, toughness, dominance, importance of sex, restrictive emotionality, and negativity toward sexual minorities. This and most other measures of traditional masculinity ideologies (TMIs) seek out the acceptable practices and preferences of younger men and boys. As Thompson and Bennett (2015) observed, existing measures do not ascertain aging men’s lives with regard to the significance of fatherhood, grandfatherhood, retirement, loss of physical capital and vitality, care work in midlife and later life, and recoupling after a wife’s death.
It is also an open question as to whether or not any existing measure of masculinity ideologies sufficiently captures people’s expectation for aging and old men. First, existing measures presume masculinities are ageless and disregard how corporeal aging and age relations (or ageism) might affect public expectations about aging men. Examining the content of the most often utilized measures of masculinity ideology, Thompson and Bennett (2015) found that masculinity ideologies were conceptualized in ways that pay no attention to men’s aging. Most often tapped were people’s views about the masculinity standards calling for control of emotionality, physical toughness, and employment. Consequently, the cumulative (dis)advantages of aging (Dannefer, 2003, 2018) and the gendered norms associated with aging men are overshadowed by an emphasis on trait-related criteria such as stoicism or self-sufficiency.
Second, should one of the TMI measures be incorporated in research on aging men, at best a partial grasp of the interaction of later life and masculinities would be identified. All measures forego charting the extent to which aging men might be expected to engage in age-appropriate gender practices such as doing care work. For example, using a sample of aging men, all approximately age 65 years, Springer and Mouzon (2011, 2019) introduce an eight-item Hegemonic Masculinity for Older Men Scale (HMOMS) that is based on items mostly drawn from earlier TMI scales that assess hegemonic masculinity ideals for younger men. Not assessed is any direct evidence of a cohort’s backing of, perhaps embodiment of, age-normative masculinity practices that have been “traditionally” associated with marginalized aging masculinities such as voluntarily leaving the labor force or a preference for spending time with (grand)children.
Responding to this gap in the literature, Levant, Webster, et al. (2020) developed the Aging Men’s Masculinity Ideologies Inventory (AMMII), which is a 15-item scale that taps five features relevant to aging men who are approaching or already in later life (see the appendix). It assesses the extent to which people support a “traditional” masculinity ideology that emphasizes expectations for aging men to not prioritize family relations and fatherhood over employment, retain their patriarchal authority, reject marital negotiation, strive to remain sexually vital, and, if widowed, to recouple. The scale was administered to both men and women because all people have beliefs about how older men should think, feel, and behave. The measure was best modeled with a common (or correlated) factor structure which indicates that the raw scores of the five subscales can be used in research but that it is not advisable to calculate a total scale score.
It has not been common to have several age cohorts assess the bearing of age on masculinity ideals. However, this study’s starting point asks whether people in different life phases similarly or differently perceive the masculinity ideals applicable to aging men. This starting point is rooted in theory that posits people’s embodied gender expectations are relational and endlessly modified throughout the life course as bodily aging and changing social relations determine (Bourdieu, 1984; Gergen, 1985). Given contemporary age relations, younger people likely believe that aging men are not expected to try to define themselves by either the workplace or physical strength and sexual virility (Calasanti, 2004). Instead, to maintain masculine capital, aging men are expected to become active in new fields of masculinities that can sustain their identities as men, such as grandfathering, playing pickleball rather than basketball, or volunteering as a driver for acquaintances who are undergoing chemotherapy (Coles & Vassarotti, 2012; King & Calasanti, 2013; Smith & Winchester, 1998; Thompson, 2019). Our perspective is that life stages normalize different masculinity practices, that masculinity practices are not ageless, and thus, we do not take for granted that masculinity expectations are insensible to the age and life experiences of the evaluator.
The Present Study
Despite growing interest in understanding aging masculinities (Jackson, 2016; Thompson, 2019), research on the masculinity ideologies applicable to aging men is incomplete and suffers from significant methodological weaknesses. An important task in scale development research is to assess the measurement invariance/equivalence of the scale across different groups to determine whether scores from a measure that operationalizes a construct have the same meaning for different groups of people, defined by such demographic variables as gender, race/ethnicity, or age (Meade & Lautenschlager, 2004; Meredith, 1993). According to Horn and McArdle (1992, p. 117), “If there is no evidence indicating presence or absence of measurement invariance . . . findings of differences between individuals and groups cannot be unambiguously interpreted.” In prior research (Levant, Webester et al., 2020), the AMMII demonstrated configural and metric invariance between men and women, which indicates that the constructs tapped by the scale are understood in the same way by women and men—specifically that the slopes from regressing the indicators on their respective factors are equal across these two gender groups.
The present study addresses to what extent the AMMII subscales are invariant across three age groups—young adults (YA; 18–30 years), established adults (EA; 31–59 years), and older adults (OA; 60 and older) 1 —to assess whether people of different ages similarly endorse the masculinity ideology scripting aging men’s lives. It is worthwhile to grasp just how robust the AMMII is and whether men and women of all ages equally recognize the masculinity ideologies expected for older men, although the men and women may not equally endorse the items. Assessing measurement invariance includes examining the level as well as the forms of invariance. Several confirmatory factor analyses (CFAs) are conducted to examine configural invariance (i.e., the items load on the same factor across groups, meaning that the factor structure is the same across groups), metric invariance (i.e., the unstandardized factor loadings are the same across groups, meaning that the items load on the factors with the same strength across groups), and scalar invariance (i.e., unstandardized regression intercepts are the same across groups, meaning that the zero points of the regressions of the items on the factor are the same; Horn & McArdle, 1992; Kline, 2016; Meredith, 1993). Scalar invariance, also referred to as strong invariance (Kline, 2016), strongly suggests that different groups treat the response scale similarly. If respondents across age groups use the agree–disagree scale in the same way, the raw score means can be compared across those groups because the intervals and zero points are not reliably different across groups, which is a key advantage of strong invariance (Kline, 2016).
Method
Recruitment and Survey Procedures
The study was approved by the University of Akron Institutional Review Board (IRB). Community-dwelling adults were recruited using ads on Craigslist, a classified advertisement website, an existing pool of older volunteers, and through colleague referrals. Data from this study that involved the AMMII were used in one prior study: the aforementioned one that developed the AMMII. Almost all of the participants used a Qualtrics website, which hosted the study; only a small number (n = 47) filled out a paper-and-pencil version of the questionnaire. All participants completed an informed consent and then filled out the questionnaire. They were directed to a separate survey to be entered in a raffle for a US$50 gift certificate, which helped ensure anonymity.
Participants
Of the 1,491 individuals recruited from the community to participate in the survey, participants were excluded from analyses if they did not answer at least two thirds of the survey items (n = 82), did not provide an age or were younger than 18 years of age (n = 56), or if responses appeared to be computer generated (n = 1). This resulted in a sample size of 1,352 participants (90.7% completion rate).
Of the 1,352 participants included in the data analysis, 653 (48.7%) identified themselves as men, 687 (50.8%) as women, and less than 1% as transgender and other. With a mean age of 46.63 (SD = 18.03), ages ranged from 18 to 29 years for the group of YA, sometimes referred to as the Millennial cohort; 30 to 59 years for the EA who are mostly Generation Xers; and 60 to 95 years for OA who are part of the Baby Boomer and Silent Generation cohorts. Table 1 summarizes participants’ other sociodemographic characteristics.
Participant Demographic Characteristics by Age Group.
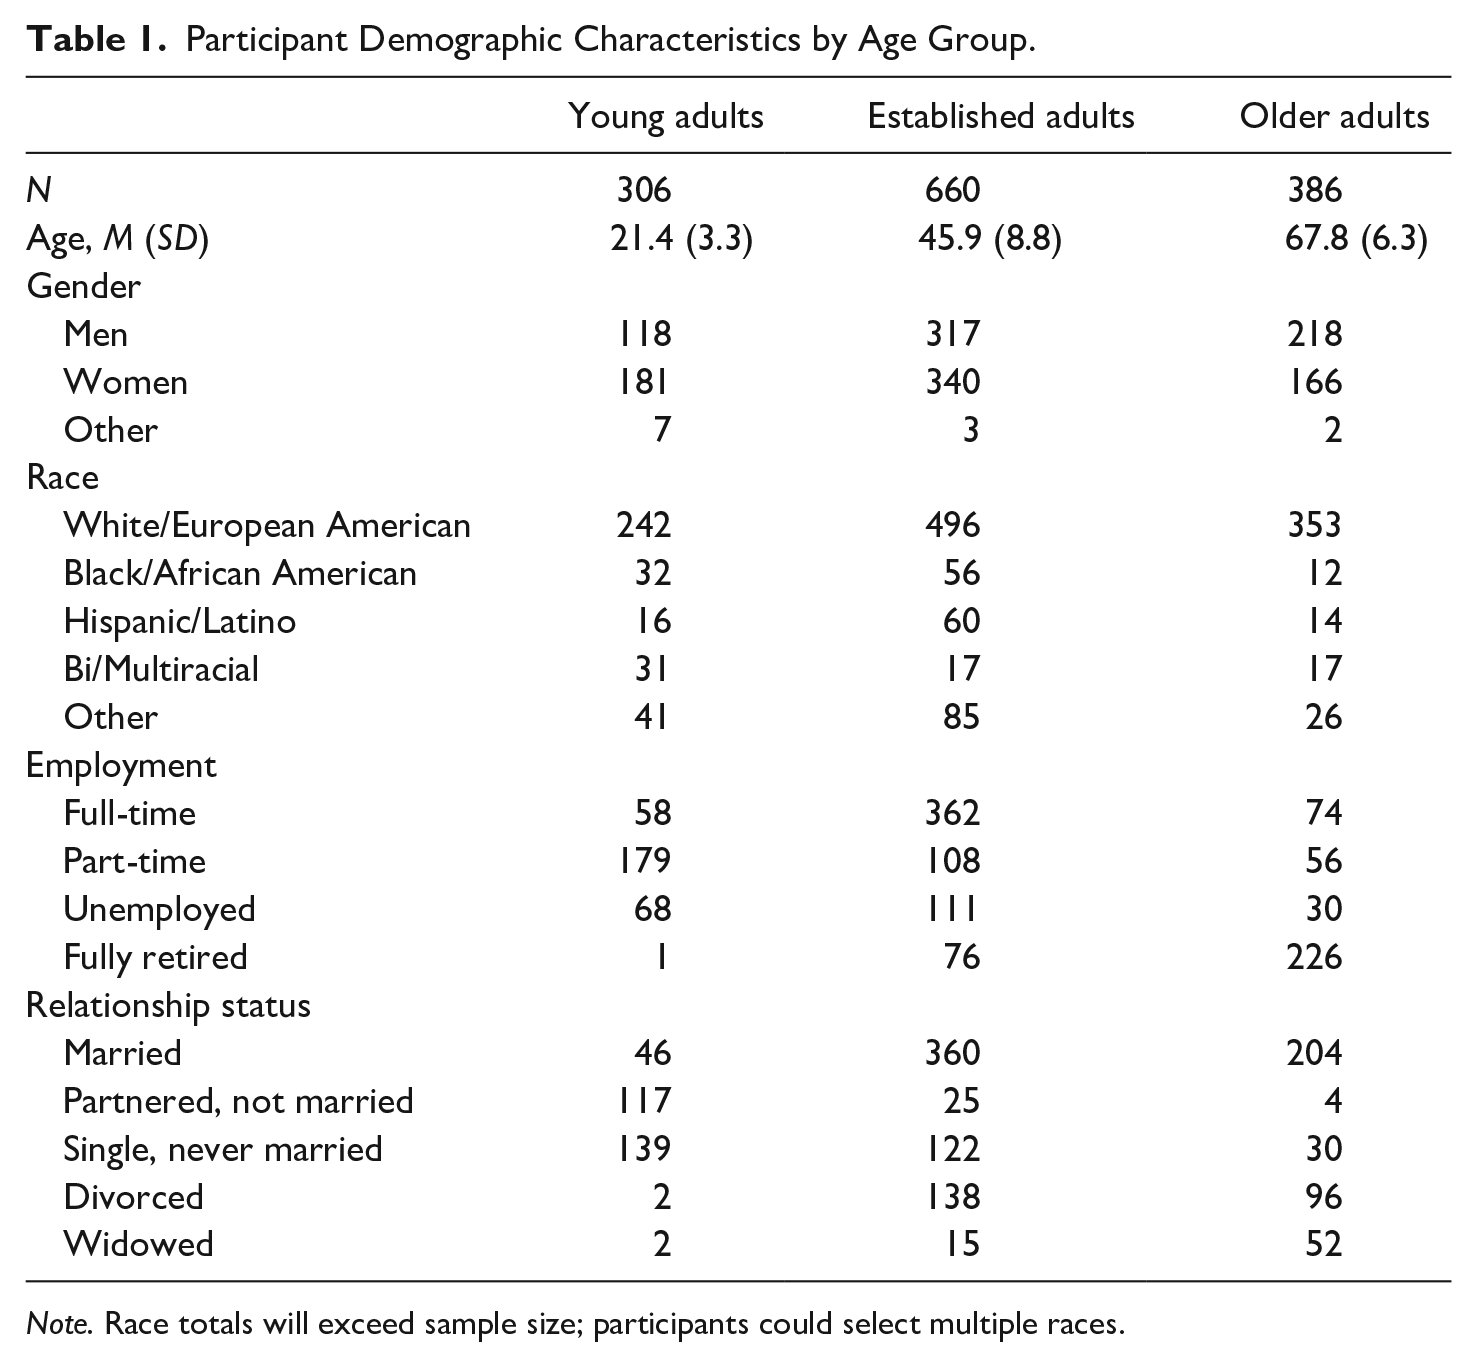
Note. Race totals will exceed sample size; participants could select multiple races.
Sample Size Considerations
We used Soper’s (2013) a priori sample size calculator for structural equation models, with an effect size of .25, power of .8, and p < .05. The minimum sample size to detect an effect is 229. Our three age groups each exceed that number.
Measures
Demographic questionnaire
Demographic items included gender, race/ethnicity, age, relationship status, sexual orientation, education, income, socioeconomic status, and religion.
AMMII
The 15-item AMMII (Levant, Webester et al., 2020) was designed to measure “traditional” masculinity ideologies relevant to older men in five categories: Fatherhood and Family Not Prioritized (FFNP; Cronbach’s α = .62), Reject Marital Negotiation (RMN; Cronbach’s α = .83), Retain Patriarchal Authority (RPA; Cronbach’s α = .52), Recouple After Widowerhood (RAW; Cronbach’s α = .64), and Maintain Sex and Vitality (MS&V; Cronbach’s α = .53). That four of the AMMII factors that have low alpha coefficients (ranging from .52 to .64) are not unexpected given that the five scales have a small number of items (ranging from 2 to 4). The low alpha coefficients are similar to the internal consistency (α = .62) for the eight-item scale Springer and Mouzon (2011, 2019) devised in their study of old men’s preventive health care and preference for hobbies.
Participants rate their agreement with statements indicating beliefs about the appropriateness of various behaviors for aging men using a 7-point Likert-type scale (1 = strongly disagree, 7 = strongly agree). This measure has been shown to have a common factors structure, in which the items load only on their respective factor, and configural and metric invariance between men and women. As well, structural regression analyses showed there is convergent construct evidence for the validity of the AMMII (Levant, Webester et al., 2020), where, for both men and women, four of the AMMII latent factors (RMN, RPA, RAW, and MS&V) were positively related (βs range = .19–.68, p < .01–.001) with a measure of traditional masculinity ideology, the MRNI-SF (Levant et al., 2013). The FFNP factor was inversely related to TMI for both men (β = .28, p < .001) and women (β = .33, p < .001), suggesting that aging men are expected to be more family-centered.
Data Analytic Procedures
Overview
Based on prior research literature, the preferred common factors model for the AMMII (Levant et al., 2020) was used as the basis for specifying multigroup models testing measurement invariance across three age groups: YA, EA, and OA. Testing for configural, metric, and scalar invariance was performed using the new Mplus Invariance Shortcut Code (Muthén & Muthén, 1998–2015), which allows the researcher to simply specify the model as configural, metric, or scalar and, therefore, to avoid the writing of extensive syntax.
Statistical analyses
Because the chi-square goodness-of-fit test is sensitive to minor sources of model misfit in samples as large as the current study (Cheung & Rensvold, 2002), we assessed overall fit of the single and multigroup CFA models with alternative indices (Kahn, 2006). Based on recommendations from Kline (2016), we assessed model fit with the comparative fit index (CFI), the Tucker–Lewis index (TLI), the root mean square area of approximation (RMSEA), and the standardized root mean square residual (SRMR). For the CFI and TLI, values ≥.90 represent reasonable fit, and values ≥.95 indicate good fit. For the RMSEA, values of .05 to .08 represent reasonable fit, and values of .05 or lower are considered good fit. Similarly, for the SRMR, values less than .10 are considered acceptable, and values of .05 or lower indicate good model fit.
Again, the typical method for comparing relative fits of multigroup models—the scaled chi-square difference test (Satorra & Bentler, 1999)—is sensitive to sample size and will be statistically significant in samples larger than 300 (Cheung & Lau, 2012; Cheung & Rensvold, 2002; Kline, 2016). Thus, we also assessed relative fit with the ΔCFI (Chen, 2007; Cheung & Lau, 2012; Cheung & Rensvold, 2002), where values less than .01 indicate that a more parsimonious equality-constrained model did not degrade fit. That is, if imposing equality constraints on parameters (e.g., factor loadings or intercepts) does not worsen the model, then the more constrained model is preferred because it is more parsimonious. One example of a more parsimonious model would be if a single set of factor loadings works across groups (rather than different loadings for each group).
Results
Preliminary Analyses
A low level of missing data was observed (0.07%–0.4% missing responses per item). In addition, there were no other major complicating concerns, including unreasonably short survey completion times or patterned responses that would indicate participants were not actively attending to the items (McKibben & Silva, 2016). Thus, we proceeded to analyze the data as recommended by Parent (2011), following the simplest path: No missing values were imputed; rather, all available responses for each item were used in the analysis. In the structural equation modeling (SEM) analyses, we used the recommended practice of full-information maximum likelihood estimation (Schlomer et al., 2010).
Twelve AMMII items evidenced univariate outliers (i.e., z scores > 3.29) ranging from .002% of the sample to .012% of the sample. There were no multivariate outliers, as evidenced by leverage values (all values < .20), and thus, we did not delete or modify outlier cases. The data were mildly to moderately nonnormally distributed, with values of skew ranging from 0.04 to 2.60. To accommodate any nonnormality, we used the maximum likelihood estimation with robust standard errors (MLRs) on the recommendation of Satorra and Bentler (1999) for all analyses and reported adjusted chi-square statistics and corrected chi-square difference tests.
Assessment of Measurement Invariance of the AMMII by Age Group
Our objective was to use multigroup CFA of AMMII responses to assess invariance across the three age groups. All models used the common factors model as the fundamental structure. We compared a series of nested model where YA, EA, and OA were treated as separate subsamples in simultaneous estimations (see Table 2 for fit statistics). Although, as expected in a large sample, the chi-square was statistically significant for all models, yet CFI, TLI, RMSEA, and SRMR met the criteria for either reasonable or good fit as defined above.
Model Fit Statistics and Comparisons of Nested Multiple Age Group Models of the AMMII.
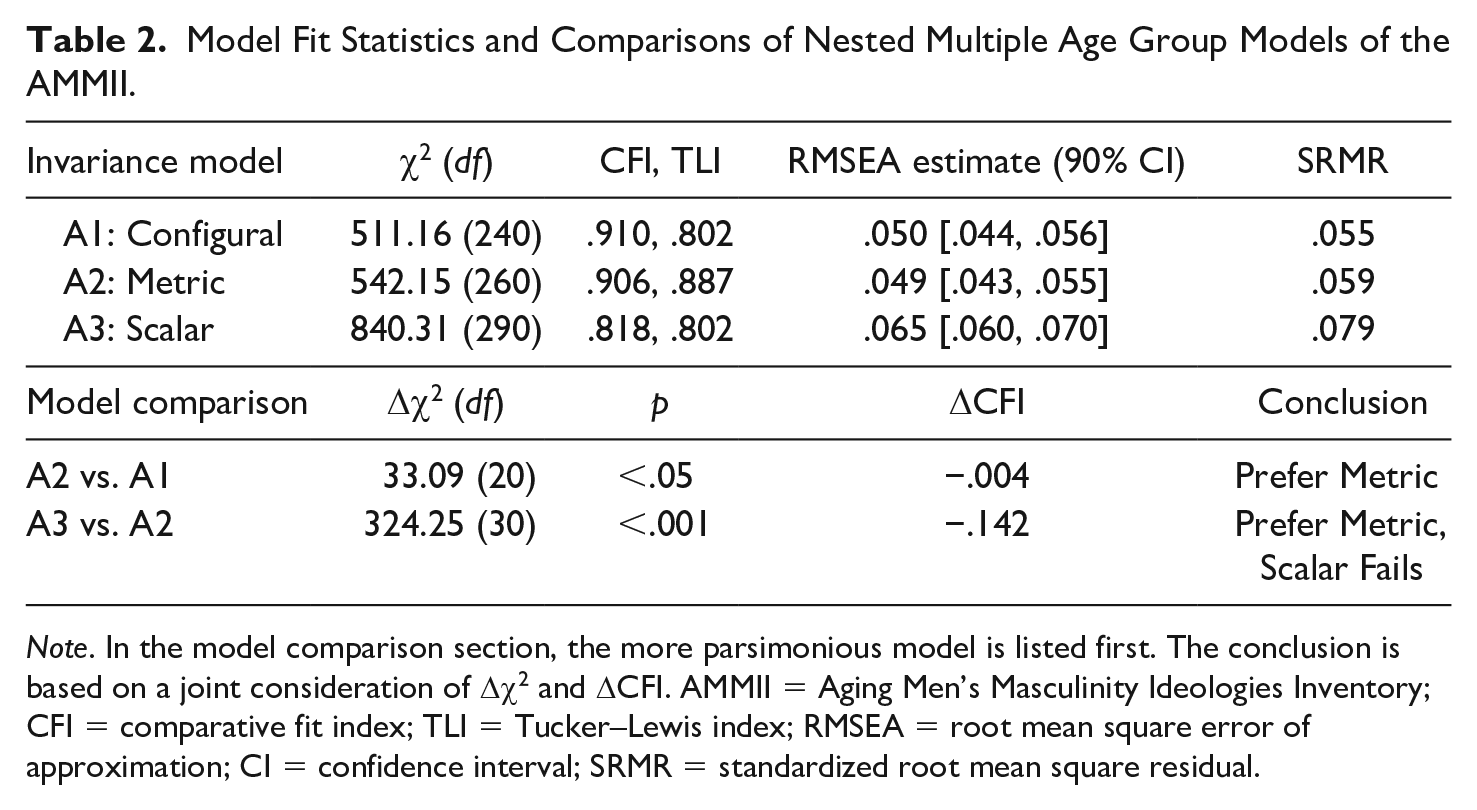
Note. In the model comparison section, the more parsimonious model is listed first. The conclusion is based on a joint consideration of Δχ2 and ΔCFI. AMMII = Aging Men’s Masculinity Ideologies Inventory; CFI = comparative fit index; TLI = Tucker–Lewis index; RMSEA = root mean square error of approximation; CI = confidence interval; SRMR = standardized root mean square residual.
To test for configural invariance, Model A1 imposed no equality constraints across age groups on any model parameters, but simply specified that the items load on the same factors across groups. Although the chi-square was significant as expected, this least parsimonious model showed a reasonable fit to the data according to the other fit indices, with the exception of TLI: χ2(240) = 511.16; p < .001; CFI = .910; TLI = .802; RMSEA = .050 (90% confidence interval [CI] = [.044, .056]); SRMR = .055. All standardized factor loadings for YA, EA, and OA were significant and ranged from .27 to .78 for YA, .34 to .89 for EA, and .38 to .92 for OA. We conclude that configural invariance was demonstrated in this data set, which suggests all age groups had similar factor structures for the five latent factors. Given that configural invariance was demonstrated, we next turned to a test of metric invariance.
To test for metric invariance, or identical factor loading across all age groups, Model A2 constrained factor loadings to be equal for YA, EA and OA. Except for the statistically significant chi-square statistic, the fit of Model A2 was reasonable for the other indices, again with the exception of TLI: χ2(260) = 542.15; p < .001; CFI = .906; TLI = .887; RMSEA = .049 (90% CI = [.043, .055]); SRMR = .059. All standardized factor loadings for YA, EA and OA were significant and ranged from .38 to .89 for YA, .31 to .89 for EA, and .37 to .87 for OA. The Satorra–Bentler scaled chi-square difference test comparing the more parsimonious metric invariance Model A2 with the configural invariance Model A1 was statistically significant, Δχ2(20) = 33.09, p < .05, suggesting that the more constrained Model A2 degraded fit. In contrast, the ΔCFI was only .004 smaller, missing the criterion of .01, suggesting that the more constrained Model A2 did not degrade fit. Hence, the evidence, though somewhat equivocal, supports metric invariance.
With metric invariance established, we next estimated a model specifying scalar invariance (i.e., similar item intercepts for the latent factors, which means that the zero points of the scale are identical across the age groups) across the age groups, Model A3. This model did not fit well in an absolute sense, χ2(290) = 840.31; p < .001; CFI = .818; TLI = .802; RMSEA = .065 (90% CI = [.060, .070]); SRMR = .079. Furthermore, Model A3 significantly degraded fit when compared with Model A2: Δχ2(30) = 324.25, p < .001, and ΔCFI = .142, indicating that scalar invariance failed. To investigate the degree of partial scalar invariance in the AMMII, we followed Cheung and Lau’s (2012) recommendations to perform a series of post hoc bootstrap confidence interval tests to examine the differences on item intercepts between YA, EA, and OA. There were three comparisons. Comparing YA and EA, eight of the 15 items (53.3%) were scalar invariant. Comparing YA and OA, seven of the 15 items (46.7%) were scalar invariant. Comparing EA and OA, 10 items (66.7%) were scalar invariant. Establishing full scalar invariance is a precondition for continuing on to tests of strict factorial invariance, that is, residuals (Horn & McArdle, 1992; Vandenberg & Lance, 2000); thus, we did not test residuals invariance. In sum, the results support configural, metric, and partial scalar invariance of factor loadings and intercepts in the three age groups for the five latent factors of the AMMII.
Descriptive statistics
Given the support for common factors structure of the AMMII and partial scalar invariance across age groups, we provide raw subscale scores for these scales by age group, for purposes of comparison with future studies that use this instrument. These scores were created by taking the mean of the observed values for the relevant items. Means, standard deviations, alpha coefficients for the five scales, and an analysis of the mean differences across the three age cohorts are in Table 3. Significant differences were found on three subscales: RAW, MS&V, and RPA. Post hoc comparisons indicated that the three age groups differed significantly from each other on RAW and MS&V, and for the most part on RPA, where only EA and OA did not differ from each other. Table 4 shows the zero-order correlations of study variables for YA, EA, and OA.
Subscale Raw Scores Means, Standard Deviations, Coefficient Alphas, and Mean Differences (N = 1,352).
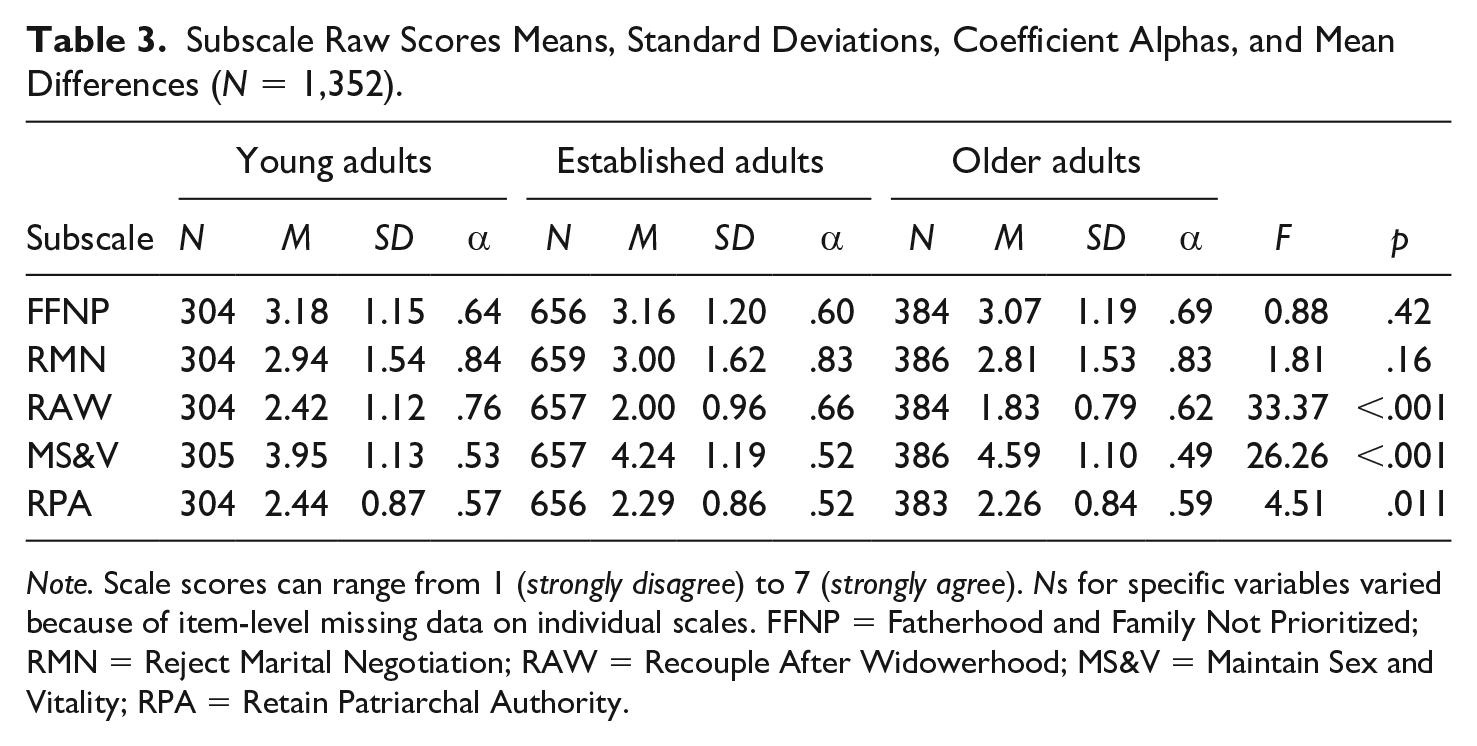
Note. Scale scores can range from 1 (strongly disagree) to 7 (strongly agree). Ns for specific variables varied because of item-level missing data on individual scales. FFNP = Fatherhood and Family Not Prioritized; RMN = Reject Marital Negotiation; RAW = Recouple After Widowerhood; MS&V = Maintain Sex and Vitality; RPA = Retain Patriarchal Authority.
AMMII Subscale and Total Scale Score Correlations by Age Group.
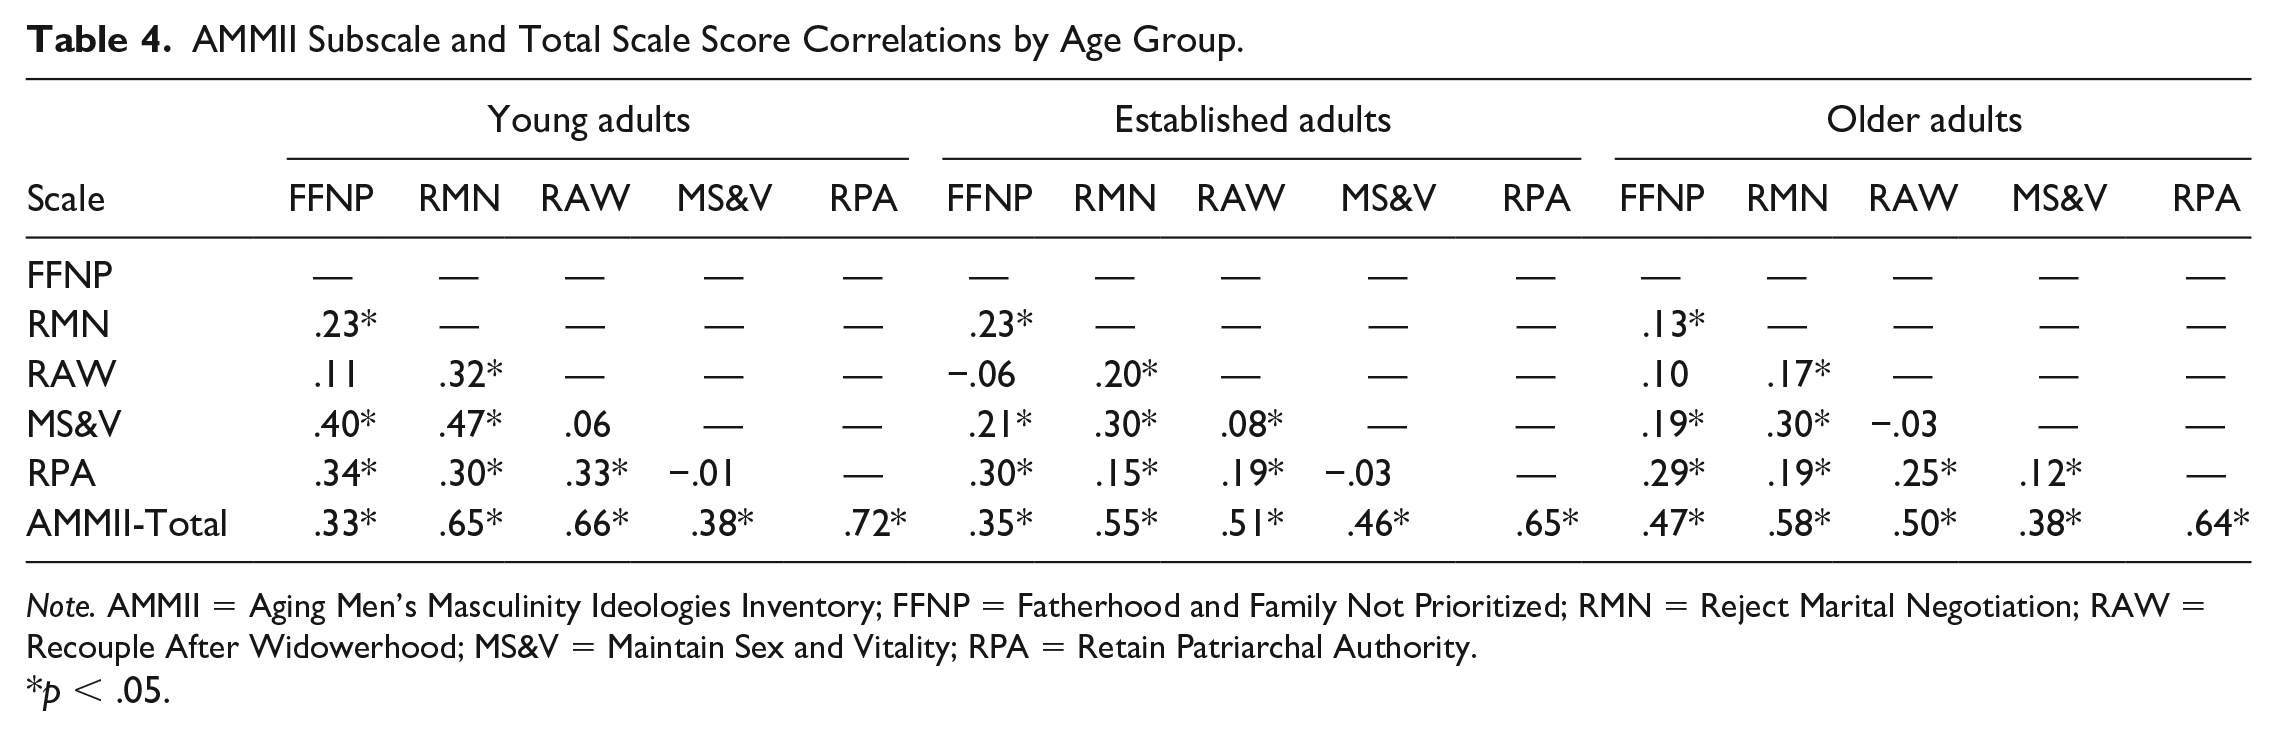
Note. AMMII = Aging Men’s Masculinity Ideologies Inventory; FFNP = Fatherhood and Family Not Prioritized; RMN = Reject Marital Negotiation; RAW = Recouple After Widowerhood; MS&V = Maintain Sex and Vitality; RPA = Retain Patriarchal Authority.
p < .05.
Discussion
The purpose of this study was to assess the measurement invariance of a newer measure of aging men’s masculinity ideologies, the AMMII, across three age groups using a large, life span sample. Configural, metric, and partial scalar invariance of factor loadings and intercepts in the three age groups were in evidence for the five-factor AMMII. These findings indicate that participants within the different age groups understood in the same way the constructs tapped by the scale—namely, some of the age-appropriate “traditional” masculinity ideologies targeting aging men. We observed that the only positively endorsed expectation (as measured by a mean score of ≥4) by EA and OA but not YA was for aging men to maintain vitality and sexuality, and this dimension was not vigorously advocated. Otherwise, three age groups disagreed to different degrees with two of the “traditional” masculinity norms charted by the AMMII, RAW, and RPA, and disagreed to the same degree with the other two, FFNP and RMN. The propensity for masculinity ideology scale means to be on the disagree side of scale midpoints has often been reported (e.g., Levant et al., 2013); as well, because only partial scalar invariance was established, we cannot have full confidence in comparing mean scores across groups.
However, prior studies have shown that such intercept differences are often inconsequential (e.g., Levant, McDermott, et al., 2020). Therefore, it is likely that expectations about maintaining vitality and sexuality are in fact more salient among established and aging adults (cf. Lindau et al., 2007), and remarrying after widowerhood is more strongly disavowed by these same two age cohorts because they are more likely to have been in longer-term marriages and do not think their spouse can be replaced (cf. Moss & Moss, 1996). Finding differences in endorsement of masculinity ideologies across age groups is not uncommon (cf. Smiler, 2006; Theodore & Lloyd, 2000) or unexpected. Exactly why the age cohort differences occur remains a matter for future research. For example, our findings regarding vitality and sexuality may be due to each cohort’s cumulative life practices and experiences (Dannefer, 2003), and/or the intergenerational age prejudices more common among younger adults that equates aging with frailty (Achenbaum, 2015; Gilleard & Higgs, 2000; Öberg, 2003) and sexual dysfunction being inevitable such that old people are imagined as postsexual (Lindau & Gavrilova, 2010). Examining the intersection of aging, generations, and masculinity ideals has been highlighted by others as an important area for future research (e.g., Calasanti & King, 2018).
This study importantly found that there are equivalences in the responses of people of three different age groups to the masculinity ideologies mapped by the AMMII, and equally significant, there are intra- and intercohort differences in willingness to endorse traditional masculine norms (Bennett, 2007; Thompson & Langendoerfer, 2016). To illustrate this, the maintaining vitality and sex dimension of “traditional” masculinity ideologies was found to have low alpha coefficients for all three age groups (ranging from .49 to .53; Table 3). This is not unforeseen given the small number of items that address this aspect of masculinities and aging. Nor is it unexpected given intergenerational differences in interpretation of corporeal aging. With regard to sexuality, for example, aging men and women might have recast sexuality to the importance of touch, emotional connectedness, and trust (Rowntree, 2014; Sandberg, 2013) and away from an emphasis on or preference for coital sex.
This is the first study we know of that has examined age similarities and differences among people’s perceptions of some of the “traditional” masculinity ideologies applicable to aging men. Future studies can investigate the intracohort differences in perceptions of aging men’s masculinity ideologies. Among people who live with the intersection of two or more valued cultures—for example, the dominant ageist culture (Calasanti, 2004) intersecting with the “third age” culture (Gilleard & Higgs, 2000)—their masculinity expectations widen (StGeorge & Fletcher, 2014) to produce an array of preferred masculinities, some of which can be more inclusive of corporeal differences (Coles, 2008).
We acknowledge some limitations of the current study. First, the self-report nature of the surveys introduces the possibility of socially desirable responding (SDR). SDR was not measured in our study; however, a recent article demonstrated that SDR is not always a problem (Tracey, 2016). Second, the convenient, cross-sectional nature of the study means we cannot determine whether these expectations for aging men differ over time, which would require longitudinal investigation. The present findings are consistent with observations that people’s understandings of gender and gender-appropriate practices are embodied early in their lives and are modified but not fundamentally modified over the course of life (Connell & Messerschmidt, 2005; Levant & Richmond, 2016; Thompson & Langendoerfer, 2016). In addition, while our sample is diverse in terms of age, it is largely White and not representative of the general U.S. population. Third, the predictive validity of the AMMII remains largely unknown (cf. Levant et al., 2020) and warrants attention. For example, do younger adults who regularly interact with OA while working out at a gym or community recreation center more favorably endorse the expectation for aging men to sustain vitality and sexuality? Do intergenerational relations not only reduce ageist expectations (Thompson & Weaver, 2016) but also erase age differences in the masculinity expectations for aging men?
In conclusion, there has been a need for measures to assess masculinity ideologies applicable to aging men and to not restrict the sample to the likely ageist perceptions of YA. This is the first study to introduce an assessment of the age invariance properties of the AMMII across a large age range. We found evidence supporting the configural, metric, and partial scalar invariance for three age groups, suggesting YA, EA, and OA share similar understandings about the masculinity ideologies guiding aging men’s lives.
Footnotes
Appendix
The Aging Men’s Masculinity Ideology Inventory: Scale and Items.
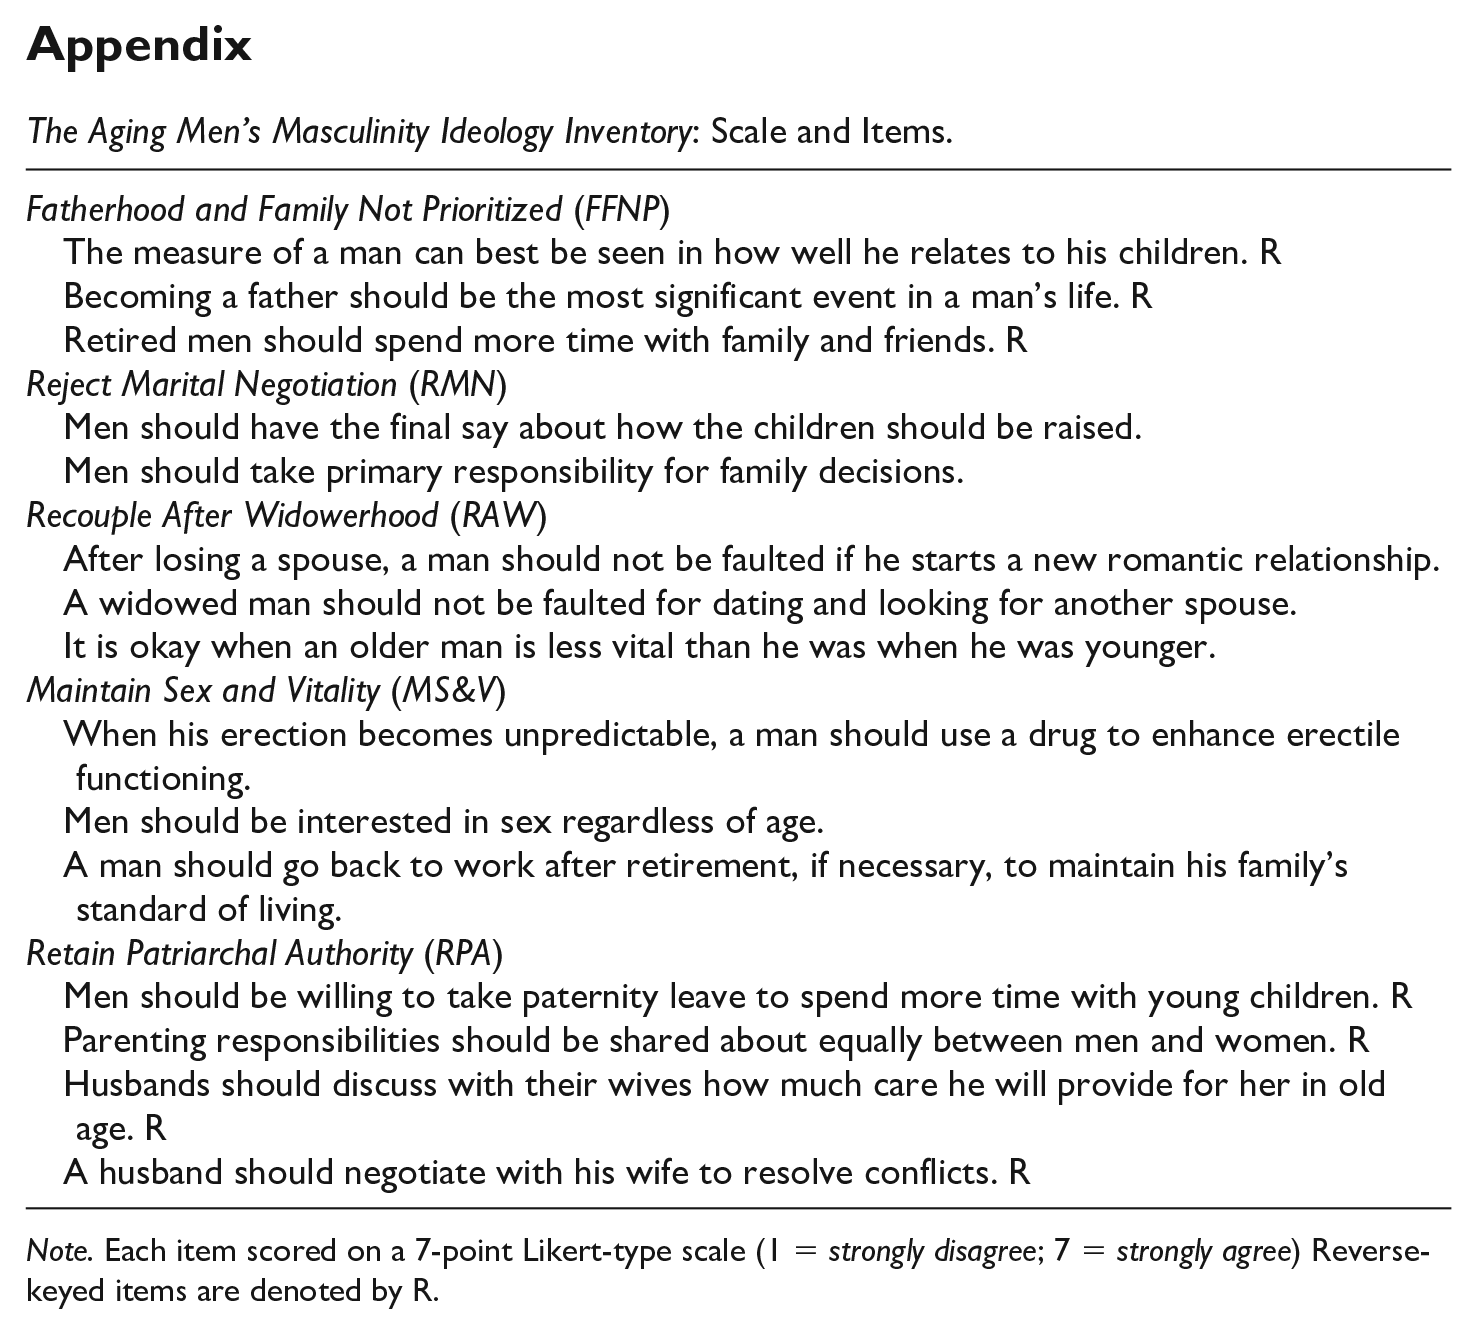
| Fatherhood and Family Not Prioritized (FFNP) The measure of a man can best be seen in how well he relates to his children. R Becoming a father should be the most significant event in a man’s life. R Retired men should spend more time with family and friends. R Reject Marital Negotiation (RMN) Men should have the final say about how the children should be raised. Men should take primary responsibility for family decisions. Recouple After Widowerhood (RAW) After losing a spouse, a man should not be faulted if he starts a new romantic relationship. A widowed man should not be faulted for dating and looking for another spouse. It is okay when an older man is less vital than he was when he was younger. Maintain Sex and Vitality (MS&V) When his erection becomes unpredictable, a man should use a drug to enhance erectile functioning. Men should be interested in sex regardless of age. A man should go back to work after retirement, if necessary, to maintain his family’s standard of living. Retain Patriarchal Authority (RPA) Men should be willing to take paternity leave to spend more time with young children. R Parenting responsibilities should be shared about equally between men and women. R Husbands should discuss with their wives how much care he will provide for her in old age. R A husband should negotiate with his wife to resolve conflicts. R |
Note. Each item scored on a 7-point Likert-type scale (1 = strongly disagree; 7 = strongly agree) Reverse-keyed items are denoted by R.
Acknowledgements
The authors gratefully acknowledge the assistance of Eric McCurdy, Kathleen Alto, Zach Gerdes, Stefan Jadaszewski, Baron Rogers, and Shana Pryor, doctoral students in counseling psychology at The University of Akron, in recruiting, and of Ryon McDermott and Daniel McKelvey of the University of South Alabama on trouble shooting MPlus syntax. They appreciate the assistance of Dr. Mark Levine and the students in his Funny Bone class for participation in this research.
Declaration of Conflicting Interests
The author(s) declared no potential conflicts of interest with respect to the research, authorship, and/or publication of this article.
Funding
The author(s) received no financial support for the research, authorship, and/or publication of this article.