
Abstract
Registered nurses (RNs) play a critical role in health care delivery. With an aging US population, health care demand is growing at an unprecedented pace. Using projected changes in population size and age, the authors developed demand and supply models to forecast the RN job shortage in each of the 50 states. Letter grades were assigned based on projected RN job shortage ratios. The number of states receiving a grade of “D” or “F” for their RN shortage ratio will increase from 5 in 2009 to 30 by 2030, for a total national deficit of 918 232 (725 619 - 1 112 112) RN jobs. There will be significant RN workforce shortages throughout the country in 2030; the western region will have the largest shortage ratio of 389 RN jobs per 100 000. Increased efforts to understand shortage dynamics are warranted.
Registered nurses (RNs) play an integral role in health care delivery.1-3 Increases in RN staffing proportions confer both personal benefit to patients and fiscal advantage to hospitals.4,5 Since 1998, the United States has experienced a growing RN deficit,6-8 primarily because of the growing elderly population7,9,10 and aging nurses. 11 As a result, RN demand continues to outstrip RN supply, creating an unprecedented shortage of RNs in the United States.
Concern about RN shortages has led a number of researchers and government organizations to attempt to predict future RN supply and demand.6,8,12,13 The models used incorporate workforce dynamics to forecast future nursing supply and demand and project that there will be a national shortage of 300 000 to 1 million RN jobs in 2020. Unlike other projection models, the current study focuses specifically on the impact that population and age will have on the nursing workforce in relation to current staffing ratios. Furthermore, this article uses a published grading methodology to facilitate comparison between current and future regional RN staffing levels. The results of the current study provide points of discussion for the RN profession, policy makers, and stakeholders when evaluating current and future RN needs to mitigate predicted shortages.
Methods
Design and Sample
This article forecasts state RN job shortages by examining the difference between RN demand and RN supply in all 50 states (Table 1; definitions). Pursuant to this, forecast models were created for both demand and supply of RN jobs. A grading methodology developed in previous studies14-16 was used to compare state shortage ratios between 2009 and 2030. States were further aggregated into larger regions to examine the national trends that contribute to statewide shortages.
Explanation of Key Terms
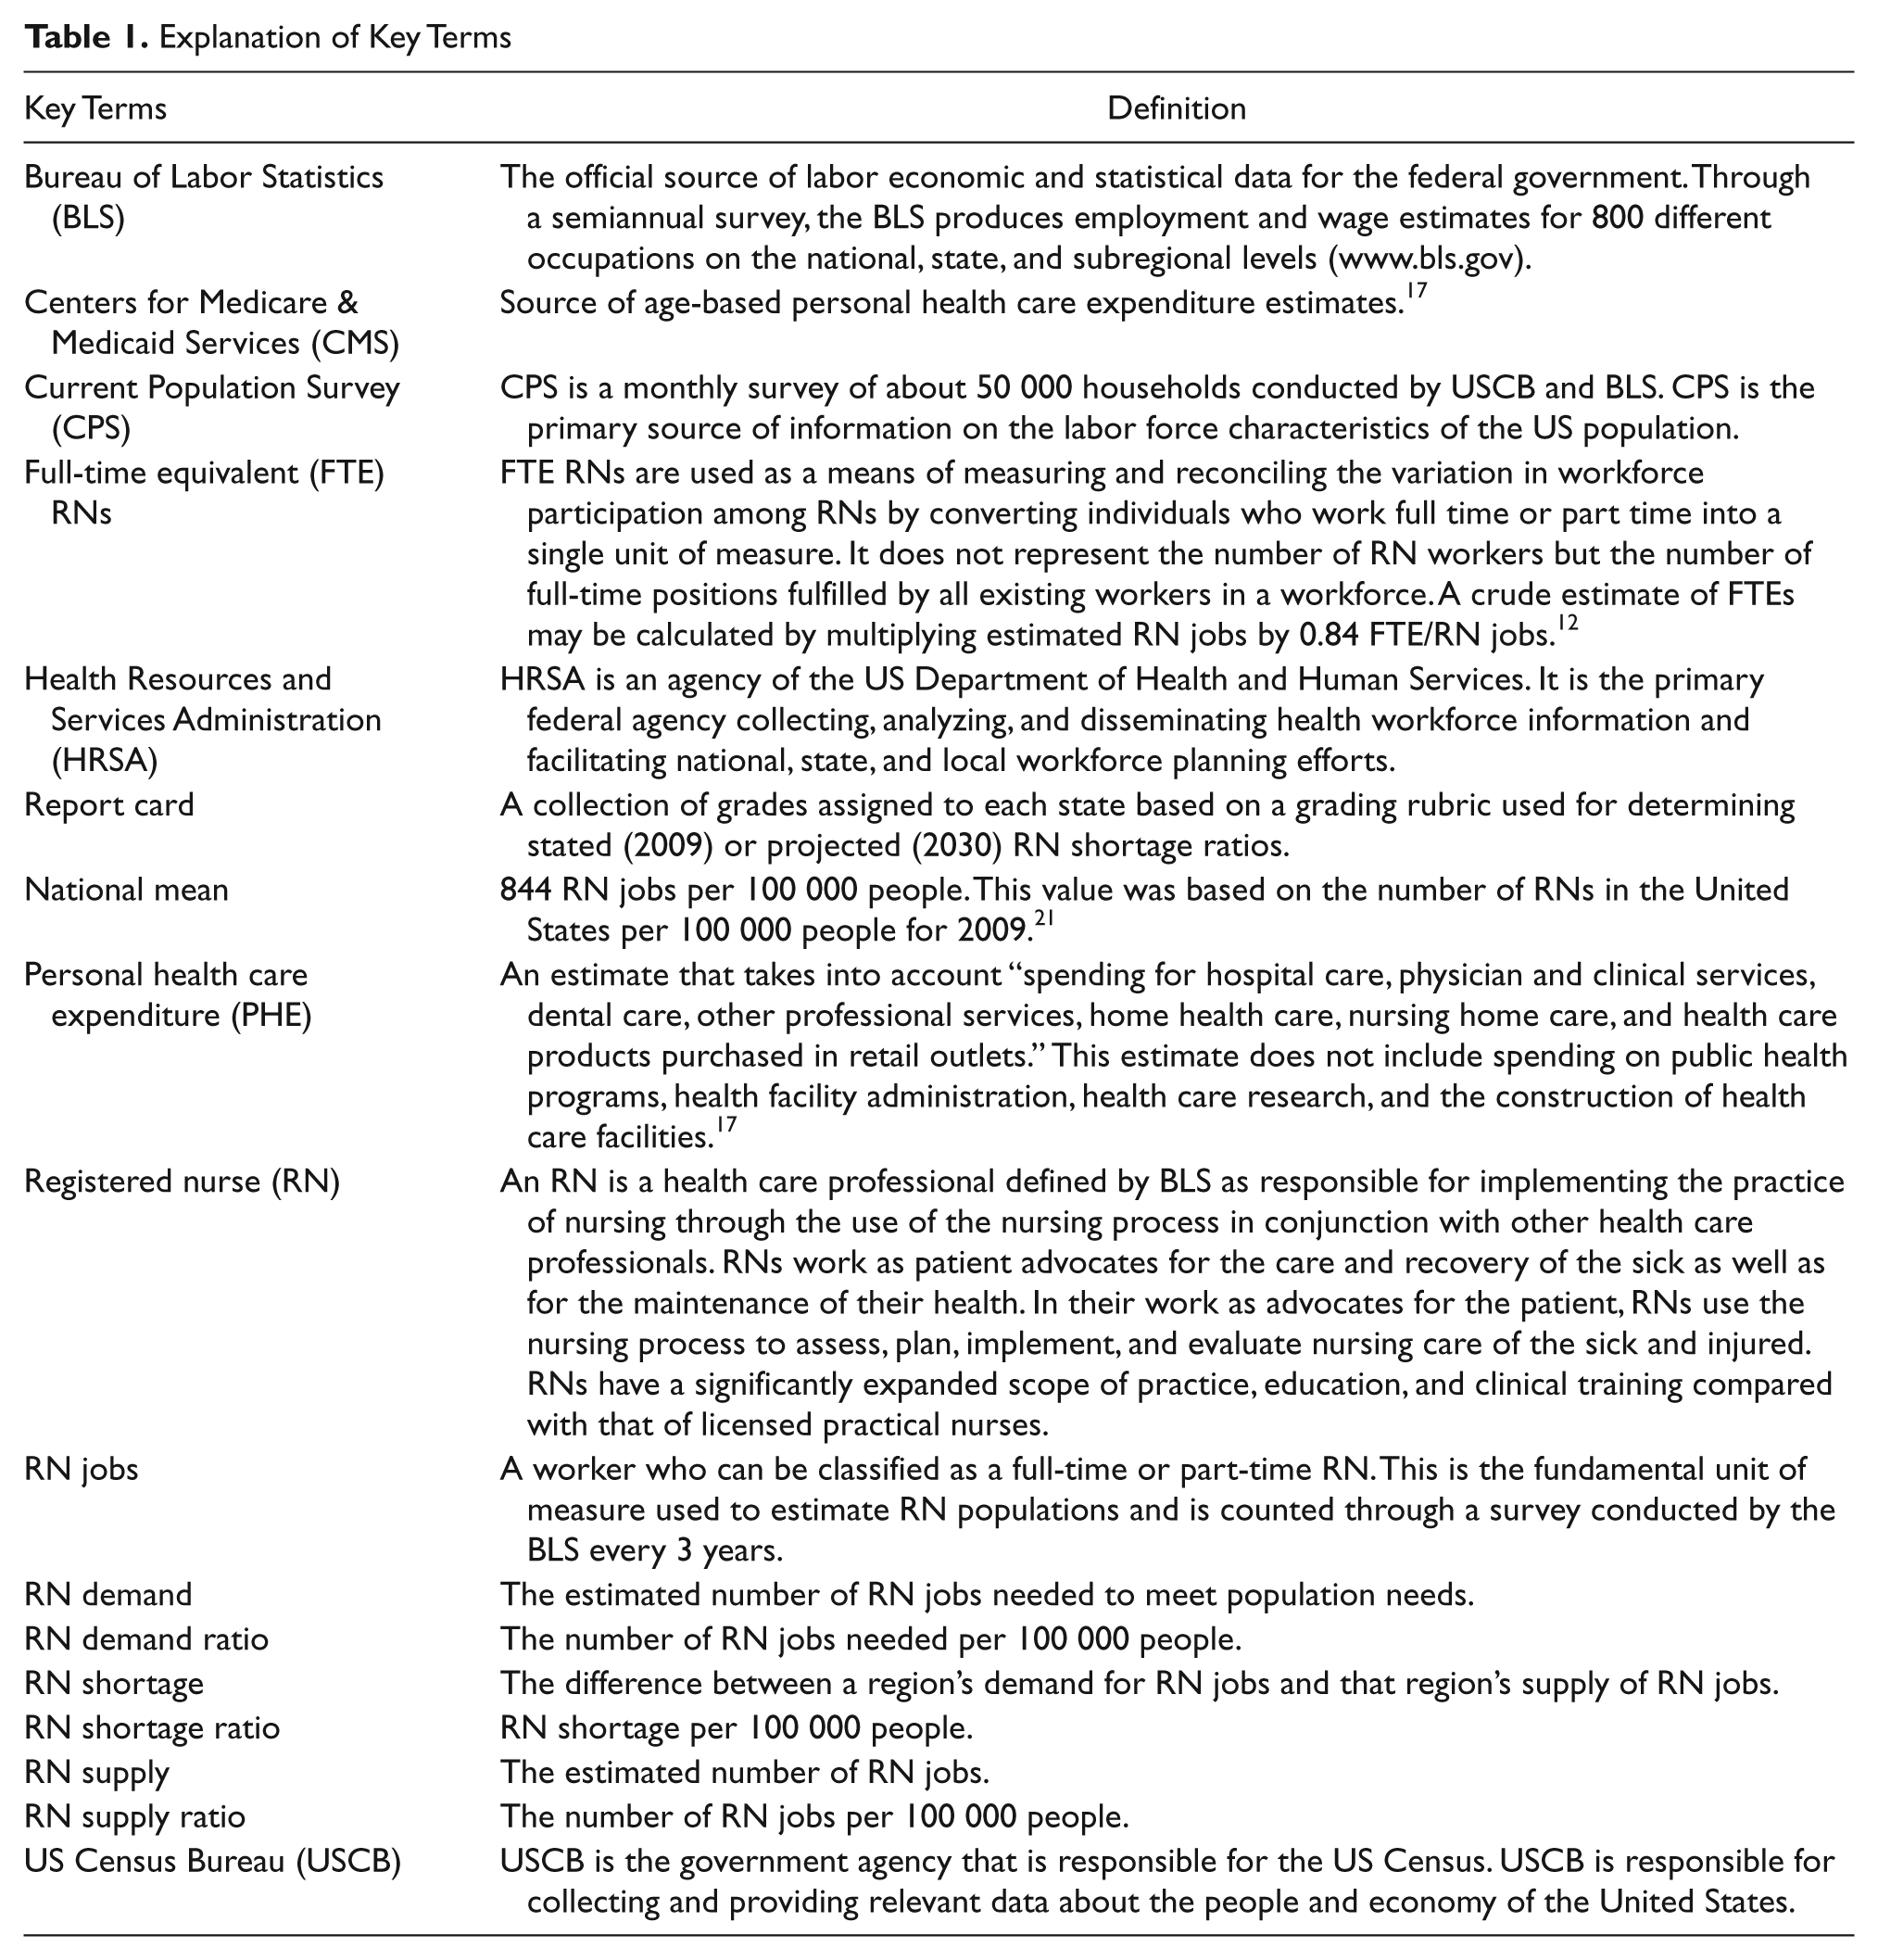
Demand Model
Each state’s demand for RN jobs was based on a methodology similar to that employed in the California Regional Registered Nurse Workforce Forecast. 15 We determined the projected personal heath expenditure (PHE) for each of the 50 states using the Centers for Medicare and Medicaid Services (CMS) published age-based PHE estimates 17 and the US Census Bureau’s (USCB) projected estimates of state age and population sizes. 18 Using a univariate linear regression analysis, the national, historic Bureau of Labor Statistics (BLS)-reported RN jobs was regressed on national PHE values (STATA 8.2; Stata Corp, College Station, TX) for all available years (ie, 2000, 2004-2009), generating a correlation coefficient of 2.69 × 10⁻⁶ with a standard error (SE) of 1.62 × 10⁻⁷ (R2 = 0.982, 95% confidence interval [CI] = 2.28 × 10⁻⁶, 3.11 × 10⁻⁶; P < .001). This coefficient was used to convert change in PHE to change in RN jobs for the nation and each state. The national RN estimates were used to convert PHE changes in the 50 states, rather than each state’s own correlation, to eliminate additional variables such as state economic responsiveness to increased health spending. The baseline for this model was the number of RN jobs necessary to maintain the current national RN ratio of 844 in 2009 (see Measures section for details). Projected increases in the number of RN jobs needed were added to this initial 2009 number in subsequent years to forecast future demand for RN jobs. The model’s equations are given below:
where DR,N: D = Demand, R = Region or State, N = Year; ΔPHEN−1,N = PHEN − PHEN−1; 844 is the 2009 national mean of RN jobs; 2.69 × 10⁻⁶ is the PHE correlation coefficient.
Supply Model
The supply model was developed under the assumption that current RN utilization, the education of new RNs, and, most important, the propensity for individuals to choose a career in nursing would remain constant. The propensity of a US individual to work as a nurse was calculated using the RN age population estimates produced by the Current Population Survey (CPS). 19 Population estimates for years 2000 to 2009 were obtained from the CPS in the following 7 age categories: 16 to 19 years, 20 to 24 years, 25 to 34 years, 35 to 44 years, 45 to 54 years, 55 to 64 years, and 65 years and older. These estimates were divided by USCB population estimates in the same 7 age categories for 2000 to 2009, yielding propensities for an individual in the United States to choose to work as an RN at a given age. 20 A 10-year average was calculated for each age category and multiplied by state yearly population changes in each age category. 18 Totaling this product in the 7 age categories yielded each state’s projected changes through 2030. These changes were added to BLS-reported 2009 RN job numbers. 21 The formulas below contain supply model details:

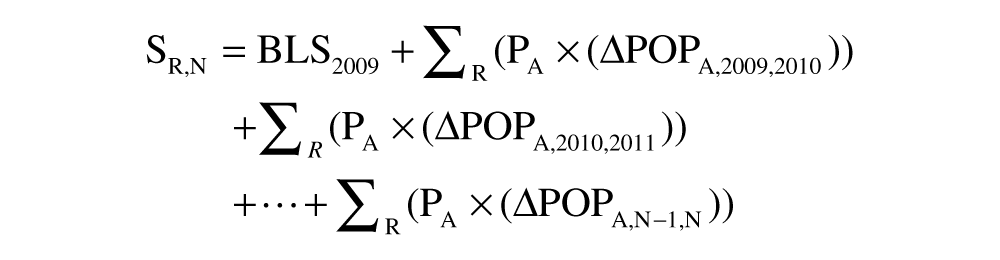
where SR,N: S = Supply, R = Region or State, N = Year; PA: P = Propensity averaged over 10 years, A = Age group; ΔPOPA,N−1,N = Age-category specific Populationn − PopulationN−1; BLS2009 = the number of RN jobs reported by the BLS in 2009.
Measures
The metric used for grading in this article is the RN shortage ratio, which is defined as the difference between demand and supply of RN jobs per 100 000 people as demonstrated below:
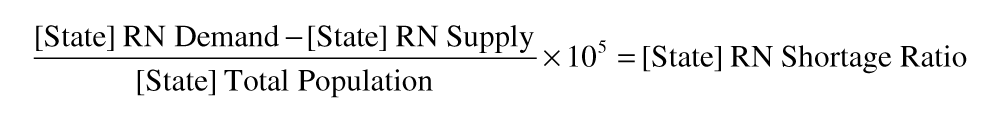
The number of RN jobs was retrieved from the BLS. 21 State populations were obtained from the Interim State Population Projections of the USCB. 18 The 2009 report card was based on the national mean (844 RNs per 100 000) and the standard deviation (SD) among the state RN ratios (163 RNs per 100 000). The 2009 national mean was used as a representative of the status quo for state performance in subsequent years. Note that this value differs from the national mean reported by the National Sample Survey of Registered Nurses, 11 because of the use of a different USCB population estimate. USCB projection estimates 18 were used to facilitate comparison with 2030 workforce projections rather than their annual population estimates. 20 Letter grades in 2009 were assigned based on the difference between the national mean and each state’s ratio, using the SD as the framework of the grading rubric. A and F grades were ±2 SD, B and D grades were ±1 SD, and C+ and C− grades were ±0.5 SD.
Analytic Strategy
Shortages for each state were determined as the difference between the projected RN demand and the projected RN job supply. This value was then converted to an RN shortage ratio by dividing the state RN job shortage by the state’s projected population as forecasted by the USCB. 18 Using the 2009 shortage grading rubric described, grades were assigned to shortage ratios for 50 states in 2030. Using the proportion of full-time equivalent (FTE) employees to RNs providing nursing services estimated in the Health Resources and Services Administration’s (HRSA) RN projection model, 12 which averages 0.84, a crude estimate of RN FTEs may be calculated for each state.
Upper and lower estimates for demand and supply were estimated using the SE of the demand regression slope as well as the SE of the 10-year supply mean propensity values. Shortage ranges were generated by calculating the difference between lower demand estimates and upper supply estimates (shortage range lower limit) and the difference between upper demand estimates and lower supply estimates (shortage range upper limit) of the 95% CI of both demand and supply models.
Performances of US regions also were analyzed. States were organized into 4 geographic regions defined by the BLS: the Midwest, the Northeast, the South, and the West (Table 2). 22 Totaling the projected demand and supply values of each region and dividing by their states’ forecasted populations yielded shortage ratios for each region, to which grades were then assigned.
States Organized by BLS-Defined Region 22 and the Change in RN-Related Factors for 2009-2030
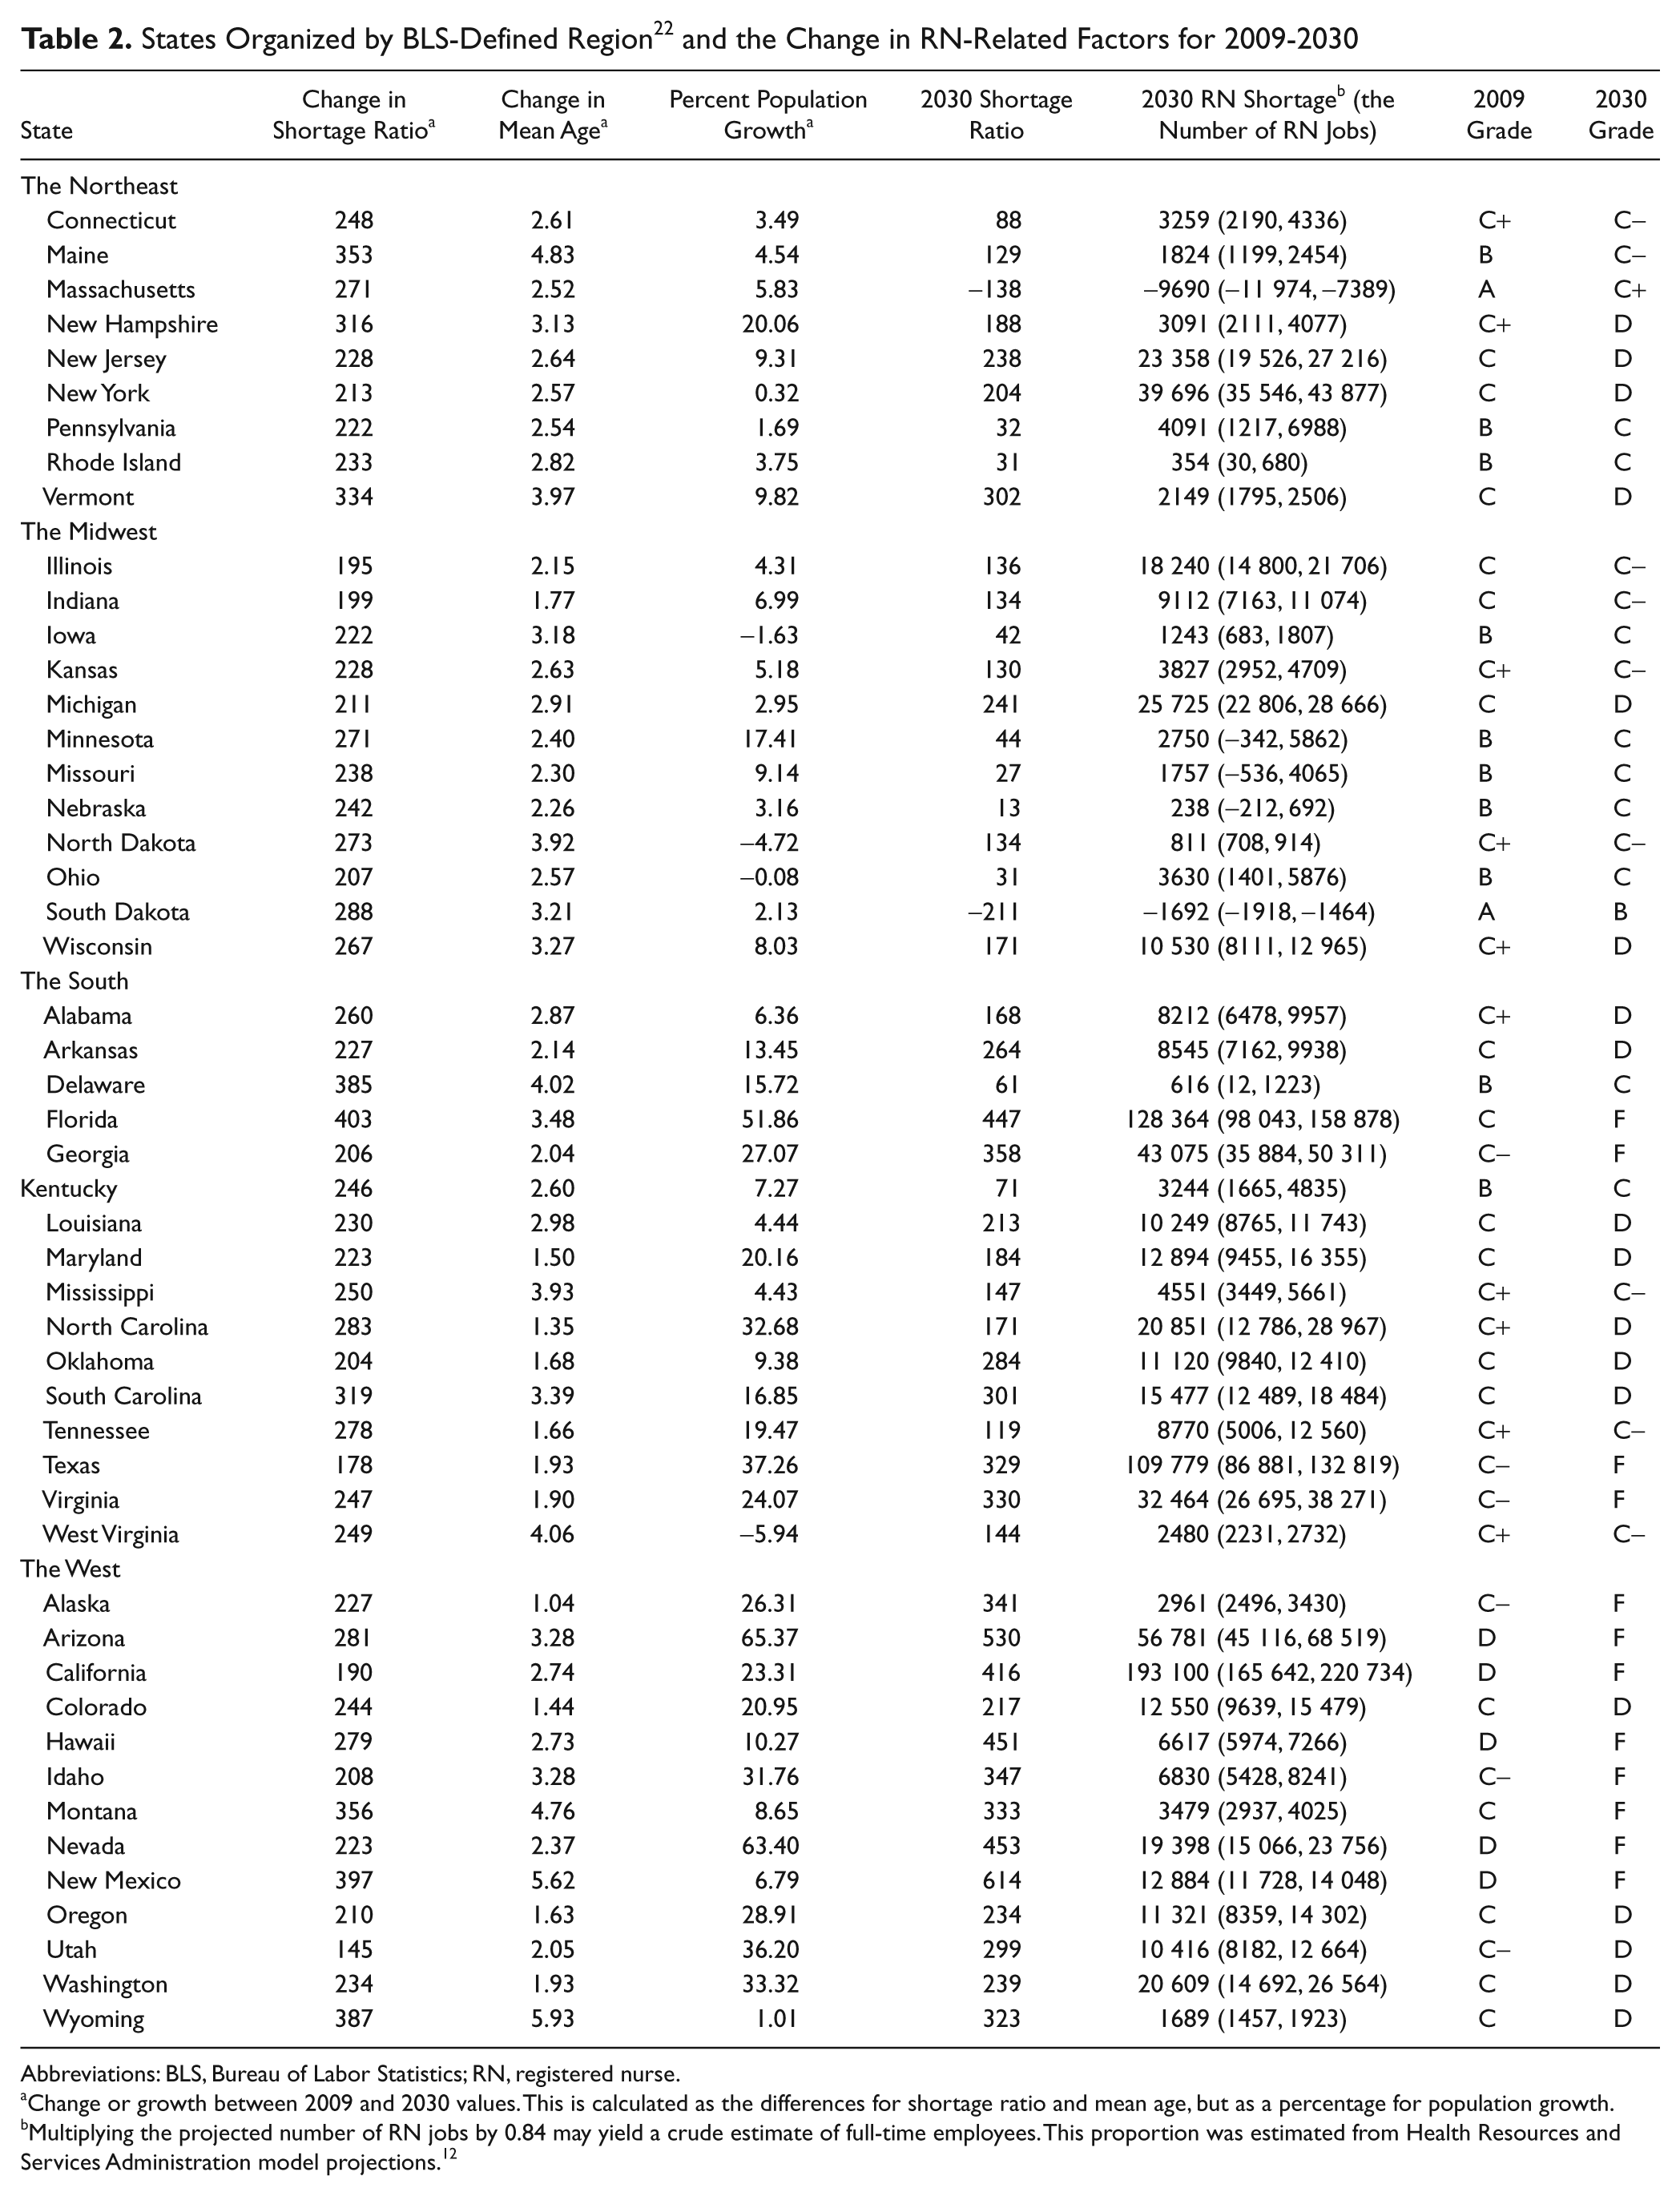
Abbreviations: BLS, Bureau of Labor Statistics; RN, registered nurse.
Change or growth between 2009 and 2030 values. This is calculated as the differences for shortage ratio and mean age, but as a percentage for population growth.
Multiplying the projected number of RN jobs by 0.84 may yield a crude estimate of full-time employees. This proportion was estimated from Health Resources and Services Administration model projections. 12
Results
According to our forecasts, RN shortages will grow across the country between 2009 and 2030 (Table 2). In 2030, states with the largest shortages (ie, the largest number of RN jobs) will be California (193 100 jobs), Florida (128 364 jobs), and Texas (109 779 jobs); states with the largest shortage ratios (RN shortage per 100 000 people) will be New Mexico (614), Arizona (530), and Nevada (453). Each state shows an increase in RN shortage ratio, ranging from 145 to 403. States with the largest increase in shortage ratios are Florida (403), New Mexico (397), and Wyoming (387). With regard to grades, in 2009 there were 2 As, 10 Bs, 10 C+s, 17 Cs, 6 C−s, 5 Ds, and zero Fs. In 2030, there will be zero As, 1 B, 1 C+, 9 Cs, 9 C−s, 18 Ds, and 12 Fs. Using a numeric grading scale with A = 4, B = 3, C+ = 2.33, C = 2, C− = 1.67, D = 1, and F = 0, the average national grade is 2.21 in 2009 and 1.13 in 2030.
Among the 4 BLS-defined regions, those with the largest shortage in 2030 will be the South (420 691 jobs) and the West (358 637 jobs). The Midwest and Northeast will have lower shortages of 76 170 and 68 133 jobs, respectively. In terms of RN shortage ratios in 2030, the West is forecasted to have the greatest shortage (389 RN jobs per 100 000), followed by the South with 295 RN jobs per 100 000; the Midwest and the Northeast will have shortage ratios of 108 and 118 RNs per 100 000, respectively. All regions’ letter grades fall by 2030; the Northeast and the Midwest decline from grade C+ (2009) to grade C− (2030), the South declines from C in 2009 to D in 2030, and the West declines from D to F. The South is expected to have the largest change in shortage ratio between 2009 and 2030, increasing by 271. The Northeast has the next highest shortage ratio increase of 235, followed by the Midwest and the West with shortage ratios for both increasing by 221 RN jobs per 100 000.
Discussion
The forecasts in this study suggest that shortages of RNs will worsen in the next 2 decades. Among all 50 states, only 2 (Massachusetts and South Dakota) show an RN surplus in 2030, whereas 12 states, all in the South and the West, receive an F grade. The states with the most alarming condition are those with the largest changes in shortage ratio between 2009 and 2030 (Table 2). Florida will have the greatest increase in RN shortage ratio, rising 403 RN jobs per 100 000 by 2030. This change likely is because of its high demand ratio growth at 36.3%, representing the fastest growing demand of any state. Coupled with a supply that decreases 12.1% by 2030, Florida has the fifth highest shortage ratio of 447, and its shortage grade drops from C to F in 2030.
Many factors affect demand ratio. Among them, mean age is the most significant. Unlike population growth, which somewhat negates its impact by increasing both demand and supply populations, a rise in mean age serves to increase demand and decrease supply, causing shortage to grow. Thus, it is not surprising that states with larger changes in mean age show greater RN shortages. Exemplary of this pattern are New Mexico and Wyoming, states with the second and third highest demand ratio increases, which have the top 2 increases in mean age at 5.62 and 5.93 years between 2009 and 2030 (BLS reports an “85+” category that we assume to be equal to 85 for mean age calculation). 18
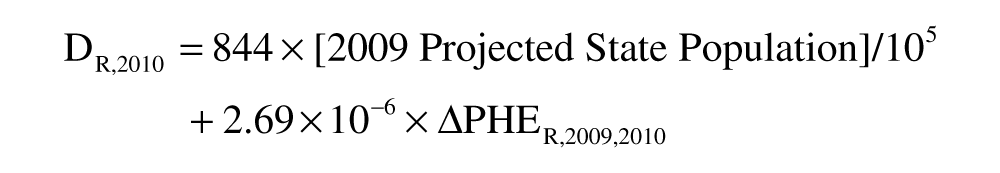
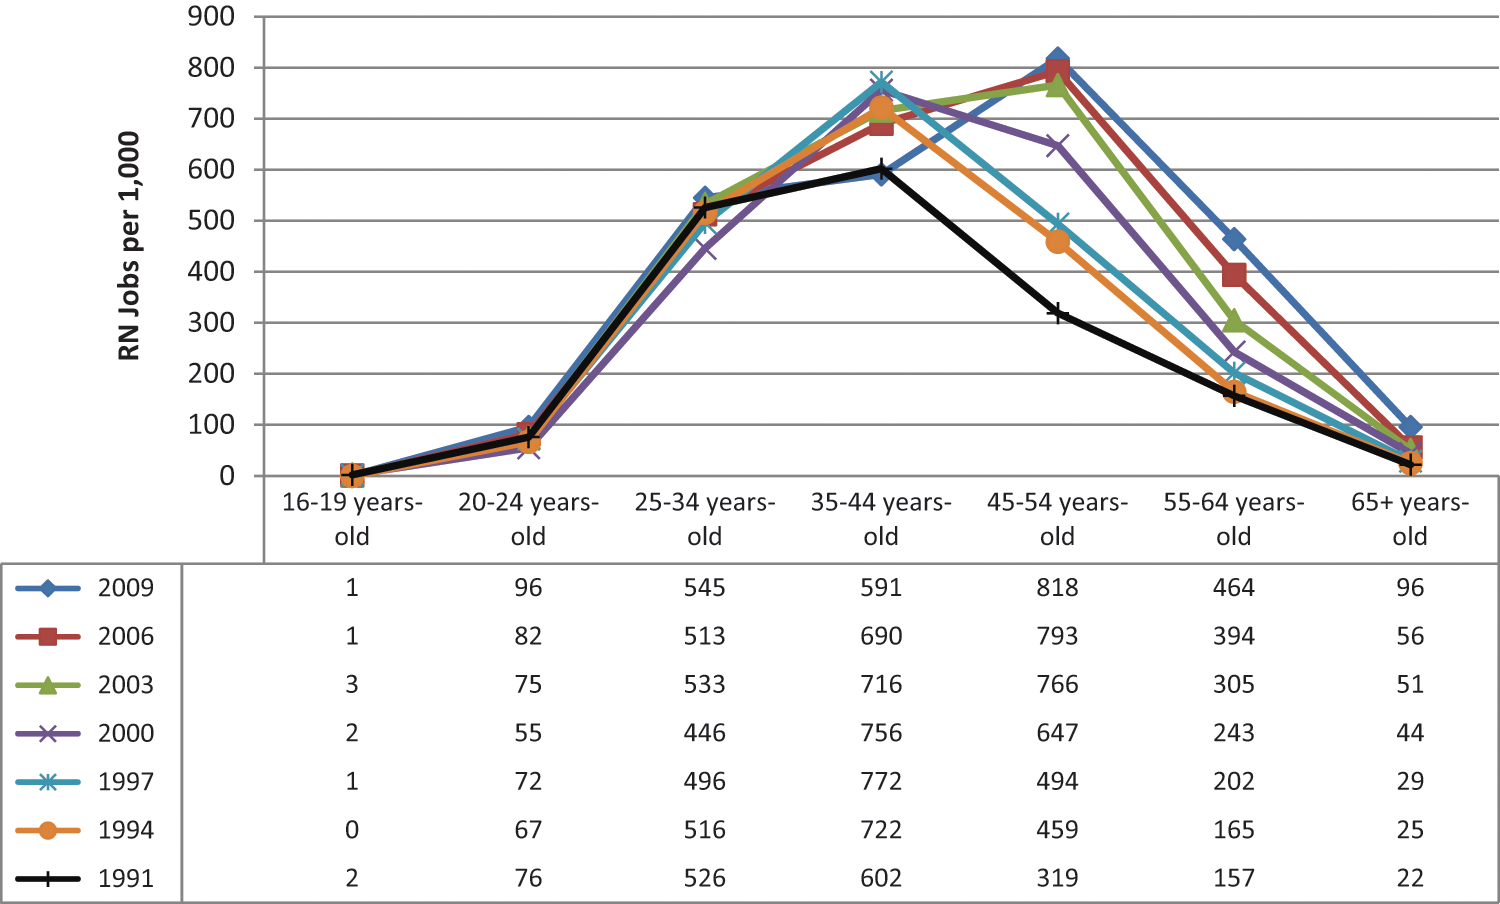
Age is the most significant factor in the shortage model presented in this article, not merely because of the magnitude by which a region’s average age shifts but more specifically related to the growth in the number of individuals age 65 and older. With regard to the demand model, CMS estimates steadily increase with age because health care expenditure become greater as people age. 17 Conversely, with the supply model, propensity for nursing is greatest between ages 45 and 54, decreasing to its second lowest value in the group who are age 65 and older (Figure 1). If populations in the age 65 and older category were to dramatically increase, one would expect rapid shortage growth compelled jointly by increasing demand and decreasing supply, which unfortunately is the prognosis augured by US demographic forecasts concerning baby boomers.
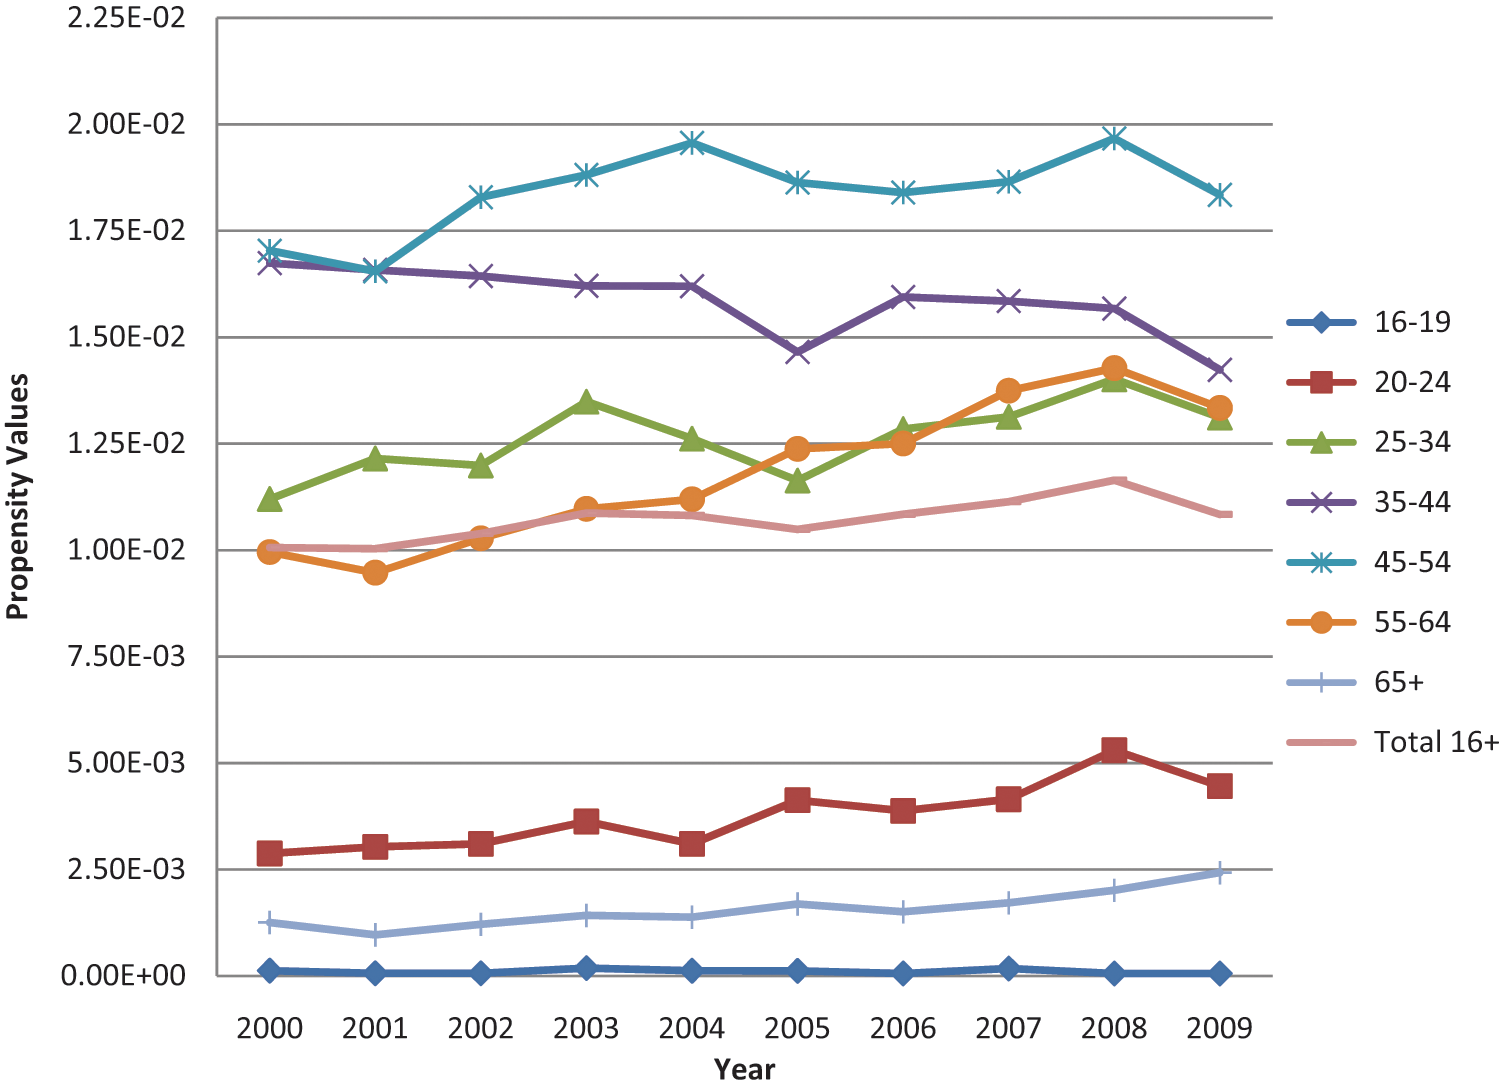
Nursing propensity values from 2000 to 2009 stratified by age
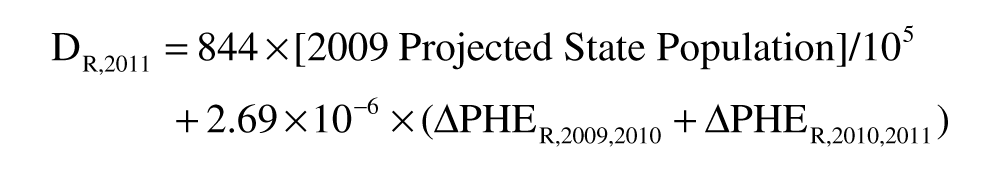
Aging of the RN workforce is another factor contributing to future state shortages. According to the CPS, conducted by the USCB and the BLS, in 2003 those aged 45 to 54 years replaced those aged 35 to 44 years as the largest age group of RNs in the United States (Figure 2). 19 This trend is reflected by the median RN age, reported to be 42.4 in 2000 and 45.4 in 2009. 19 Some researchers project that the average age of RNs will continue to rise, not peaking until 2016. 6 With about 50% of RNs within 20 years of retirement, 19 RN populations will require larger inflows to maintain historic linear increases in size. This change in RN demographics also is seen by variations in propensity values over the past 10 years. Between 1997 and 2009, the propensity for individuals aged 45 to 54 and 55 to 64 to hold an RN job has risen steadily (Figure 1). As baby boomers continue to work during their later years, it is possible that propensity values in the age 45 to 54, 55 to 64, and even the age 65 and older categories will continue to rise. However, the age 65 and older category has been fairly constant over the past 10 years, implying that there will be a high workforce attrition rate as the largest cohort of RNs advance beyond age 64.
The number of RNs (thousands) within different age categories for selected years
The recent economic recession as well as the health care reform law also will have an impact on the RN workforce.23,24 As the US economy recovers, economic pressure from the recent recession may force health care institutions to reduce their RN workforce,25,26 decreasing the number of jobs available to RN graduates 27 and discouraging prospective nursing students in coming years. 28 Meanwhile, by expanding coverage to 31 million uninsured Americans, 29 health care reform legislation will increase demand for health services and for RN jobs. 30 However, these laws also may limit compensation to health care providers and reduce RN salaries,31,32 which may affect the number of students interested in nursing as a career. Regardless of these recent changes in industry dynamics, a shortage of RNs will persist long term.33-35 With the retirement of aging baby boomers, who comprise 40% of the current health care workforce, there will be a dramatic reduction in RN supply. 36
There are several limitations and assumptions inherent in our models that warrant discussion. In the demand model, one significant assumption is the use of the 2009 national mean as our starting point. This effectively causes the nation to report no shortage in 2009, when most studies consider the nation to already experience a large shortage. Furthermore, in converting change in PHE to RN jobs, the national slope is used to avoid state variations in RN workforce responsiveness to health expenditures. Analysis of state correlations between RN jobs and PHE revealed that change in PHE translates to larger change in RN demand than represented by the national slope, which also would increase shortage projections substantially. Moreover, RN jobs are increased by health care expenditures, regardless of care setting. Although the majority of RNs work in hospitals, ambulatory care settings, and nursing homes or extended care facilities (78% in 2008), 11 a large number are employed in a diverse range of environments including public health and government settings, nursing education, school health agencies, and pharmaceutical and insurance-related organizations. 11 RN jobs in these environments likely will be affected by the change in PHE to differing degrees. Another factor affecting this model is the use of 1999 PHE from CMS. There have been significant changes in the composition of PHE since 1999, including new technologies and the rising cost of medications, which may affect the relative cost between different age categories. 17 Some speculate that the cost of providing health care to the elderly will decrease substantially in coming years, as chronic disability in the elderly is declining. 37 This reduction in age-associated need for care could have an impact on future health care demand.
The supply model also has limitations. The primary assumption is that the national propensity of an individual to choose nursing as a career is the same across states in coming decades. This assumption does not address the range of socioeconomic factors that could influence career choices between different states or changes in the desirability of an RN career in coming years. Some models specifically ignore data older than 5 years, arguing that they are less pertinent and thus a poorer predictor of future RN labor dynamics. 38 There is some indication as well that propensity values are changing over time, especially in the age 35 to 44 and 45 to 54 categories (Figure 2). Steady increases in these categories may increase future supply estimates. Other factors that would influence propensity values are changes in RN wages, US immigration policy, and technology development. As health care providers seek to fill vacancies, propensity values likely will change.
One additional limitation that affects our models is the projection of shortage in terms of RN jobs estimates rather than FTEs. FTEs are used frequently in projection models to depict the workforce contribution of full-time and part-time RNs. This requires survey data regarding the number of full-time and part-time RNs in each state and in the United States as a whole—data not gathered by the BLS in their attempt to estimate RN jobs. As a result, no direct conversion exists. A crude comparison may be made using projected HRSA RN FTEs and RN jobs (~0.84FTEs/RN job) 12 ; however, lack of this metric limits comparability to other models. Alternatively, this could represent a unique strength of our model, in that by estimating shortage in terms of RN jobs our projections are directly comparable with the estimates gathered by the BLS, the primary federal agency that tracks the RN labor market.
Other models that incorporate age and population change in national RN and general populations forebode trends similar to those found in our article. HRSA produced RN demand and supply models in 2002. 12 In their demand model, population growth in 8 age categories was used to forecast health care utilization projections, whereas their supply model incorporated RN age as well as career attractiveness to youth. This model projected a workforce shortage of 1 016 900 FTE RNs in 2020. 12 Auerbach et al used birth cohorts and RN age to determine the likelihood that individuals would choose to work as a nurse and, using HRSA’s demand model, projected a shortage of 340 000 FTE RNs in 2020. 6 Unruh and Fottler defined demand as the number of FTE RNs required to serve future populations, with age and population growth being one of the primary factors considered. 8 In their supply model, they relied on employment patterns of the RN population reported by the National Sample Survey of Registered Nurses, which involved RN age. As with other models, they projected a shortage increase, reported as a growth percentage, of 29% from 2000 to 2020. 8
One item universally agreed on by all models,6,8,12,13 regardless of assumptions or end-state projected values, is that the RN shortage is increasing steadily throughout the nation and will reach epic proportions in years when RN services are in highest demand. This shortage of RNs will influence the delivery of health care, negatively affecting patient outcomes.39,40 Policy makers and stakeholders are encouraged to move forward with the development of concrete national strategies to reduce shortages in regions of greatest need. Short-term strategies include more efficient use of the current RN workforce and retention of older RNs. 23 The nation is in great need of long-term solutions to maximize educational potential on a national level, as well as to improve RN working conditions to increase workforce participation rates. Future studies should examine economical means of using resources to effectively bolster the supply of RNs in those states with the greatest projected shortages.
Footnotes
Acknowledgements
The authors thank Paul Feldstein, PhD, Deloras Jones, RN, Ian Hsiao, PhD, and Linda Bolton, RN, DrPH, FAAN, for their invaluable input into the production of this article.
The authors declared no potential conflicts of interest with respect to the research, authorship, and/or publication of this article.
The authors disclosed receipt of the following financial support for the research, authorship, and/or publication of this article: This study was supported in part by a grant from the California Institute for Nursing & Health Care and the US Department of Veterans Affairs Rehabilitation Research and Development Service Merit Review Award. Mr Juraschek is funded by an NIH/NHLBI T32HL007024 Cardiovascular Epidemiology Training Grant.