
Abstract
Central line–associated bloodstream infection (CLABSI) rates are an important measure of health care quality. However, reputational or financial risks associated with public reporting and disclosure of hospital CLABSI rates may introduce reporting biases, including intentional underreporting. To assess systematic case misclassification of CLABSI to secondary bloodstream infection (BSI; ie, intentional underreporting of CLABSI), the authors assessed data reported to the National Healthcare Safety Network by hospitals in Pennsylvania, the only state in which both CLABSI and secondary BSI reporting are mandatory. CLABSI rates decreased over the 2-year analysis period, but the authors found no evidence of increasing secondary BSI rates, suggesting that systematic case misclassification is not widespread.
Keywords
Central line–associated bloodstream infection (CLABSI) rates are an important measure of health care quality. Consequent to state mandates, CLABSI is the health care–associated infection (HAI) subject to the largest number of public reporting mandates, 1 and CLABSI reporting via the Centers for Disease Control and Prevention National Healthcare Safety Network (NHSN) is required for participation in the Centers for Medicare and Medicaid Services Hospital Inpatient Quality Reporting Program. 2 Declines in NHSN-defined CLABSI incidence rates have been reported nationally and over several years.3,4 However, in the era of public reporting and disclosure of HAI data, questions regarding the validity of data self-reported by hospitals to NHSN, used for both facility-specific comparisons and evaluation of surveillance trends, have been raised. 5 One such concern is whether the observed decreases in the incidence of CLABSI3,4 may be the result of hospital staff misclassifying CLABSIs as secondary bloodstream infections (BSIs; ie, underreporting of CLABSI) because, in most instances, the latter are not subject to HAI reporting mandates.
The Pennsylvania Health Care–Associated Infection Prevention and Control Act (Act 52), signed into law in 2007, requires all hospitals to report all inpatient HAIs included in the Patient Safety Component (including secondary BSIs) to NHSN; reporting began in February 2008. 6 The objective of this study was to look for evidence of systematic case misclassification by comparing CLABSI and secondary BSI rates in Pennsylvania hospitals during 2 full years of state-mandated HAI reporting; Pennsylvania is the only state in which both CLABSI and secondary BSI reporting are mandatory. The authors sought to identify whether secondary BSI rates had increased in inpatient care locations where CLABSI rates decreased.
Methods
Data from Pennsylvania acute care hospitals reported to the NHSN were used to calculate inpatient care location-specific CLABSI incidence rates per 1000 central line days (CLDs) and secondary BSI incidence rates per 1000 patient days (PTDs) for two 1-year periods (year 1, July 2008-June 2009; year 2, July 2009-June 2010). Inpatient care locations that reported both CLABSI and secondary BSI numerator and denominator data (CLD and PTD) throughout the 2-year period and those that reported ≥100 CLDs during year 1 and year 2 were included. Neonatal intensive care and specialty care area inpatient care locations were excluded from analysis.
The median and distribution of inpatient care location-specific rates were compared to identify changes in reported CLABSI and secondary BSI incidence for years 1 and 2. To determine if the change in secondary BSI rates from year 1 to year 2 differed for inpatient care locations that had either an increase or decrease in their CLABSI rates, they were grouped into 1 of 3 mutually exclusive categories: increase, decrease, or no change in CLABSI rate. The median and distribution of the change in secondary BSI rates for locations with an increase or decrease in their CLABSI rates were then compared with one another. Finally, the authors assessed if there was any correlation between the change in CLABSI rate and change in secondary BSI rate for locations from year 1 to year 2.
The median and distribution of rates were compared using the Wilcoxon rank sum and Kuiper tests, and correlation was assessed using the Spearman’s rank correlation coefficient (rs) and 95% confidence interval (CI). All tests were 2 sided, and P values <.05 were considered statistically significant.
Results
Data from 975 patient care locations reported by 165 Pennsylvania hospitals were included in the analysis, including 625 (64%) inpatient wards, 264 (27%) critical care units, and 86 (9%) step-down units. From year 1 to year 2, there was a significant decrease in the median CLABSI rate and change in the distribution of CLABSI rates but no change in the median or distribution of secondary BSI rates (Table 1). The 3 major primary infection types responsible for secondary BSIs over the 2 years were surgical site infection (28%), catheter-associated urinary tract infection (16%), and gastrointestinal infection (15%). There was no change in primary infection types reported for secondary BSIs from year 1 to year 2 (χ2 P = .624).
CLABSI and Secondary BSI Rates Reported for 975 Inpatient Care Locations by 165 Pennsylvania Hospitals to the National Healthcare Safety Network, July 2008 to June 2010
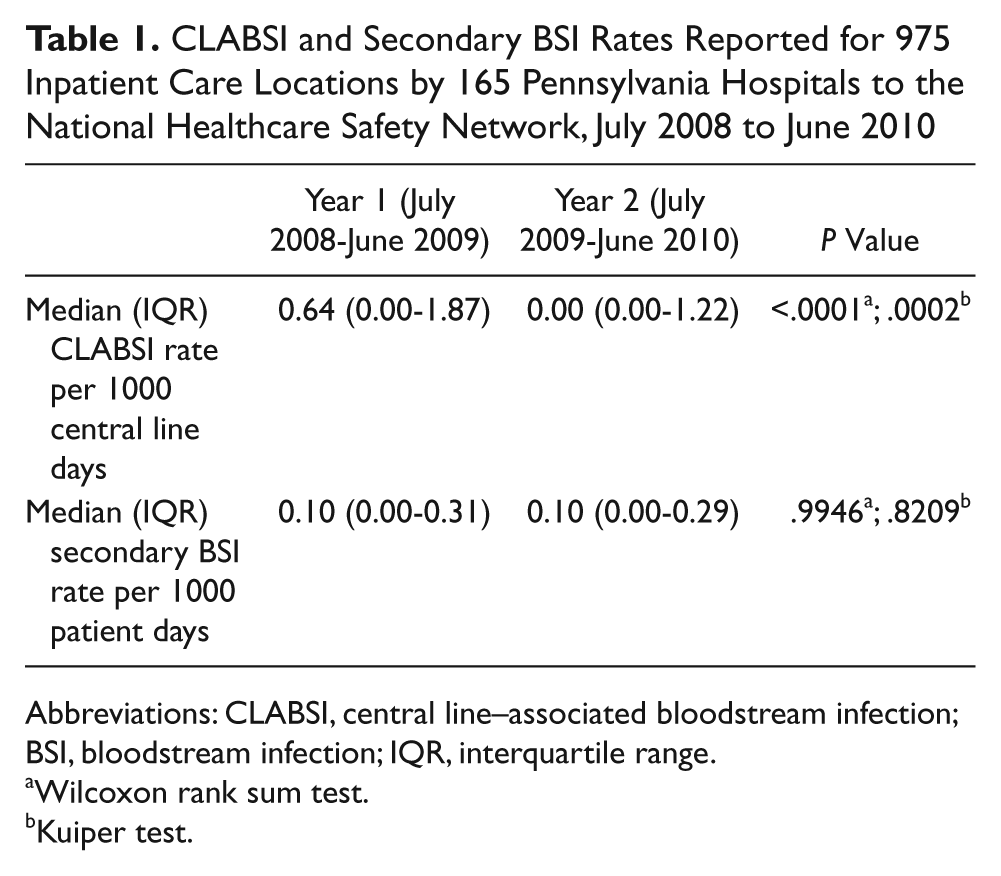
Abbreviations: CLABSI, central line–associated bloodstream infection; BSI, bloodstream infection; IQR, interquartile range.
Wilcoxon rank sum test.
Kuiper test.
From year 1 to year 2, a total of 260 patient care locations had an increase in their reported CLABSI rate, 416 had a decrease, and 299 had no change. The median and distribution of the change in secondary BSI rates (Figure 1) from year 1 to year 2 were no different (Wilcoxon rank sum P = .6438; Kuiper P = .9216) when comparing locations that had an increase with those that had a decrease in CLABSI rates. Furthermore, no correlation was found between the change in CLABSI and change in secondary BSI rates from year 1 to year 2 (r s = −0.01 [95% CI = −0.08 to 0.05; P = .6480]).
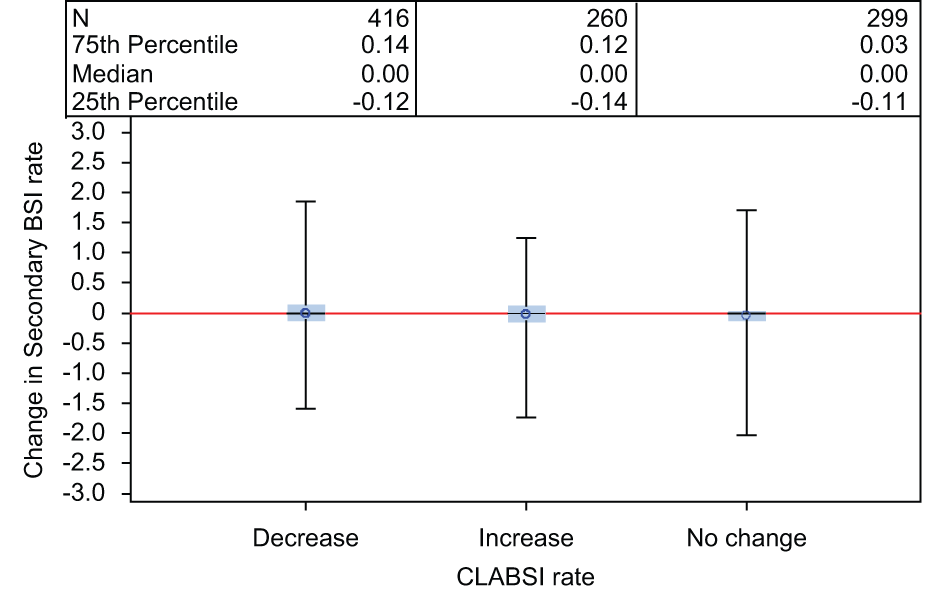
Distribution of the change in secondary bloodstream infection (BSI) rates per 1000 patient days for locations that had an increase, decrease, or no change in central line–associated bloodstream infection (CLABSI) rate; data are reported for 975 inpatient care locations by 165 Pennsylvania hospitals to the National Healthcare Safety Network, July 2008 to June 2010
Discussion
Mandatory reporting of comprehensive HAI data from Pennsylvania provided a unique opportunity to evaluate 2 full years of both CLABSI and secondary BSI incidence rate data from a large number of hospitals and patient locations. We found that whereas CLABSI rates per 1000 CLD had decreased over the 2-year period, secondary BSI rates per 1000 PTD in the same locations over the same time period remained stable. The median and distribution of the change in secondary BSI rates did not differ for locations that experienced an increase or decrease in their CLABSI rates. Furthermore, we did not find evidence of a negative correlation between the change in CLABSI and secondary BSI rates from year 1 to year 2. That is, we found no evidence of an increase in secondary BSI rates to suggest that concurrent decreases in CLABSI rates were a result of misclassification of CLABSIs as secondary BSIs.
Although there may be inherent biases related to public reporting7,8 and, thus, value in exploring whether reported trends are real or influenced by artifact, our study suggests that systematic misclassification of CLABSIs as secondary BSIs likely did not play a significant role in the observed decreases in CLABSI incidence nationally. Decreases in CLABSI incidence have been reported over the long term 1 with contemporaneous, widespread adoption of effective CLABSI prevention measures likely contributing.9,10
There are several limitations to consider. First, we did not include data from all patient locations in our analysis. Neonatal intensive care units and specialty care areas (eg, solid organ or bone marrow transplant and hematology/oncology) were excluded because of differences in the calculation of CLABSI rates for these locations (eg, stratification by birth weight categories and line type). Second, patient care locations with small numbers of CLDs (<100 per year) were excluded, although their total number of CLABSIs and secondary BSIs reported are unlikely to influence our overall findings. Third, although CLABSI reporting mandates are common, Pennsylvania is unique in that reporting of all HAIs in the NHSN Patient Safety Component is required. Therefore, there may be fewer incentives to misclassify CLABSIs as secondary BSIs in Pennsylvania hospitals. This is likely minimized because although the total number of BSIs is publicly disclosed at the facility level, only CLABSIs are used for facility-to-facility benchmarking. 4 Finally, this analysis is based on data grouped at the location level and not at the patient level. No individual patient medical records were reviewed as part of this ecological analysis of case misclassification. As with all ecological study designs, our results are subject to potential bias related to the ecological fallacy. 11
The Pennsylvania Department of Health is actively engaged in validation of HAI data reported to NHSN, including BSIs. This includes manual review of selected patient charts to validate data reported by hospitals to NHSN. Such efforts are an integral part of the process of determining the accuracy and completeness of publicly reported data, in addition to providing opportunities for reporting hospitals to receive education and valuable feedback on the surveillance process. 1
We found no evidence of concomitant increases in secondary BSI rates among Pennsylvania hospital locations that experienced a decrease in CLABSI rates over the 2-year period, suggesting that intentional CLABSI case misclassification is not widespread in this state. As decreases in CLABSI incidence within Pennsylvania are similar to those reported nationally,3,4,6 these findings help build confidence that reporting trends in CLABSI incidence nationally are reflective of actual experience. However, additional efforts to validate data reported to NHSN are important to further evaluate the degree of case misclassification and generalize our findings.
Footnotes
Acknowledgements
We acknowledge the work of Kim Buffington, Will Cramer, and the Pennsylvania hospital staff engaged in surveillance activities and reporting of data to the National Healthcare Safety Network. The findings and conclusions in this presentation are those of the authors and do not necessarily represent the views of the Centers for Disease Control and Prevention.
Authors’ Note
A preliminary version of data included in this manuscript was presented as an abstract at the Society for Healthcare Epidemiologists of America annual meeting in Dallas, TX, April 3, 2011.
Declaration of Conflicting Interests
The authors disclosed no conflicts of interest with regard to the research, authorship, and/or publication of this article.
Funding
The authors disclosed that no funding was received for the research, authorship, and/or publication of this article.