
Abstract
Many early warning models for hospitalized patients use variables measured on admission to the hospital ward; few have been rigorously derived and validated. The objective was to create and validate a clinical deterioration prediction tool using routinely collected clinical and nursing measurements. Multivariate regression analysis was used to determine clinical variables statistically associated with clinical deterioration; subsequently, the model tool was retrospectively validated using a different cohort of medical inpatients. The Braden Scale (P = .01; odds ratio [OR] = 0.91; confidence interval [CI] = 0.84-0.98), respiratory rate (P < .01; OR = 1.08; CI = 1.04-1.13), oxygen saturation (P < .01; OR = 0.97; CI = 0.96-0.99), and shock index (P < .01; OR = 2.37; CI = 1.14-3.98) were predictive of clinical deterioration 2-12 hours in the future. When applied to the validation cohort, the tool demonstrated fair concordance with actual outcomes. This tool created using routinely collected clinical measurements can serve as a very early warning system for hospitalized medical patients.
The Agency for Healthcare Research and Quality defines failure to rescue as failure to prevent a clinically important event that results from complications of underlying illness or medical care. Failure to rescue may reflect either the quality of patient monitoring or the quality of response to a complication of illness or medical care that results in cardiopulmonary arrest, unplanned transfers to a higher level of care, or unexpected death. 1 The Institute for Healthcare Improvement recommends implementing rapid response teams (RRTs) to decrease hospital mortality rates by bringing critical care expertise to the unstable patient’s bedside for rapid treatment and avoidance of serious events. 2 Although individual institutions have reported improved outcomes,3-5 2 recent meta-analyses found that either the impact of RRTs on patient outcomes remains unproven because of poor methodology, 6 or despite decreasing cardiac arrests in some hospitals, mortality is not affected. 7 RRT activation may occur too late, after the patient’s condition has deteriorated for several hours. 8
To identify non–intensive care unit (ICU) medical patients at risk of clinical deterioration, early warning scores (known as “track and trigger” in the United Kingdom) were developed. Smith et al9,10 systematically reviewed and tested early warning systems that used either 1 clinical parameter or an aggregate weighted score from the admission vital signs to predict hospital mortality. They concluded that both models need further work to improve accuracy.
Many early warning scores are not designed as continuous point-of-care or real-time tools but use only variables measured on admission to the hospital ward. Also, most are based on clinical variables and cut points that are intuitive rather than rigorously derived and validated. 11 The objective of the current study was to develop and validate a point-of-care tool using variables derived from regression analysis to predict the probability of clinical deterioration in unmonitored medical patients at any time during the hospital stay. The authors chose to study routinely measured vital signs, mean arterial pressure (MAP), arterial oxygen saturation by pulse oximetry, the Braden Scale for predicting pressure ulcer risk, 12 and the Hendrich II Fall Risk score. 13 No laboratory measures were included because not all patients have laboratory results immediately performed or available with the first set of vital signs. To the authors’ knowledge, this is the first attempt to create a clinical deterioration prediction tool using statistically selected routine clinical and nursing measurements to predict clinical deterioration in real time, with every entry, throughout the hospital stay for this patient population.
Methods
This retrospective case-control and cohort chart review study was deemed exempt by the Mayo Clinic Rochester Institutional Review Board and carried out at an 1157-bed, academic, tertiary referral hospital located in Olmsted County, Minnesota. It was funded through an internal grant. Data were obtained for calendar years 2008 and 2009 from Mayo Clinic Life Sciences System, an electronic data warehouse.
Patient Selection
Patients admitted to the hospitalist care teams served as the study population. The hospitalist care teams are geographically organized within the hospital on 4 medical units and staffed by hospitalist physicians and midlevel providers. Patients were included if they were admitted from the emergency department, were direct admissions from the outpatient multidisciplinary clinic, or were transfers from other hospital non-ICU units. Patients were excluded if they were <18 years of age, were receiving comfort or hospice care on admission, had refused research participation, were transferred from an ICU or telemetry bed, or had an event, defined as an unplanned ICU transfer, unexpected death, or RRT call within 2 hours of hospital admission. For patients who had multiple hospitalist care team admissions, the first admission of the calendar year was used in the analysis. Patients with events were defined as cases. Their data were collected from time of arrival on the hospital unit until 2 hours prior to an event. For those who had multiple events, data up to 2 hours before the first event were collected. The 2-hour cutoff was selected as the minimum time frame during which interventions in a patient at risk could be expected to take effect, should the tool become clinically feasible. Patients without events were considered controls and had data collected from time of arrival on the hospital unit until time of discharge from the hospital.
RRT activation criteria include the following: staff member is worried about the patient; acute and persistent declining oxygen saturations <90%; acute and persistent change in heart rate (HR) <40 or >130 beats per minute; acute and persistent change in systolic blood pressure (SBP) <90 mm Hg; acute and persistent change in respiratory rate <10 or >28 breaths per minute; acute chest pain suggestive of ischemia; acute and persistent change in conscious state, including agitated delirium; or new onset of symptoms suggestive of stroke.
Events were identified from the ICU database, administrative data, Morbidity and Mortality Review Group records, and the RRT committee records. The principal investigator (LLK) reviewed patient records for compliance with inclusion and exclusion criteria.
Clinical Variables Studied
The study variables were SBP and diastolic blood pressure (DBP), MAP, HR, shock index (HR/SBP), respiratory rate, temperature, arterial oxygen saturation by pulse oximetry (SaO2), Braden Scale, and Hendrich II Fall Risk score. Laboratory values, urine output, radiographic images, and medications were not studied.
To eliminate obvious errors in data entry, each variable was defined by a wide but clinically relevant range: MAP = 40 to 150 mm Hg; SaO2 = 50% to 100%; DBP = 0 to 250 mm Hg; SBP = 0 to 300 mm Hg; HR = 0 to 350 beats/min; shock index = 0 to 10; respiratory rate = 0 to 60 breaths/min; temperature 30°C to 43°C or 86°F to 109°F; Fall risk score 0 to 16; and Braden skin score 6 to 20. Any variable outside these limits was excluded from analysis. The end point was a serious clinical event occurring within 2 to 12 hours after variable entry.
Model Development
Using these variables and the known patient outcome, a time-dependent data set was developed to model looking forward in time for a serious clinical event. Lead times were divided into 2 to 12 hours, 12 to 24 hours, or 24 to 48 hours prior to an event. Using serial measurements over 24 hours and 7 days prior to the event, each variable’s mean, its slope of change, and its mean square error were analyzed for any significant association with events. Variables also were analyzed as individual sets of the 10 measurements for association with events, starting with the admission values and continuing until event or discharge.
The database of clinical variables and events was organized as a SAS 14 data set. Each entry of each variable was stamped for date and time of entry into the patient’s chart. The initial set of vital signs, Braden Scale, and Hendrich II score taken on arrival in the nursing unit were entered in the first row of the data set. Each row contained the 10 variables and an event outcome (event or no event). Subsequently, each time any variables were documented in the patient’s chart, the information was placed in the next row. The last documented measurement of a variable was brought forward to complete the row.
Derivation of the Clinical Deterioration Prediction Tool
The derivation group was drawn from the eligible patient cohort admitted to hospitalist care teams during calendar year 2008. The matched case-control method was used to minimize confounding factors and focus only on the selected clinical variables. Three controls were matched to 1 case by age within 10 years, sex, admitting hospitalist care team, admission source (emergency department, outpatient clinic, and interhospital transfer), and admission diagnosis or symptom grouped by International Classification of Diseases, Ninth Revision code. A receiver operating characteristic (ROC) curve was constructed to assess concordance with actual events. 15
Validation of the Clinical Deterioration Prediction Tool
The cohort used to validate the tool included all eligible patients admitted by hospitalist care teams for calendar year 2009, using the same inclusion and exclusion criteria and definitions of cases and controls as the derivation group. All eligible patients from 2009 were included in the analysis. As with the derivation group, the clinical deterioration prediction tool was applied to the validation cohort to assess predictive ability each time any of the significant variables was documented. A final ROC curve was then constructed.
Statistical Analysis
Because there were multiple measurements per patient, generalized estimating equations (GEEs) 16 were used to analyze the data. To identify nonlinear associations, generalized additive models using a cubic spline were used to fit the data. The resulting plots showed threshold values when the relationship between the clinical variables and the event variable changed.
Using logistic regression with the aforementioned GEE approach, univariate analyses were conducted to assess the association of each vital sign with the outcome. The multivariate logistic regression model was developed by first including all variables that were significant in the univariate analysis at a level of .05 and then eliminating the nonsignificant variables one at a time until all variables remaining in the model were significant at P < .05. The analysis was unconditional; that is, matching strata were not used in the analysis to estimate an intercept term. This was necessary to calculate a predicted probability of an event.
The patient’s clinical deterioration risk score was calculated for every row of data using the regression coefficients in the final model. For ease of clinical interpretation, the patient’s clinical deterioration risk probability predictions were calculated from every risk score using the inverse logit transformation equation, where P is the probability of an event in the subsequent 2 to 12 hours:

The SAS/STAT software (version 9.1; SAS Institute Inc, Cary, NC) GENMOD procedure was used to perform the GEE analysis by specifying a logistic link function for the binary outcome, a statement for the clustering (patient) factor, and an exchangeable correlation structure for the working correlation matrix. Only the empirical standard errors were used for hypothesis testing.
The derivation group’s ROC curves were developed by calculating each patient’s predicted probability and then tabulating the true positive and true negative rates at each probability value. The resulting true positive rate was plotted against the corresponding false positive rate, resulting in a final ROC curve, allowing calculation of the area under the curve (AUC).
Results
The derivation cohort consisted of 1882 eligible patients. Among them, 68 suffered events; these patients were matched to up to 3 eligible control patients, resulting in 267 patients as the derivation group. The validation cohort consisted of 1946 eligible patients, 77 of whom suffered events, with 1869 control patients.
Study Group Characteristics
Table 1 describes the characteristics of the derivation and validation groups. All derivation cases had at least 2 matching controls. Both populations consisted of patients older than 50 years of age, averaging more than 65 years. In the derivation group, 38% of patients were female, compared with more than half in the validation group. Controls had longer study times because they were studied from admission to discharge. By definition, controls had no events. RRT activation was the most common event in the cases, and there were very few deaths in either group. Although not all RRT activations resulted in ICU transfer, none occurred without appropriate criteria.
Patient Characteristics a
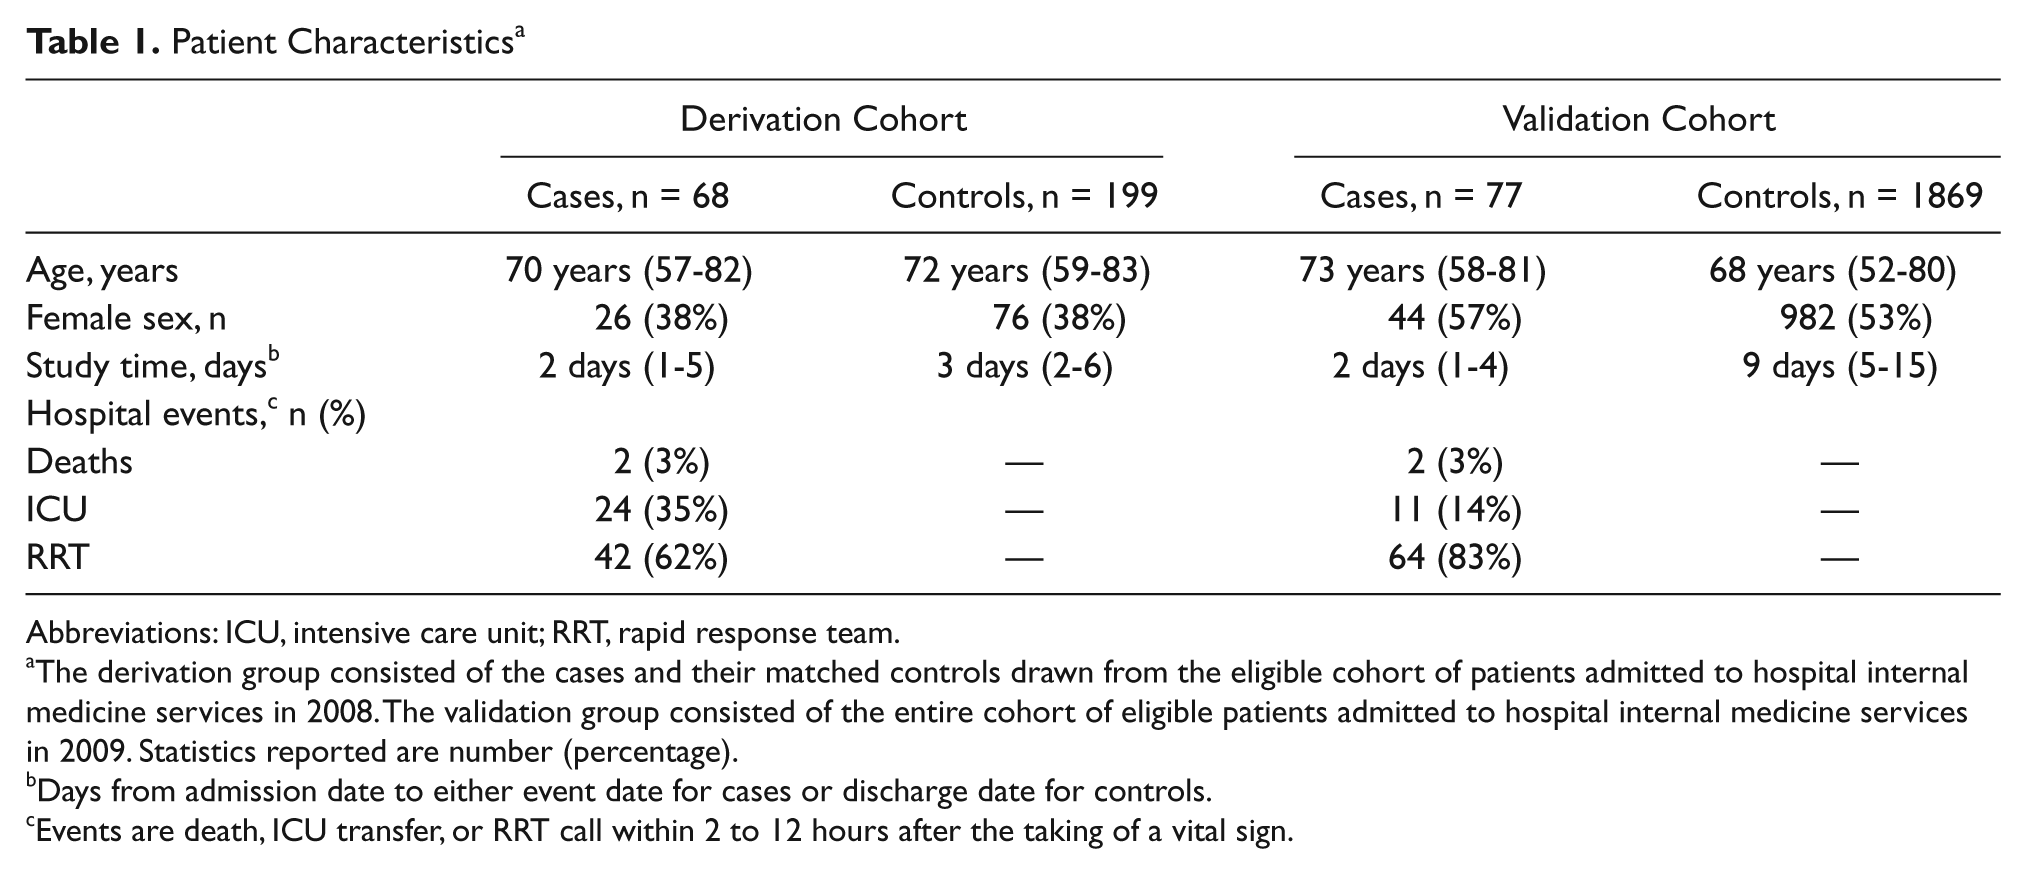
Abbreviations: ICU, intensive care unit; RRT, rapid response team.
The derivation group consisted of the cases and their matched controls drawn from the eligible cohort of patients admitted to hospital internal medicine services in 2008. The validation group consisted of the entire cohort of eligible patients admitted to hospital internal medicine services in 2009. Statistics reported are number (percentage).
Days from admission date to either event date for cases or discharge date for controls.
Events are death, ICU transfer, or RRT call within 2 to 12 hours after the taking of a vital sign.
Model Selection
Although several models appeared promising, the model using single-entry variable measurements was chosen because it required the least amount of time and data to provide a prediction. A lead time of 2 to 12 hours rovided the best accuracy of prediction for that model (Table 2). The univariate and multivariate analyses were conducted on this model alone.
c Statistics of Prediction Models a
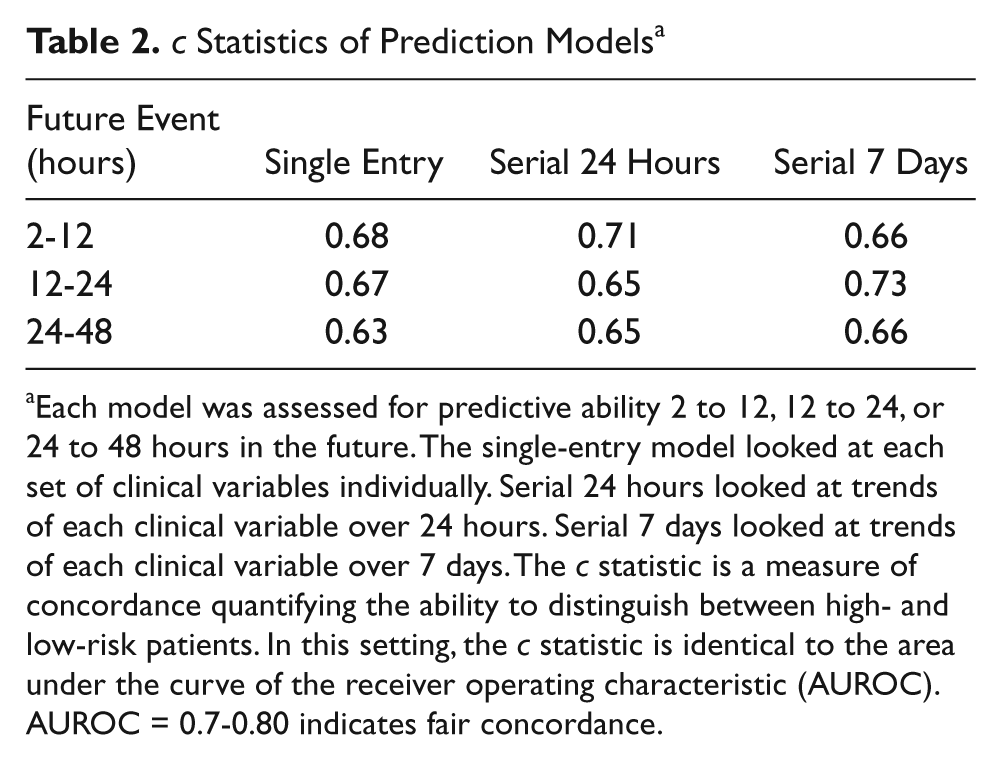
Each model was assessed for predictive ability 2 to 12, 12 to 24, or 24 to 48 hours in the future. The single-entry model looked at each set of clinical variables individually. Serial 24 hours looked at trends of each clinical variable over 24 hours. Serial 7 days looked at trends of each clinical variable over 7 days. The c statistic is a measure of concordance quantifying the ability to distinguish between high- and low-risk patients. In this setting, the c statistic is identical to the area under the curve of the receiver operating characteristic (AUROC). AUROC = 0.7-0.80 indicates fair concordance.
Derivation of the Clinical Deterioration Prediction Tool
Univariate analysis showed Braden Scale, HR, respiratory rate, temperature, SaO2, and shock index to be statistically significant (Table 3).
Univariate and Final Multivariate Analyses of Clinical Variables a
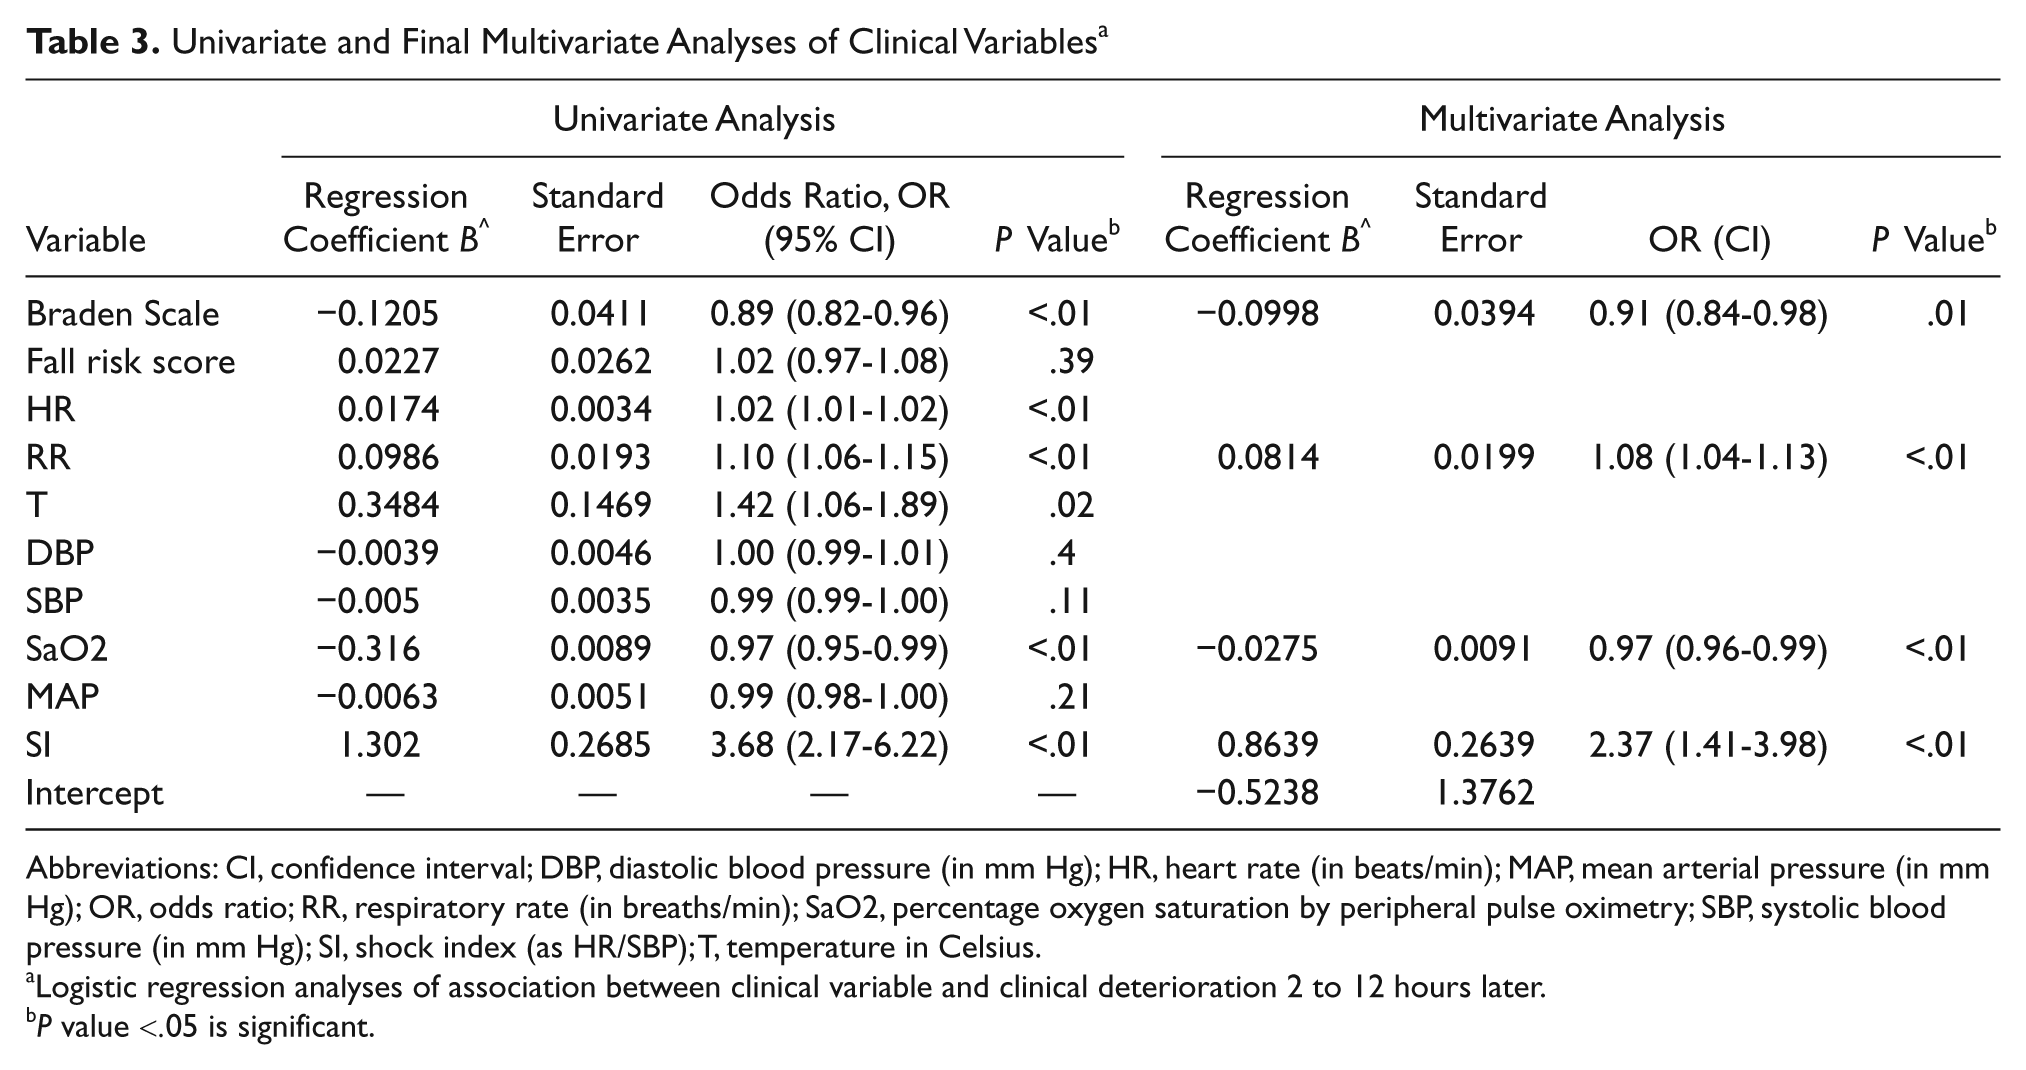
Abbreviations: CI, confidence interval; DBP, diastolic blood pressure (in mm Hg); HR, heart rate (in beats/min); MAP, mean arterial pressure (in mm Hg); OR, odds ratio; RR, respiratory rate (in breaths/min); SaO2, percentage oxygen saturation by peripheral pulse oximetry; SBP, systolic blood pressure (in mm Hg); SI, shock index (as HR/SBP); T, temperature in Celsius.
Logistic regression analyses of association between clinical variable and clinical deterioration 2 to 12 hours later.
P value <.05 is significant.
The final multivariate regression analysis (Table 3) demonstrated that the Braden Scale, respiratory rate, SaO2, and shock index were independently associated with events. HR and temperature were eliminated from the final model, although HR was still represented via the shock index. The AUC was 0.69 (0.66-0.72).
Using the regression coefficients from the final multivariate analysis, the clinical deterioration risk score was calculated as follows:
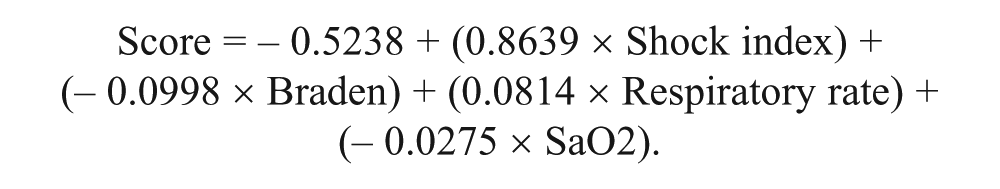
Clinical deterioration risk probability was calculated as above. No patient had a clinical deterioration risk probability greater than 50% in the derivation group. Table 4 illustrates the calculation of the risk score and probability using an example of a patient’s single-entry vital signs and Braden score.
Patient Example a
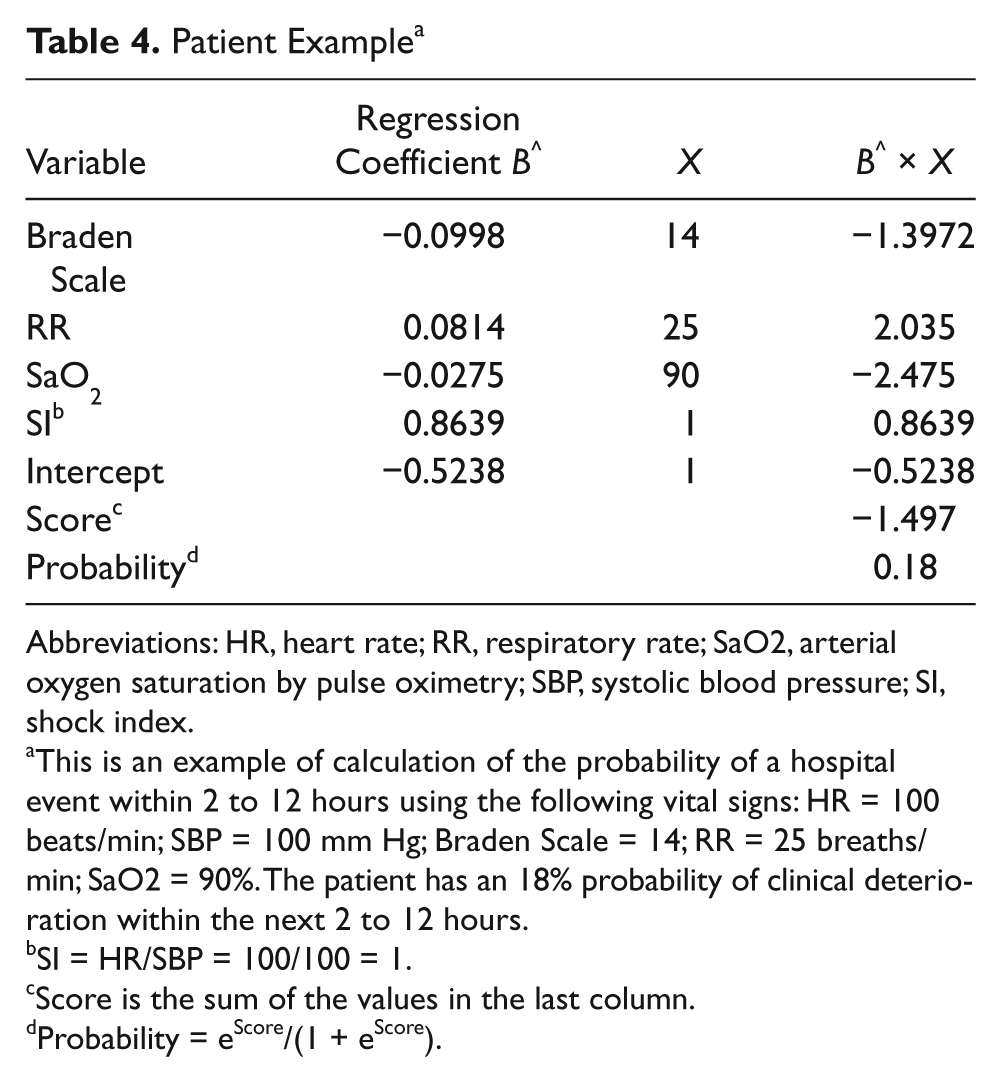
Abbreviations: HR, heart rate; RR, respiratory rate; SaO2, arterial oxygen saturation by pulse oximetry; SBP, systolic blood pressure; SI, shock index.
This is an example of calculation of the probability of a hospital event within 2 to 12 hours using the following vital signs: HR = 100 beats/min; SBP = 100 mm Hg; Braden Scale = 14; RR = 25 breaths/min; SaO2 = 90%. The patient has an 18% probability of clinical deterioration within the next 2 to 12 hours.
SI = HR/SBP = 100/100 = 1.
Score is the sum of the values in the last column.
Probability = eScore/(1 + eScore).
Validation of the Clinical Deterioration Prediction Tool
Figure 1 illustrates the ROC for the validation group; the AUC of 0.71 (0.68-0.74) indicated fair concordance of the tool with actual events, correctly identifying patients at risk of clinical deterioration within the next 2 to 12 hours.
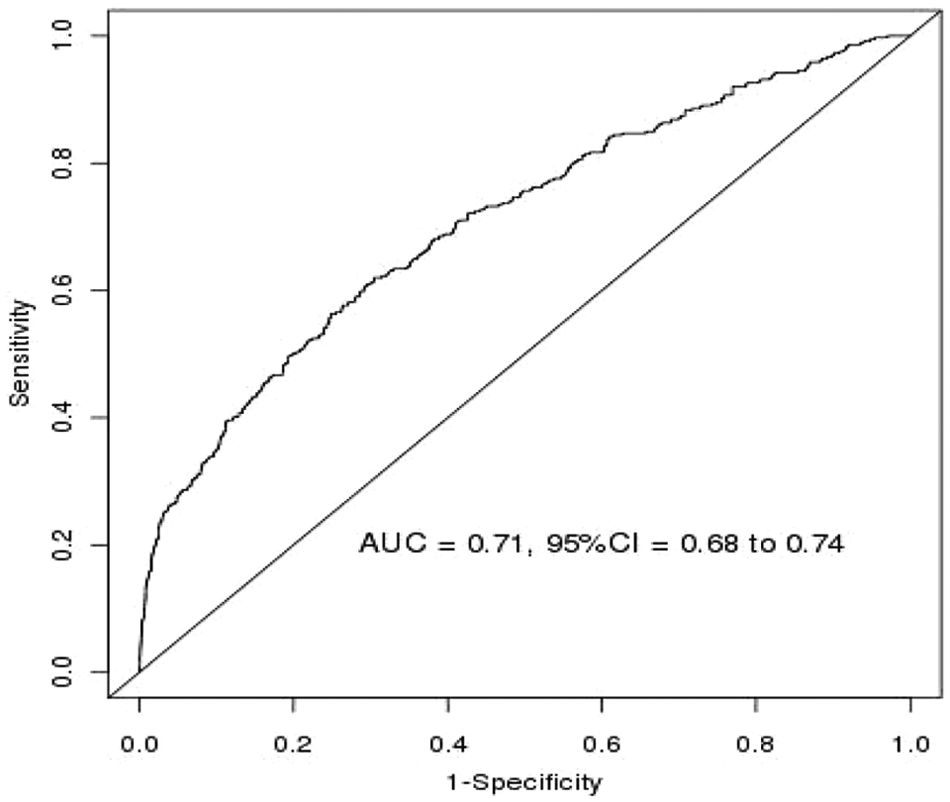
Receiver operating characteristic curve of the validation cohort illustrating discrimination of the tool in correctly identifying patients at risk of clinical deterioration in the next 2 to 12 hours
Discussion
Cuthbertson and Smith 11 recommend a structured scientific approach to developing early warning scoring systems. Rigorous scientific technique to determine the correct objective, routinely available measurements, and cutoff points with electronic data management appears necessary to create scoring systems with high diagnostic accuracy. We attempted to achieve this by creating a clinical deterioration prediction tool for unmonitored medical patients through analyzing routinely collected clinical variables for statistical association with future events. Using logistic regression, we found that shock index, respiratory rate, SaO2, and Braden Scale can be used for a patient to determine the probability of an event 2 to 12 hours in the future. The clinical deterioration prediction tool was subsequently validated using a different set of patients. Thus, this tool is capable of identifying a patient at risk at the point of care before clinical deterioration occurs. This tool is easy to work with and requires only 1 set of pertinent variables for probability calculation; yet it can be used at any time during a patient’s hospital stay. Processes to determine the correct cutoff point and other factors to improve performance of the tool are under way at our institution.
Clinicians often rely on changes or trends in vital signs or clinical assessments over time to alert them to deteriorating clinical status. In this study, we assessed changes in clinical variables over time using the slope of change of the actual measurements as well as the slope of change of their means and of the mean square error. We looked at these changes over the 24 hours and the 7 days prior to the event. We also looked at whether these changes over time could predict events roughly 2 to 12 hours, 12 to 24 hours, or 24 to 48 hours in the future. In fact, changes over time did predict events with fair concordance. Serial changes over the previous 24 hours best predicted events 2 to 12 hours in the future, and serial changes over 7 days best predicted events 12 to 24 hours in the future. However, despite the lower predictive ability, we elected to develop the tool based on single sets of variables because it required less information and provided a prediction starting with the first set of variables and continuing with every set thereafter. The resulting tool also had fair concordance with actual events. Perhaps a tool using the other models would have had better concordance, but the trade-off would be identifying fewer patients at risk.
Early warning scoring systems for medical patients that use intuitively derived variables have been described. The Worthing physiological scoring system (WPSS) is a risk score using analysis of the contribution of selected admission clinical variables to medical patients’ hospital mortality. 17 The modified Early Warning Score (MEWS) assigns scores to ranges of selected clinical variables measured twice daily in medical patients up to 5 days after admission. It was not applied to direct admissions from clinics, interhospital transfers, or longer-stay patients. Routine nursing assessments that may contribute to predictive ability were not analyzed. 18 Thiel et al 19 developed an algorithm to predict the risk of septic shock, drawing on vital signs and laboratory results. Silke et al 20 used regression analysis to derive laboratory and clinical variables but only from admission and only to predict hospital mortality. Taressenko et al 21 chose heart and respiratory rate, SaO2, and SBP using continuous monitoring for 72 hours after admission to predict events. Vital signs were treated as abnormal if they were outside 2 standard deviations for a representative population. Our study differs from these examples in that it excluded laboratory results and imaging studies because these tests may not be performed on all medical patients; used routinely recorded and immediately accessible variables and statistically determined which of these was associated with events; did not assume normal ranges of vital signs; did not include monitored patients; included several outcomes to capture more events; and was designed to calculate probability in real time throughout the hospital stay using a simple calculation.
We chose not to include fraction of inspired oxygen (FiO2) as a study variable because actual inspired FiO2 on nasal cannula or facemask was unclear and documentation of the patient wearing the oxygen delivery device correctly was inconsistent. We included the Braden Scale and Hendrich II Fall Risk score because these nursing assessments evaluate clinical findings that are potentially important to patient outcomes. The Braden Scale 12 assesses sensory perception, patient mobility and activity, nutritional intake, skin moisture, and friction forces to determine the risk of pressure ulcer development. Patients with low Braden Scale scores may have significant underlying comorbidities that put them at risk for clinical deterioration. The Braden Scale’s negative regression coefficient reflects this in our tool. The Hendrich II Fall Risk Model 13 uses 8 parameters to identify patients at high risk of falls. Of these, confusion, dizziness, and impaired mobility may be associated with acute illness or deteriorating clinical status. However, the Hendrich II Fall Risk Model did not achieve statistical significance as a predictor in the univariate analysis.
We did not include urine output because this is not routinely recorded on our general wards. Although neurological function and pain scores are documented routinely in nursing assessments, these values were not included because they could not be accessed from the electronic data warehouse until recently. Inclusion of one or both of the latter 2 variables might have improved the tool’s accuracy.
In our study, the shock index had the highest odds ratio among the clinical variables. In the study by Keller et al, 22 a shock index ≥0.85 was significantly associated with unplanned transfer of medical patients to the ICU (P < .02). However, contrary to our study, the Keller et al study was not designed to show the predictive capabilities of the shock index for unplanned ICU admissions.
Weaknesses of this study are typical of those relying on vital signs. There is considerable variability in the frequency of vital sign recordings; hence, the GEE was used to compensate for multiple entries. Additionally, despite universal reliance on vital signs as indicators of patient condition, there is remarkably little evidence providing standardization with regard to frequency, parameters, equipment, and accuracy. 23
Using clinical information that is several hours old may not accurately reflect a patient’s current clinical status. In data rows in which a variable was missing, the most recent measurement recorded for that variable was brought forward for risk score calculation. However, an SaO2 recorded 8 hours earlier may not reflect the patient’s current oxygen saturation. Nevertheless, this study reflects real-world monitoring of vital signs, without an effort at control, and this methodology has been used by others in similar study situations. 24
As the derivation and validation groups were drawn from consecutive years, any changes in clinical practice could have introduced confounding factors. There were no institutional changes in method or frequency of vital sign measurement or in RRT or code blue criteria. It is possible that unit-specific changes in care may have been implemented. However, our tool’s accuracy actually improved slightly from one year to the next, indicating that it remained robust even with the possibility of changing medical practice.
Another limitation of this study is the relatively small number of cases. This limited the number of variables we could study. Hence we controlled for potentially confounding risk factors using matching. Matching strata were not used so that we could estimate an intercept term to be used to generate an event’s probability. The area under the ROC curve (AUROC) indicates whether a model is useful for outside application. Our tool’s AUROC is consistent with those found in the review by Smith et al 10 of aggregate weighted systems, in which no system demonstrated an AUROC >0.80. Tools with AUROCs between 0.70 and 0.79 were described as performing “reasonably well.” However, Smith et al studied the prediction of hospital mortality, whereas our tool predicts clinical deterioration. Targeting higher probability thresholds improves the positive predictive value at the expense of missing patients at risk and diminishing the tool’s utility as a surveillance mechanism. Relaxing the selection criteria from clinical significance was considered as a model; however, analysis indicated only slight improvement in the AUROC.
Determining comorbidities that are statistically associated with events may improve the tool’s performance. This is similar to Hackmann’s 2-tiered approach. 25 We are currently in the process of determining which comorbidities are statistically associated with events rather than studying those selected based on clinical suspicion alone.
The derivation and retrospective validation of this tool are only the first steps. The tool requires prospective validation in unmonitored medical patients. Additional future studies should include prospective validation of the tool in different patient populations and in multiple centers.
Conclusion
Our aim was to develop a clinical deterioration prediction tool for unmonitored medical patients by analyzing routinely collected clinical variables for statistical association with future events. We determined that shock index, respiratory rate, SaO2, and the Braden Scale could be used to calculate a patient’s probability of an event up to 12 hours in the future with reasonable accuracy. Refinements of this tool advanced by prospective study could serve as a very early warning system, moving rescue 1 or 2 steps before RRT activation, especially if combined with an electronic medical record and clinical decision support.
Footnotes
Declaration of Conflicting Interests
The authors declared no potential conflicts of interest with respect to the research, authorship, and/or publication of this article.
Funding
The authors disclosed receipt of the following financial support for the research, authorship, and/or publication of this article: Mayo Clinic Rochester Department of Medicine Innovation Award.